
Abstract
The ability to detect the ethanol rapidly and sensitively in ethanol–gasoline blends has become important in recent times, both for engine performance and for fuel economy. In order to achieve this, a deterministic methodology based on Raman spectroscopy is employed for quantitative estimation of ethanol in commercial ethanol–gasoline blends of fuel. The different concentrations of anhydrous ethanol were mixed with pure gasoline to calibrate the Raman spectroscopy measurement setup. The variation in the ratio of the heights of Raman peaks at wavenumbers ∼885 and 1005 cm–1 is found to be linear with the fractional volumes of ethanol and gasoline in the blends. Using this methodology, the volume percentage of ethanol in commercial gasoline is determined to be ∼10%. This methodology can also be adopted for detection of other additives/adulterants in commercial gasoline.
This is a visual representation of the abstract.
Introduction
There is a considerable interest worldwide to use ethanol produced from agricultural feedstocks, a renewable energy source, as an alternative fuel in compression-ignition engines. In internal combustion engines, the alcohols having carbon numbers 1 to 4, ethers, fusel oil, etc., are being used as fuels.1–3 Ethanol is used as an additive in gasoline fuel to increase the octane number, improve engine combustion, and also to reduce CO2 emissions.1,2 The Brazilian National Agency of Petroleum, Natural Gas, and Biofuels has regulated that the maximum allowed content of ethanol in commercial gasoline can be 27%. 4 For spark ignition applications, engines based on anhydrous ethanol–gasoline blends, with ethanol in volume ratios of up to ∼16% of gasoline can be used without making any changes in the engine. 5 According to the published reports, India achieved an average blending rate of 10% ethanol in gasoline in the year 2022. 6 However, the amount of ethanol in the fuel blend directly influences the performance of an engine and hence its quantitative determination in the blends is of vital importance. 7 Also a small change in the volume concentration of ethanol in the blend can have significant impact on the cost of the fuel. Hence, it is necessary to have an adequate methodology to accurately determine the percentage of ethanol in ethanol–gasoline blend.
Conventional standard methods for quantitative analysis of ethanol–gasoline blends include gas chromatography, 8 high–performance liquid chromatography, 9 etc. Although these methods give an accurate quantitative estimation, the sample preparation process is elaborate, complex, and time-consuming. Therefore, these methods are not suitable for rapid online analysis. In the past few years, spectroscopic techniques, such as Raman and near-infrared spectroscopy, have evolved significantly. 10 Compared to the other existing techniques, these spectroscopy-based techniques have the advantage of being non-invasive, having low sample volume demand, requiring minimal sample preparation, allowing rapid analysis and real-time or online detection. Both these vibrational spectroscopic techniques are sensitive and complimentary to each other and have been used by researchers to analyze the ethanol content in ethanol–gasoline blends or gasoline surrogates.10–12 Corsetti et al., 12 have used Raman and IR spectroscopy for quantitative estimation of ethanol and gasoline blends by analyzing the CH and OH stretching bands of ethanol and hydrocarbons lying in the spectral range ∼2800–3600 cm–1. Due to the availability of fiber coupled, compact, and portable Raman setups, Raman-spectroscopy-based analysis is considered to be more promising for field applications.
In the present work, we have performed Raman spectroscopy of prepared blends of anhydrous ethanol and gasoline, for quantitative estimation of ethanol in the blends. The spectral range ∼800–1050 cm–1, having the dominant and well-separated characteristic Raman peaks of ethanol and gasoline, have been investigated. For volumetric estimation of ethanol in the ethanol–gasoline blends, we have analyzed the variation in the ratio of intensities of Raman peaks at ∼885 cm–1 (due to C–C–O vibration of ethanol) and ∼1005 cm–1 (due to aromatic components in gasoline) with the fractional volume of ethanol in the blend. This generated a linear calibration curve for measurement of unknown volume ratio of ethanol in the blend of ethanol–gasoline. Our methodology, based on measurement of ratio of Raman peak intensities as function of fractional volume of ethanol in the blend, depends on the blend composition only, and is independent of the measurement setup. Hence, it eliminates the need for recalibration of the setup every time.
Experimental
Materials and Methods
For the experiments, the gasoline was procured directly from a refinery (Indian Oil Corporation Limited, India) having no added ethanol and dye. Anhydrous ethanol and methanol with purity of 99.99% were procured from Sigma Aldrich (India). The ethanol–gasoline blends with known concentrations of ethanol were prepared in the lab having ethanol concentration values as 0, 1, 5, 10, 20, 30, 50, and 100% of the volume. Similar blends were prepared for methanol estimation also. In addition, for finer analysis of ethanol content, samples with ethanol concentration in 10%–20% range (with increment in steps of 2%) were also prepared and analyzed. The commercial gasoline samples having ethanol and other impurities were brought from local vendors (in India).
Raman measurements were carried out using Horiba Jobin-Yvon LabRAM HR spectrometer using an excitation wavelength of 633 nm. The Raman spectra were recorded for the frequency shift range from 400 to 4000 cm–1 at the resolution of ∼1 cm–1 keeping integration time 15 s. Laser intensity was kept same for all the measurements. For the measurements, samples were kept in airtight quartz cuvettes and the measurements were done in back reflection geometry. All samples were stored at 5 °C in a refrigerator tightly packed in amber glass bottles before use.
Results and Discussion
The Raman spectra obtained of the ethanol–gasoline blends having different concentrations of ethanol are presented. The ethanol concentration in the blends is determined using ratio of intensities of Raman peaks at ∼885 cm–1 (due to ethanol) and ∼1005 cm–1 (due to gasoline) which varies with variation in ethanol concentration in the blend. Using this technique, the estimation of ethanol in commercial gasoline is also performed. Figures 1a–c show the Raman spectra of ethanol–gasoline obtained from refinery and the samples of ethanol–gasoline blends, respectively.

Raman spectra of (a) ethanol (EtOH), (b) gasoline, and (c) ethanol–gasoline blends with ethanol percentage as 0, 1, 5, 10, 12, 14, 16, 18, 20, 30, 50, and 100. (c) Well-separated Raman peaks at 885 cm–1 for ethanol and at 1005 cm–1 for gasoline.
In Figure 1a, among the major Raman peaks the characteristic peak of ethanol at ∼885 cm–1 is due to C–C–O skeleton symmetric stretching vibration. 13 Similarly in Figure 1b, characteristic Raman peak of gasoline at 1005 cm–1 is due to vibrations of aromatic hydrocarbons present in gasoline. As shown in Figure 1c, among all the peaks, ethanol peak at 885 cm–1 and gasoline peak at 1005 cm–1 are clearly noticeable and well resolved. Figure 2 shows part of spectrum near peak at 885 cm–1 as a function of volume percentage of ethanol in ethanol–gasoline blend. The inset in the figure shows the plot of peak intensity at 885 cm–1 as a function of volume percentage of ethanol in ethanol–gasoline blend. It can be seen that the peak height increases linearly with the volume of ethanol in the blend.
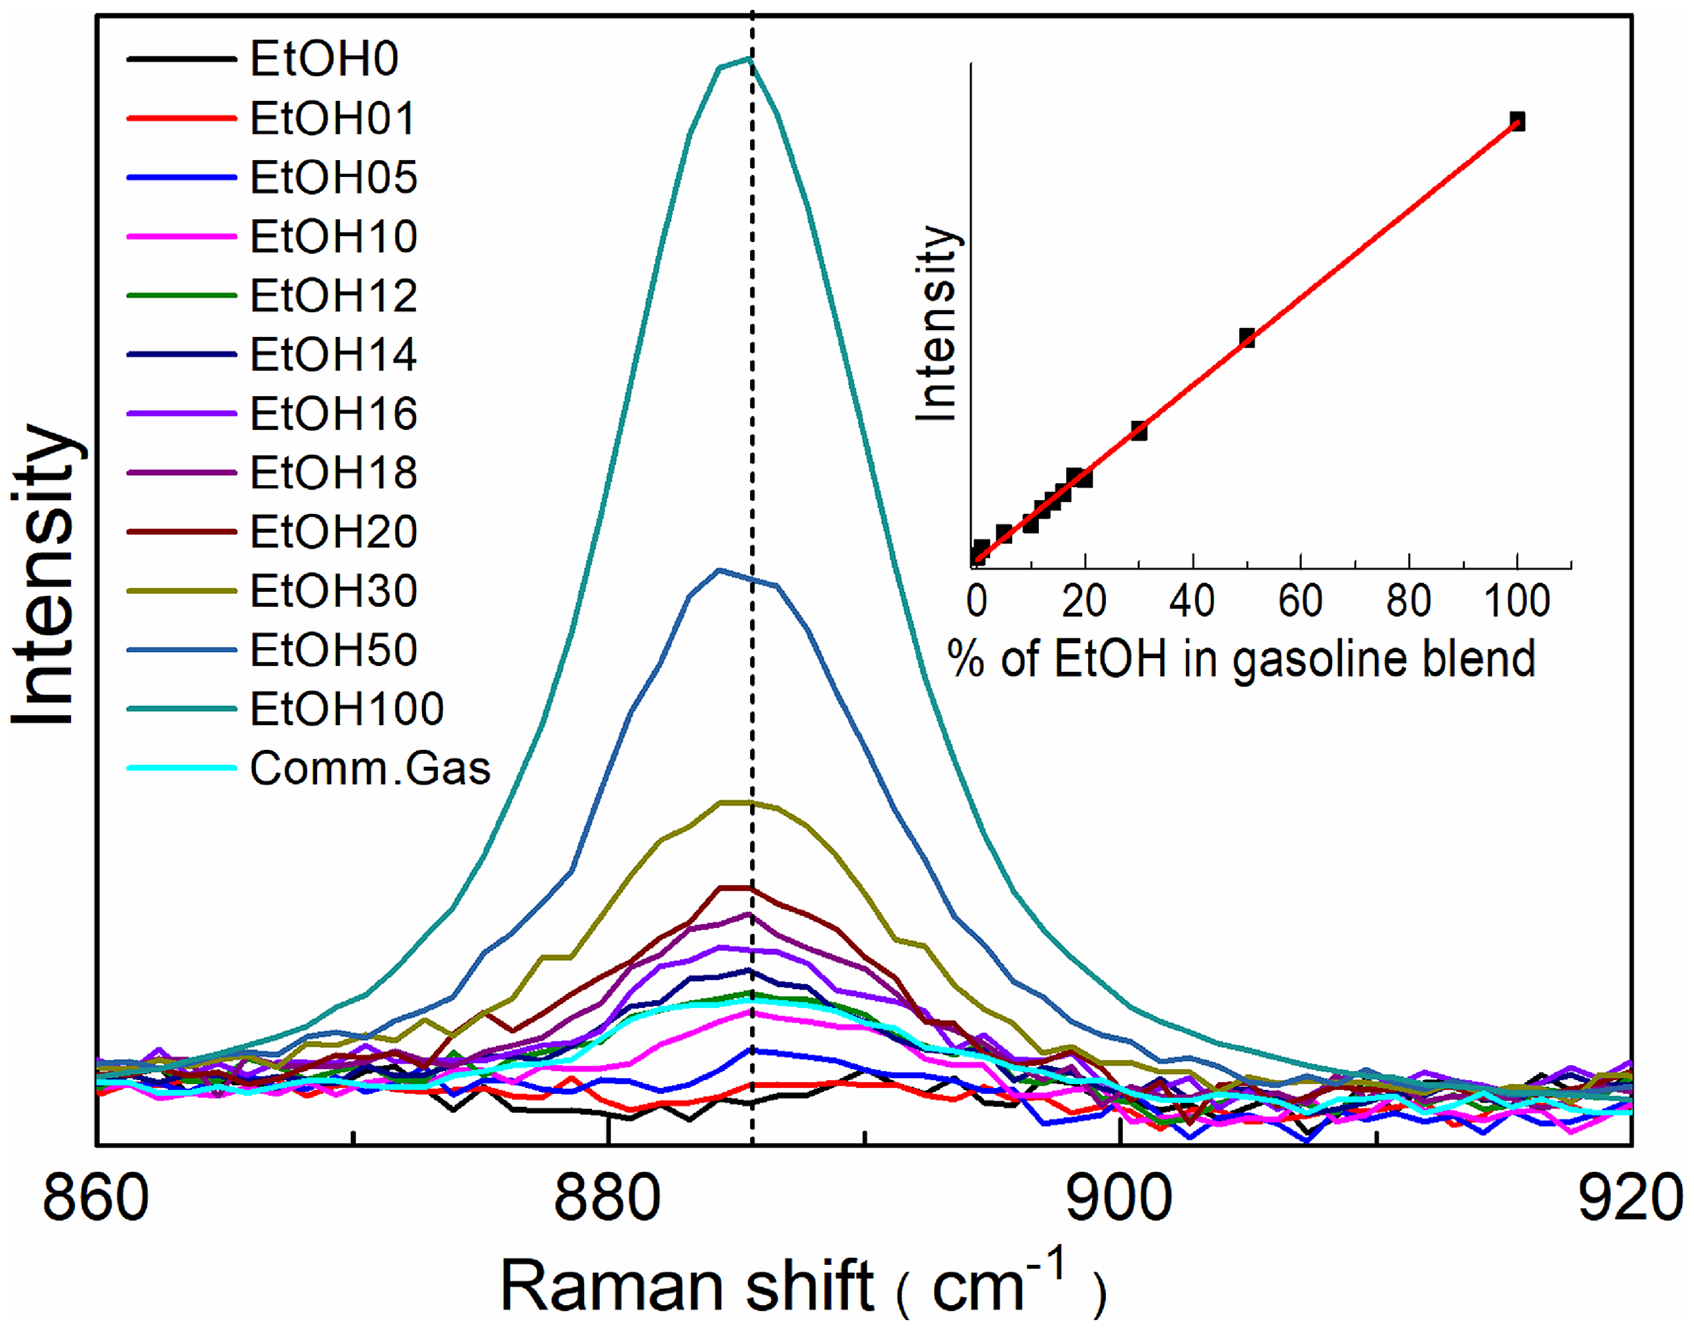
Plot of Raman peak intensity at 885 cm–1 at different ethanol (EtOH) volume percentages in the ethanol–gasoline blend. Spectrum of commercial gasoline is also shown. The inset shows the plot of peak intensity increase with volume percentage of ethanol in gasoline. The fit shows linearity with determination coefficient r2 = 0.998.
In a different work, 14 single Raman-peak-based spectroscopic analysis has been done for quantitative estimation of methanol in methanol–gasoline blends. However, this method for determining the alcohol concentration is dependent on the spectroscopy system being used and the other experimental parameters, e.g., laser power density, dark current, sample quality, etc., 15 because the analysis is based on measurement of intensity of single Raman peak. Thus, this method of quantitative estimation of ethanol may not ensure the accurate proportion of ethanol and gasoline in the blend. In order to overcome these complexities, it becomes essential to devise a more deterministic and system-independent methodology. We have used peak ratioing method as it would be independent of system parameters and sample quality.11,16 As shown in Figure 1, the Raman spectra of ethanol and gasoline have significantly different characteristic Raman peaks. The characteristic peak shifts of ethanol at 885 cm–1 and gasoline at 1005 cm–1 are clearly distinguishable and are well separated from each other. Raman spectra of blends with different concentrations of ethanol showing both these peaks (at ∼885 and ∼1005 cm–1) are shown in Figure 3a. Figure 3b shows that as the percentage of ethanol in the blends is increased, the increase in the intensity of peak at 885 cm–1 is accompanied by the decrease in the intensity of peak at 1005 cm–1. We have used intensity ratio of these two peaks to calibrate the concentration of ethanol in the blends. For all the samples investigated Raman spectroscopy data has been acquired for integration time of 15 s. It is evident from the measured spectra that for sufficiently low concentration of ethanol (≤ 5%), the signal-to-noise ratio (S/N) for spectral features of interest is low. However, for regulatory purposes, the ethanol blending percentage of the interest in gasoline is greater than 5%. The S/N for the two peaks (885 and 1005 cm–1) at these concentrations (>5%) of ethanol in gasoline is sufficiently good (S/N > 10).

(a) Observed variation in Raman spectrum by varying the percentage of ethanol in ethanol–gasoline blends. The spectra names are as per ethanol percentage, e.g., 5 and 16 indicate 5% and 16% ethanol, respectively. The Raman spectrum of commercial gasoline (Comm. Gas) is also shown. (b) The height of peaks at 885 and 1005 cm–1 are seen changing with change in ethanol percentage in the ethanol–gasoline blend.
If we plot the ratio of Raman intensity of ethanol (at 885 cm–1) to gasoline (at 1005 cm–1) as y, and the ratio of ethanol and gasoline volumes in the blend as x, as shown in Figure 4, we find that the plot is linear. Using this linear fitting curve, ethanol content in the commercial gasoline sample is determined to be ∼10%. The determination coefficient of linearity obtained is 0.995 with standard error of prediction (slope) calculated as 0.012. This shows a very good linearity in the studied range which is higher than the acceptance criteria (0.99) 17 This method of estimation of ethanol volume in the ethanol–gasoline blend would be independent of experimental parameters and would not require system recalibration. For further confirmation, ethanol concentration in gasoline samples was also analyzed using the ratio of the area under the spectral peaks 885 and 1005 cm–1 and the results were found to be closely similar to those obtained from peak-intensity analysis. Five commercial samples collected from different vendors were tested for the estimation of ethanol concentration in gasoline, however, similar results were obtained, and no significant background fluorescence was observed. Therefore, data of only one commercial sample is shown in Figure 3a. Local vendors do not claim any ethanol concentration in collected samples. As per the existing government guidelines, the maximum permissible concentration of ethanol in commercial gasoline is 10%.

Ratio of Raman intensity at 885 and 1005 cm–1, as function of ratio of ethanol and gasoline volumes. The fit has linear relationship: y = 0.015 + 0.915x with a determination coefficient r2 value of 0.995. Using this ethanol concentration in the commercial gasoline is determined as ∼10% shown as red cross (+) in the figure.
The Raman intensity ratio methodology discussed above can be extended for the estimation of the concentration of any other Raman active additive in the commercial gasoline. This can be illustrated by measuring the Raman spectra of the mixture of different proportions of methanol in gasoline. Figure 5a shows Raman spectra of methanol–gasoline blends having different volume percentages viz. 0, 5, 10, 20, 30, 50, and 100 of methanol. The characteristic Raman shifts of methanol and gasoline are observed at ∼1037 and ∼1005 cm–1, respectively. In Figure 5b, the variations in peak-intensity ratio of these modes stemming from methanol and gasoline in the mixture are plotted against the volume ratio of methanol and gasoline in the blend. A linear relationship is obtained between peak-intensity ratio and volume ratio with determination coefficient obtained as 0.997, as evident from Figure 5b. This demonstrates that the characteristic Raman shift of methanol ∼1037 cm–1 and that of gasoline at 1005 cm–1 can also be used to determine the volume proportion of methanol in a given sample of commercial gasoline.

(a) Raman spectra of various percentages of methanol blends in gasoline. (b) Linear relationship between Raman intensity ratio of peaks at 1037 and 1005 cm–1, and the relative volume of methanol in gasoline with an r2 value of 0.997.
Thus, this is a versatile methodology for detecting Raman active additives/adulterants in the commercial gasoline. In comparison to other conventional techniques, e.g., gas chromatography and high-performance liquid chromatography, which take considerable time (>30 min), the methodology presented in this work is expeditious, non-invasive, and can be successfully employed for on-site measurements. It is worth mentioning here that since the ethanol content determination is based on the peak-intensity ratios, the results of this work will not be different if Raman measurements (at 633 nm excitation) are performed on a different Raman set-up, be it a handheld instrument having broader spectral resolution. The present work has been performed using 633 nm laser excitation, which is not explored much, and the work also demonstrates that a hand-held Raman set-up with 633 nm laser can also be successfully employed for such measurements and their on-field applications. Furthermore, the peak-intensity ratioing method is more accurate and deterministic compared to absolute intensity measurement as reported by Anand et al. since it is independent of measuring system parameters, and therefore does not require regeneration of standard calibration curve for measuring the volume proportions of additives.
Conclusion
We have performed Raman spectroscopy of blends of anhydrous ethanol and pure gasoline collected from a refinery for generation of a standard calibration curve and hence quantitative estimation of ethanol in commercial gasoline. The characteristic Raman shift of C–C–O stretching of ethanol at ∼885 cm–1 and that of aromatic components of gasoline at ∼1005 cm–1, which are well-separated from each other, have been used for the quantitative estimation of volume proportion of ethanol in the commercial gasoline fuel blends. A linear relationship is obtained between the ratio of two Raman intensity peaks and the ratio of volumes of ethanol and gasoline. Using this linear calibration, ethanol percentage in the commercial gasoline sample is determined to be ∼10%. This method of estimation of ethanol volume in the ethanol–gasoline blend does not require system re-calibration. It has also been demonstrated that this peak ratioing method can be extended to the detection of other additives such as methanol in the commercial gasoline.
Footnotes
Acknowledgments
The authors thank Chandra Shekhar (LPAD, RRCAT) for his help during the experiments. Rajesh Kumar and Deb Kumar Rath gratefully acknowledge the Raman spectroscopy facility from SIC (IIT Indore) and the Department of Science and Technology (DST), Govt. of India for the grant under FIST scheme (Grant SR/FST/PSI-225/2016).