
Abstract
Raman spectroscopy is attractive for probing complex mixtures, but in many real samples strong fluorescence overwhelms the Raman bands needed for quantitative analysis. This work asks a practical question: under large and varying fluorescence, is it better to invest in hardware-based shifted excitation Raman difference spectroscopy (SERDS) or in preprocessing of conventional Raman spectra? We construct a simulation framework that generates more than 12 million spectra of benzophenone-alanine mixtures embedded in fluorescent matrices. Six datasets emulate realistic fluorescence behaviors, including constant backgrounds, photobleaching, random intensity fluctuations, and changes in fluorescence shape. For each scenario we form paired libraries of conventional Raman and SERDS spectra and build partial least squares regression models on (i) raw spectra containing fluorescence and (ii) spectra after asymmetric least squares or discrete wavelet transform background removal and normalization. Across most cases with stable or smoothly varying fluorescence, conventional Raman combined with suitable preprocessing matches or modestly exceeds SERDS in predicting mixture composition. SERDS provides a clear advantage only when fluorescence intensity or spectral shape fluctuates strongly and in an uncorrelated fashion between measurements, and even then, depends on closely matched sampling volumes at the two excitation wavelengths. These results show that visually cleaner SERDS spectra do not automatically yield more accurate models. Instead, the optimal strategy depends on fluorescence statistics and the available preprocessing pipeline. The simulation framework and decision rules developed here offer practical guidance for designing Raman measurements in fluorescence-rich environments such as soils and other heterogeneous natural materials.
This is a visual representation of the abstract.
Keywords
Introduction
Raman spectroscopy offers important promise as a tool for process analysis and control in manufacturing, as well as a non-invasive, label-free diagnostic in biomedical and environmental applications.1,2 The inherent specificity of Raman spectroscopy allows for the identification of chemical species with minimal sample preparation. However, its practical application is often hindered by the presence of fluorescence, which can significantly obscure the signature features of Raman spectra, particularly in naturally occurring samples that include complex matrices. Fluorescence not only limits the utility of Raman spectroscopy in critical areas such as in vivo and in vitro diagnostics, forensic analysis, food safety, and soil assessment but also introduces considerable variance that diminishes the Raman signal-to-noise ratio (SNR), ultimately reducing the reliability of characterization and quantification.
A variety of computational and experimental approaches have been developed to address the challenge of fluorescence interference in Raman spectroscopy. 3 Computational methods, including polynomial fitting, 4 least squares, 5 wavelet transform, 6 Fourier transform, derivative 7 and peak detection, apply mathematical corrections to subtract the fluorescence contribution from the Raman signal. However, these methods often fall short in preserving the integrity of the Raman signal. Mathematical baseline correction can distort spectral information and is not consistently effective across different sample types. 7
Analysts have developed various experimental methods to circumvent these issues, focusing on different illumination strategies and signal-processing techniques. Near-infrared (NIR) excitation, 8 for instance, can reduce fluorescence by shifting the excitation wavelength further from the absorption bands responsible for fluorescence. However, this approach decreases the intensity of the Raman signal owing to the inverse relationship between wavelength and Raman scattering intensity, which scales with the fourth power of frequency. Additionally, NIR illumination diminishes the possibility of resonance Raman enhancement, reducing sensitivity in some cases. Multiplex excitation,9,10 wavelength-domain signal-processing methods, 11 and time-resolved Raman spectroscopy 12 can also serve to mitigate fluorescence effects. However, these methods come with their own limitations, including increased cost, instrumental complexity, and often lower signal intensity. Far ultraviolet (UV) excitation confines Raman features to wavelengths much shorter than the accompanying fluorescence but can place prohibitive demands on instrumentation and subject samples to photochemical damage. Picosecond Raman spectroscopy applies a gate to acquire the instantaneous Raman signal in an interval that samples very little of the slower fluorescence. However, this strategy demands a costly laser source and gated detection is usually confined to one wavelength channel at a time.13,14 Nanoscale plasmon resonances can serve to elevate vibrational structure in surface-enhanced Raman spectroscopy (SERS). However, challenges remain to classification and quantitation accuracy owing to poor enhancement reproducibility.15–17
Among the innovative experimental approaches, shifted excitation Raman difference spectroscopy (SERDS) has gained significant attention. SERDS uses two laser sources with slightly different excitation wavelengths to acquire two spectra: the fluorescence contribution remains largely unchanged while the Raman features shift in accordance with the excitation wavelength difference. Subtracting these spectra yields a difference spectrum, ideally removing the fluorescence background while retaining the Raman signal.18–28 This fluorescence removal approach offers a visually cleaner Raman spectrum. However, the practical impact on the accuracy of multivariate regression and classification, which form the backbone of quantitative spectrochemical analysis, remains less understood and serves as the focus of this study.
Despite its documented effectiveness,23,29 the broader adoption of SERDS has been limited, primarily due to the cost and complexity associated with dual-laser systems, as well as the operational challenges in maintaining consistent fluorescence response between consecutive measurements. The necessity to precisely control laser power and align the fluorescence background introduces substantial barriers to routine use in non-specialized environments. Moreover, the advantage of SERDS in providing a more visually distinct Raman signal does not necessarily translate to improved performance in multivariate analysis, where meaningfulness and generalizability of predictive models are of utmost importance as opposed to the appearance of spectra.
Here, we address the question of quantitative efficacy by systematically examining the accuracy of multivariate regression models based on conventional Raman spectroscopy and SERDS under a variety of fluorescence levels and conditions, using different data processing strategies and accounting for variance in experimental sampling conditions. To assure convergence in this assessment, we have conducted extensive simulations, generating a dataset of 12 million spectra to represent binary mixtures of two target analytes, benzophenone and alanine, under various levels of fluorescence and noise. By training partial least squares regression (PLSR) models to predict substance proportions,30,31 we have sought to determine approaches that extract the most information from Raman spectra that include fluorescence and SERDS protocols that seek to subtract it away. Interestingly, under conditions of adequate preprocessing, we found that in most scenarios involving high fluorescence, conventional Raman spectroscopy slightly but consistently outperforms SERDS. We can attribute this outcome to the additional noise introduced by combining two spectra in SERDS.
SERDS does show a distinct advantage under certain conditions, specifically when dealing with high, uncorrelated variability in the fluorescence intensity or spectral shape between samples. In these cases, the elimination of covariant fluorescence backgrounds allows SERDS to improve on conventional Raman spectroscopy. Nonetheless, this advantage dissipates in heterogeneous materials where slight misalignment between the two laser beams de-correlates companion fluorescence spectra, compromising the subtraction process. Both techniques benefit significantly from preprocessing with background-reducing methods such as asymmetric least squares (ALS) 32 and discrete wavelet transform (DWT), 33 which effectively improve their prediction accuracies in spectrally complex environments.
Our study builds on recent advancements in the field, which have applied SERDS in concert with machine learning for biological sample classification under low to moderate fluorescence conditions.21,34,35 This work similarly concludes that while SERDS can effectively manage fluorescence, its practical benefit for classification purposes depends heavily on the type of interference and the homogeneity of the sample. Results reported here add insight by considering more challenging scenarios, including highly variable fluorescence levels and heterogeneous mixtures, thereby providing a broader understanding of the limitations and applicability of SERDS in environmental and soil analysis, where complexity is inherently high.
Results presented here thus provide guidance on selecting appropriate analytical methods in the presence of problematic fluorescence. Specifically, we emphasize that in analytical calibration, the visual appearance of spectra is secondary to the meaningfulness and generalizability of the predictive models. We challenge the assumption that visually appealing spectra necessarily correlate with superior analytical performance. Through exhaustive simulations and practical validation, we demonstrate that SERDS, while aesthetically improving spectra, does not always add informational value, and the method’s effectiveness is contingent on sample characteristics and context.
Ultimately, our findings underscore the importance of method selection tailored to specific analytical scenarios, especially for complex samples with substantial fluorescence interference. We provide a comprehensive framework for understanding the strengths and limitations of both SERDS and conventional Raman spectroscopy, contributing insights valuable for the application of these techniques in fluorescence-rich, real-world settings. This work addresses gaps in the literature and lays a foundation for future research and practical implementations, highlighting the critical role of advanced preprocessing and robust experimental design in advancing Raman spectroscopic analysis.
Experimental
Methods and Materials
This study analyzed more than 12 million individual synthetic Raman and SERDS spectra simulated by linearly combining Raman scans selected from a library of 200 experimentally measured spectra of
Synthetic Spectra and Response Matrix Generation
We used a Wasatch Photonics spectrometer (WP-785-R-SR-LMMF) with a 784.82 nm laser for Raman spectroscopy. The system included a temperature-regulated charge-coupled device (CCD) detector, 50 μm slit (11 cm-1 resolution), f/1.3 input aperture and spectral range of 270–2000 cm−1. The spectrometer was fibre-coupled to a Raman probe (RP 785) with a 100 μm laser spot. Settings were adjusted to prevent saturation, with an integration time of 50 ms and 325 mW power, averaging 100 signal repeats. See the Supplemental Material for further details.
A Python script generates synthetic mixtures by combining normalized benzophenone and alanine Raman spectra contributions with chosen levels of added fluorescence. Figure 1 illustrates a combination of individual Raman spectra of pure benzophenone and alanine to form

(a) Components of a representative simulated Raman spectrum showing benzophenone in green, alanine in blue, and the oatmeal agar fluorescent component in orange. (b) Simulated Raman spectrum of a 70:30 benzophenone-alanine mixture sampled by 783 nm (blue) and 785 nm (red). (c) The corresponding SERDS difference spectrum. (d) Two-dimensional representation of the 785 nm Raman spectrum of this sample with an FSR level of 1000, where the wavelength dimension encompasses the pure Raman spectrum of the mixture, plus fluorescence and noise. The time dimension portrays 128 replicas, with a photobleaching of 0.5% per shot.
A proportion generator referring to the Dirichlet distribution generates random numbers that assign benzophenone and alanine amplitudes to each simulated mixture spectrum. The selected proportions form the elements of the response matrix
Large-Scale Simulated Raman and SERDS Datasets
From the spectra of simulated mixtures in the space of Raman shift in wavenumbers, we form libraries representing 1000 different benzophenone-alanine compositions, figured as Raman spectra in wavelength space according to the transformation,

To determine the comparative accuracy with which realistic conventional Raman and SERDS datasets support the calibration of multivariate regression models under various conditions of fluorescent interference, we use these benzophenone-alanine mixture spectra to build large datasets containing conventional Raman and corresponding SERDS spectra. We computationally generate 128 replicate spectra to represent the repetitive measurement of each simulated mixture composition in every 1000-sample database.
The study reported here focuses on six datasets. Each dataset contains eight complete libraries of 12 8000 Raman and 64 000 SERDS spectra, configured to span a range of fluorescence intensities and designated dynamic responses to measurement. The eight sets of Raman and SERDS spectra within each dataset conform with a nominal value of the fluorescence-to-signal ratio (FSR), defined by the ratio of the selected base fluorescence amplitude or amplitudes to the amplitude of the most prominent Raman feature in the spectrum of pure benzophenone (see Figure S1, Supplemental Material).
The design of these simulation scenarios was informed by our long-term study of soil analysis using Raman and SERDS, reflecting the actual variability in fluorescence observed in complex natural matrices. This approach ensures that the simulated datasets apply to real-world conditions and are relevant for modelling fluorescence interference in environmental samples.
The random selection of authentic benzophenone, alanine, and oatmeal agar source spectra differentiates every composite spectrum in every database. We add independent, shot-noise-matched fluctuations per channel

(i) Dataset 1 comprises eight complete sets of mixture spectra for which the fluorescence backgrounds with FSR values of 0, 1, 10, 100, 1000, 2000, 3000, and 4000 encompass an experimentally realistic range of fluorescence. To balance the competitive signal-to-throughput ratio in comparative accuracy estimates, the datasets representing simulated SERDS measurements each contain half as many repetitive scans at each pair of excitation wavelengths. This primary dataset pair, spanning 1000 determinant benzophenone/alanine compositions and eight specified fluorescence levels, represents 2 million unique simulated spectra, each differentiated by random noise.
(ii)Dataset 2 simulates a dynamic condition commonly encountered in fluorescent samples, mimicking the phenomenon of excitation-dependent photobleaching or thermal decay in fluorescence intensity by decreasing the baseline FSR for each sample by
(iii) Dataset 3 tests the comparative prediction accuracy of conventional Raman and SERDS under conditions of sample-to-sample fluctuating measured spectral intensity. For each of the 1000 samples at each FSR, we scaled each set of simulated replicate spectra by random factors that ranged from
(iv) Dataset 4 endeavours to represent granular natural systems such as soil, which can confront the analyst with a fluorescent matrix of varying composition. To test comparative prediction success in such circumstances, we allowed the shape of the fluorescence spectrum to vary from sample to sample, selecting randomly from 100 patterns of uniform integrated intensity. The SERDS methodology employed in our study assumed the same fluorescence shape excited by both lasers,
In a further approach to the Dataset 4 question of randomly varying fluorescence, we developed a subcategory scenario that applies to SERDS alone, in which the fluorescence shape for each laser varies independently. Thus, Dataset 4a (and Dataset 4ab in the Supporting Information) seeks to simulate the case in which
(v) Dataset 5 creates seven distinct training and validation sets, each combining a pair of FSR levels with a measurement-induced increase or decrease in fluorescence intensity. Calibrated multivariate regression models combine equal-sized blocks of randomly selected spectra recorded with the following pairs of FSR values: (0, 1), (1, 10), (10, 100), (100, 1000), (1000, 2000), (2000, 3000), and (3000, 4000).
Preprocessing
Preprocessing improvements were achieved using asymmetric least squares (ALS) for polynomial fitting36,37 and iterative discrete wavelet transform (DWT) for handling fluorescence fluctuations.
38
ALS operated effectively for most datasets, adjusting fits to balance alignment with smoothness using a regularization or penalty parameter,
Normalization
We used a multistep preprocessing pipeline to normalize for laser-to-laser, power, and focus variability before regression. We applied multiplicative scatter correction (MSC) to each spectrum individually, using the calibration set mean spectrum as the reference. Conventional single-laser Raman measurements treat averaged spectra to remove background using iterative DWT or ALS, where required to model and correct baseline curvature, followed by z-score standard normal variate (SNV) normalization before input to PLSR. SERDS scans subtract
Feature Importance
The PLSR method yields a matrix of loadings in the space of the predictors that can serve as an inventory of feature importance. For purposes of visual assessment, we set a relative threshold of 50% to identify significant contributions to the multivariate response at various FSR levels in conventional Raman and SERDS models. Figure 2 below and other spectra in the Supplementary Information mark important Raman bands recognized by PLSR models at various levels of fluorescence.

(left) Sets of superpositions of 1000 Raman spectra of benzophenone–alanine mixtures, simulated for an illumination wavelength of 785 nm in the presence of a fluorescence background defined for each set of spectra from top to bottom by FSR values of 0, 1, 10, 100, 1000, 2000, 3000, and 4000. Each displayed trace, at each level of FSR, averages 128 separate simulated spectra. (right) Superpositions of 1000 SERDS spectra constructed from the differences of Raman spectra simulated as in the left panel for illumination wavelengths of 785 and 783 nm. In both panels, the left
Regression Model
We developed multivariate quantification models to analyze our data, focusing on PLSR as implemented via scikit-learn’s cross-decomposition module. The data, consisting of 1000 simulated Raman spectra, was split into 80% for training and 20% for testing. Cross-validation was conducted using scikit-learn’s RepeatedKFold class to optimize the number of components for each dataset, with most datasets requiring a single component, while Dataset 3 required two due to scaled fluorescence effects. Performance metrics included
Multivariate models, including PLSR, are powerful but come with certain limitations, especially with small sample sizes and limited data diversity. When datasets lack sufficient variability, model performance may degrade, reducing generalizability. Cross-validation helps mitigate these limitations, but ensuring a diverse training dataset is crucial for reliable models, particularly in real-world applications.
Parameter tuning for both model optimization and fluorescence/background removal was critical for optimal performance. We used cross-validation to select the optimal number of components for each sample while also employing automated optimization methods to reduce manual intervention. Domain expertise in spectroscopic data and machine learning ensures that models effectively learn from relevant spectral features, which is especially important for high-dimensional Raman data.
Spectroscopic Representation
This study considers spectra as recorded in wavelength space. Transformation to a wavenumber basis of Raman shifts offers no advantage for training multivariate models and, in the case of SERDS, introduces errors that diminish model performance. Instead, we analyze all spectral data as dispersed in the original CCD pixel basis, preserving the fidelity of spectral features for machine learning analysis.
Results
Selecting pairs of scans from a library of 200 high-quality Raman spectra of benzophenone and alanine, we combine weighted traces to form 1000 spectra of mixed substances embedded in a chosen background of fluorescence and random noise. These datasets support a comprehensive evaluation of multivariate strategies for isolating Raman features when obscured by fluorescence and noise. The results offer insights into the comparative utility of SERDS for quantitative analysis under a range of challenging measurement conditions.
Raman and SERDS Spectra Under Uniform Conditions of Increasing Constant Fluorescence
Increasing the fluorescence-to-signal ratio (FSR) from 0 to 4000 in Dataset 1, transforms the associated Raman and SERDS spectra from sets of distinct bands characteristic of benzophenone and alanine to broad waveforms dominated by fluorescence. However, as shown in Figure 2, certain spectral features in the SERDS spectra persist, primarily appearing as doublets in the PLSR loadings. Notably, the symmetry of these doublets begins to degrade at FSR values above 1000, reflecting a reduced ability to extract meaningful Raman information from SERDS under high fluorescence conditions.
Raman and SERDS Spectra Under Conditions of Increasing Fluorescence with Decay Upon Successive Measurements
We observe similar trends in Dataset 2, where fluorescence decreases with each successive measurement due to simulated photobleaching (see Figure S4, Supplemental Material). This bleaching of fluorescence improves the visibility of Raman features at higher FSR levels, enhancing feature differentiation. This decreasing fluorescence in Dataset 2 leads to improved signal quality, highlighting the role of photobleaching as a characteristic of real materials that can act to mitigate fluorescence interference.
Raman and SERDS Spectra Under Conditions of Varying Spectroscopic Intensity at Each FSR
Dataset 3 introduces deliberate shot-to-shot variations in fluorescence intensity accompanied by incremental photobleaching. Randomly scaling the fluorescence intensity by factors of 0.99, 1.01, 0.90, 1.10, 0.50, or 1.50 for each sample introduces significant uncorrelated noise, impacting the clarity of the Raman band structure. Compared to Dataset 2, these variations increase the width of the residual SERDS baseline, particularly for FSR levels greater than zero, and lead to spurious PLSR feature importance coefficients, which appear above 900 nm, where no Raman features exist (see Figure S5, Supplemental Material).
Raman and SERDS Spectra Under Conditions of Varying Fluorescence Shape
Dataset 4 adds varying sample-to-sample fluorescence shapes across each of the eight FSR levels (see Figure S18, Supplemental Material). Unlike the uniform fluorescence conditions in Dataset 2, the intensity maximum of the conventional Raman spectrum in Dataset 4 varies between 800 and 860 nm, depending on the fluorescence shape. This variability leads to fluctuations in the visibility of Raman features at FSR levels above 10. For SERDS, the fluorescence contributions from
Effects of Asymmetric Least Squares (ALS) and Discrete Wavelet Transform (DWT) Background Removal in Different Fluorescence Scenarios
Using ALS effectively reduces the fluorescence baseline for both Raman and SERDS spectra. In Raman spectra, the maximum intensity falls from approximately 70 000 counts to 1000 counts at the highest FSR. However, ALS introduces distortions at the spectral edges of conventional Raman spectra, seen detailed on the left in Figure 3 below 820 nm and above 910 nm. These bump-like anomalies in conventional Raman spectra introduced by ALS at FSR levels greater than 100 diminish the significance of PLSR features at 840 nm and 880 nm. This effect appears more evidently for Dataset 4, as seen in Figure S18.

Effects of ALS background removal applied to conventional Raman (left) and SERDS (right) spectra in Dataset 2. ALS flattens the baseline, reducing fluorescence intensity at higher FSR, but adds anomalies in conventional spectra. Applied to SERDS, ALS reduces background and enhances feature resolution around 840, 850, and 900 nm, improving modelling precision.
In contrast with this, ALS uncovers vibrational structure in SERDS without adding artifacts. As shown on the right in Figure 3, ALS preprocessing reduces the width of the residual baseline at FSR = 4000 by about 60%, from 500 counts to 200 counts. This leads to a more uniform baseline after subtraction, allowing PLSR loadings to clearly highlight features in the regions of 840, 850, and 900 nm.
Table I details the effect of ALS preprocessing on the prediction accuracy of PLSR models for benzophenone and alanine concentrations based on Raman and SERDS spectra in Dataset 2. Note how, without preprocessing, conventional Raman spectra in this simple dataset provide a slightly better basis set for multivariate regression models than SERDS spectra. After ALS preprocessing SERDS affords a dataset that yields models with errors of prediction that approach those formed by conventional Raman spectra without preprocessing.
Impact of background removal on PLSR prediction accuracy (RMSEP) for conventional and SERDS measurements with decaying fluorescence (Dataset D2) using ALS, and variable fluorescence shape (Dataset D4) using DWT, at eight FSR levels.

BR: Background removal.
Conv.: Conventional Raman.
In the much more challenging case of fluctuating fluorescence shape, models based on the conventional Raman spectra in Dataset 4 struggle to yield any meaningful indication of composition above an FSR of 1. SERDS spectra without preprocessing extend to offer a reasonable prediction accuracy for an FSR as high as 100.
The DWT performs a multiresolution decomposition of spectral waveforms that can suppress a broad fluorescence background without introducing artifacts (see Figures S19 and S20, Supplemental Material). Applied to the conventional Raman and SERDS spectra in Dataset 4 up to FSR levels of 100, we see little benefit for DWT for SERDS, but remarkable gains in prediction accuracy for conventional Raman spectroscopy. Figure 4 graphically illustrates these effects of ALS and DWT preprocessing.

Effect of background removal on RMSEP as a function of FSR for Datasets 2 and 4. Subplots show RMSEP before and after ALS and DWT background removal to conventional Raman (red circles) and SERDS (black triangles).
Prediction Accuracy of PLSR Models Based on Conventional Raman and SERDS Spectra Under Various Conditions Of Fluorescence
The foregoing results describe the aggregate qualities of Raman spectra synthesized for 1000 different relative concentrations of benzophenone and alanine with varying background characteristics relating to the sampled fluorescence intensity. We have analyzed several datasets: Dataset 1 spans a set of eight fluorescence intensities; Dataset 2 introduces photobleaching; Dataset 3 allows total spectral intensities to vary randomly; Dataset 4 varies the spectral shape of the fluorescence; Dataset 4a extends this concept to vary the shape of the fluorescence components of each of the two Raman spectra subtracted to form each corresponding SERDS spectrum, and Dataset 5 tests the effect of combining pairs of different FSR levels in single training and validation sets.
Tables II and III, provide correlation coefficients for linear fits to plots of values predicted by multivariate regression models based on these six datasets of conventional Raman and SERDS spectra versus known values for withheld sets of validation samples. Bold entries mark values of
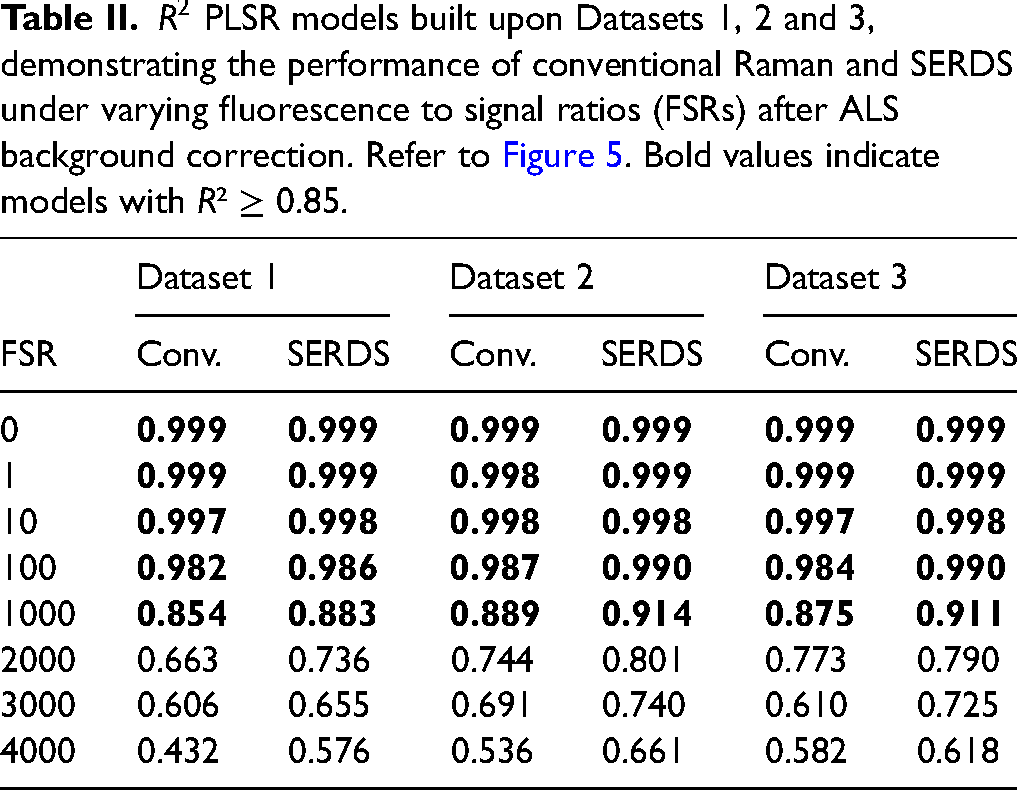

Plots comparing the known concentrations of validation samples in each dataset with values predicted by corresponding multivariate regression models for separate sets of validation samples reflect the degree to which these variations in the fluorescence background affect the SERDS advantage, if any, for quantitative analysis. Figure 5 shows the full set of regression plots for Datasets 1 through 3.
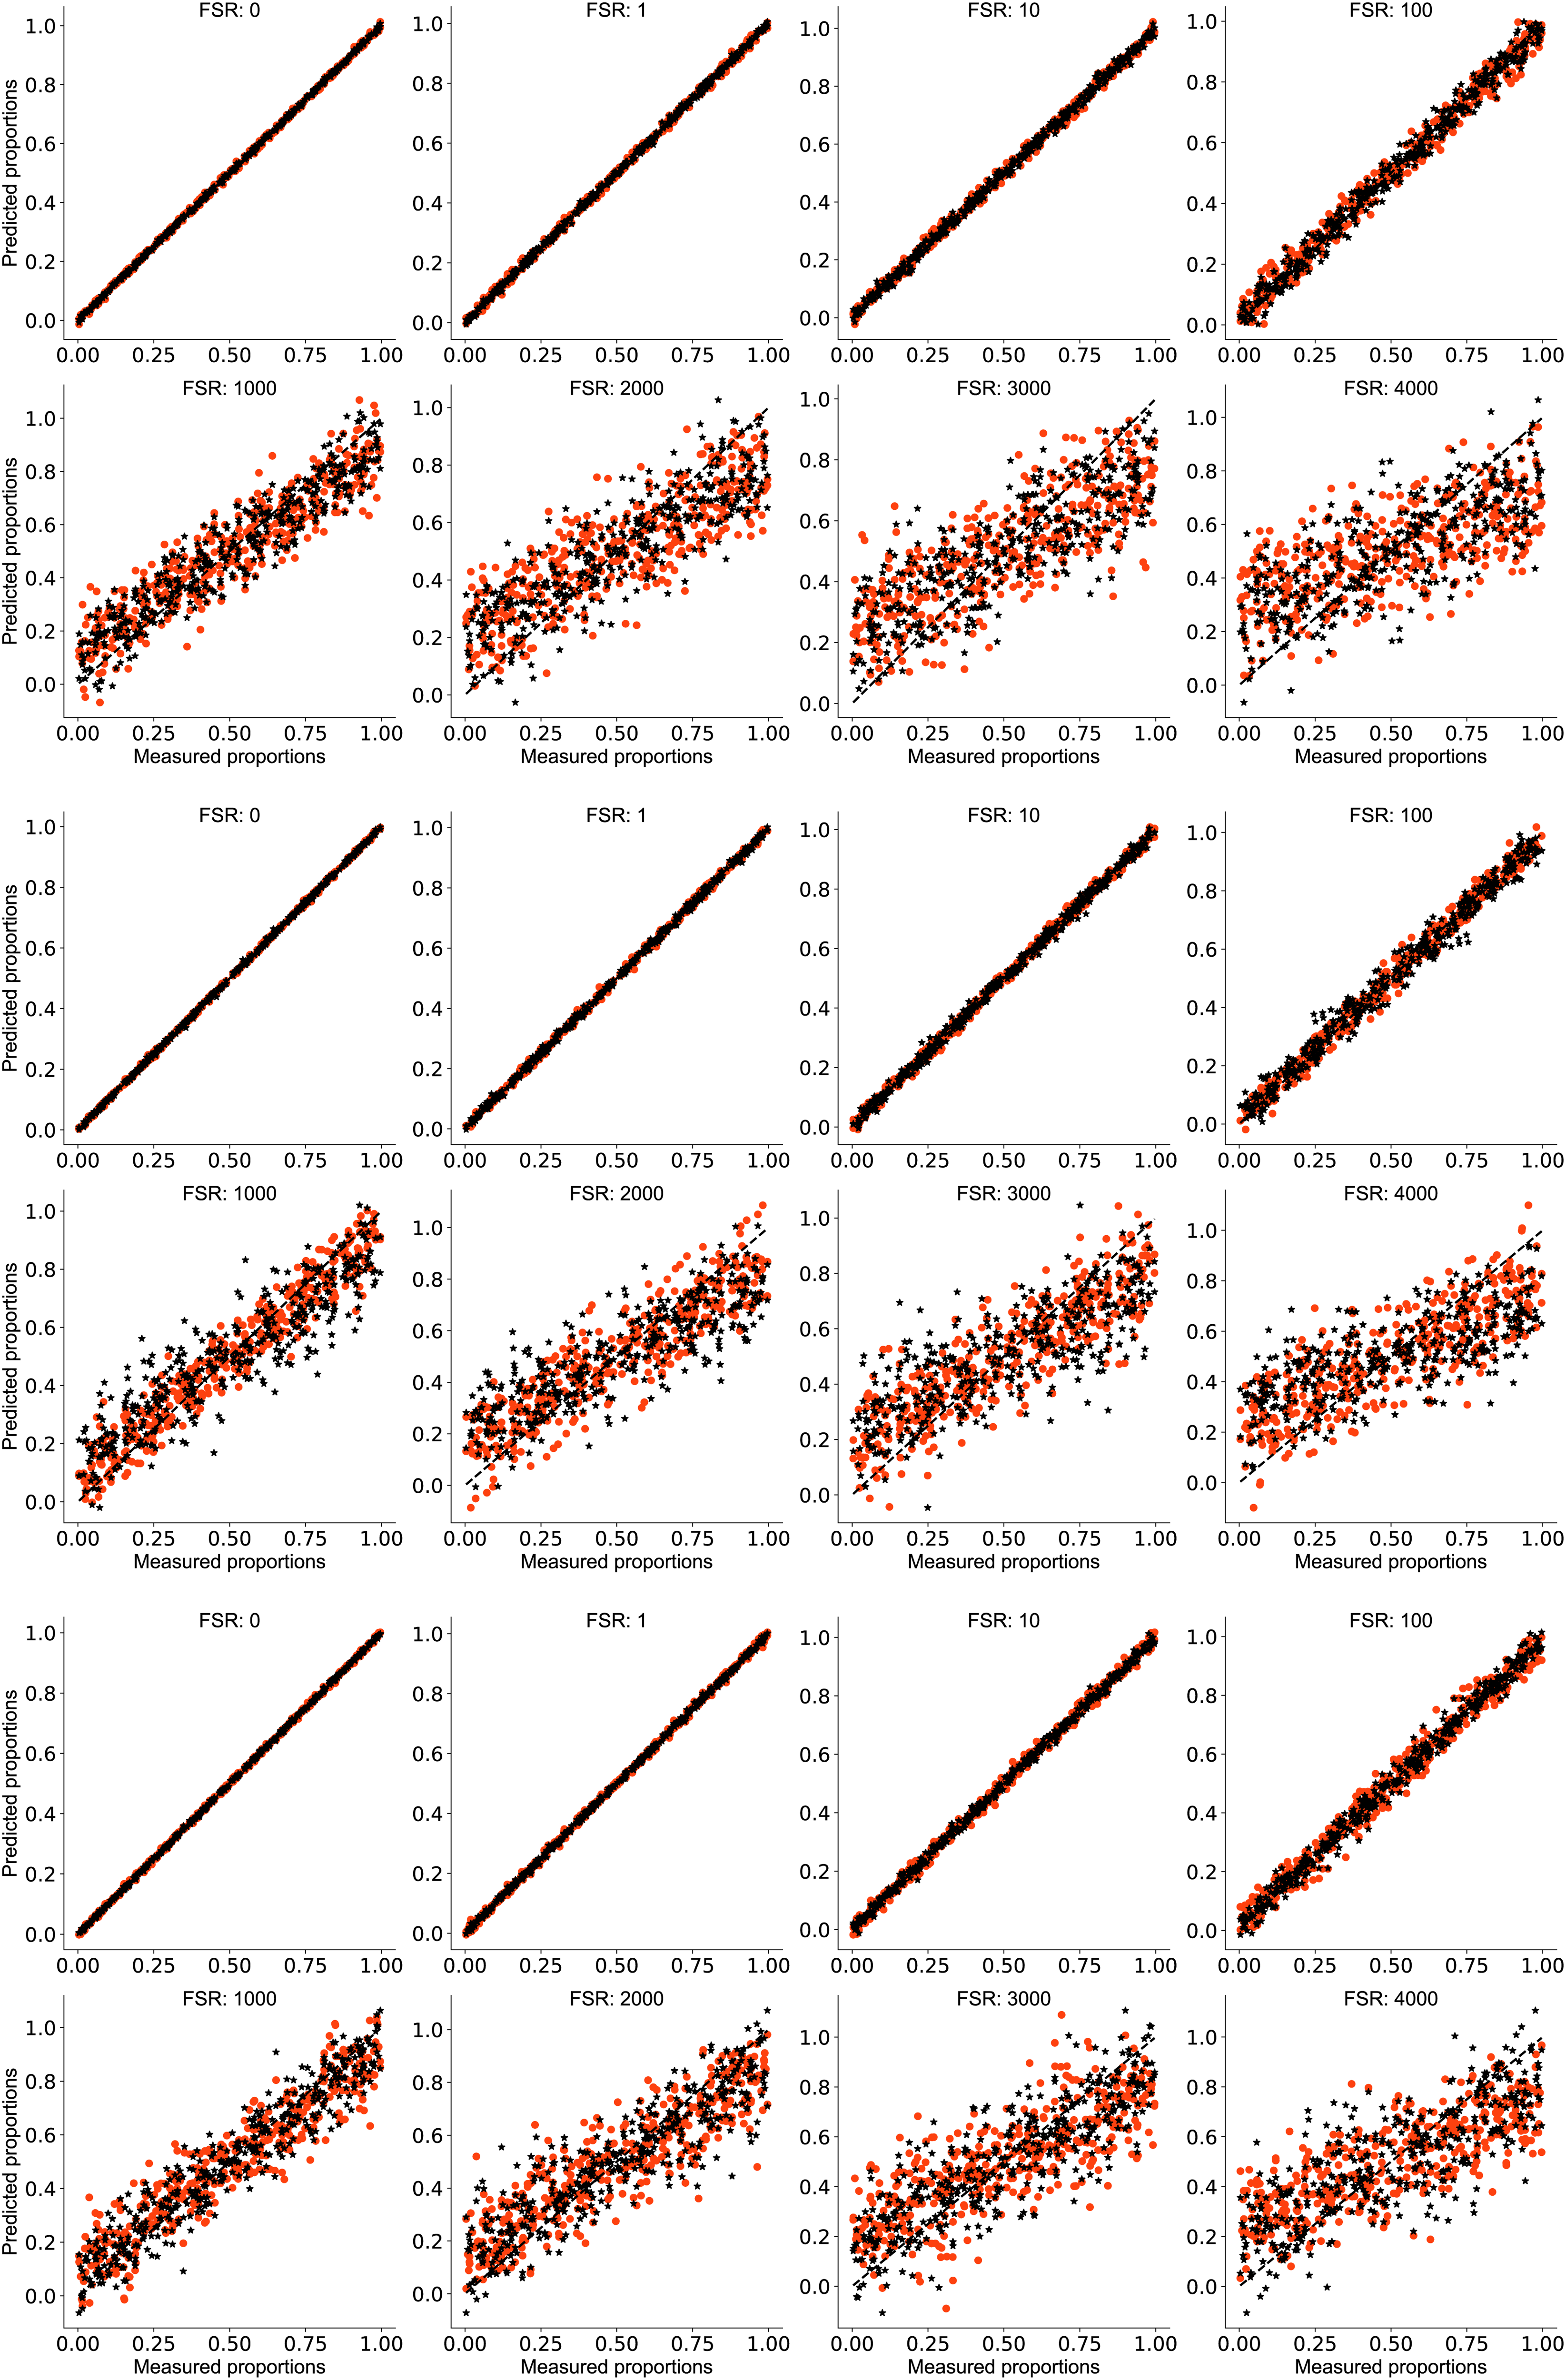
Plots of predicted versus measured proportions of alanine in simulated benzophenone alanine mixtures at each FSR for pairs of validation spectra in (top) Dataset 1, (middle) Dataset 2 and (bottom) Dataset 3 after ALS background correction. Red dots represent the conventional Raman predicted proportions. Black asterisks indicate the SERDS predicted proportions. Note the comparable performance for FSR up to 100. Predictions for FSR levels greater than 1000 increasingly fail to span the range of measured values. SERDS prediction accuracy differs little from that attained by conventional Raman spectra.
Here, we see that PLS regression models applied to conventional Raman and SERDS datasets gauge the relative concentration of alanine with good accuracy up to FSR as high as 100. The prediction accuracy worsens for FSR from 1000 to 4000. At its highest level, fluorescence clearly masks the variance owing to composition across the range. With respect to the diagonal, note that red points validating conventional Raman predictions flatten and scatter to a slightly greater degree than the black SERDS points with increasing FSR.
Figure 6 shows the PLS regression plots for Datasets 4 and 4a, with varying fluorescent shapes (concordantly or discordantly with respect to

Plots of predicted versus measured proportions of alanine in simulated benzophenone alanine mixtures at each FSR for pairs of validation spectra in (top) Dataset 4, (middle) Dataset 4a and (bottom) Dataset 5 after DWT and ALS background correction. Red dots represent the conventional Raman predicted proportions. Black asterisks indicate the SERDS predicted proportions. Note the comparable performance for FSR up to 100. Predictions for FSR levels greater than 1000 increasingly fail to span the range of measured values. SERDS prediction accuracy differs little from that attained by conventional Raman spectra.
Here again, for FSR as high as 100, PLSR models referring to databases of conventional Raman and SERDS spectra succeed well with roughly equal facility in predicting the composition of validation samples. Above FSR = 1000, the conventional Raman prediction interval widens and sags to a greater extent than the prediction results found for Datasets 1, 2, and 3.
For Datasets 4, 4a, and 5 at an FSR of 1000, SERDS spectra yield
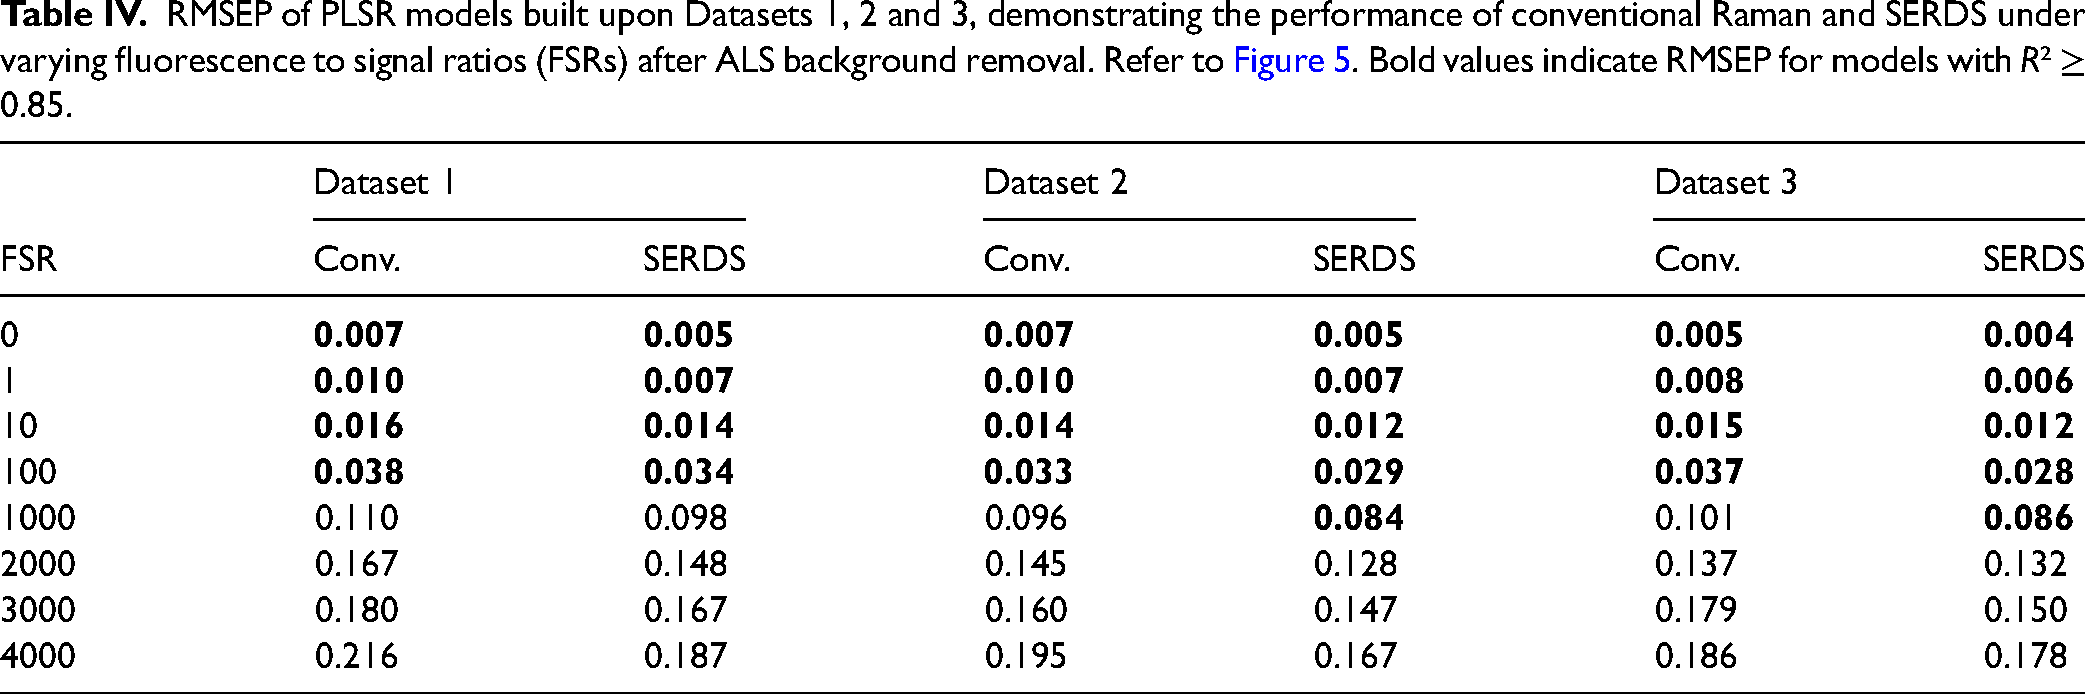
RMSEP of PLSR models built upon Datasets 1, 2 and 3, demonstrating the performance of conventional Raman and SERDS under varying fluorescence to signal ratios (FSRs) after ALS background removal. Refer to Figure 5. Bold values indicate RMSEP for models with R² ≥ 0.85.
RMSEP of PLSR models built upon Datasets 4, 4a and 5, demonstrating the performance of conventional Raman and SERDS under varying fluorescence to signal ratios (FSRs) after DWT and ALS background correction. Refer to Figure 6. Bold values indicate RMSEP for models with R² ≥ 0.85.

Discussion
SERDS Versus Conventional Raman Spectroscopy as Basis Sets for Multivariate Regression Models
Fluorescence interference remains a significant barrier to the effective use of Raman spectroscopy in real-world applications involving complex sample matrices. Despite the specificity with which Raman vibrational shifts signify particular chemical species, overwhelming fluorescence often obscures signifying features, particularly in naturally occurring samples. This issue is especially critical in soil analysis, environmental monitoring, and other biogeochemical applications, where uncontrolled environmental variance is inevitable. Our study assesses whether SERDS, a method developed to mitigate fluorescence, can serve as a more suitable approach than conventional Raman spectroscopy, particularly in building robust multivariate regression models.
To rigorously evaluate this, we have designed an extensive simulation-based approach to study the effect of fluorescence variability under controlled conditions. This simulation environment allows us to create very large synthetic databases, systematically varying the fluorescence intensity, shape, and interaction with noise, enabling us to analyze scenarios that are otherwise challenging to observe in practice. This approach has been instrumental in representing extreme cases of fluorescence we have observed in thousands of natural soil samples where Raman signals are frequently overwhelmed by significant fluorescence variability. By providing a controlled framework, our simulation results offer key insights into the efficacy of SERDS and conventional Raman spectroscopy under realistic conditions.
Shifted excitation Raman difference spectroscopy employs dual-wavelength excitation to subtract fluorescence background, often yielding visually enhanced vibrational structure. This visual enhancement has led to its adoption in applications where fluorescence is a major issue. The present work looks beyond the benefits of visual enhancement to consider the quantitative efficacy of SERDS datasets compared to conventional Raman spectra as bases for multivariate regression models.
The simulation results indicate that while SERDS often yields visually improved spectra, this enhancement does not necessarily translate to better multivariate regression accuracy. As shown in Tables II and V the quantitative accuracy of models developed from conventional Raman spectra compares well with that obtained by SERDS in all fluorescence scenarios apart from one of uncorrelated fluctuations in shape.
The cases of Datasets 4 and 5, where fluorescence shape and intensity fluctuate, present significant challenges to conventional Raman-based models. Dataset 5 simulates the scenario in which a heterogeneous material varies in its fluorescence. In these circumstances, SERDS demonstrates an advantage by effectively removing the consistent fluorescence backgrounds by a dual-wavelength subtraction that uniformizes the baseline, especially when the fluorescence signal ratio is moderate (e.g.,
Effects of Preprocessing
Preprocessing can play a substantial role in mitigating the effects of fluorescence. Table I and Figure 4 contrast RMSEP values with increasing FSR to illustrate the effect of ALS on the accuracy of conventional Raman and SERDS models predicting benzophenone and alanine concentrations in Dataset 2, and demonstrates the success of DWT, particularly for conventional Raman spectroscopy the case of the challenging variance in fluorescence shape presented by the samples in Dataset 4.
These results underscore that the choice of preprocessing method must be tailored not only to the spectroscopic approach (conventional Raman versus SERDS) but also to the specific fluorescence characteristics of the sample. Depending on the level and variability of fluorescence, preprocessing can either enhance or degrade model performance by reducing uncorrelated variance in the fluorescence background. This becomes especially crucial in samples characterized by complex spectral environments, such as those encountered in real-world soil analysis and environmental monitoring.
These results suggest that ALS offers a suitable strategy for preprocessing SERDS data affected by high fluorescence levels, as it enhances feature visibility without introducing significant artifacts. Compared to ALS, DWT provides a more robust suppression of background fluorescence, effectively managing intensity variations between 800 nm and 860 nm. Figure S16 (Supplemental Material) offers a quantitative comparison of DWT with ALS, emphasizing the advantages of DWT for the suppression of fluorescent backgrounds in conventional Raman spectra.
Practical Applications and Method Selection
The findings reported here suggest that although SERDS can be beneficial in cases with extreme fluorescence variability, it is not a universally superior choice. In fact, conventional Raman, combined with robust preprocessing techniques like DWT, can often yield comparable or superior results under many realistic scenarios, especially when the fluorescence-to-signal ratio is moderate or when fluorescence is more predictable.
This near equivalence challenges the assumption that visually enhanced spectra inherently lead to improved analytical outcomes. Our study systematically demonstrates that spectra visually enhanced by SERDS do not always offer better generalizability or accuracy in multivariate regression models. Ultimately, selecting the most suitable method depends on the specific fluorescence characteristics of the sample and the goals of the analysis.
Conclusion
Large-scale, realistic simulations demonstrate that for materials impacted by a range of constant, decaying, and fluctuating fluorescence conditions, conventional Raman spectroscopy often matches or surpasses the performance of SERDS in multivariate regression models. The use of suitable preprocessing methods, such as ALS or DWT, effectively suppresses broad background signals, extending this parity even to high fluorescence levels.
However, in cases where fluorescence spectra fluctuate unpredictably in shape, conventional Raman models struggle owing to the introduction of uncorrelated variance. Under such conditions, SERDS provides a distinct advantage, as the dual-wavelength subtraction can effectively mitigate such variations, provided that the fluorescence backgrounds are consistent between laser pairs.
This study used unreconstructed SERDS difference spectra, as we found that common reconstruction methods for transforming SERDS spectra into Raman shift space degrade the model’s ability to respond to compositional variance. Importantly, regression models developed on a given SERDS basis set are tied specifically to the selected laser wavelengths,
Ultimately, this work provides a comprehensive framework for method selection between SERDS and conventional Raman spectroscopy. It highlights that visually enhanced spectra do not inherently lead to better analytical outcomes and underscores the importance of context, fluorescence characteristics and analytical goals in determining the most effective approach.
Supplemental Material
sj-pdf-1-app-10.1177_27551857251404926 - Supplemental material for Gaining Quantitative Fidelity from Raman Spectra in Regimes of Large and Varying Fluorescence
Supplemental material, sj-pdf-1-app-10.1177_27551857251404926 for Gaining Quantitative Fidelity from Raman Spectra in Regimes of Large and Varying Fluorescence by Mahsa Zarei, Austin Rothwell, Luke Melo, Sadegh Shokatian and Edward Grant in Applied Spectroscopy Practica
Supplemental Material
sj-pdf-2-app-10.1177_27551857251404926 - Supplemental material for Gaining Quantitative Fidelity from Raman Spectra in Regimes of Large and Varying Fluorescence
Supplemental material, sj-pdf-2-app-10.1177_27551857251404926 for Gaining Quantitative Fidelity from Raman Spectra in Regimes of Large and Varying Fluorescence by Mahsa Zarei, Austin Rothwell, Luke Melo, Sadegh Shokatian and Edward Grant in Applied Spectroscopy Practica
Footnotes
Acknowledgments
This work was supported by a Mathematics of Information Technology and Complex Systems (MITACS) Accelerate partnership with Miraterra Technologies Corporation and a grant from the Natural Sciences and Engineering Research Council of Canada (NSERC).
Data and Code Availability
Declaration of Conflicting Interests
The authors declared no potential conflicts of interest with respect to the research, authorship, and/or publication of this article.
Funding
The authors received no financial support for the research, authorship, and/or publication of this article.
Supplemental Material
All supplemental material mentioned in the text is available in the online version of the journal.
References
Supplementary Material
Please find the following supplemental material available below.
For Open Access articles published under a Creative Commons License, all supplemental material carries the same license as the article it is associated with.
For non-Open Access articles published, all supplemental material carries a non-exclusive license, and permission requests for re-use of supplemental material or any part of supplemental material shall be sent directly to the copyright owner as specified in the copyright notice associated with the article.