
Abstract
Fourier transform infrared (FT-IR) spectra were measured of the sodium, zinc, and calcium metal salts of stearic acid. The normal mode analysis of sodium decanoate provides guidance on the group frequency-based band assignments for these metal stearates. The principal absorption bands are assigned to the vibrations of specific molecular groups, carboxylate and methylene (CH2), and to a lesser extent methyl species. Highly characteristic group frequencies without significant mechanical coupling are observed above 1500 cm–1. Below 1500 cm–1, the vibrational modes of the carboxylate and alkane chain exhibit mechanical coupling. The prominent carboxylate stretching vibrations differ based on the metal, metal coordination structure, and metal-stearate polymorphic form. The nature of the mechanical coupling of the CH2 wag is discussed in order to understand the empirical correlation between the number of observed infrared bands (1360–1160 cm–1 spectral region) and the number of carbons in the n-alkane chain.
This is a visual representation of the abstract.
Keywords
Introduction
Fatty acid metal salts are widely used in multiple industries and final products. 1 Typically, they are produced from a reaction of a fatty acid such as stearic acid with a metal oxide resulting in a long-chain aliphatic compound with a terminal carboxylate (RCO2–). They are a major soap component and are used in plastics, rubber, paints and finishes, cosmetics, greases, and oils.
In general, the organic salt of a metal cation and a RCO2– anion containing eight or more carbon atoms in the alkyl chain is termed a soap. Commercial fatty acid metal salts derive from stearic, palmitic, lauric, oleic, and tall oil acids. The most common metals encountered include sodium, calcium, and zinc. However, only alkaline or ammonium salts are typically regarded as classic soaps. The use of other metals results in a different class of metal soaps with decreased water solubility along with increased solubility in non-polar solvents. The physicochemical properties of these metal soaps are related to their structure and the nature of the metal. The differing physicochemical properties of these metal soaps result in their use in a wide variety of applications. 1 Consequently, a practicing vibrational spectroscopist is highly likely to encounter stearic acid metal salts on multiple occasions and should be knowledgeable of their characteristic infrared spectral bands.
Chemical Structure of Stearic Acid Sodium Salt
n-alkyl fatty acids such as stearic acids consist of an unbranched saturated long chain aliphatic unit and a terminal carboxylic acid. Following deprotonation, this structure results in the observed hydrophobic–hydrophilic double nature of metal RCO2–. The chemical structure of sodium stearate (Na+ CH3 (CH2)16 CO2–) is shown below. 2 The energetically favored structure finds the methylene (CH2) groups in the trans (zig-zag) configuration and is typically encountered in fatty acid salts. The sodium cation forms a simple ionic interaction between the anionic RCO2–. Both oxygen atoms interact equally with the sodium cation.
Infrared Spectroscopy: Characterization of Metal–RCO2– Species
Fourier transform infrared spectroscopy (FT-IR) is an established technique to investigate the chemical state and interactions of carbonyl and RCO2– groups.3–6 Infrared (IR) spectroscopy is well suited to study metal–soap complexes using both RCO2– stretching and selected CH2 vibrations.7–9 The environmental sensitivity of both the RCO2– and CH2 vibrations exhibit characteristic differences depending on the metal, the type of metal– RCO2– coordination species, and the crystalline form.
Here, we review the characteristic IR group frequencies of the common stearic acid salts. We highlight the importance of the mechanical coupling of vibrations involving RCO2– and CH2 groups in the IR fingerprint spectral region (below 1500 cm–1). A normal mode analysis of sodium decanoate is used to provide a solid foundational understanding of the characteristic IR bands of metal-stearate salts. Representative IR spectra of sodium, calcium, and zinc stearate are presented, and the effect of polymorphic forms and metal–RCO2– coordination species on the IR spectrum are discussed.
Experimental
Materials and Methods
Fourier transform infrared spectroscopy measurements were conducted using an Agilent Technologies Cary 670 FT-IR spectrometer at 4 cm–1 resolution and 32 scans using ResolutionsPro FT-IR spectroscopy software (v.5.3.0, Agilent Technologies). The interferometer utilized an extended-range potassium bromide (KBr) beamsplitter and a cooled deuterated L-alanine doped tri-glycine sulfate detector. A Norton–Beer medium apodization was employed.
Attenuated total reflection (ATR) sampling of the stearic acid salts was used to minimize perturbation of the metal–RCO2– structure. Stearic acid salts often have several different polymorphic forms which can be affected by temperature, physical grinding, and pressure. KBr disc, NUJOL mulls, and cast films can potentially change the polymorph and therefore the measured FT-IR spectra.
An in-compartment diamond ATR accessory (GladiATR, Pike Technologies) was used for the FT-IR spectral measurements. The FT-IR spectra were collected in the 4000–400 cm–1 spectral region for the diamond ATR and the 4000–600 cm–1 spectral region for the Ge ATR. The FT-IR measurement procedure included the measurement of a single beam background scan of the cleaned ATR element, transfer of the solid sample onto the diamond ATR, and measurement of the sample FT-IR scan. The ATR element was then cleaned using a wet Kimwipes tissue and the ATR element was confirmed to be free of chemical contamination by a simple FT-IR absorbance scan relative to the single beam background scan.
In ATR spectral correction, the ATR spectrum differs from a classic transmission spectrum because the light penetrates into the sample at a depth proportional to the wavelength of light. Longer wavelength light (i.e., smaller wavenumbers) passes through more of the sample and exhibits greater absorbance. Thus, when compared to a classic transmission spectrum, the absorbance at lower frequencies is proportionally greater than at higher frequencies. The important parameters in the ATR depth of penetration include the incident light wavelength, the angle of incidence to the ATR element, the refractive index of the ATR element, and the refractive index of the sample. Minor differences in peak frequencies and bandshape are also expected in an ATR-measured infrared spectrum compared to a standard transmission spectrum.
The ATR spectrum is corrected using the ATR Correct Algorithm 2 in the Resolutions Pro software with a sample refractive index of 1.5, a crystal angle of incidence of 45.00°, a crystal name of diamond or Ge with a corresponding refractive index of 2.4 and 4.0, respectively.
Sodium decanoate (Sigma-Aldrich, SLCP6498) and sodium stearate (Sigma-Aldrich, SLRC0584) were used as supplied. Zinc stearate (FACI USA) and calcium stearate (Univar Solutions) were used as supplied.
For the computational chemistry, Schrodinger software v.23.2 was used to perform the theoretical work. A single conformer of the anion with the alkyl group in a linear conformation was optimized in the gas phase using the ω-B97X-D4 functional and the def2-TZVP basis set. Subsequently, a single point energy calculation was performed at the W-B97X-D4/def2-TZVP(-F) level of theory using the optimized geometry to calculate the IR and Raman vibrational frequencies. The def2-TZVP(-F) basis set is required for vibration analysis because F-orbitals cannot be included. Selected calculated frequencies and intensities can be found in Table S1 (Supplemental Material).
Results and Discussion
Infrared Spectroscopy of Sodium Stearate
Alkane RCO2– such as stearic acid salts have infrared bands characteristic of normal alkane methyl and CH2 groups as well as RCO2–.3–6 Figure 1 shows the FT-IR spectrum of sodium stearate measured with a Ge ATR (corrected) with only moderate pressure. Some of the general characteristic infrared bands are identified in Figure 1 and are summarized in the group frequencies assigned in Table I.

The FT-IR spectrum shown in percent transmission of sodium stearate measured at 4 cm–1 resolution using a Ge ATR. An ATR correction was employed.
Selected group frequency band assignments of sodium stearate (Na+ CH3–(CH2)16–CO2–).

The FT-IR spectrum of fatty acid salts exhibits infrared absorption bands due to the RCO2– group including the out-of-phase (antisymmetric/asymmetric = asym)10,† stretch at 1600–1520 cm–1, the in-phase (symmetric = sym) stretch at 1440–1380 cm–1 and the in-plane bend (deformation) at 740–670 cm–1. The RCO2– asym and sym stretches can be understood in terms of the mechanical coupling of equivalent bonds of a triatomic moiety such as carbon dioxide (CO2). When both C=O bonds stretch, they are in phase with one another leading to a sym stretch. When one C=O bond stretches while the other contracts, the individual C=O vibrations are out-of-phase causing an asym stretch. The RCO2– asym stretch observed at 1570 and 1559 cm–1 in sodium stearate is an excellent group frequency. The two bands observed for sodium stearate have been previously reported and attributed to possible different sub-cell arrangements. 7 The IR RCO2– asym stretch is a strong absorber, provides useful information about the local environment, and is often isolated from the characteristic vibrations of other functional groups.
For a long chain aliphatic such as a stearate (C18), the dominant infrared bands of the CH2 group include the CH2 stretches (2915 cm–1 and 2848 cm–1 for the asym and sym stretches, respectively), the CH2 bend/deformation (1472 cm–1) and the CH2 wag progression 1360–1160 cm–1.3,4 Only minor contributions from the methyl group are observed with weak bands at 2953 and 2872 cm–1 from the CH3 asym and sym stretches, respectively, and 1381 cm–1 from the CH3 sym bend. In the fingerprint region, the RCO2– vibrations involving both the RCO2– sym stretch and the in-plane bend mechanically couple with the CH2 group CH2 wag, twist, and rock vibrations (see Supplemental Material for vibrational analyses).
A convenient dividing line is revealed by examination of the group frequencies of sodium stearate assigned in Table I. Highly characteristic group frequencies without significant mechanical coupling are observed above 1500 cm–1. Below 1500 cm–1, the vibrational modes of the RCO2– and the CH2 group exhibit mechanical coupling.
Group frequencies arise when a molecule contains a bond or group with a vibrational frequency significantly different from adjacent groups. In this case, the vibrations are localized primarily at this functional group. Good quality group frequencies are typically encountered between 4000 and 1500 cm–1. The IR fingerprint region usually involves the mechanical coupling of differing bonds and adjacent groups. For sodium stearate, this results in multiple bands associated with the RCO2– sym stretch interacting with the CH2 wag, the CH2 wag progression, and the RCO2– in-plane bend interaction with the CH2 rock.
Carboxylate (RCO2–) Stretch Mechanical Interaction
In carboxylic acid salts (RCO2–), the RCO2– effectively exists as two equivalent carbon–oxygen bonds that are intermediate in their force constant between a double-bonded carbonyl (C=O) and a single-bonded ether (C–O). The RCO2– group type bond order is consequently termed a bond-and-a-half and behaves as a functional group with characteristic IR and Raman bands.3–6
Both bond-and-a-half oscillators in the RCO2– are equivalent and thus strongly mechanically coupled via the coupled oscillator mechanism.4,6 This results in two characteristic vibrations, the RCO2– asym stretch, which occurs at a higher frequency, and the RCO2– sym stretch, which occurs at a lower frequency. These stretching vibrations are useful infrared bands for metal RCO2– analysis. The asym (RCO2–) stretch is particularly sensitive to changes in the RCO2– environment reflecting various metal cations, their bonding geometry, and solid-state crystallinity interactions.7–9
Figure 2 shows the characteristic infrared spectrum of sodium decanoate (Na+ CH3 (CH2)8 CO2–) in the 1700–1400 cm–1 region and Table II summarizes the generally observed frequency ranges and expected intensities for the RCO2– stretches.

The FT-IR spectrum of sodium decanoate shown in percent transmission in the 1700–1400 cm–1 region measured at 4 cm–1 resolution using a diamond ATR. An ATR correction was employed.
General RCO2– stretching vibrations, their typical spectral ranges, and approximate intensities.

Vibrations of the CH2 and RCO2– Groups
Most of the prominent infrared bands observed in sodium stearate derive from the CH2 and RCO2– groups. Figure 3 illustrates the vibrations of an isolated CH2 group.3–6 The characteristic CH2 stretching vibrations are observed near 2915 and 2849 cm–1 and the CH2 bend at 1472 cm–1. The CH2 wag, twist, and rock vibrations are found below 1450 cm–1 and are thus prone to mechanically couple with RCO2– group vibrations. Since the stearate aliphatic unit includes 16 adjacent CH2 units in the trans-configuration, multiple bands from the CH2 wag, twist, and rock vibrations occur.3,4

Vibrations of the CH2 group. The carbon atoms are depicted by the grey spheres and the hydrogen atoms by the smaller blue spheres. C and S denote contract and stretch, while B is bend. The movement of the atoms is depicted by arrows or by + and – signs if the atom movement is out of the plane defined by the page. Nodal planes are used to help differentiate the vibrations. The blue dashed arrows help to identify the CH2 twist and rock vibrations.
The RCO2– anion group is polar, which results in a strong infrared absorbance at (1570–1560 cm–1) from the RCO2– asym stretch and a cluster of moderately absorbing bands from 1434–1407 cm–1 involving the RCO2– sym stretch.3–6 The band cluster of moderate to weakly absorbing bands observed between 760 and 632 cm–1 involves both the RCO2– in-plane bend and the RCO2– out-of-plane wag.
Figure 4 illustrates the vibrations of the RCO2– group along with selected CH2 wag, twist, and rock vibrations. A normal mode analysis of sodium decanoate was calculated to more fully understand the vibrational bands observed for n-alkyl carboxylic acid salts (see Supplemental Material). The RCO2– asym stretch is a relatively isolated vibration with minimal coupling with CH2 wag. However, the lower frequency RCO2– sym stretch is significantly coupled with the CH2 wag resulting in a well-defined band cluster (1450–1400 cm–1) in the infrared spectrum of sodium decanoate and sodium stearate. Similarly, the band cluster observed in the 780–680 cm–1 region involves the RCO2– in-plane bend and the CH2 rock.
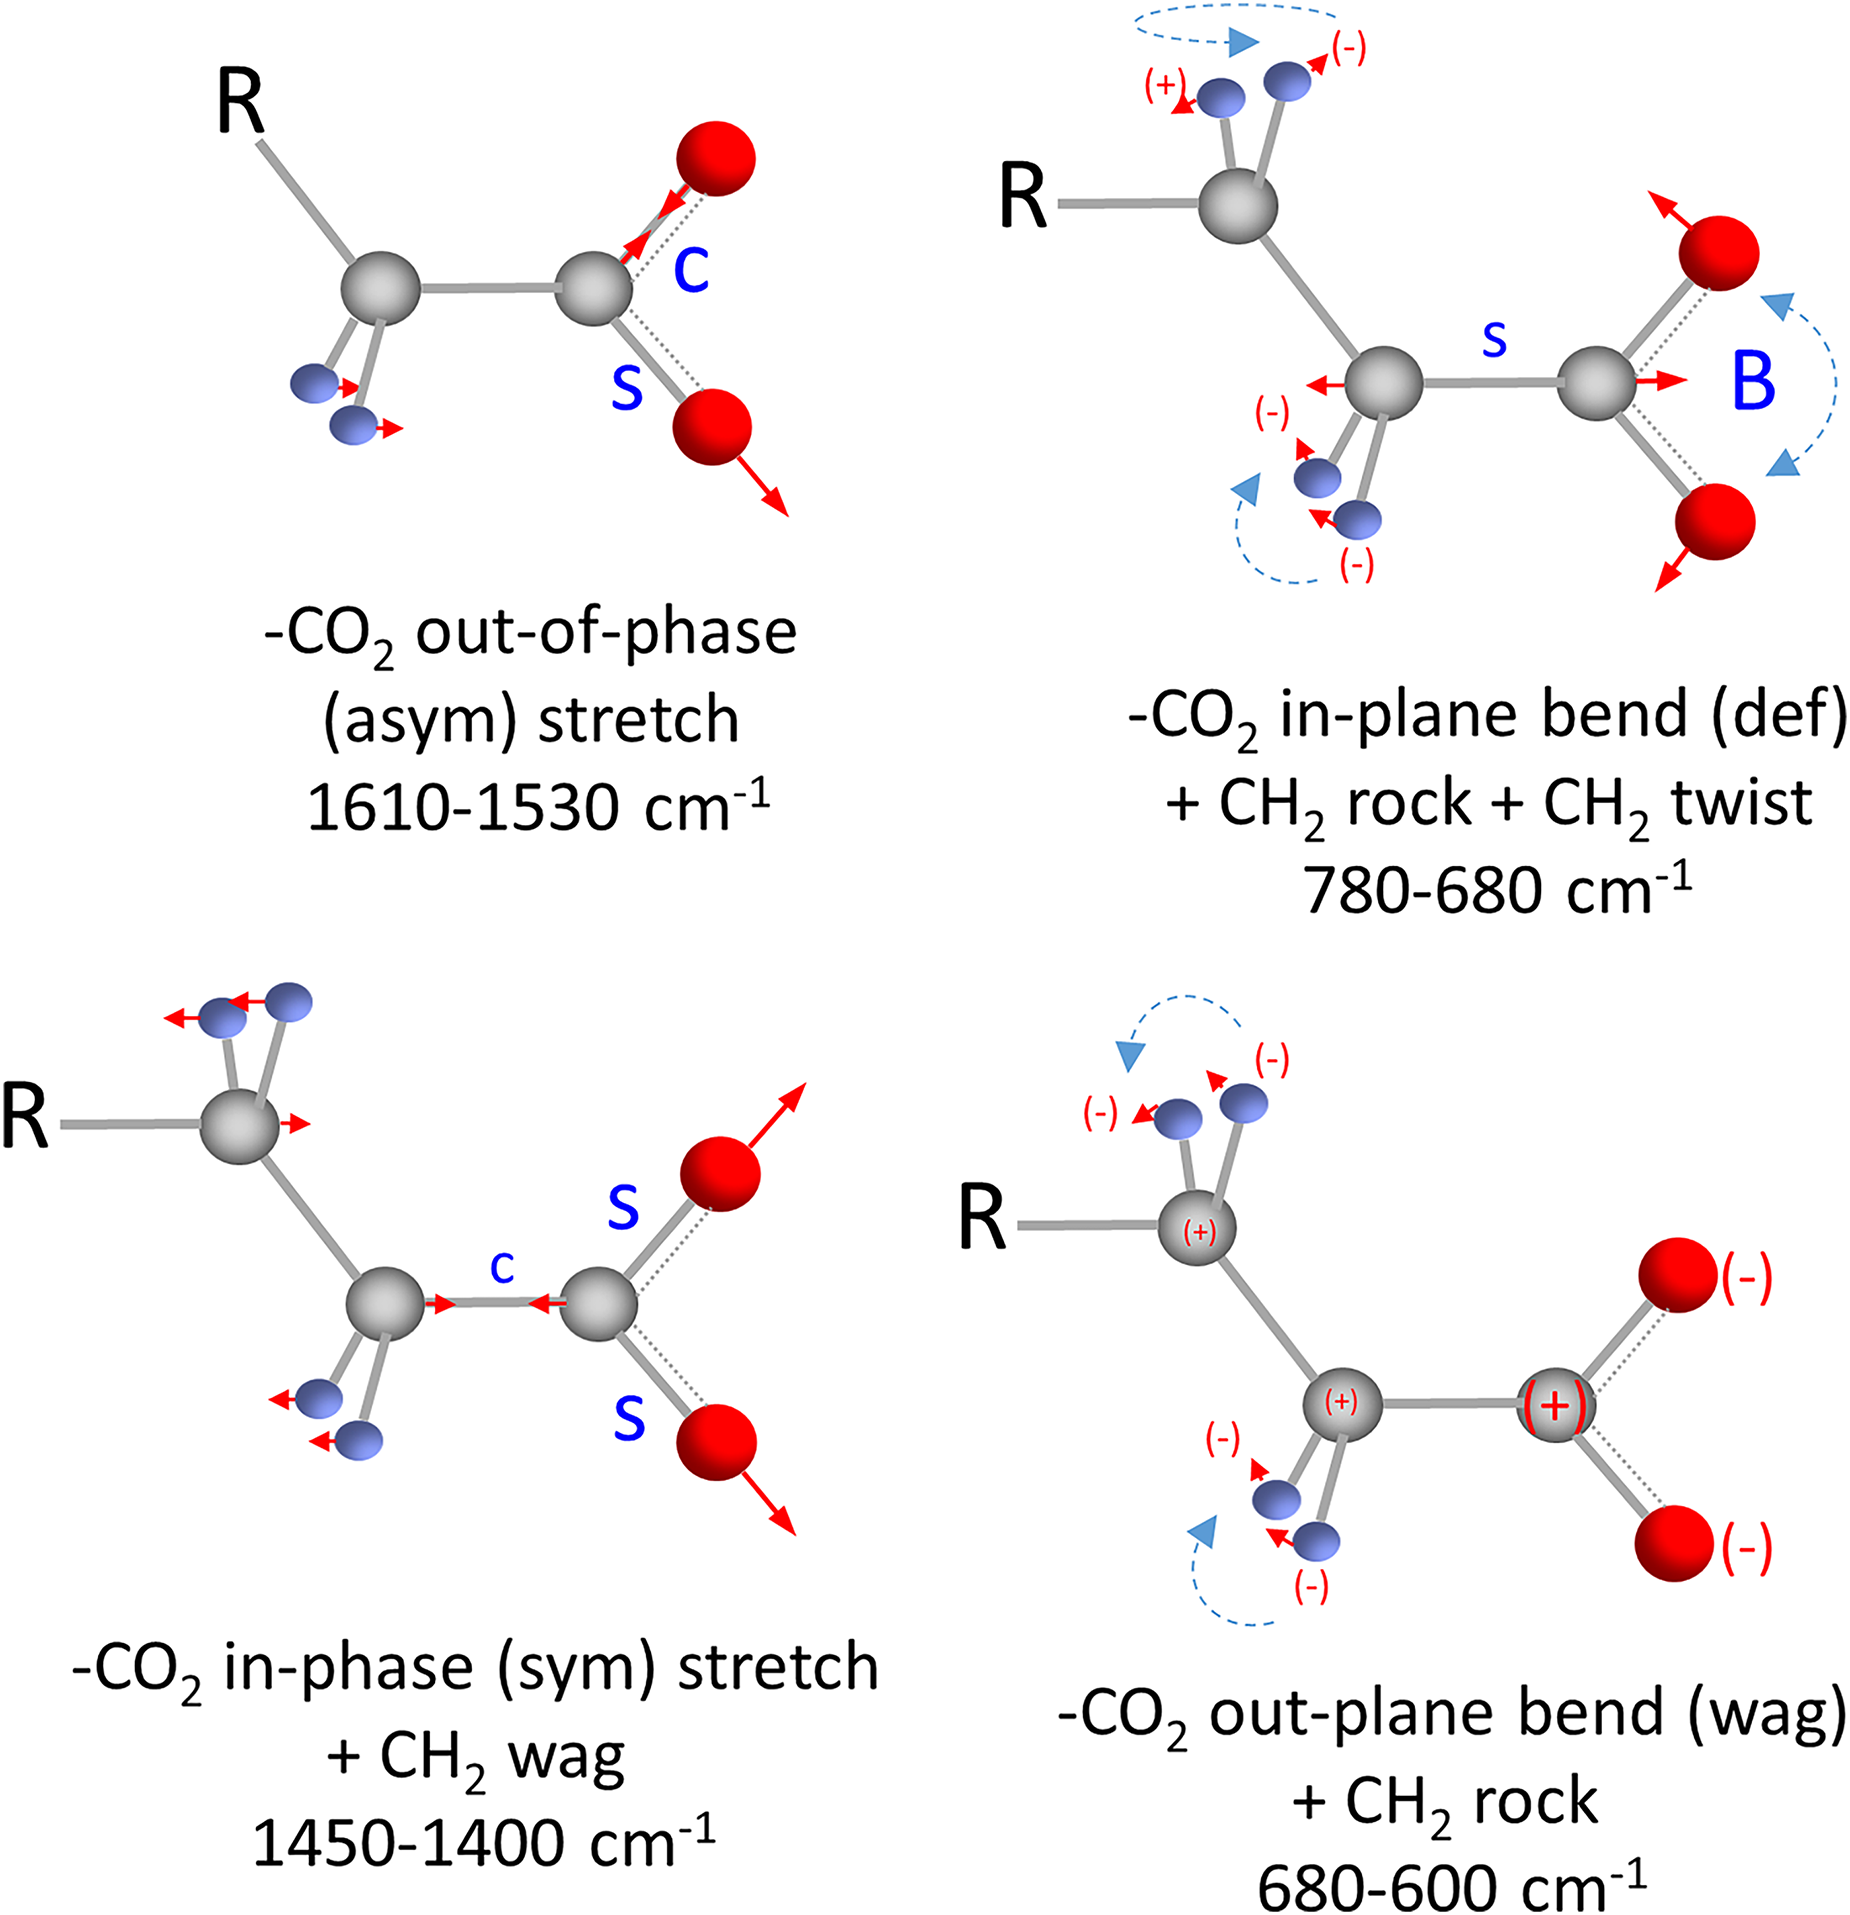
Vibrations of the RCO2– anion and the attached CH2 groups. The carbon atoms are depicted by the grey spheres, the oxygen atoms by the red spheres, and the hydrogen atoms by the smaller blue spheres. The ionically bound sodium cation is not shown. C and S represent contract and stretch, while B is bend. The movement of the atoms is depicted by arrows or by + and – signs if the atom movement is out of the plane defined by the page. The blue dashed arrows help to identify the CH2 twist and rock vibrations.
Methylene (CH2) Wag Band Progression is Predictive of Aliphatic Chain Length in Metal Soaps
The CH2 wag results in a progression of weak bands in a broad spectral region (1360–1160 cm–1) due to the –CH2–CH2– wag interaction in the trans-configured (zigzag) n-alkane chain.3,4 This characteristic behavior in the 1360–1160 cm–1 spectral region has been identified for n-aliphatic carboxylic acids, acid salts (soaps), and esters and attributed to a progression of the CH2 wag.4 These bands are more prominent in materials in a solid, crystalline state and the number of these bands increases as the length of the n-alkyl chain increases (Figure 5). Due to minimal spectral interferences, the n-alkyl metal soaps provide distinct, easily identified spectral bands in this region. Similar correlations in progression bands have also been observed for paraffins and nylon.11,12 However, both paraffins and nylon differ from the n-alkyl metal soaps, involving other vibrations such as the C–C stretch and the CH2 twist and rock in the observed progressions.

The FT-IR % transmission spectra of sodium decanoate (blue trace) and sodium stearate (red trace) in the 1400–1150 cm–1 spectral region highlighting the CH2 wag progression of bands. The infrared bands used to calculate the n-alkyl chain length are peak-picked. The FT-IR spectra were measured using a Ge ATR. The illustration shows the –CH2–CH2– in-phase and out-of-phase wag vibrations resulting in two different frequencies. 4
As a general rule of thumb, the number of bands in this spectral region for n-alkyl metal soaps (1360–1160 cm–1) is equivalent to half the number of CH2 groups in the aliphatic chain of the acid or salt.
The number of infrared bands in this spectral region has been empirically correlated with the number of CH2 groups by the following
4
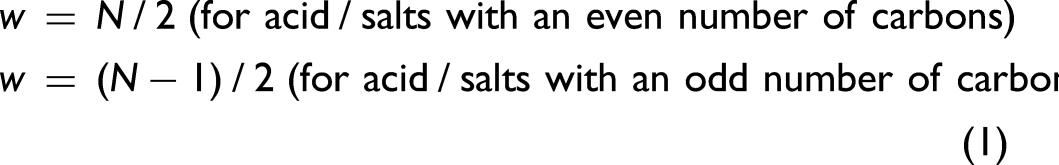
A closer examination of the form of the CH2 wag of two adjacent CH2 groups helps to explain this phenomenon. The CH2 wag rotates the CH2 group as a whole without much change in the HCH angle. The vibration mostly changes the angle between the CH2 group and the adjacent C–C bonds. 4 The CH2 wag also moves the carbon of the adjacent CH2 group. As a result of this strong mechanical coupling, the phase of the vibration of the adjacent trans-CH2 groups is important (Figure 5). The frequencies of the in-phase and out-of-phase vibrations will be separate and distinct with the out-of-phase (cooperation in coupled oscillator mechanism) vibration at a higher frequency and the in-phase (opposition) at a lower frequency. 4 As the n-alkane chain becomes longer, this increases the possible in- and out-of-phase combinations.
The various CH2 wag vibrational modes differ in relative phases and are spread out over a wide frequency range. As mentioned above, some CH2 wag vibrational modes mechanically couple with the RCO2– sym stretch while other lower frequency modes result in the progression shown in Figure 5. The various normal modes for selected CH2 wag vibrations are shown for sodium decanoate in Supplemental Material. Lastly, although the progression of infrared bands in the 1360–1160 cm–1 region derives predominantly from various phases of CH2 wags, both CH2 rock and twist vibrations will also contribute to the weakly absorbing band(s) in this region3,4 (see Supplemental Material), which is used in the n-alkane chain length estimation.
Metal RCO2– Structures
As depicted in Figure 6, the RCO2– group can interact with metal cations in four different modes: ionic (structure a), bidentate (structure b), unidentate (structure c), and bridging (structure d).7,13 The metal type (i.e., ion mass, electronegativity, and effective charge) will play a significant role in which metal RCO2– structure is favored and the resulting RCO2– stretching frequencies. A comparison of the observed frequencies for the RCO2– asym and sym stretches can be used to assign the mode of metal–RCO2– structure and is dependent upon the coordination symmetry.7,9,13 The more isolated, strongly absorbing RCO2– asym stretch is very sensitive to subtle changes in coordination geometry. Table III summarizes some of the general average RCO2– stretching frequencies for some common metal–RCO2– structures.

Chemical structures of metal RCO2–: (a) ionic form of monovalent metal ions (M=Na+ or K+); (b) unidentate coordination; (c) chelating bidentate coordination where M=Zn2+ or Ca2+; and (d) bridging bidentate coordination to calcium ions.
A summary of an average frequency for the RCO2– out-of-phase (asym) and in-phase frequencies for the four general structures of metal–RCO2–.

op: out-of-phase (asym); ip: in-phase (sym); str: stretch.
General trend of RCO2 op str = νUnidentate > νIonic > νBridging ∼ νBidentate.
The simplest metal–RCO2– interaction is the ionic type typically observed for alkali metal salts (i.e., Na+ and K+).7,13 The two oxygen atoms of the RCO2– group associate equally with the metal cation. The metal RCO2– has a higher symmetry which results in the smallest frequency difference (Δν = 115 cm–1) between the asym and sym RCO2– stretching frequencies (cf. FT-IR spectra in Figures 1 and 2).
The chelating bidentate structure for the metal–RCO2– structure (Figure 6c) has a similar local symmetry as observed for the simple ionic structure. Zinc– RCO2– complexes typically exhibit bidentate geometry, as seen in zinc stearate Zn (CH3–(CH2)16–CO2–)2. Figure 7 shows the FT-IR spectrum of the zinc stearate complex (green trace). The strong RCO2– bands at 1535 and 1398 cm–1 derive from the RCO2– asym and sym stretches, respectively.7,14,15

The FT-IR spectra shown in percent transmission of zinc stearate (green trace) and calcium stearate (blue trace). Both spectra were measured at 4 cm–1 resolution using a diamond ATR and used an ATR correction.
The existence of different crystalline forms is known to cause frequency shifts in the selected group frequencies in the infrared spectrum. Zinc stearate is known to exist in crystalline forms (Types A and B) with very different orientations and symmetries.15,16 The RCO2– asym stretching band(s) is(are) particularly sensitive to subtle changes in the coordination geometry. Previous work
15
indicates:
Type A has three bands at 1590, 1546, and 1529 cm–1 due to lower crystal symmetry and relative RCO2– orientation. Type B has one band at 1537 cm–1 due to higher crystal symmetry (and RCO2– orientation).
The multiple RCO2– asym stretch bands for crystalline type A zinc stearate have been assigned to a tetrahedral coordination by the oxygen atoms from four different RCO2– groups. Since the dipole moments of the involved RCO2– are not aligned, the asym RCO2– stretch differs in phase resulting in multiple bands.
15
The much more symmetric crystalline structure of type B zinc stearate results in only one RCO2– asym stretch band.
15
Figure 8 shows the FT-IR absorbance spectrum of a different sourced zinc stearate (Faci USA, LLC) sample in the 1640–1460 cm–1 spectral region. The corresponding second derivative spectrum is also shown to clearly identify the overlapping peaks involving the RCO2– asymmetric stretching bands of the two polymorphic forms. This particular zinc stearate sample (Faci USA, LLC) has similar amounts of crystalline form A and form B.

The FT-IR absorbance spectra (green trace) and the second derivative spectra (blue trace) of the zinc stearate sample in the 1640–1460 cm–1 spectral region. The diagnostic infrared bands for the Type A and B crystalline forms are marked. This particular sample has roughly equivalent amounts of the A and B crystalline forms.
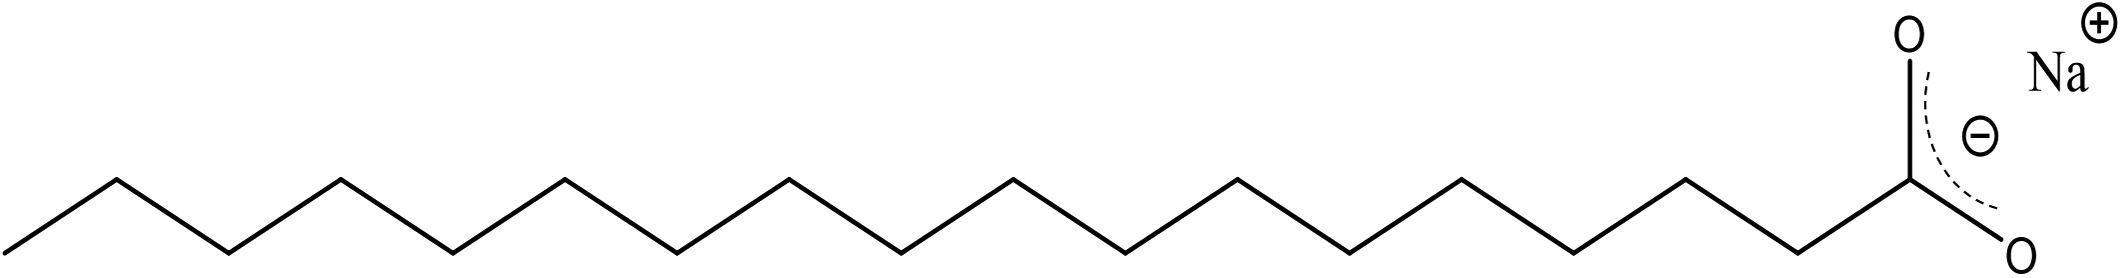
Chemical structure of sodium stearate (octadecanoic acid, sodium salt).

The RCO2– group type bond order.
The chelating unidentate structure for the metal–RCO2– structure (Figure 6b) has only one oxygen atom coordinated with the metal cation. Calcium stearates include this chelating unidentate structure (see below). Here the symmetry is lower compared to either the ionic or bidentate RCO2– species (Figures 6a and 6c). One consequence of this metal RCO2– structure is a higher frequency for the RCO2– asym stretch. In general, the asym and sym RCO2– stretching frequencies of unidentate RCO2– structures are closer to the carboxylic acid (RCOOH) carbonyl C=O stretch at 1700 cm–1, and the C–O stretch at 1400 cm–1. This results in the largest frequency difference (Δν = 155 cm–1) between the asym and sym RCO2– stretch frequencies (Table III).
The chelating bridging structure for the metal–RCO2– structure (Figure 6d) has similarities with both the unidentate and bidentate coordination states. Each oxygen atom is coordinated with one metal atom, but the symmetry is higher. Because of this, the frequencies of the asym and sym RCO2– stretches and their Δν values should be similar to that of the bidentate metal RCO2–.
Calcium Ion Coordination with RCO2–
The FT-IR spectrum of calcium stearate is typically more complex than the spectra for sodium or zinc stearates. One obvious feature in the FT-IR spectrum of calcium stearate is the strong doublet attributed to the RCO2– asym stretch and the presence of water (Figure 7, blue trace). The water hydrate results in the infrared bands observed at 3416 and 1631 cm–1. As shown in Figure 6, calcium can coordinate with the RCO2– group in either the unidentate, bidentate, or bridging structure. In addition, calcium stearate is known to be polymorphous which will also affect the FT-IR spectrum. 17
In general, calcium cations exhibit a strong preference to bind to oxygen atoms. Typically, the calcium cation will bond to both water and RCO2– anions in six, seven, and eight coordinate structures in calcium RCO2– species:
Sixfold calcium coordination with RCO2– is typically unidentate. Sevenfold and eightfold calcium coordination with RCO2– is either unidentate or bidentate. Water is typically present in the calcium–RCO2– species (hydrated salts).
The RCO2– asym stretch of calcium stearate (Figure 7) exhibits two strong distinct bands at 1601 and 1560 cm–1 and a shoulder at 1544 cm–1. These multiple bands derive from different coordination geometries of the calcium–RCO2– species. Calcium stearate is also known to be polymorphous and the crystalline phases may be differentiated by the infrared absorptions in the RCO2– asym stretching region near 1550 cm–1.7,18 The stable crystalline form is characterized by a doublet at 1577 and 1540 cm–1 while the metastable crystalline form results in infrared bands at 1601 and 1562 cm–1.7,18
Conclusion
Stearic acid metal salts are used in a wide variety of applications and can be encountered by analysts when making FT-IR spectral measurements. Due to the characteristic group frequencies and environmental sensitivity of both the RCO2– and CH2 (–CH2–) vibrations, IR spectroscopy is well suited for both routine identification and detailed studies of metal–soap complexes. In this study, the FT-IR spectra are presented of the sodium, zinc, and calcium stearate complexes. A better fundamental understanding of the form of the vibrations of characteristic IR bands of metal–stearate salts is provided by a normal mode analysis of sodium decanoate.
The RCO2– asym and sym stretching frequencies provide information about the metal complex species and their coordination geometry. In the FT-IR spectrum the RCO2– asym and sym stretch doublets separation frequency (Δν) is diagnostic of the metal cation and the coordination structure. The RCO2– asym stretch (1600–1520 cm–1) is particularly useful because it is a strong absorber, provides useful information about the local environment, and is often isolated from the characteristic vibrations of other functional groups. The influence of various polymorphic forms on these characteristic bands adds additional complexity. The environmental sensitivity of the RCO2– stretching frequencies to these factors is shown for the sodium, zinc, and calcium stearate salts.
The IR spectra in the fingerprint region (below 1500 cm–1) are mostly defined by the mechanical coupling of RCO2– and CH2 vibrations. Both the RCO2– sym stretch and the in- and out-of-plane bends are strongly coupled with the CH2 wag and rock vibrations, respectively. Lastly, the mechanical coupling of the CH2 wag with some contributions from CH2 rock and twist vibrations, results in a well-defined progression (1360–1160 cm–1), which is empirically related to the n-alkane chain length.
This report provides a useful summary of the characteristic IR spectral features observed in the FT-IR spectra of sodium, zinc, and calcium stearate complexes. Commercial fatty acid metal salts are utilized in a wide variety of applications and are highly likely to be encountered when using FT-IR for material characterization. For this reason, the analyst should be knowledgeable of their infrared spectral features.
Supplemental Material
sj-docx-1-app-10.1177_27551857241253834 - Supplemental material for Interpretation of the Infrared Spectra of Metal-Stearate Salts
Supplemental material, sj-docx-1-app-10.1177_27551857241253834 for Interpretation of the Infrared Spectra of Metal-Stearate Salts by Peter J. Larkin and Andrew Jackson in Applied Spectroscopy Practica
Footnotes
References
Supplementary Material
Please find the following supplemental material available below.
For Open Access articles published under a Creative Commons License, all supplemental material carries the same license as the article it is associated with.
For non-Open Access articles published, all supplemental material carries a non-exclusive license, and permission requests for re-use of supplemental material or any part of supplemental material shall be sent directly to the copyright owner as specified in the copyright notice associated with the article.