
Abstract
Utilizing a set of spectroscopic techniques, i.e., Fourier transform infrared (FT-IR) in transmission (KBr method), attenuated total reflection (ATR) FT-IR, and micro-Raman, and several characterization methods relevant to the commercial production of E-glass fibers for composite reinforcement has been explored, focusing on four major areas: (i) a possible structure alignment in the fibers formed under high tension and high shear rate, (ii) the network structure difference between the skin and core of fibers, (iii) fictive temperature determination, and (iv) glass homogeneity at a nanoscale. The IR band narrowing observed from fiber samples over bulk samples was identified using the ATR method. The use of FT-IR and micro-Raman techniques enables the identification of higher non-bridging oxygen concentration near fiber skin over the core. A relationship between E-glass fictive temperature and the Raman band shift was established to predict the fictive temperature range of commercial fiberglass products. We present here for the first time a demonstration of a new FT-IR procedure for tracking commercial glass inhomogeneity with sensitivity at the nanoscale. The newly proposed glass homogeneity index (GHI) was shown to be closely related to furnace operating temperature upset and correlated with the average fiber break level during the period.
This is a visual representation of the abstract.
Keywords
Introduction
E-glass and E-CR glass fiber products have been widely used as reinforcements in polymer-based composites, including wind turbine blades, automobile parts, transportation, chemical storage, print circuit boards, etc. 1 The fibers are drawn by using a high-temperature (1200–1350 °C) and high-speed attenuation process, over which the attenuation leads to approximately 1000× fiber diameter reduction after exiting bushing tips in less than a tenth of a second. Depending on the product type (in terms of Tex that is related to the number of filaments in a strand and filament diameter), which dictates the size of bushings used (a platinum box with 200–6000 tips at the bottom for drawing fibers), glass fibers are cooled at various rates in the order of 1 × 10⁵ °Cs−1 and in turn, tensile strength and tensile modulus of the products can vary, excluding the sizing effect (organic coating on the fiber surfaces).2–4 This implies that the properties of fiberglass are affected by its pre-thermal history or fictive temperature (Tf), at which point the glass network structure is frozen.5,6 The effect of fictive temperature on the local environments of glass structures has been studied by Morin and Stebbins 7 and others8–10 using nuclear magnetic resonance techniques, focusing on the temperature effect on the local structures of boron trioxide (B2O3) (trigonal BO3 versus tetrahedral BO4) and Al2O3 (AlOx, where x = 4, 5, 6).
In fiber drawing with a high cooling rate, 2 the fictive temperature (Tf) of a fiber is expected to be much higher than its counterpart produced in a bulk form using a melt casting method, a typical cooling rate of which is in an order of 1–5 °Cs−1 as expected under laboratory condition. The bulk glass should have a lower Tf than its counterpart. Li, et al. 11 studied silica and soda-lime silicate (SLS) glasses (in a rod form) with different Tf and found higher dynamic fatigue resistance in ambient air for both types of glass rods with higher Tf. In liquid nitrogen, with the absence of moisture water, silica glass rods with higher Tf also exhibit higher strength. 11 Kim, et al. 4 studied a set of CaO–Al2O3–SiO2 (CAS) baseline glass fibers with the substitution of divalent oxides (MgO, ZnO, and MnO) for CaO and CaF2 for CaO. Overall, fiber strength (σf) increased as fiber diameter ϕ decreased; the opposite trend was reported for fiber Young's modulus (Ef), i.e., fibers showed higher Ef as ϕ increased. Theoretically, σf should be proportional to Ef based on Griffith's fracture mechanics of a solid. However, fiber strength is sensitive to the population of fiber surface defects. Pahler and Bruckner 12 pointed out that fibers with smaller diameters lead to lower surface defect populations; according to Weibull statistics of fracture mechanics, finer fibers should exhibit higher tensile strengths. Concerning fiber drawing-induced network orientation, the researchers 12 further reasoned that at the same temperature, to achieve finer fibers, a higher drawing tension, and higher fiber cooling rate must be applied in the process, resulting in more opened network structures (lower density) or the structure with higher fictive temperature. Furthermore, the high-tension fiber drawing process was shown to induce the alignment of network structures for both E-glass fiber and phosphate-based glass fibers and the corresponding variations of both Young's and shear modulus, especially the latter. 12
The effect of cooling rate on the fictive temperature of SLS glass (in a plate form) has been studied by Tomozawa and Lee 6 using the IR reflectance method and found that SLS with a higher cooling rate exhibited lower Tf near surface (or skin layer) comparing with the bulk of glass annealed. Furthermore, the cooling rate affected the skin layer thickness, thinner for the glass plate treated under a higher cooling rate. Agarwal and Tomozawa 5 have established calibration curves between Tf and reflectance IR band near 1100 cm−1 for both silica and SLS glass and found that the IR band shifted in an opposite direction as Tf of the glasses increases because of the different glass density response to Tf, i.e., a higher Tf increases the SLS glass density but decreases silica glass density.
The above studies provide a basis for conducting the present work to explore the potential use of Fourier transform infrared (FT-IR) or Raman spectroscopic techniques to accomplish four objectives relevant to fiberglass production control and product development, namely (1) structure alignment of fiberglass formed under high tension, (2) network structural difference between fiber surface skin and core, (3) calibration of glass fiber fictive temperature, and (4) characterization of commercial glass homogeneity at a molecular scale.
To address the first objective, FT-IR in a transmission mode by using the KBr method, IR(KBr) in short, was chosen to probe fiber and bulk glass samples. Near wavenumber 1050 cm−1, the IR bandwidth narrowing for fiber samples was observed, compared with the bulk glass. The finding implies that the fiberglass structure becomes a more “ordered” network under unidirectional tension. Other researchers have shown a likelihood of “structure alignment” in fibers drawn at high speeds or under high tensions.4,12,13
The second objective was accomplished by analyzing the differences in the IR bands dominated by structural groups; it was done by comparing the spectra acquired from IR (KBr) and ATR (attenuated total reflectance). The former collects glass structural information primarily on the bulk glass, whereas the latter probes more structural information on the fiber skin or near fiber surfaces. As detailed later, this study shows that the fiber skin contains more non-bridging oxygen than the bulk glass. Independently micro-Raman spectroscopic technique was used to probe the fiber surface and core to substantiate the findings from the IR studies.
Besides the use of the FT-IR reflectance method for measuring Tf of silica and silicate glasses5,6 the use of the Raman technique measuring Tf of silica and silicate glasses was also reported in the literature.14–17 To accomplish the third objective, the micro-Raman spectroscopic technique was used to determine the relationship between the glass network vibrational band position and the fictive temperature of the glass samples heat-treated at specific temperatures. As detailed later a calibration curve was successfully established for CaO–Al2O3–SiO2 based E-glass using the T–O–T band position near 485 cm−1. 16 The correlation follows the Tf calibration curve of SLS glass derived from IR reflectance measurements, using the structural band near 1100 cm−1, 5 that is, the structure band position shifts to a higher wavenumber as the sample Tf increases.
In commercial fiberglass production, composition measurement, for example, X-ray fluorescence or wet analysis using inductively coupled plasma (ICP) or titration, of glass collected from a furnace or bushing position has been routinely performed, which provides feedback, as one of process-related parameters, guiding the furnace operation control. The methods require a 10–20 g sample, which is much larger in volume than a single fiber near a bushing tip at the break by 1000× or greater. Other methods include the Shelyubskii method, which is that index dispersion of glass in a reference refractive index oil through a monochromatic light scattering,18,19 and chemical striations of glass using Fourier transformation in optical imaging. 20 The above volume-based averaging method cannot directly relate to any possible local variations causing fiber to break at bushing tips; therefore, fails to identify the source of the problems, i.e., fiber breakage during a special operation event. Microcrystal-induced fiber breakage can be found by visual observation. The origin of microcrystal formation, however, often remains unclear. It prevents production from determining an effective way to mitigate the microcrystal-related beading promptly.
It is well known that fiber breakage is a complex problem; key factors are glass chemistry stability including iron oxidation state (which is related to both batch chemistry and melt residence time for fining), Furnace temperature settings including melt foaming stability, forehearth temperature setting in conjunction with bushing types for different products, winder speed, fiber cooling, etc. Facing such complex issues, it is nearly impossible to identify the most influential factors among them during a special production period when fiber break surged. However, in this current unique case, the problem has been substantially reduced into an apparent single dominant factor, or the furnace temperature reduction. In this special case, facing the surge of fiber breakage without the changes of the batch formulation or chemistry and the fiber-forming conditions, a long-standing question on fiber breakage over the decades resurfaced: “Does the glass from the furnace have a good homogeneity?” or “is the surge of fiber break related to poor glass quality from the furnace?” Despite endless attempts made in the past, covering glass composition, viscosity, liquidus temperature, and iron redox, the existing analytical methods have been proven incapable of answering the question. All tests have a common feature: the sampling volume of the sample is at a macro scale whereas the problem is at a micrometer or submicrometer scale.
To accomplish the fourth objective, a new, highly sensitive technique/method is required, plus the sampling volume of the glass must be comparable to the volume of the molten glass existing in a bushing tip (in a milligram). Both FT-IR and Raman spectroscopic methods can fulfill the above requirements for exploration. For a typical laboratory setting in a glass manufacturing plant, the FT-IR spectrometer provides several superior advantages over the Raman spectrometer for its broader availability and substantially lower capital investment. The ATR method could be a better choice for measuring pure glass samples in a fraction of a milligram without the interference of KBr as used by the IR(KBr) method. Due to our laboratory limitation, the IR(KBr) method was chosen. As detailed in this article, a glass homogeneity index (GHI) was proposed upon the successful demonstration of its high sensitivity in probing the presence and absence of “crystal-like nanostructures” as well as microcrystals before, during, and after a furnace operational “upset” during which a surge of fiber breaks took place. GHI is shown to exhibit a positive correlation with fiber break level and is preliminarily affected by furnace temperatures and furnace throughput. To the best of our knowledge, there is no literature report utilizing the FT-IR technique to track the glass quality, especially in commercial glass productions. The established procedure can also be utilized to track other commercial glass productions. ATR and Raman spectroscopic methods can be further explored equally; our equipment availability has constrained the GHI investigation using the IR (KBr) method.
Experimental
Materials and Methods
This study covered commercial E-glass (A, B) and E-CR glass compositions, with and without boron (Table I). According to ASTM specification, E-glass refers to the family compositions primarily composed of calcium oxide (CaO), aluminum oxide (Al2O3), and silicon dioxide (SiO2) with and without boron, whereas E-CR Glass refers to the boron-free, modified compositions. Detailed chemistry of the glass samples is confidential; major oxides, measured by using the calibrated X-ray fluorescence (XRF) method, are listed in mol%, in which “others” contain small quantities of iron oxide (Fe2O3), titanium dioxide (TiO2), strontium oxide (SrO), and zirconium dioxide (ZrO2) from the impurities of the raw materials.
Major oxides (mol%) in E-glass and E-CR glass.

Table II details the samples used in this study (mostly from commercial productions), which are divided into two series, Series I for E-glass A samples with boron and Series II for E-CR Glass samples without boron. As depicted in Figure 1, in Series I, both commercial fibers and glass beads from several specific bushing positions (free fall glasses in a bead form from production busing tips under a head pressure of the Forehearth) were collected. Fiber samples were formed under an extremely high shear rate and the beads were generated under a very low shear rate and should be treated as a bulk glass. For Series II, both fibers with and without post-treatment were examined. The former represents samples formed under a very high shear rate as well as a very high cooling rate or high fictive temperature, whereas the effect of quenching has been removed by annealing the fibers at the glass transition temperature, near 700 °C for 2 h, and in turn, the samples should be considered to have lower Tf values. Although commercial fibers contain organic sizing, i.e., organic coating on fiber surfaces, sizing removal by heat treatment was not considered to preserve the original fiber forming history. As shown later, there are no IR bands associated with organic materials from the IR (KBr) measurements.

Both commercial fibers and glass beads from several specific bushing positions (free fall glasses in bead form from production busing tips under a head pressure of the forehearth) were collected and specific information of the samples is provided in Table I.
History of E-glass fiber and glass samples with and without boron.

In the evaluation of commercial glass (Series III or E-glass B) homogeneity before, during, and after the furnace upset, each glass patty weighed approximately 300 g, which was air-cooled by pouring the melt onto a steel plate without any special treatment. Each sample, approximately 2 g, was randomly selected from a broken patty and then pulverized using a tungsten carbide disk mill for 30 s. The particle size is less than 45 μm.
For the IR (KBr) test, each sample was prepared by adding approximately one-part of glass powder into at least 10 parts of KBr salt (less than 1 mg by weight) and grinding the mixture using agate mortar and pedestal for 1 min. The sample disk was subsequently prepared by pressing the mixture in a stainless-steel die under 1.5-ton force for 2 min. Each pressed, semi-transparent disk was immediately scanned using a Perkin-Elmer FT-IR spectrometer between 400 and 4000 cm−1 at 1 cm−1 stepping intervals. The measured spectrum has a resolution of 0.5 cm−1. The final spectrum was generated from an average of eight scans. Before the measurement, the background correction of the instrument was carried out.
Earlier, the reproducibility of the FT-IR (KBr) method was checked in triplicates; one set was done on the same day when the powder samples were prepared, and another set was carried out a week later. Although the KBr is sensitive to the variation of laboratory moisture, the normalized IR spectra with a spectral background correction showed good reproducibility of the vibration bands of the structural groups of the glass network. The glass powder samples showed no detectable moisture absorption from the ATR measurements; no hydroxyl vibrational band(s) were detected (Figure 2a).
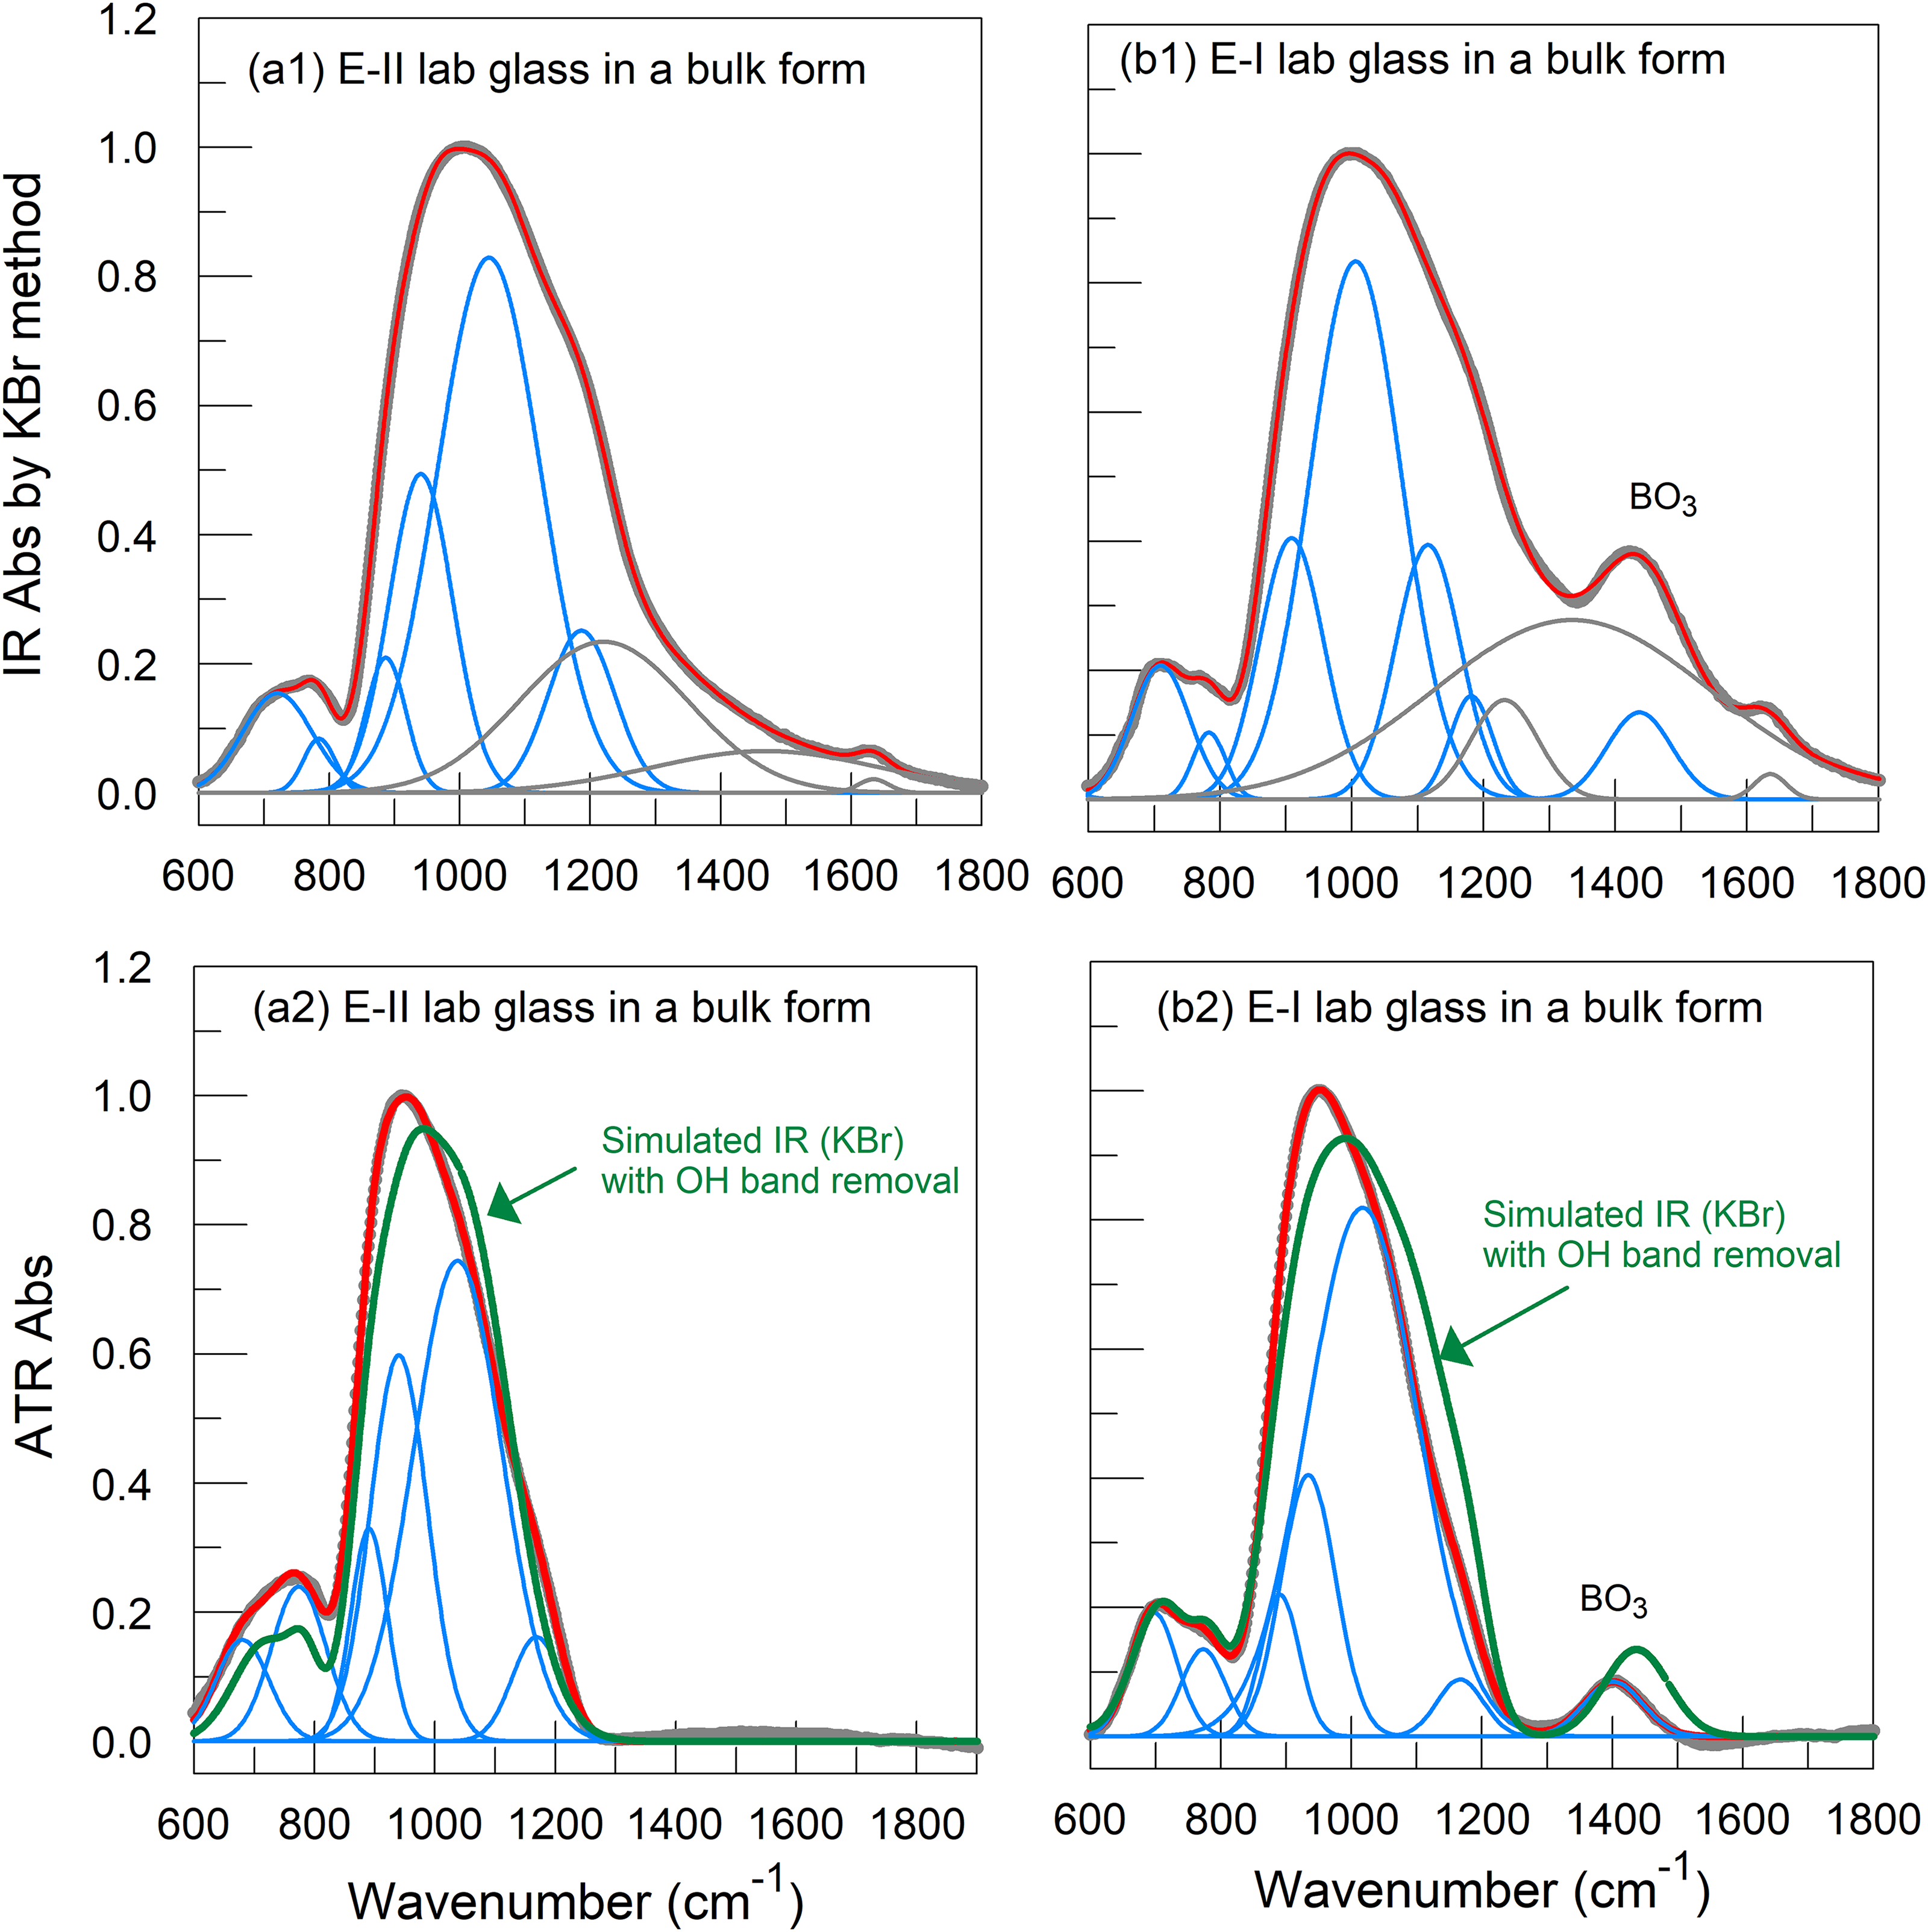
IR (KBr) spectra of the bulk glass samples with and without boron (II-9 and I-2 respectively) are depicted. Vibrational modes of three hydroxyl groups (in gray lines by simulation) coexist, which in turn, broaden the spectra (a1, b1), comparing with ATR spectra of the counterparts using pure glass powders (a2, b2).
For the ATR test, a FT-IR universal attenuated total reflectance (FT-IR-UATR) sensor (Frontier, PerkinElmer Inc.) was used. IR spectra of the same sets of pulverized glass samples were acquired between 400 and 4000 cm−1 with an interval of 2 cm−1 at a resolution of 0.5 cm−1; the final spectrum was obtained from an average of 16 scans. The instrument is equipped with a diamond window in contact with the glass powder sample. Pure sample powders were used without using KBr. No hydroxyl band(s) were detectable between 1400 and 4000 cm−1.
Raman spectra of the selective glass samples (fiber and bulk) were acquired using a micro-Raman (Witec Alpha 300R) spectrometer with laser excitation at 532 nm over the range between 100 and 4000 cm−1 and a step size of 2.75 cm−1. The laser power at the sample focal point is estimated at 45 mW. The local laser-induced sample heating is assumed to have a negligible effect on glass composition in 2 min of test duration. In our study, the 532 nm laser focal point is approximately 0.4 μm in depth, plus a lateral resolution of 10 nm for using a 50× object. Each spectrum was averaged from five scans, and each had a total of 120 s exposure time. Two spectra per sample were acquired, one near the fiber surface (<2 μm from the edge of the fiber cross-section) and another from the fiber core region (approximately 6 μm from the edge). The filament diameter of the samples was approximately 12–15 μm.
For the glass homogeneity study, the IR(KBr) method was used. The uncertainty, in terms of three standard deviations of the measured intensity of the band near 500 cm−1, was determined to be 0.06 by using 14 glasses collected during a stable operation over 14 h of a given day, which showed no composition change from the calibrated X-ray fluorescence measurements. As will be discussed later, the band intensity defines the glass inhomogeneity index (GHI).
Results and Discussion
IR (KBr) Versus ATR
Before detailing the results from the IR(KBr) and ATR measurements, it is worth discussing the characteristic differences of the IR spectra acquired by using the two techniques. An obvious difference in their IR spectra is shown in Figure S1 (Supplemental Material). KBr is hygroscopic and its moisture update is sensitive to the laboratory humidity. IR(KBr) spectrum of the same glass (from Series I, E-glass A containing boron) exhibits three distinct hydroxyl bands near 3440 cm−1 (symmetric stretching mode of OH in molecular water), 1630 cm−1 (bending mode of H–O–H of molecular water), and 1400 cm−1 (possible overtone or combination mode of the bending mode) according to the literature. 21 On the other hand, the IR band near 1400 cm−1 may also be related to either the asymmetric stretching mode of C–O bonds of the potassium carbonate on the KBr particles or the asymmetric stretching mode of the C=O and C–bonds in H2CO3. Considering their intensity proportional to the vibrational modes of the molecular water species, near 1630 and 3440 cm−1, some weak acid species may form when grinding KBr powder in the air. The intensity of the three hydroxyl bands is well correlated with each other; the correlation coefficient (R2) is 0.93 and 0.85, respectively (Figure 2b). The lower R2 value between the bands at 1400 and 3440 cm−1 is due to an interference of the vibrational mode from the trigonal boron–oxygen units near 1400 cm−1 for E-glass A with 6.0 wt% B2O3. On the other hand, the ATR spectrum of the same glass without using KBr exhibits no detectable hydroxyl bands; the hydroxyl groups in the glass cannot be detected. As a result, the band near 1400 cm−1 from the trigonal BO3 units 22 is revealed clearly. Therefore, the IR spectra, independent of the method, will be confined between 400 and 1500 cm−1 for analysis.
The IR (KBr) spectroscopy is a volumetric method used to probe the averaged glass network structures in bulk glass, such as beads or glass collected from the furnace. This is also true for probing a glass fiber with a much greater surface. Independent of the instrumentation method, the ATR spectrum of the bulk glass sample in powder form should also reflect the averaged glass network structures as IR(KBr). In this study, the ATR probing depth, for the diamond window used, is 1.66 μm as specified by the instrument. Even if a fiber sample was ground into fine particles, <15 μm in size, the proportion of the original fiber surfaces from the randomly sampled particles should be significant. The probability of the signals collected from the fiber surface skin, approximately 1.66 μm, defined by the instrumental probing depth, should be greater. It follows that the ATR spectrum of a fiber sample ought to contain significant information on the glass structures of the fiber skins relative to the fiber core region, which will be discussed further.
Figure 2 depicts IR (KBr) spectra of the bulk glass samples with and without boron (II-9 and I-2, respectively). Vibrational modes of three hydroxyl groups (in gray lines by simulation) coexist, which in turn, broaden the spectra (Figures 2a1 and b1), comparing with ATR spectra of the counterparts using pure glass powders (Figures 2a2 and b2). To remove the effect of hydroxyl groups on the position(s) of the IR (KBr) band between 800 and 1800 cm−1, it is necessary to first separate the hydroxyl bands from the measured IR (KBr) spectra, using the curve fitting procedure discussed next.
The spectrum fitting, using commercial software (GRAMS/AI, Thermo Fisher Scientific), was carried out by using a conventional procedure standardized by Mysen et al. 23 For IR spectra of Series I with boron, between wavenumber 600 and 1800 cm−1, seven Gaussian bands were determined according to the spectrum characteristic shapes and literature–literature reported band positions (see Supplemental Material). For IR (KBr) spectra of the Series II without B2O3, six Gaussian bands were selected. The difference between the two sets is the band near 1400 cm−1, representing the vibration mode of BO3 units 22 for Series I. In all cases, without any restriction of the bandwidth and position, the curve fitting process converged within 100 iterations by minimizing the χ2 value as recommended in the literature. 23 It should be noted that for IR (KBr) spectra, vibration modes of hydroxyl groups from the KBr host matrix were also simulated to remove them later to construct a new spectrum, which can reduce the interference of the hydroxyl groups. However, the uncertainty in selecting the hydroxyl bands in the deconvolution process remains. For IR (KBr) test alone, the interference of the hydroxyl bands can be ignored when comparing the fiber sample with its bulk form. The overall simulated spectra fit the measured ones closely for the IR (KBr) part (Figures 2a1 and b1). The same procedure (six Gaussian bands for II-9 and seven Gaussian for I-2) was also carried out to simulate ATR spectra. The overall simulated ATR spectra also closely match the measured spectra (Figures 2a2 and b2).
For both Series I and Series II samples, the summary of the band positions from the curve fitting is summarized in Table S1 (Supplemental Material). Their plausible structures are based on the position batching. It is realized that possible borate vibration modes may exist in the measured spectra for Series I samples but are not well resolved due to the dominance of silicate vibrational modes in the spectra, except for the band near 1400 cm−1. On the other hand, Series II without boron showed similar band positions (Table S1, Supplemental Material). It is reasonable to assume the contribution of the borate vibration modes to the overall spectra is negligible. Additional discussion is provided in the Supplemental Material.
According to the literature,13,14 the band near 1050 cm−1 from IR (KBr) measurement should be the same as the band near 945 cm−1 from ATR measurement; both represent the same set of vibration modes from silicate groups.24–27 The apparent difference presumably comes from the optical artifact of the ATR measurement.24,25 We should note that the effect of the hydroxyl band on the 1050 cm−1 band position from the IR (KBr) measurement will be evaluated next.
By removing the hydroxyl groups, the newly simulated IR spectra from IR (KBr) measurements were compared with the measured ATR spectra of the counterparts (cf. Figure 2a2 and b2). The newly simulated IR(KBr) spectrum of II-9 bulk glass closely resembles the measured ATR spectrum of its counterpart. The intensity difference comes from the uncertainty of simulating hydroxyl groups. The newly simulated bands are located near 990 cm−1 for II-9 and I-2 (cf. Figures 2a2 and b2). The 945 cm−1 band from the ATR measurement of the counterparts ought to be at 990 cm−1 should the alleged optical artifact be removed as discussed in the literature.24,25 On the other hand, if the hydroxyl bands from KBr did affect the overall IR spectrum, the 1050 cm−1 band would be located at approximately 990 cm−1. Should the reasoning hold, the adjusted ATR band near 990 cm−1 should be treated the same as the newly adjusted IR (KBr) band near 990 cm−1.
For the band near 800 cm−1, the newly simulated IR (KBr) spectra show no shifts (Figure 2a2 and b2). The alleged optical artifact in this case is not apparent. For the band near 1400 cm−1, the BO3 band shift can be attributed to uncertainty in the simulation of the hydroxyl contributions because the BO3 band overlaps with the hydroxyl group.
For a bulk SLS glass, previous studies,28,29 showed that the IR band near 910 cm−1 from a specular reflectance measurement ought to be the same as the IR(KBr) band near 1030 cm−1. The apparent band shift of 120 cm−1 was reasoned by the glass refractive index change as a function of wavenumber, i.e., an optical artifact.28,29 For CAS glass (E-glass) of this study, by comparing bulk glass spectra from IR (KBr) and ATR measurement, the band shift from the alleged optical artifact (if true) would be 55 cm−1 without a correction for hydroxyl group effect on the band position near 1050 cm−1, significantly less than the reported value for SLS glass.
E-glass fibers exhibit bands near 1050 cm−1 from IR, i.e., KBr measurements and 940 cm−1 from ATR measurements independent of the glass composition as illustrated in Figure S2 (Supplemental Material); the spectra were acquired using ATR and FT-IR (KBr) methods for glass fiber samples with (I-1) and without (II-1) boron. While the fiber core shows the same band position as bulk glass from FT-IR (KBr) measurement, the spectra of fiber skins show approximately 5 cm−1 down shift compared with bulk glass at 945 cm−1 from the ATR measurement. While the alleged optical artifact affects the band shift to be the same for bulk and fiber samples, i.e., the optical artifact being “canceled” when comparing within the ATR method, the downshift by 5 cm−1 between fiber skin and fiber core suggests that on the average, fiber skin contains a higher proportion of nonbridging oxygens (NBOs) than the core region. The findings were further validated by the micro-Raman study as detailed later.
The bands, near 700 cm−1 for I-1 fiber with boron and near 800 cm−1 for II-1 fiber without boron, respectively, show little change in the positions between the two methods. For the I-1 fiber sample, the overall band near 700 cm−1 is possibly composed of vibration modes of BO4 and AlO4 units according to the literature.22,24–26,29 For the II-1 fiber sample without B2O3, the band should come from the contribution of AlO4 units. 29 Between the fiber surface skin and the core, the stability of the band position suggests that the mixture of BO4 units and AlO4 units for the I-1 fiber sample and AlO4 units for the II-1 fiber sample are similar.
Based on the ATR spectrum of each sample, over the sample storage period of less than one month, the hydration of sample particle surfaces was not detectable, which supports that vibrational modes of the hydroxyl groups come from the KBr host matrix because of its hygroscopic nature. All powder samples were stored at Room temperature in plastic bags without vacuum. As discussed earlier, glass powder samples in the storage did not absorb additional moisture that was detectable in the ATR measurements.
Infrared (KBr) Characteristics of Bulk and Fiberglasses
Figure 3 depicts IR(KBr) spectra of Series I samples between 600 and 1500 cm−1, examining the characteristic difference of the spectra between the fiber samples produced under a high shear rate and the bead samples under a lower shear rate, which were collected from different bushing positions. The forehearth and bushing temperatures were maintained stable in production for all cases.
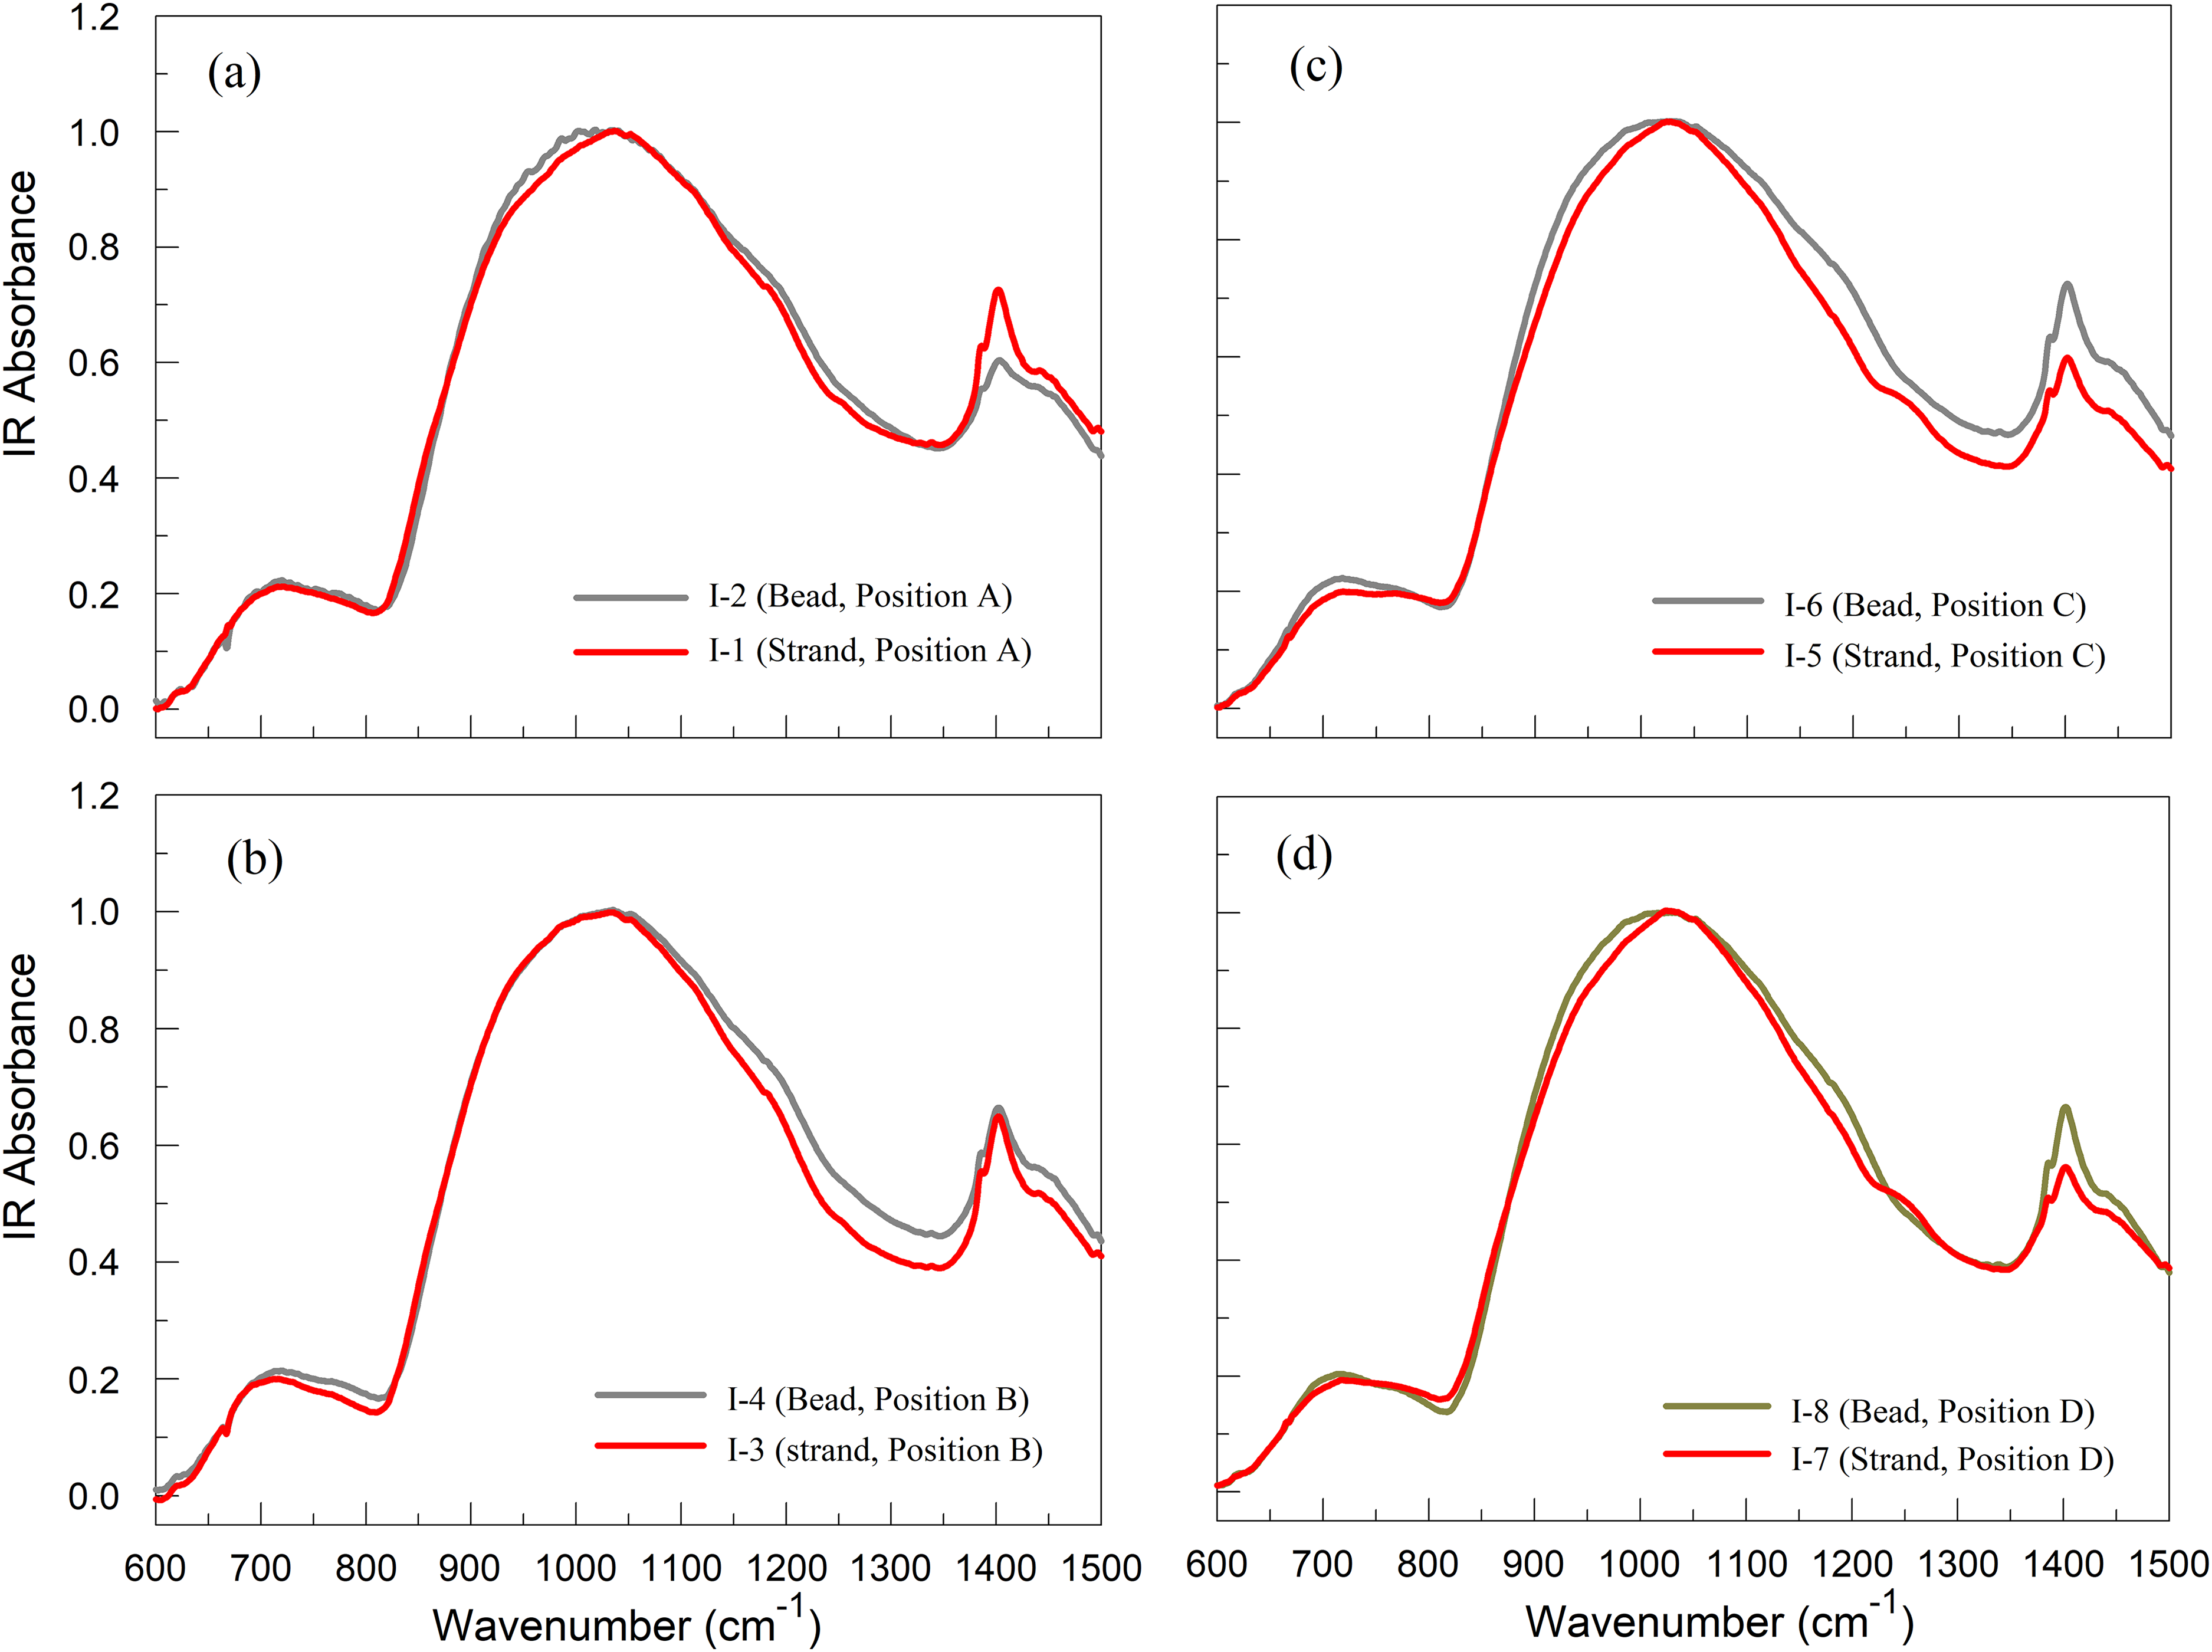
IR(KBr) spectra of Series I samples between 600 cm−1 and 1500 cm−1 examine the characteristic difference of the spectra between the fiber samples produced under a high shear rate and the bead samples under a lower shear rate, which were collected from different bushing positions. The forehearth and bushing temperatures were maintained stable in production for all cases.
The overall band between 800 and 1300 cm−1 shows slightly narrower widths for the fiber samples than the beads (bulk glasses). The overall band represents the total distribution of various active vibration modes of primarily Q n groups (where Q and n represent the SiO4 tetrahedra unit and the number of bridging oxygens per SiO4 unit, respectively) for the alkaline earth aluminosilicate glasses.24–26,30–36 Table S1 (see Supplemental Material) provides the IR and Raman band assignments to plausible glass structures for convenience. The sharp band overlapping with a broad band near 1400 cm−1 comes from the hydroxyl group of KBr (cf. Figure 3). The part of the 1400 cm−1 band can be assigned to the vibration mode of trigonal BO3 groups.22,34,36
For Series II samples the IR(KBr) spectra between 600 and 1500 cm−1 are shown in Figure S3. The samples have various thermal and forming histories (Table II). As shown in Figure S3a and b (Supplemental Material), the spectra of the commercial fibers as-received (II-1, II-3) exhibit the narrowest width of the band between 800 cm−1 and 1300 cm−1, whereas the bulk glass (II-8) shows the broadest bandwidth. The commercial fiber after annealing shows the bandwidth between the two end conditions. Figure S3c (Supplemental Material) shows a similar trend of the bandwidth differences, i.e., narrower for fiber samples (II-5, II-6) manually drawn from the melt directly, for the sample portion closer to the beginning of the fiber drawing process (II-6 in Figure 1) or the sample portion at the end of the drawing (II-5 in Figure 1). Based on the manual fiber drawing process, in which a silica rod was dipped into the molten glass to initiate single fiber updrawing, it is expected that II-5 sample experienced a higher shear rate at the end of fiber drawing as compared with the shear rate for II-6 sample at the beginning of the fiber drawing. Figure S3d (Supplemental Material) shows IR(KBr) spectra of the bulk glass with (II-8) and without (II-7) heat treatment (ht) at 700 °C for 2 h. There is little change in the bandwidth, implying a lack of any structural relaxation process for the bulk E-CR glass formed without stretching in a particular direction.
In summary, comparing the two sets (fiber versus bulk) with different pre-thermal or drawing histories, there is a general trend of the band narrowing near 1050 cm−1 for fibers relative to the bulk form of the counterparts. It is expected that fiber represents the structure of higher fictive temperature than the bulk form of the counterpart. The network structural distributions should be broader for the fiber over the bulk form of lower fictive temperature. However, the current findings show the opposite trend. The relative IR band narrowing of the fibers can only be explained by the plausible network alignment induced by the high-tension fiber stretching process. Indirect supporting evidence can be found from the relative IR band broadening of the heat-treated fibers at elevated temperatures as shown in Figure S3a–c (Supplemental Material). Even if the heat-treatment temperatures were lower than glass Tg, structural relaxation is expected in E-glass fibers according to a literature study of similar boron-containing E-glass fibers. 37 Concerning the network structural relaxation kinetics, the rate of the aligned structure network by fiber stretching during the drawing process is faster than the recovery rate of the fiber-stored enthalpy according to the literature. 38 Furthermore, as shown in Figure 6(d), the heat treatment affected the bulk glass structure little.

ATR spectra of Series I samples of the same composition with boron compare fibers drawn under high tension and high cooling rate with the bead samples formed under the forehearth head pressure without tension and lower cooling rate. Both fibers and beads are collected from the same bushing positions, respectively. Relative to the beads with the band near 960 cm−1, all the fibers exhibit the band downshift to lower wavenumber by 15 cm−1 to 30 cm−1.
ATR Characteristics of Bulk and Fiberglasses
Figure 4 depicts the ATR spectra of Series I samples of the same composition with boron, comparing fibers drawn under high tension and high cooling rate with the bead samples formed under the Forehearth head pressure without tension and lower cooling rate. Both fibers and beads are collected from the same bushing positions, respectively. Relative to the beads with the band near 960 cm−1, all of the fibers exhibit the band downshift to lower wavenumber by 15–30 cm−1.
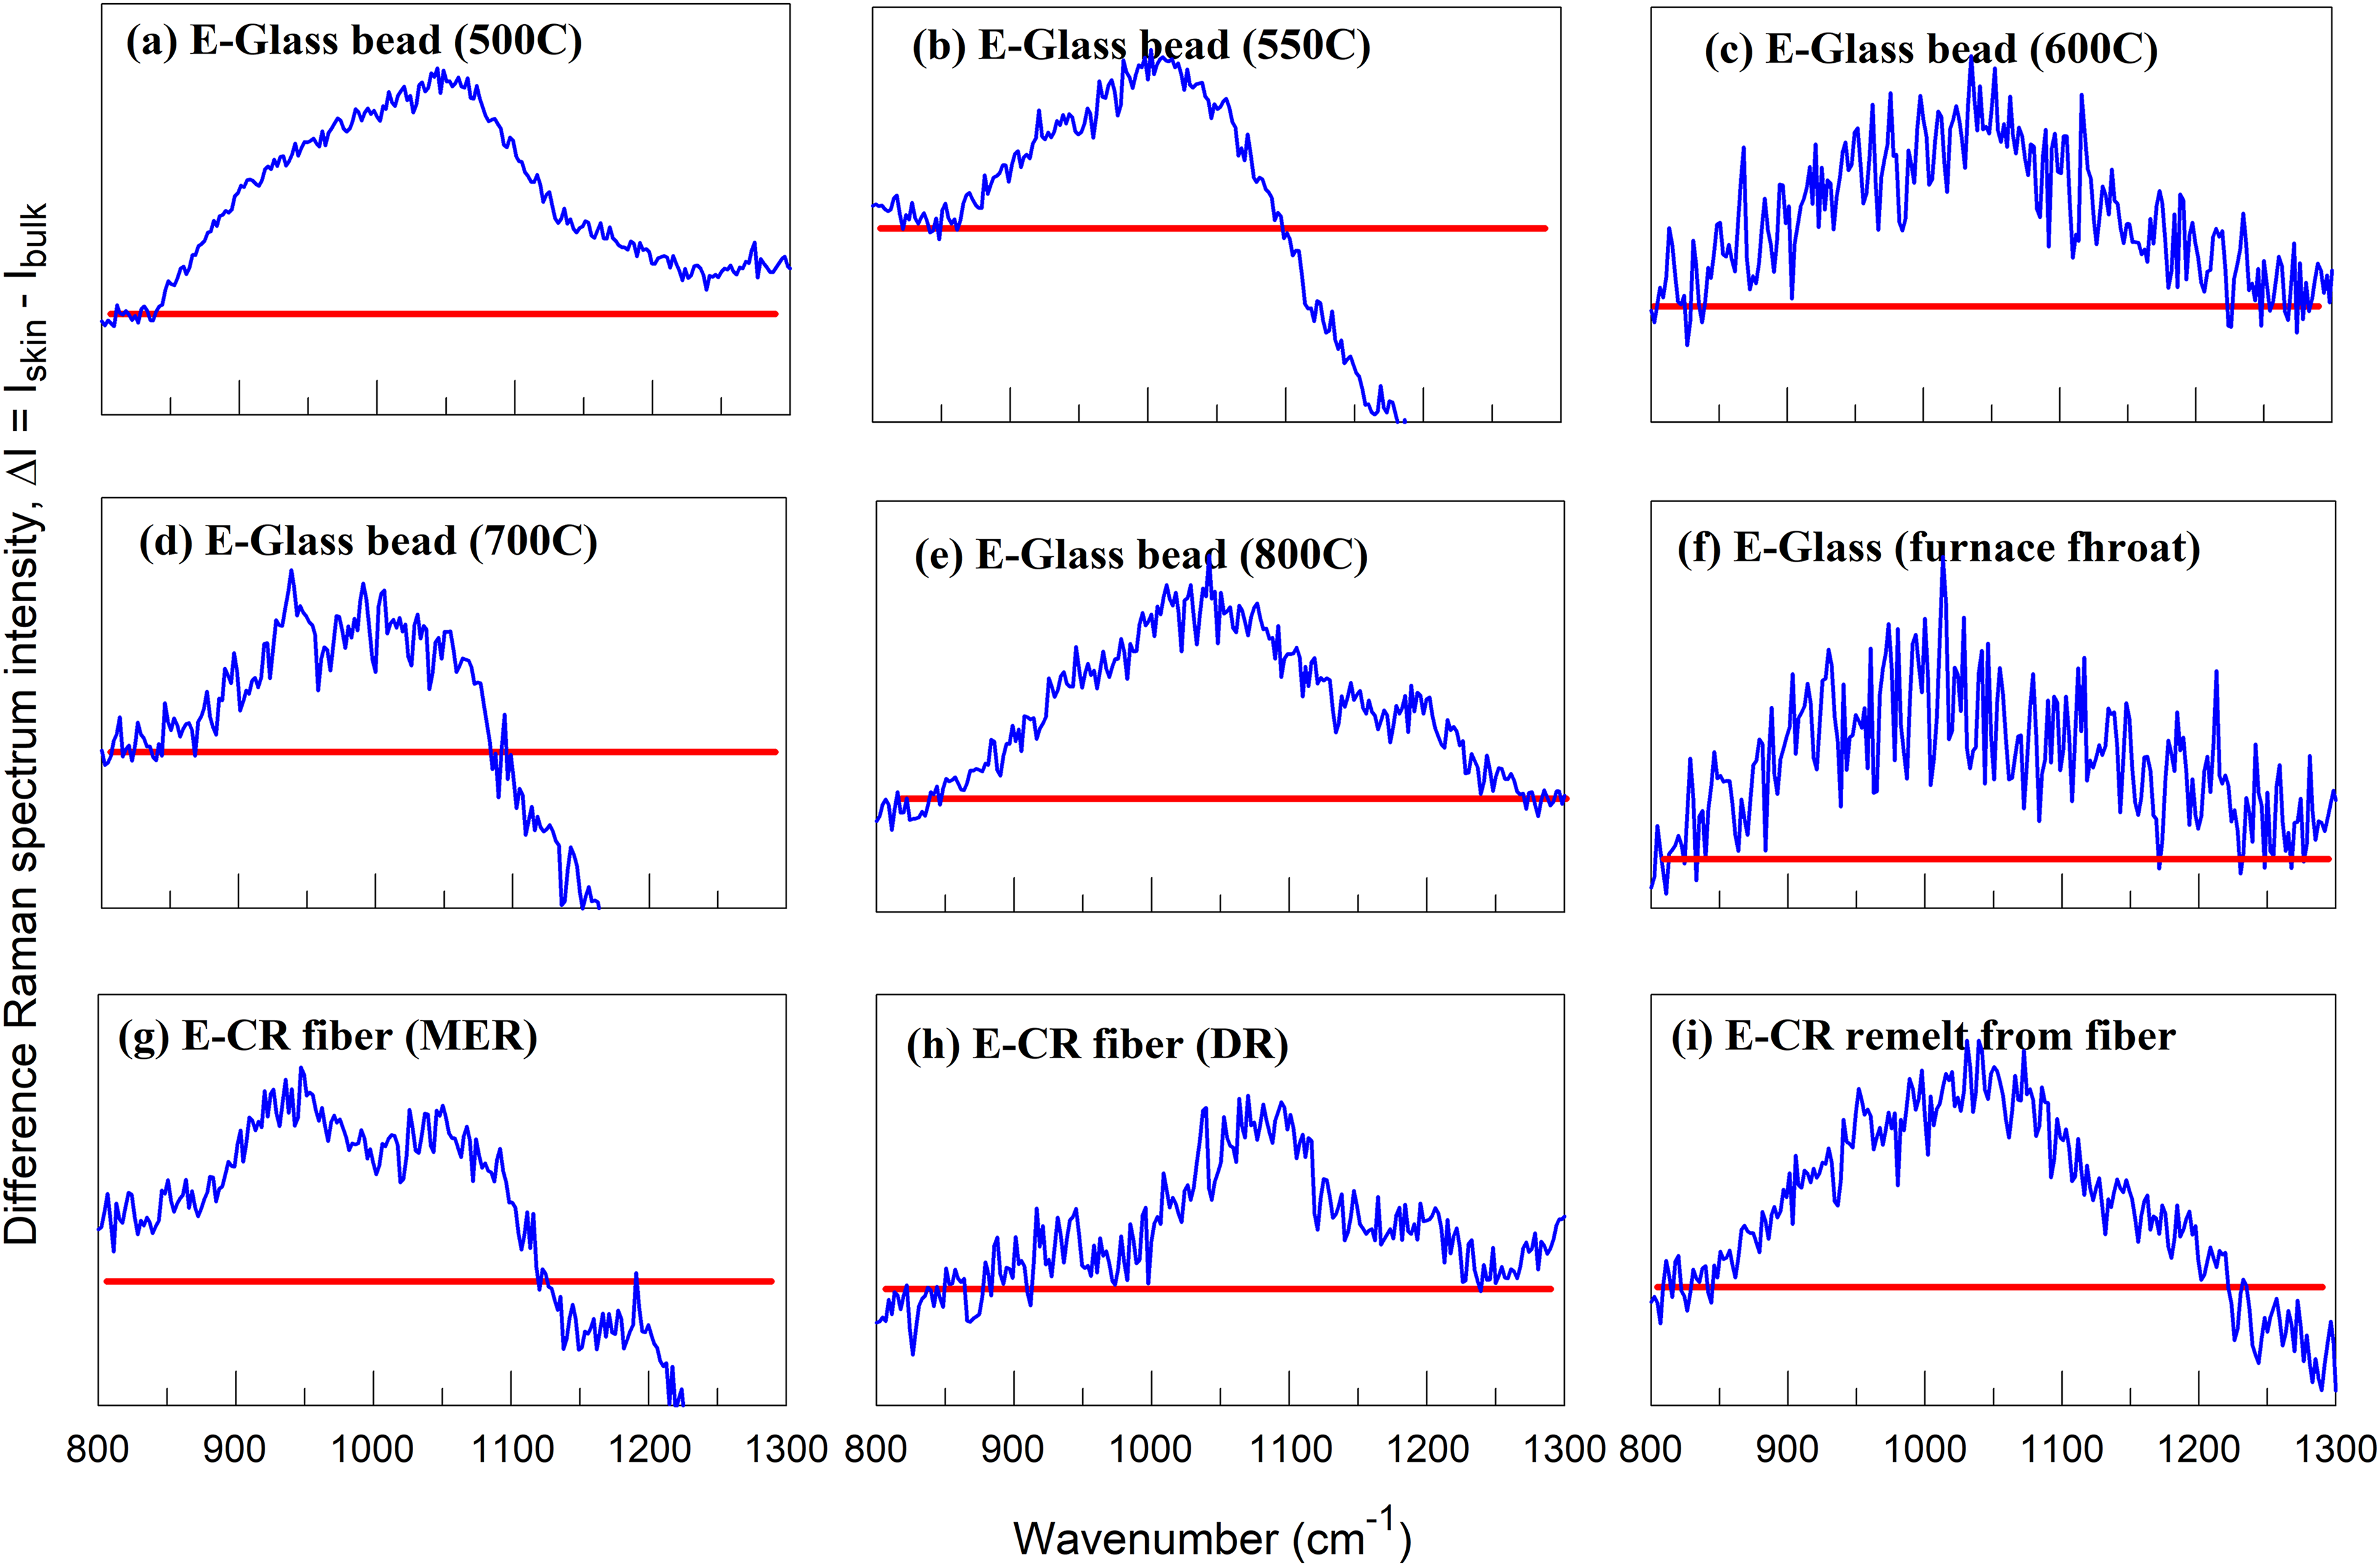
Differential Raman spectroscopic analysis (DRSA) between the surface skin of the samples (fibers, beads, and bulk glass) and their corresponding core regions are shown. MER: multi-end roving product, DR: direct roving product. Horizontal line represents zero intensity change.
Should the alleged optical artifact exist, it would affect both sample types to the same degree in the ATR measurements. Therefore, the relative band downshifts suggest a real difference in their structure distributions because of their vast difference in glass forming. Three plausible network structural differences between the fiber skin and core can be postulated. First, structures of the fiber skin can be altered because of the surface boron evaporation. Secondly, the hydrolysis of the fiber surface is expected because of water spray in cooling fibers. Lastly, the fiber surface response to high-tension stretching and fast frozen-in structure could differ from the core.
The IR band downshift suggests that more non-bridging oxygen was created in the fibers than in the bulk. For fiber samples, assuming the high-tension stretching affects the fiber surface and core structure the same and the born evaporation from the fiber surface is negligible at the forming temperature (see BO3 band intensity near 1400 cm−1 in Figures 4a–d), plus no boron evaporation for the boron-free fibers, the hydration of the fresh fiber surfaces likely plays the key role in generating more NBOs than the core following the reactions, i.e., 2(SiO2)fiber surface or (B2O3)fiber surface + (H2O)vapor → (
The ATR spectra of Series II samples of the same composition without boron are shown in Figure S4 (Supplemental Material), investigating the combined effect of high tension and temperature on fiberglass network structure, with and without heat treatment. Band downshifts of 7–12 cm−1 exist for the fiber samples with and without heat treatment relative to the bulk glass (Figures S4a–c, Supplemental Material). The band narrowing from ATR measurement for fibers relative to the bulk glasses is still detectable, but not as apparent compared to IR(KBr) of the counterparts (Figures 4a–c). For the bulk glass, there is no band shift, nor band narrowing, before and after the heat treatment (Figure S4d, Supplemental Material), in agreement with the IR(KBr) finding (Figure 4d). There are noticeable band intensity changes near 770 cm−1 between fibers and bulk glasses, which stay stable for the bulk glass samples with and without the heat treatment or fibers drawn manually.
For the case of a single fiber made by hand drawing with much lower drawing tension than a commercial fiber, the band narrowing is nearly diminished (Figure S4c, Supplemental Material). For the bulk glass with an even lower shear rate (Figure S4d, Supplemental Material), no spectral difference or band narrowing is observed, consistent with the reasoning of the shear rate effect on the glass network, likely related to the degree of the structural alignment under stretching. Furthermore, the smaller downshift of the band near 945 cm−1 in the boron-free fiber case suggests that its hydration is less pronounced in the fiber drawing process.
Raman Characteristics of Fiber and Bulk Glass
Micro-Raman spectra of the samples with and without heat treatment from Series I (beads) and Series II (fibers) were acquired per sample, one near the surface (<2 μm from the edge of the fiber cross-section) and another near the core region (bulk) of the beads (Series I) or fibers (Series II). The spectra are shown in Figure S5 (Supplemental Material). All spectra were normalized by their peak intensities of the bands near 500 cm−1. The band represents the vibrational bending mode of the glass network T–O–T where T = Si, Al, B (Series I), and Si and Al (Series II) according to the literature. For both series, most of the Raman spectra collected from the surface skin shows higher peak intensity near 1050 cm−1 than those of the fiber core regions. According to Raman spectroscopic studies of alkali–silicate, alkali–aluminosilicate, and mixed alkaline earth aluminosilicate glasses,23,30–33 the overall Raman band between 800 and 1200 cm−1 represents a mixture of silicate network groups, Q n (n = 0 to 4, the number of bridging oxygens per tetrahedral SiO4 unit). Specific assignments are detailed in the Supplemental Material.
Figure 5 depicts the differential Raman spectroscopic analysis (DRSA) between the surface skin of the samples (fibers, beads, and bulk glass) and their corresponding core regions. Specifically, the silicate groups of the surface skins contain more Q1, Q2, and Q3 groups and fewer Q4 groups based on their overall peak positions. For the bead samples heat treated at 500 –800 °C, the DRSA bands mostly peaked near 1050 cm−1 (Figures 5a–e). The position is assigned to Q3 of the silicate groups (see Supplemental Material). These bands are typically asymmetric, implying the presence of Q1 and Q2 groups. A similar result is evident for the commercial fiber shown in Figure 5g; the fiber skin contains more Q2 and Q3 near 950 and 1050 cm−1, respectively. The results are consistent and confirm the reasoning for higher NBOs on the fiber skins from the IR analyses, comparing ATR with IR (KBr) spectra discussed earlier. Based on the speciation reaction of silicate groups in the glass network,37–39 Q2 and Q3 do not increase simultaneously from the reduction of Q4 for a fixed glass composition. The only possibility consistent with the simultaneous increase in both structural groups should come from the hydrolysis of the surface skins of the fibers or beads. At high temperature, the melt surfaces of the fiber or bead can instantaneously react with surrounding water droplets from the cooling water spray. For the bulk glasses, such as the sample collected from furnace throat glass, I-11 (Figure 5f) and remelt, II-7 (Figure 5i), the hydration of the original surfaces under the ambient conditions is also expected to generate additional NBOs by forming surface hydroxyl groups, Si–OH or B–OH.

Raman band shift near 485 cm−1 over the bead sample heat-treatment temperature (open circles) shows a linear relationship (solid blue line). The predicted values for bulk E-Glass sample and E-CR fiber samples are represented by the filled circle and filled diamond symbols using the calibration function (shown in the dash blue box with R2 value of 0.986).
Fictive Temperature of Glass Using the Raman Spectroscopic Method
The IR reflectance5,6 and Raman scattering14–17 techniques have been used to measure fictive temperatures of silica and silicate glasses. Because of the potential KBr hydroxyl interference using the IR(KBr) method and the alleged optical artifact from the ATR method, the micro-Raman spectroscopic technique is used to establish a calibration between Tf and a corresponding position of the network Raman band near 500 cm−1 (Figure S5, Supplemental Material).
Figure 6 depicts the heat-treatment temperature (500–800 °C) versus the T–O–T Raman band shift near 500 cm−1 for the I-2 glass bead samples. Since the beads were in contact with the platinum crucible and immediately quenched by dipping the crucible bottom in cold water, the apparent heat-treatment temperatures can be treated as Tf, provided that the glass network relaxation kinetics at the temperature is fast enough to reach its metastable state. For example, from 600 to 800 °C, a linear relationship exists between the apparent Tf and the band position, which follows the same correlation reported in the literature for SSL glass.5,11 On the other hand, at 500 and 550 °C, the trend is reversed, implying that the structure relaxation kinetics are very sluggish, and the glass network retains its structure at higher temperatures than the heat treatment temperatures. In turn, the data were excluded from the Tf –Raman band calibration.
By using a linear least squares regression analysis, the Tf –υf calibration line, from 600 to 800 °C, is established: υf (500 cm−1) = 467.8 + 0.025 Tf with a regression coefficient (R2) 0.986. Applying the calibration function, Tf values of the commercially collected glass from the furnace throat (I-11), commercial fibers (II-1 and II-3), and the glass from fiber remelting (II-7) were estimated using their measured band positions near 500 cm−1 (Figure 6).
The predicted Tf values are 1128 °C for E-glass A and between 1285 and 1330 °C for E-CR glass fibers and the remelt. The predicted range appears to be reasonable as compared with their perspective forming history. For example, the E-glass A from the furnace throat was collected at approximately 1320 °C in an amount of approximately 500 g and cooled naturally in the air; the projected Tf is 1128 °C. For the E-CR fibers (II-1 and II-3), their forehearth temperatures are approximately 1350 °C as compared with their estimated Tf values of 1288 °C and 1328 °C, respectively. The boron-free E-CR glass (II-7) was made at 1500 °C by remelting a mixture of the fiber samples (II-1 and II-3, having the same composition) to make enough volume for our study needs and cooled in the air. Its corresponding estimated Tf is 1228 °C, which is 100 °C greater than the boron-containing E-glass (Series I-11). The difference between II-1 and II-3 fibers likely reflects the effect of their fiber drawing temperatures in making different product types, for which different bushings (multi-end roving versus direct draw product) were used to meet the product specifications (tex and fiber diameter).
IR (KBr) Method Tracking Commercial Glass Homogeneity
Homogeneous glass should have a distribution of randomly disordered structural groups interconnected with one another. From a vibrational spectroscopic point of view, the IR and/or Raman spectrum of a homogeneous glass should exhibit a set of characteristic structural bands. Because of the amorphous nature of the glass network, an overall IR spectrum is broad without sharp transition point(s) over the wavenumber range acquired. On the other hand, the existence of microcrystals, even at a nanometer scale, can create sharp bands (strong or weak) because of their structures and hence, much narrower bands. As a result, such “abrupt” transitions may be detectable. In this part of the study, we used the IR (KBr) method to explore the feasibility of measuring the homogeneity of commercial glasses collected directly from a commercial fiberglass furnace during the period before, during, and after the fiberglass production upset (or higher fiber breakages in the drawing process).
The significant power reduction of the electrical boost system (electrical melting part) at the bottom of the furnace upset the process significantly. Over the entire period, the top combustion input for glass melting increased; but it was insufficient to compensate for the temperature losses at the furnace bottom. No batch formulation change was taken to lower the glass viscosity to mitigate the temperature drop. Forehearth temperatures and bushing temperatures were kept the same and stable. During the period, the fiber break level increased substantially till the electrical boost system was repaired back to its full power output. It is assumed that any characteristic changes observed from the IR spectra of the glasses from the throat should be directly related to the furnace bottom temperature reduction, which in turn made the glass inhomogeneous.
Figure 7 depicts a set of the IR (KBr) spectra of commercial glasses (Series III or E-glass B) collected during the period. The spectra were normalized by their peak intensity near 1050 cm−1. The band shapes of the bulk glass samples collected before and after the furnace upset are featureless or smooth over the entire wavenumber from 400 to 1400 cm−1. However, from the beginning of the upset till a few days after the issue was resolved, the shape of IR bands near 1050 cm−1 exhibited various degrees of depression, especially between 850 and 1050 cm−1. The characteristic change signals the deterioration of glass homogeneity, i.e., the presence of ordered structural groups in the glass as the furnace bottom temperature drops. A few spectra from glass beads containing microcrystals are also included (Figure S6, Supplemental Material). These crystal-containing beads show the highest band depression between 900 and 1050 cm−1. In parallel, the band intensities at approximately 480, 550, 650, and 750 cm−1 also increased for the “inhomogeneous” glasses, especially for the bead samples containing microcrystals. Despite the color difference between the microcrystals, their characteristic IR bands resemble each other (Figure 7).

IR(KBr) spectra of commercial glasses (Series III or E-Glass B) are collected before, during, and after the production upset. The spectra were normalized by their peak intensity near 1050 cm−1. The band shapes of the bulk glass samples collected before and after the furnace upset are featureless or smooth over the entire wavenumber from 400 cm−1 to 1400 cm−1. FT-IR spectra of reference minerals of wollastonite and uvarovite are also included for comparison.
Wollastonite (CaSiO3) is known as a primary phase of E-glass compositions with B2O3. 40 In addition, from E-glass fiberglass production experiences, independent of furnace or glass composition, inclusions of uvarovite (Ca3Cr2Si3O12) microcrystals (Cr from erosion of chrome refractory bricks in contact with molten glass) are known to be one of the primary defects causing fiber breakage. Figure 7 also includes reference IR spectra of both crystalline phases for comparison. By using the band position-matching method, the commercial glass samples likely contain ordered structural units or nanocrystal-like phases that resemble the signatures of uvarovite although it cannot rule out the possibility of structure close to wollastonite. Anorthite (CaAl2Si2O8) phase sometimes can be found in E-glass fiberglass below liquidus temperature, especially for boron-free E-glass compositions. However, there is a lack of IR band matching (not shown) between the crystal-containing bead samples and the anorthite phase.
The outcome of this investigation led to our proposed glass homogeneity index (GHI), which rates the degree of glass homogeneity at a nanoscale. The GHI method offers a higher sensitivity by using less than a milligram of sample for probing, at a molecular level, compared to the method of averaging a large amount of glass samples. While the latter has been widely used in fiberglass production to track and control fiberglass production, in the operational upset situation, it fails to determine whether there is any glass quality issue associated with the upset unless there is a gross change in glass composition.
Based on the band characteristics and the sensitivity responding to the presence of nanocrystal-like structure formation, the use of numerical value based on the 480 cm−1 band intensity appears to be adequate since the intensity of the band near 1050 cm−1 has been kept constant by the spectrum normalization procedure discussed earlier. The reliability of the GHI method was determined by collecting 30 commercial glasses over a 14 h period during a stable production period, which yields a GHI value 0.48 ± 0.02.
As shown in Figure 8, the GHI values during normal furnace operation are consistently near or below 0.5. It becomes significantly greater than 0.5. during the upset, especially for the bead samples containing microcrystals. Furthermore, after the electrical boost system returned to its full power, GHI decreased below 0.5 promptly over a short period. Meanwhile, the fiber breakage is also reduced (shown by the relationship of GHI–Fiber Breakage in the right insert in Figure 8). The production data set over the entire period with and without the upset shows that the fiber breakage is positively correlated with GHI and above GHI 0.525, there is a significant increase in the fiber breakage, plus a wider variation, which implies instability of the fiber forming process as glass homogeneity decreases. In addition, based on preliminary statistical modeling, i.e., GHI is a function of a linear mixture of furnace temperature and production throughput, GHI is predominantly affected by furnace temperatures (confidential information on their actual positions in the furnace) and furnace throughput (confidential information) as shown in the left insert in Figure 8, which compares the measured GHI versus the model predicted GHI. The regression coefficient (RSq or R2) of the model is 0.7, implying that 70% of the observations, or the IR-derived GHI values, can be explained by considering the furnace bottom temperatures and furnace throughput.

GHI values during normal furnace operation are consistently near or below 0.5. It becomes significantly greater than 0.5. during the production upset, especially for the bead samples containing microcrystals. Furthermore, after the electrical boost system returned to its full power, GHI decreased below 0.5 promptly over a short period. Meanwhile, the fiber breakage is also reduced as shown by the relationship of GHI–fiber breakage in the right insert panel. GHI is shown to correlate with furnace temperature and furnace throughput closely based on the statistical analysis as shown in the insert on the left panel. Horizontal axis covers three months of data.
Effect of High-Tension Drawing on the Degree of the Glass Network Structural Disorder
In principle, the transition of the crystalline solid-to-liquid phase of silicates leads to the structure change from a long-range ordering-to-random disorder. For amorphous glass without long-range structure ordering, the molten glass network at a higher temperature, or frozen at a higher temperature (higher fictive temperature in turn), should have broader Q n distributions that result in a broader IR spectrum or a wider Q n bandwidth (n = 4, 3, 2, 1 in this case without 0). FT-IR (KBr) and ATR studies show a general trend that fast-quenched fiberglass samples exhibit slightly narrower bandwidths near 1050 cm−1. The finding implies that the fiberglass network structure formed from the high-tension stretching process, 14 as high as 30% of solid fiber strength, represents some degree of ordering or alignment along the stretching direction, which agrees with the literature findings.4,12–14 Another consideration is that the fiber is formed under an extremely high shear rate (106–107 s−1) according to Yue and Brukner 41 besides high tension.3,42 The combined process results in structure alignment along the fiber's longitudinal direction, which results in the structural band narrowing observed in the current study.
Structural Difference Between Fiber Skin and Bulk Glass
After considering the effects of optical artifact from ATR measurement and hydroxyl interference from FT-IR (KBr) measurement, an adjusted band position of Q n groups is made, both should be close to 990 cm−1 as against 945 cm−1 from ATR and 1050 cm−1 from FT-IR (KBr) for bulk E-glass with or without boron. However, there are little band shifts between the two methods for the band over 700–800 cm−1 and the band near 1400 cm−1. Although the optical artifact from the reflectance study of SLS has been well documented,27,28 for CAS glass (E-glass) families, further study is required to determine whether the refractive index changes substantially as SLS glass27,28 over the same range between 800 and 1200 cm−1.
Using the ATR method alone, for the dominant band of Qn groups near 960 cm−1 of the bulk E-glass with boron, the study shows that there is a 15–30 cm−1 band downshift for the fibers of the counterparts. While the alleged optical artifact affects both measurements the same, the significant downshift implies that fiber skin likely contains more NBOs relative to the core structures. The micro-Raman study of fiber surfaces and cores shows that fiber skin contains more NBOs than the core, confirming the findings from the ATR results. In the current study, we are reasoning that the increased NBOs near the fiber skins come from the hydrolysis of the fiber skin in reaction with cooling water near the bushing tip. The findings are important to fiberglass developers, especially in developing the sizing chemistry of new fiberglass products of new glass compositions. Realizing that a binder directly interacts with fiber surfaces with the modified structures relative to the bulk glass, the developers can devote their attention more to the fiber surface structure differences between different commercial glasses, existing products versus new products of different compositions, to develop and optimize new binders for reinforcement composite applications.
Raman Spectroscopic Method Probing Glass Fictive Temperature
The Raman spectroscopic method has shown its high sensitivity in probing the fictive temperature of mixed alkaline earth aluminoborosilicate glass in a bulk form. In this part of the study, due to the surface complication, the surface data were not used in the fictive temperature calibration work. The use of a newly calibrated relationship, between Tf and Raman vibrational band intensity near 485 cm−1, shows a sufficient sensitivity to the glass fictive temperature change (Figure 7) for E-glass. The predicted Tf values for E-CR fibers of similar chemistries qualitatively follow their melt viscosity differences, i.e., typically boron free-E Glass at 1000 dPa·s (corresponding to reference forming temperature) is higher than the boron-containing E-glass by approximately 110 °C. Furthermore, the predicted Tf difference between II-1 and II-3 is within 50 °C and Tf (II-3) is higher than Tf (II-1). In commercial production, multi-end roving fiber drawing temperature (II-3) is typically lower than the temperature producing direct roving (II-1) product by 10–20 °C depending on requirements of the product tex, defined as fiber strand weight (g) per 1000 m length. Further investigation on the product side, including wet chopped products as well as boron-containing E-glass fibers and boron-free E-glass beads, is planned for Raman spectroscopic study.
Raman band shift with Tf for CaO–Al2O3–SiO2 (CAS or E-glass in this case) follows the same positive correlation as reported for SLS (Na2O–Al2O3–SiO2) glass using the IR reflectance method. 5 It is noted that for SLS glass over a Tf span of 150 °C (425–475 °C), the IR reflectance band near 1100 cm−1 (Q3) increases by 4.0 cm−1. For our case, with a Tf -span of 200 °C (600–800 °C), the Raman band (T–O–T) near 485 cm−1 increases by 5.8 cm−1. Their relative difference (Δυ/ΔT) is close to each other, 0.026 cm−1 °C−1 versus 0.029 cm−1/°C−1.
With the current demonstration, single fibers of the two compositions will be prepared using a single fiber forming tower to control fiber diameter and fiber drawing temperature as a controlled study, for which no fiber coating (sizing) will be applied to avoid the sizing effect. Both tensile strength and Raman spectral analysis will be conducted to gain a better understanding of the effects of Tf on glass structure, skin and bulk, and mechanical properties. The work will be reported in the future.
Commercial Glass Homogeneity
The IR (KBr) method has been approved to offer high sensitivity revealing inhomogeneity of transparent, inclusion-free glass patties from commercial furnace production. Such inhomogeneity at a nanoscale cannot be resolved by using standard glass composition measurements or glass property measurements at a macro scale because of the large sampling volume used. With this new FT-IR method development and demonstration, the glass homogeneity index (GHI) at a nanoscale is proposed, which offers a high sensitivity to the furnace operation change and the related response of the fiber breakage. A result from preliminary statistical modeling suggests the possibility of using the GHI model as one of the tools in commercial glass operation control.
Characteristics of the IR bands are very similar, yet there is a transition from a fully homogeneous random network structure (before the upset) to a partially homogeneous random network structure with the presence of ordered structures (during the upset) to a fully homogenous random structure (after the upset). Over the entire period, furnace bottom temperatures experienced three major stages, high–low–high without change of the batch formulation. It leads to the conclusion that the surge of fiber breakage was directly related to the formation of the ordered nanocrystal-like phase because of the furnace temperature reduction. During the upset period, fiber breakage from microcrystal beading also increased. In the forehearth before the melt was distributed to different bushing positions, the temperatures were significantly lower. It is likely that the ordered, high-temperature nanostructures served as nuclei for microcrystal growth at lower temperatures in forehearth, especially in some cold spots along the channels. The reasoning is further supported by the similarity of the structure fingerprints between the inhomogeneous glass samples without microcrystals and the microcrystal-bearing beads.
Conclusion
Spectroscopic techniques, FT-IR (KBr), ATR, and micro-Raman techniques were utilized to explore their potential applications in tracking commercial E-glass fiber with and without boron for various purposes. Several conclusions can be drawn from the current set of investigations as follows.
By comparing with ATR and IR (KBr) band characteristic differences between the fiber and bulk glass samples, the relative band narrowing near 1050 cm−1 for fibers can be reasoned by the network structure alignment from the fiber stretching under high tension and high shear rate in comparison with the counterpart of the bulk form.
Both ATR and Raman studies have shown the presence of more nonbridging oxygens on the fiber skin over its core, which is reasoned by the hydrolysis mechanism of the fiber surface in reaction with fiber cooling water in the drawing process.
The Raman technique was used to measure and estimate fictive temperatures of fiberglass products, in turn, the effect of the fictive temperature of the product on the product properties can be evaluated as planned for further study.
Glass homogeneity index (GHI) at a nanoscale is proposed and demonstrated to offer high sensitivity to both furnace operation changes and the related fiber breakage change. To the best of our knowledge, the finding from IR measurement on GHI of the commercial E-glass can be considered the first unique demonstration that nano-ordered silicate structure(s) can exist in the amorphous network at relatively lower furnace temperatures. Their presence likely serves as nucleation sites, growing micro-crystals, at lower temperatures in the forehearth, with chemistries close to their stable phases, such as wollastonite or uvarovite. Both types of microcrystals are commonly found in E-glass fiber production operations, resulting in fiber breakage in forming. Such correlation supports a strong correlation between GHI and fiber break level. This demonstration shows that the nanostructure-based GHI method can be more sensitive in tracking the fiberglass melting quality than the composition-based method such as XRF measurement.
The newly developed method offers significant benefits for its high sensitivity in tracking fiberglass production stability and fast turnaround time in solving specific production-related problems. The methodology can be further extended using ATR or Raman spectroscopic techniques, monitoring other commercial glass manufacturing processes.
Supplemental Material
sj-docx-1-app-10.1177_27551857241299440 - Supplemental material for Exploration of Probing Structure, Fictive Temperature, and Homogeneity of Commercial Glass and Glass Fiber Vibrational Spectroscopic Techniques
Supplemental material, sj-docx-1-app-10.1177_27551857241299440 for Exploration of Probing Structure, Fictive Temperature, and Homogeneity of Commercial Glass and Glass Fiber Vibrational Spectroscopic Techniques by Hong Li, Gülin Demirok, Semin Atilgan, Ilkay Sökmen, Yingcheng Zhang, Ann Jose and Ashutosh Goel in Applied Spectroscopy Practica
Footnotes
Acknowledgments
Financial support from NEG and Sisecam is acknowledged. Project management support and encouragement by S. Carmelo (NEG) is greatly appreciated. HL thanks M. Tomozawa (Rensselaer Polytechnique Institute) and D. Neuville (Université de Paris, IPGP-CNRS) for their constructive comments on the manuscript.
Declaration of Conflicting Interests
The authors declared no potential conflicts of interest with respect to the research, authorship, and/or publication of this article.
Funding
The authors received no financial support for the research, authorship, and/or publication of this article.
Supplemental Material
All supplemental material mentioned in the text is available in the online version of the journal.
References
Supplementary Material
Please find the following supplemental material available below.
For Open Access articles published under a Creative Commons License, all supplemental material carries the same license as the article it is associated with.
For non-Open Access articles published, all supplemental material carries a non-exclusive license, and permission requests for re-use of supplemental material or any part of supplemental material shall be sent directly to the copyright owner as specified in the copyright notice associated with the article.