
Abstract
Non-isothermal pyrolysis and gasification of Enteromorpha prolifera (also known as Ulva prolifera) under a CO2 atmosphere were investigated by thermogravimetry analysis. The gaseous products were measured online with Fourier transform infrared spectroscopy coupled with thermogravimetry. The kinetic parameters of pyrolysis and gasification reactions were obtained using the Coats–Redfern method. The experimental results showed that Enteromorpha prolifera had two derivative thermogravimetry peaks centered at 240 and 800°C, indicating the pyrolysis of organics and gasification of char, respectively. Carboxylic acids, ethers, and alcohols were the dominating condensable products generated from pyrolysis between 230 and 300°C. H2O, CH4, and aliphatic hydrocarbons were also formed in this temperature range, and they were also continuously released at higher temperatures, indicating further polymerization of the freshly generated pyrolytic char. CO was mainly produced between 700 and 900°C, and its yield was much higher than that of the pyrolytic gaseous products. The Ginstling equation (the D4 model) proved to be the most probable mechanism function for both the pyrolysis and gasification stages, with activation energies of 138.30 and 93.43 kJ mol−1, respectively.
Introduction
Recently, large-scale Enteromorpha prolifera (EP) green tide has frequently broken out in coastal areas of China’s Yellow Sea in Qingdao. The quantity of bloomed EP reached 10 million tons in 2015. 1 If not salvaged soon, this EP would turn into a stinking morass within a short time, resulting in detrimental effects on the coastal ecosystem. 2 Most EP is collected and discarded as waste, resulting in waste of human resources and biomass energy. The conversion of EP into valuable material would reduce pollution and create economic benefits.
The process of waste-to-energy via gasification has been proposed as one of the crucial biomass utilization alternatives because gasification has high tolerance against the heterogeneous structures of biomass. 3 Moreover, it is suitable for producing gases that can be used to provide electrical power and heat, 4 and is compatible with the current infrastructures of the chemical industry. 5 Besides, it provides for limited formation of dioxins due to the oxygen-free environment. 6 Biomass gasification is a complex thermochemical process, which mainly consists of two stages: (1) pyrolysis or release of volatiles and (2) conversion of the pyrolytic char. 7 So far, considerable studies on the thermal–chemical processing of EP have been focused on pyrolysis under an inert atmosphere (i.e. N2 and Ar);8–11 note, however, that there is currently no investigation concerning the gasification of EP using other atmospheres like CO2 and steam. Recently, CO2 gasification has been regarded as a promising technology, because CO2 applied as a reaction medium is less corrosive than steam, 12 and it can be incorporated in a valorization cycle for the production of fuels, rather than simply being captured and stored. 13 Hence, CO2 gasification provides a long-term solution to mitigate directly the increasing concentration of greenhouse gases in the atmosphere. 14
In order to compensate for the shortcomings of previous studies, in this study, the pyrolysis and gasification of EP under a pure CO2 atmosphere was investigated, particularly by thermogravimetry–Fourier transform infrared spectroscopy (TG–FTIR). Weight loss data and evolution profiles of the major volatile species were obtained. Furthermore, based on the thermogravimetry (TG) data, the pyrolysis and gasification kinetic parameters were obtained by the Coats–Redfern method.
Experimental
Materials
EP was collected from the Yellow Sea coast in Qingdao, Shandong Province China. Prior to use, EP was first washed with tap water to remove solid particles and then dried at 65°C for 36 h. The dried EP was ground and sieved into particle sizes of 120–180 mesh.
TG–FTIR analysis
Pyrolysis and gasification of EP was performed using a TG–FTIR instrument that consists of a simultaneous thermal analyzer (STA 2500 Regulus; NETZSCH, Germany) and a Fourier transform infrared spectrometer (TENSOR II; Bruker, Germany). A sample mass of 13–15 mg was used in this study. The sample was heated from 35 to 1000°C at a pure CO2 flow rate of 70 mL min−1 and a heating rate of 20°C min−1. The volatiles released were detected online by FTIR spectroscopy, in which IR spectra were recorded at 4000–5000 cm−1 with a resolution of 4 cm–1. The transfer pipe and the gas cell in the FTIR were both heated at a constant temperature of 200°C. The experimental results of TG and FTIR were recorded automatically on a computer.
Kinetic methods
A kinetic study of EP is essential to achieve the production of fuel gas, chemicals, and energy. The information is also important for the design of large-scale gasification reactors. The Coats–Redfern method was used in this study to determine the kinetic parameters of pyrolysis and gasification of EP.15,16
The rate of conversion, dα/dt, is a linear function of a temperature-dependent rate constant, k, and a temperature-independent function of conversion, f(α)

where α is the degree of conversion and t is the time. α is expressed as
where mi is the initial mass of the sample, mt is the mass of the sample at time t, and m∞ is the final mass of the sample in the reaction.
The reaction rate constant, k, is described by the Arrhenius equation
where A is the pre-exponential factor, Ea is the activation energy, R is the gas constant, and T is the absolute temperature.
For a constant heating rate β during gasification, β = dT/dt and so rearranging equation (3) and integrating using the Coats–Redfern method, we obtain
As the term 2RT/Ea can be neglected because it is much less than 1, equation (4) can be simplified as
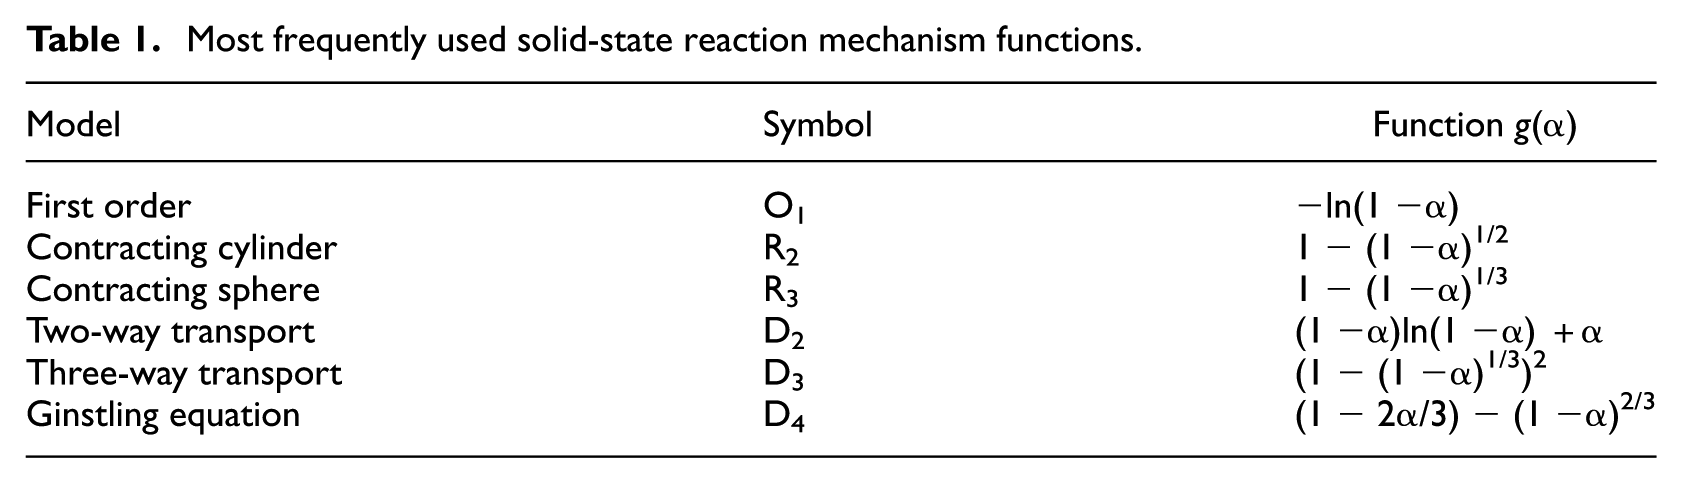
Various reaction models define g(α) in different ways, and if the correct g(α) is used, plotting ln(g(α)/T2) versus 1/T should result in a straight line. Ea and A can be determined from the slope and intercept of the line, respectively. The differential form f(α) and the integrated form g(α) for the basic model employed for the kinetic study of solid-state reactions are provided in Table 1.15,17
Most frequently used solid-state reaction mechanism functions.
Results and discussion
Thermal behavior
TG and derivative thermogravimetry (DTG) curves for EP are shown in Figure 1. The characteristic parameters obtained from the TG and DTG curves such as weight loss, the corresponding temperature ranges of the weight loss, the maximum weight loss rates (Rmax), and the corresponding temperature (Tmax) are shown in Table 2. There were five stages in the pyrolosis gasification of EP, and the weight loss below 190°C was due to the loss of water in the cells and bounded by surface tension. EP mainly consists of proteins, carbohydrates, and small amounts of lipids and crude fiber. Thus, the obvious weight loss that occurred between 190 and 350°C can be attributed to the decomposition of these organic compounds. The weight loss rate became relatively low above 350°C, which was because the vigorous cracking of organic compounds finished at this stage. Instead, the polymerization of carbonaceous matters in the residual char became the primary reaction, leading to the release of small molecules at a low rate. There was a strong DTG peak centered at 800°C, which can be attributed to the gasification of the solid char. The slight weight loss above 800°C was caused by the decomposition of the inorganic gasification residue.
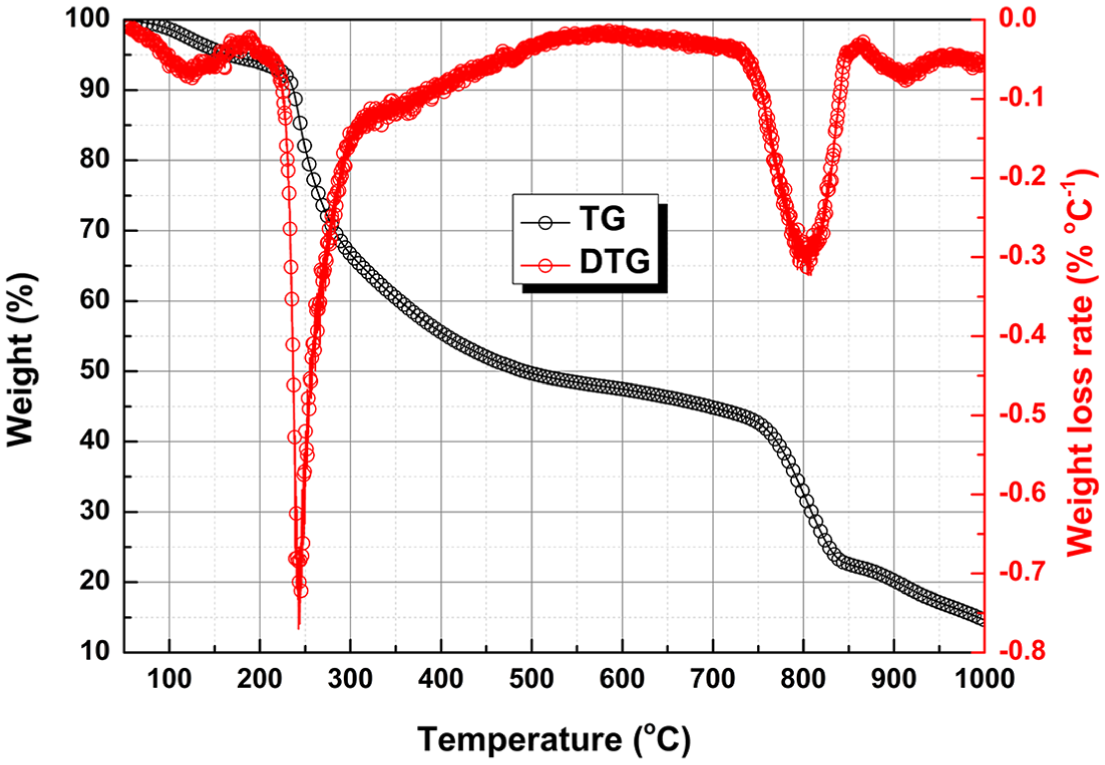
TG and DTG curves for EP at 20°C min−1.
Characteristic parameters obtained from the TG and DTG data for EP at 20°C min–1.
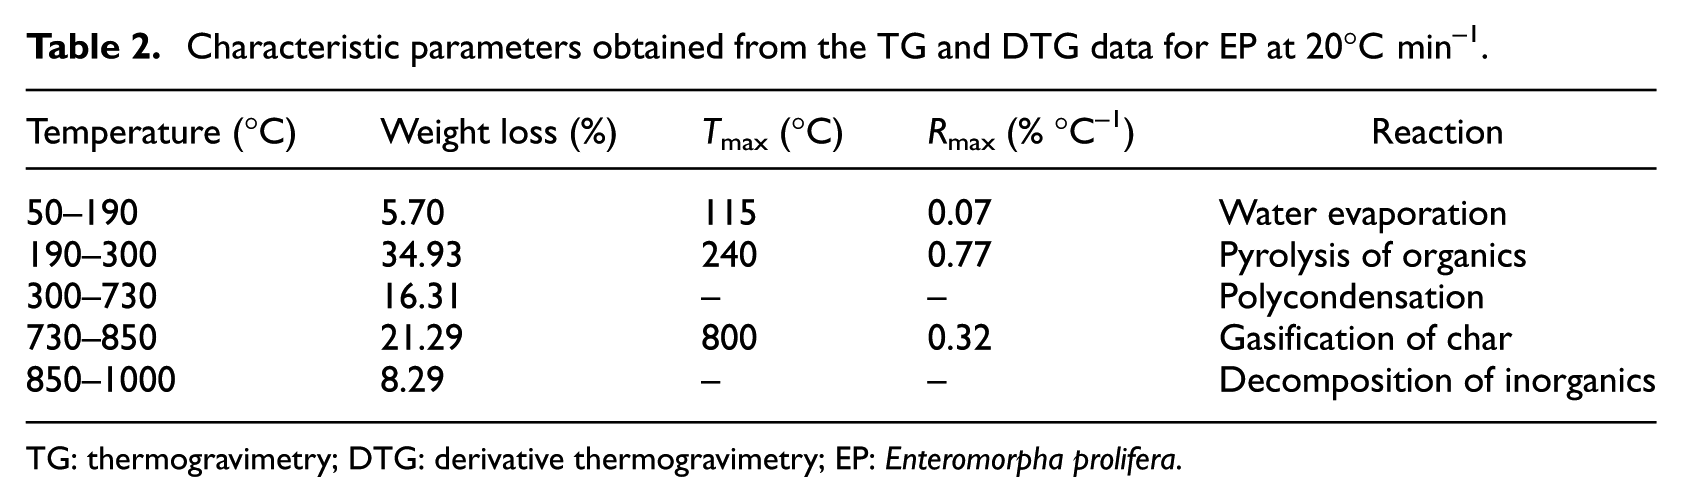
TG: thermogravimetry; DTG: derivative thermogravimetry; EP: Enteromorpha prolifera.
FTIR analysis
The volatiles evolved from the pyrolysis and gasification of EP were analyzed by FTIR in real time. As shown in Figure 2, the Gram–Schmidt curve shows the variation of the yields of the volatile compounds with temperature. It has two peaks centered at 240 and 800°C, respectively, which matched with the DTG peaks very well. Note that the second peak is much stronger than the first one, indicating that more gaseous products were generated during the gasification stage. The three-dimensional (3D) spectrogram (absorbance–wavenumber–temperature) of the volatiles is shown in the inset of Figure 2. When the temperature is fixed, absorbance information at different wave numbers can be obtained to study the volatile components released at that moment. Figure 3 shows the FTIR spectra at the typical temperatures for pyrolysis and gasification of EP. As a result of the cracking of the organics in EP, the complex gaseous products composed of a variety of molecules were evolved at 240°C, i.e., Tmax of the pyrolysis stage. The bands at 3700–3500 cm−1 and 1500–1300 cm−1 represent –OH bond stretching vibrations in H2O. The stretching vibration between 3000 and 2750 cm−1 indicates the presence of aliphatic C–H. The most obvious absorbance is the C=O stretching absorbance at 1716 cm−1, indicating the presence of organic acids. The peaks at 1180 cm−1 can be assigned to the stretching vibration of C–O–C in ethers. The peak at 1018 cm−1 was caused by the stretching of C–O–H in alcohols. With the temperature increasing to 500°C, the species and yields of volatiles obviously declined, and only small molecules (i.e. CH4 and H2O) can be observed, which were the main products of polycondensation of the freshly generated carbonaceous solid. Two strong peaks of CO at 2170 and 2077 cm−1 emerged when the temperature increased to 800°C, i.e., Tmax of the gasification stage, indicating the gasification of EP char under a CO2 atmosphere, which is popularly known as the Boudouard reaction 18

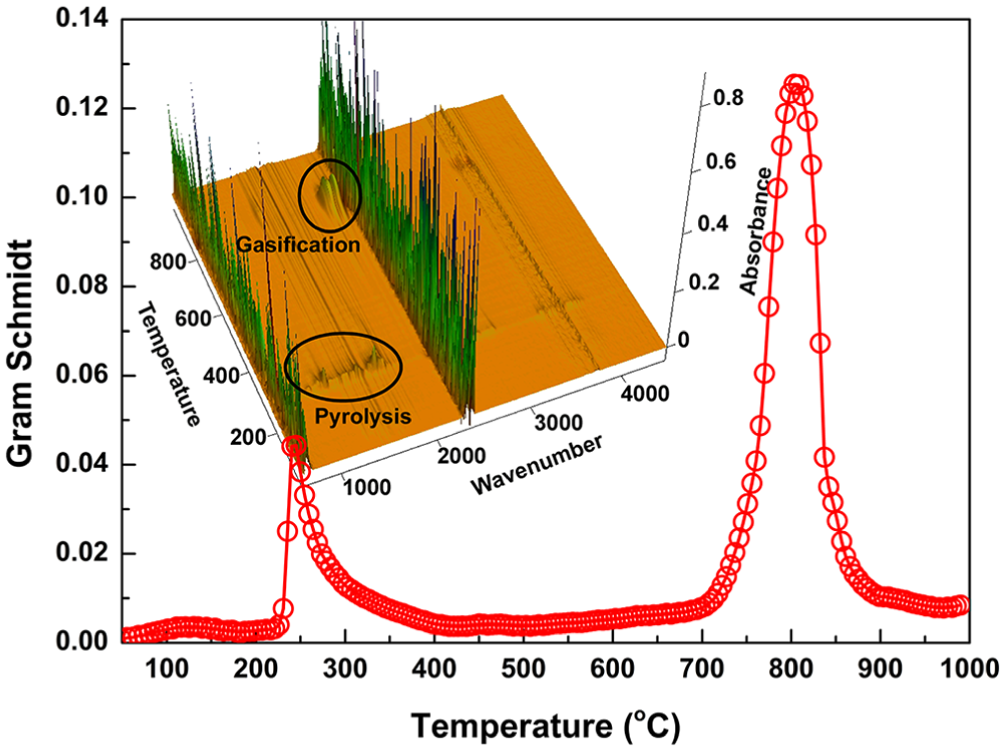
Gram–Schmidt curve for EP at a heating rate of 20°C min−1; the inset shows the 3D infrared spectrum of pyrolysis products.
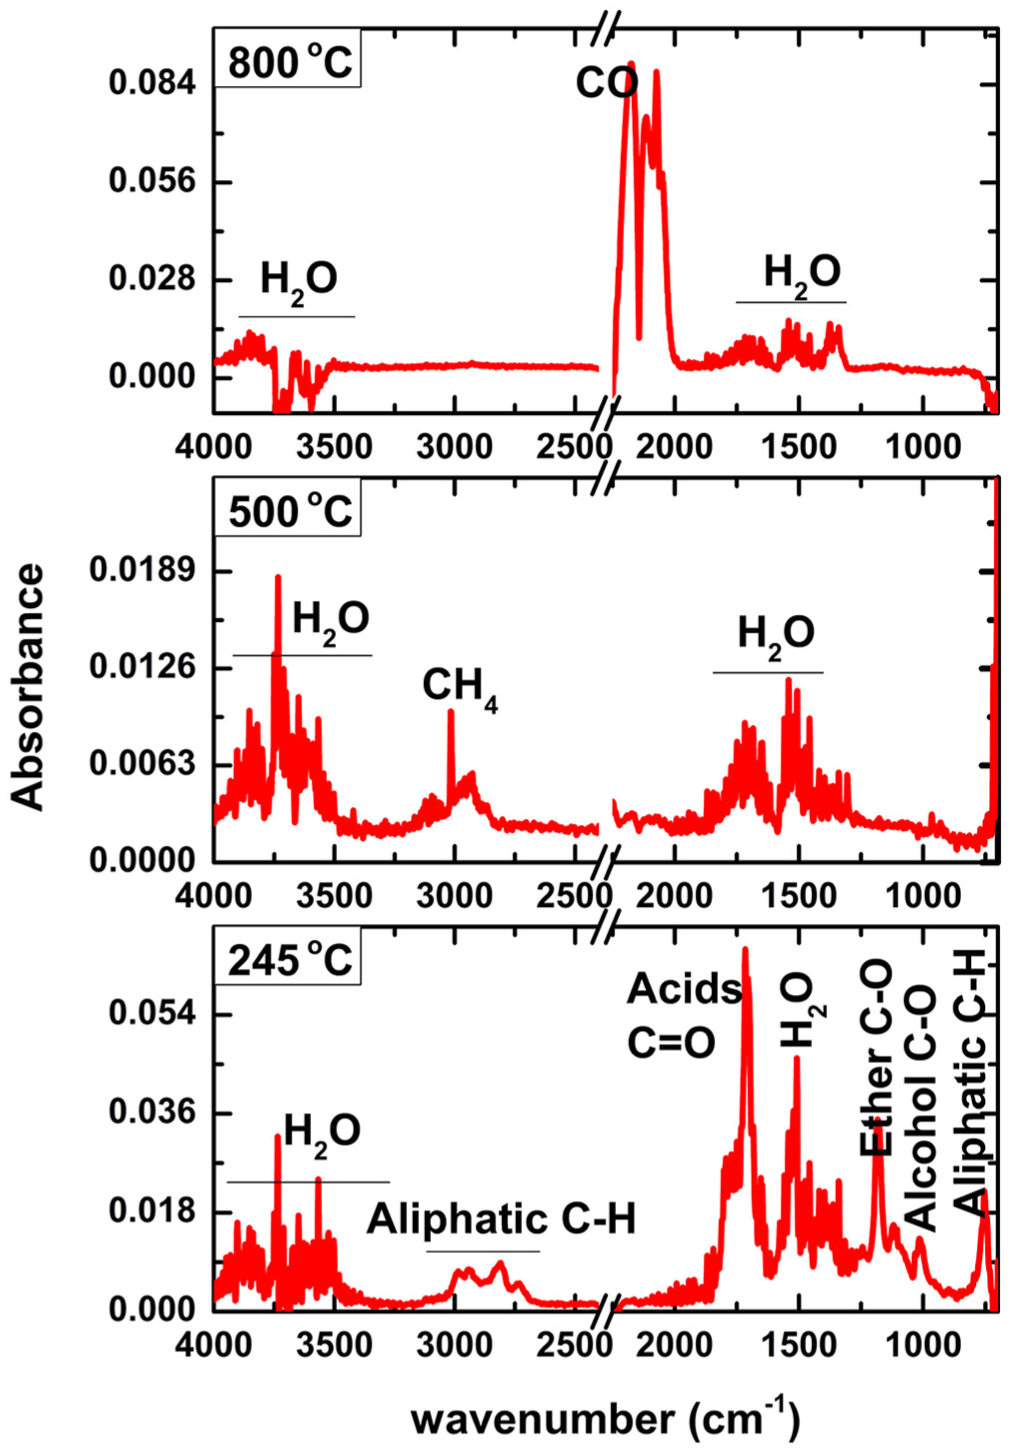
FTIR spectra for pyrolysis products corresponding to different temperatures.
The evolution histories of the main volatile products as a function of temperature are presented in Figure 4. The release of CH4 and aliphatic C–H exhibits two peaks, those in the low-temperature region (200–300°C) were mainly generated from the rupture of oxygen-containing aliphatic chains, such as methoxy (–O–CH3) and ethoxy (–O–CH2–CH3) groups, while the peaks at higher temperatures (>450°C) were caused by the rupture of the side chains of aromatic rings. Both the curves of CH4 and aliphatic C–H had long tails beyond 600°C, indicating the carbonization of EP to a greater extent. Carboxylic acids, ethers, and alcohols were the dominating condensable products; they were mainly released within a narrow temperature range (230–300°C), suggesting that the violent pyrolysis reactions were finished in a short time. CO was the main non-condensable product, and it could be detected from 700°C to as high as 900°C, indicating the temperature range of the occurrence of the Boudouard reaction. Based on the evolution histories of the main volatile products, the thermal conversion process of EP under a CO2 atmosphere can be illustrated by the schematic diagram in Figure 5.
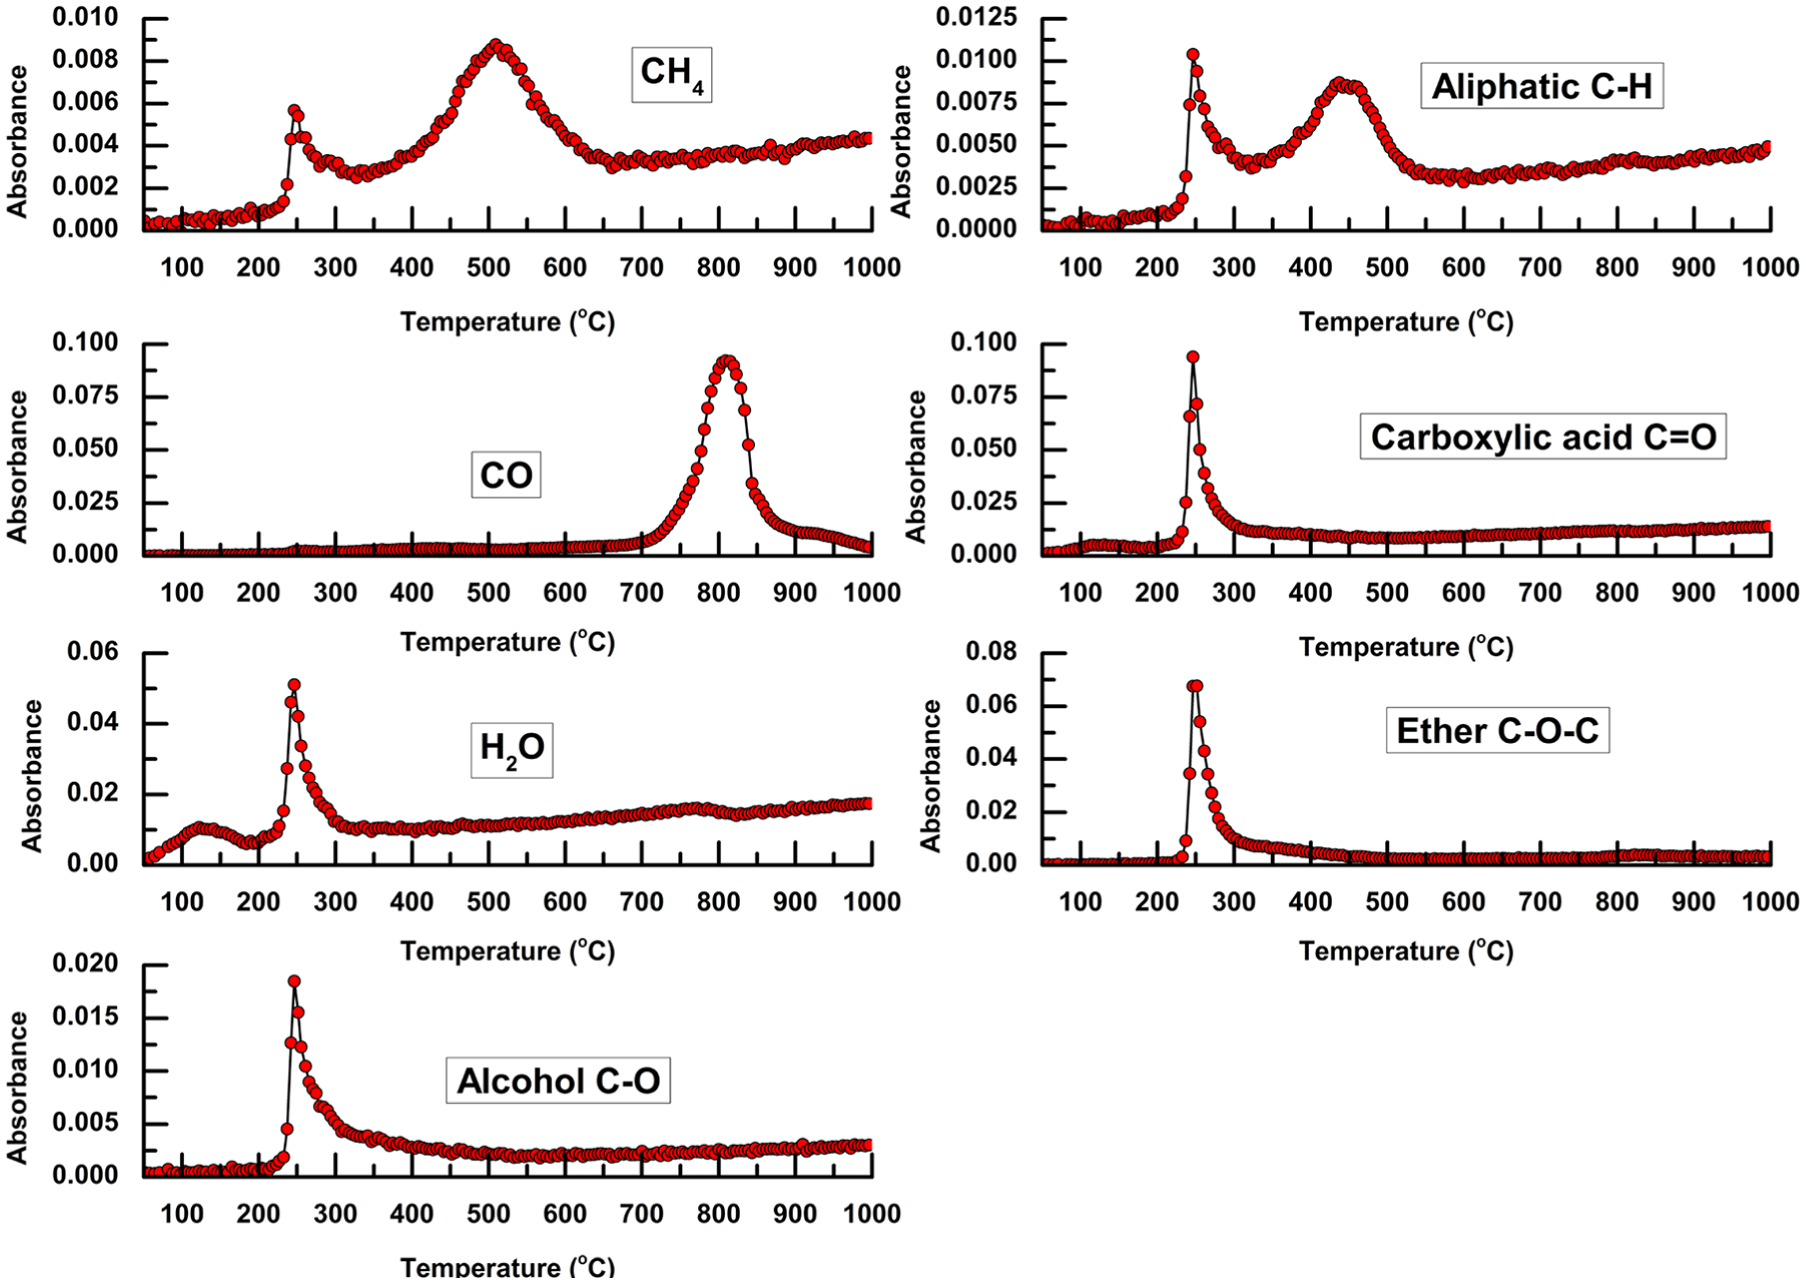
Evolution histories of main volatile products as a function of temperature.
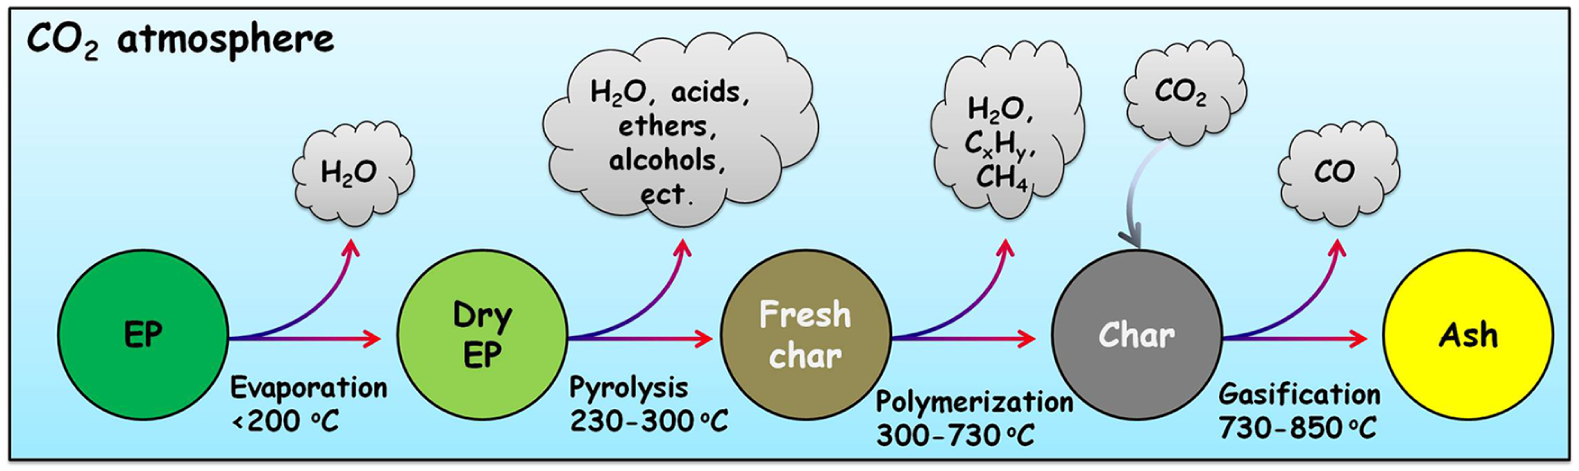
Schematic diagram of the thermal conversion process of EP under a CO2 atmosphere.
Kinetic study
The kinetic parameters were determined assuming single separate reactions for a particular stage of thermal conversion. By considering the DTG curve for EP (Figure 1), two temperature ranges for pyrolysis and gasification reactions were selected, equation (5) was applied separately to each of them, and a series of straight lines can be obtained by plotting ln(g(α)/T2) versus 1/T (Figure 6). The highest correlation coefficient (R2) indicates that the corresponding reaction model reasonably fitted the experimental data. As can be seen, for both the pyrolysis and gasification stages, the D4 model shows the highest R2 values, which are 0.9790 and 0.9957, respectively. The activation energies of the two stages were calculated to be 138.30 and 93.43 kJ mol−1, respectively. This result is different from previous studies, which showed that CO2 gasification of biomasses had higher activation energies than pyrolysis.15,19 This is possibly because, as a kind of marine macroalgae, EP has high ash contents (i.e. K, Na, Ca, Mg),20,21 which have catalytic effects on gasification reactions.22,23
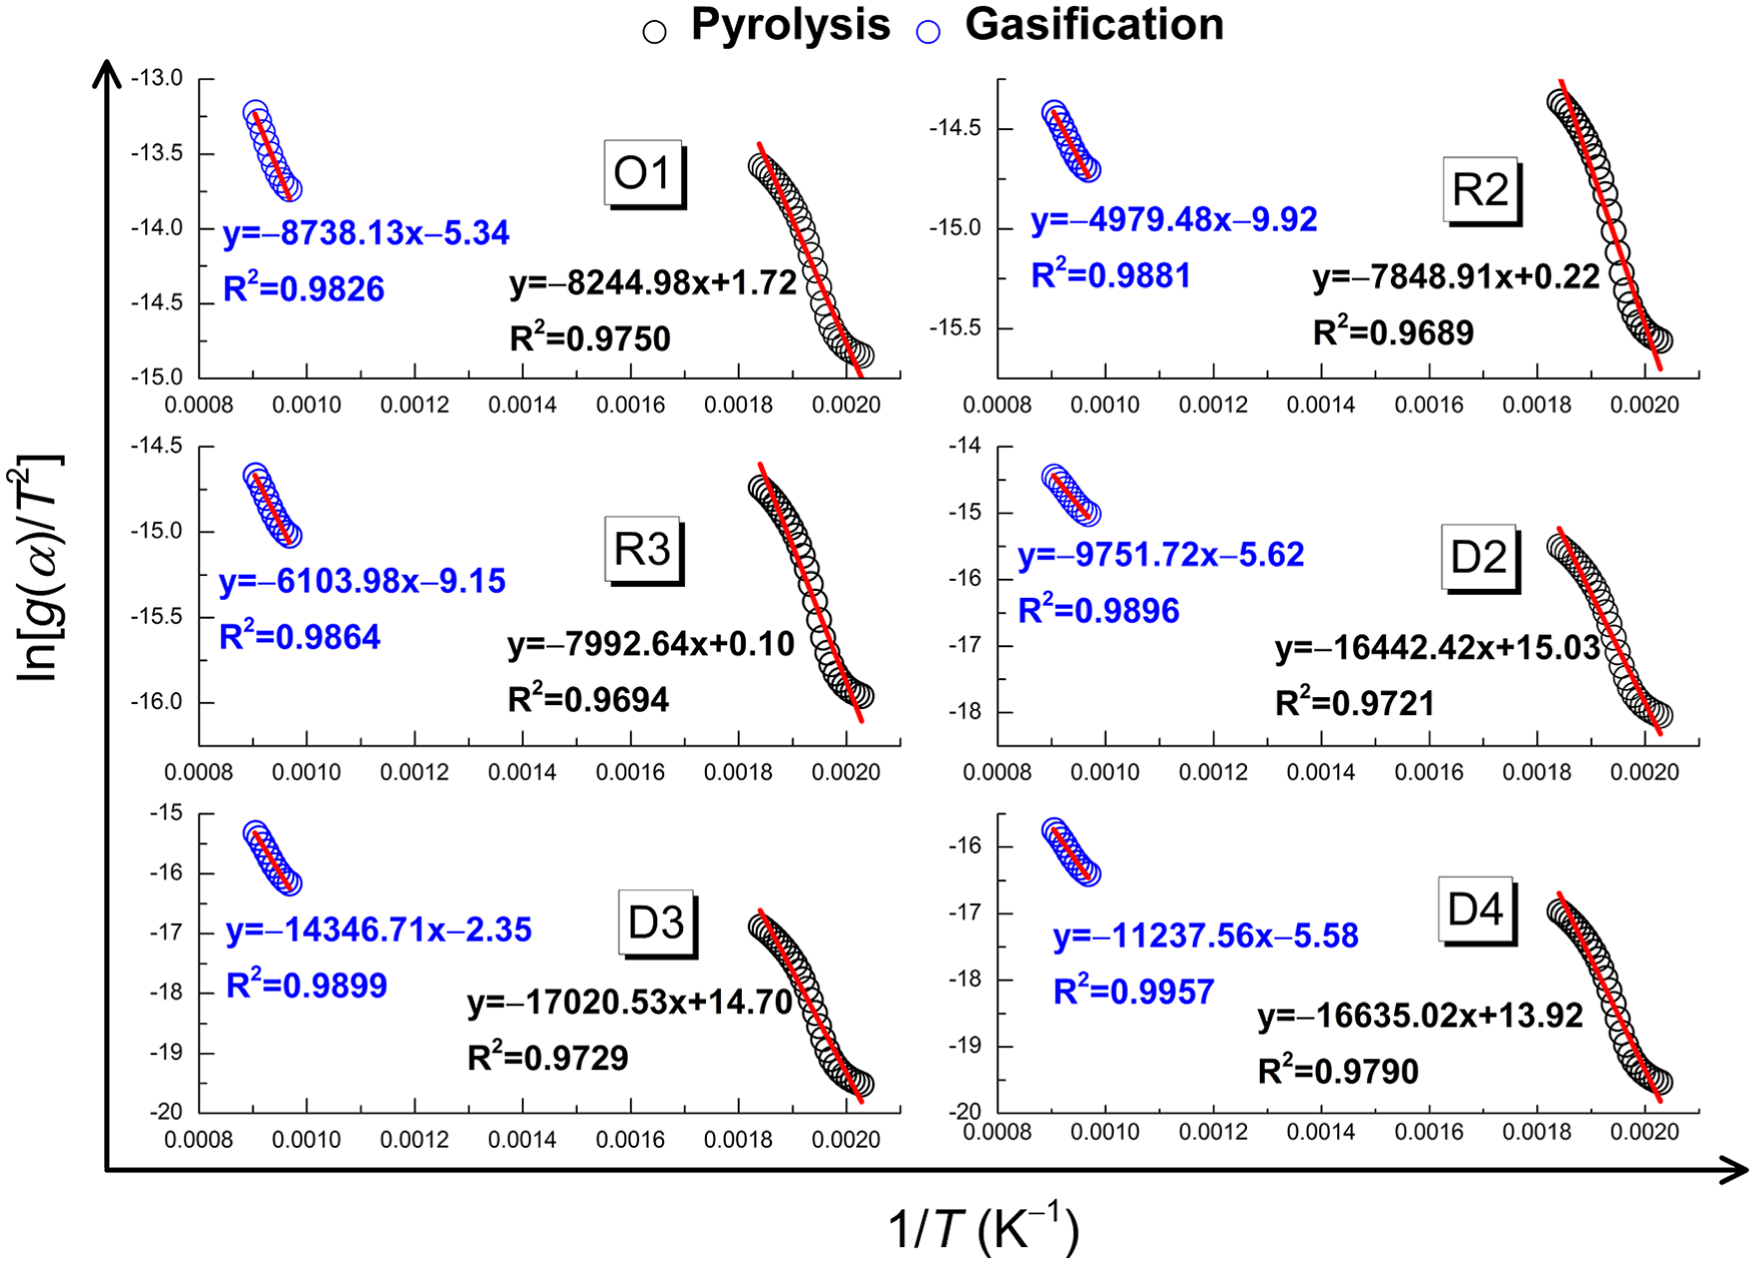
Plots of ln(g(α)/T2) versus 1/T for pyrolysis and gasification of EP using different models.
The D4 model, which is also known as the Ginstling equation, assumes that the chemical reactions occur on the entire surface of the spherical solid particles, leading to the formation of a layer with a certain thickness increasing with the reaction time. The reaction rate is controlled by the diffusive resistance of the layer to the gaseous reactants or products. Based on the above assumption, kinetic models of the pyrolysis and gasification stages of EP are illustrated in Figure 7.
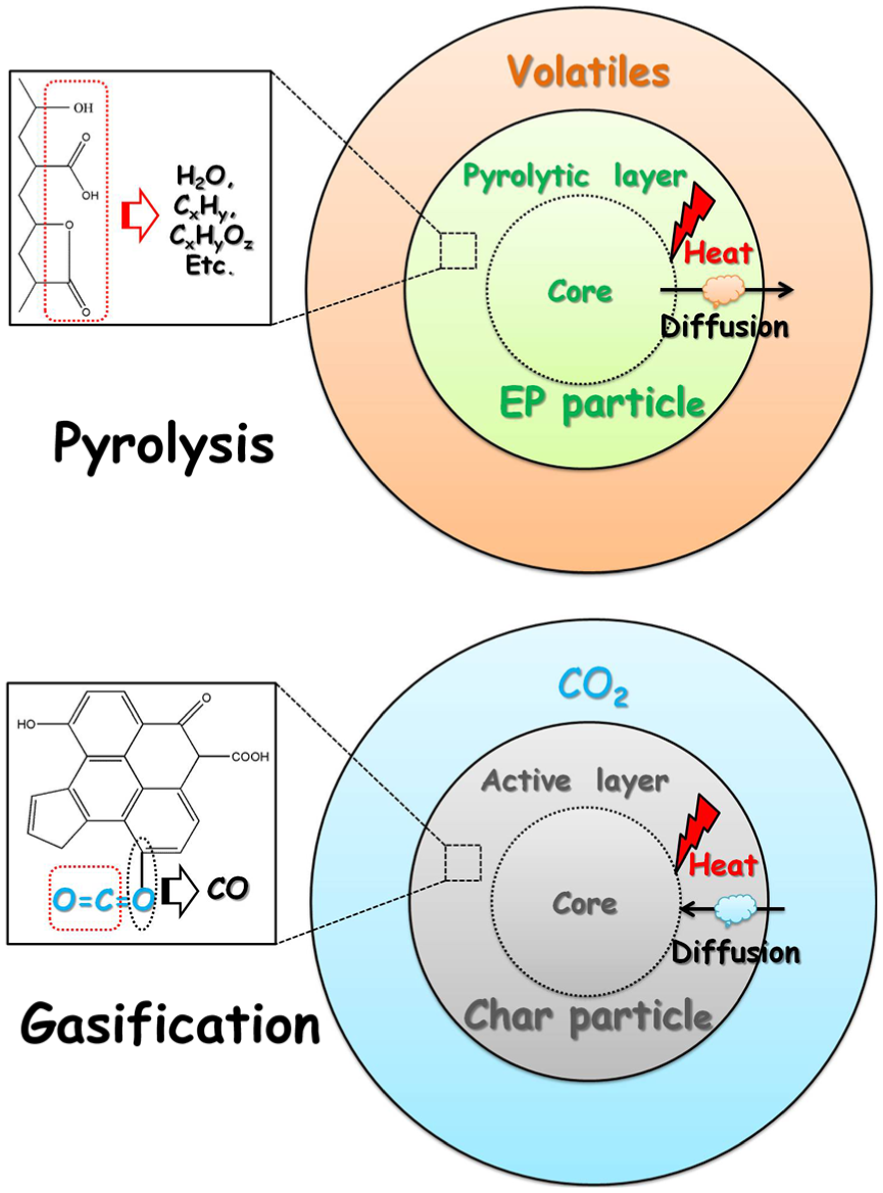
Schematic diagram of the D4 model for pyrolysis and gasification of EP.
Conclusions
Pyrolysis of EP occurred between 200 and 300°C, and gasification of pyrolytic char occurred between 700 and 900°C. Carboxylic acids, ethers, and alcohols were the dominating condensable products generated from pyrolysis. H2O, CH4, and aliphatic hydrocarbons were also formed during pyrolysis, and their continuous release at higher temperatures suggested the polymerization of the freshly generated pyrolytic char. The yield of the gasification product CO was much higher than that of the pyrolytic gaseous products. The activation energies of the pyrolysis and gasification stages were 138.30 and 93.43 kJ mol−1, respectively, and their kinetics can be described by the D4 model.
Footnotes
Declaration of conflicting interests
The author(s) declared no potential conflicts of interest with respect to the research, authorship, and/or publication of this article.
Funding
The author(s) received financial support for the research, authorship, and/or publication of this article: This work was financially supported by the Fundamental Research Funds for Central Public Welfare Scientific Research Institutes (No. K-JBYWF-2017-T09).