
Abstract
Determining whether the origin of a bloodstain is human or non-human is important during a forensic investigation. In their pioneering work, Bian et al. introduced a self-reference peak algorithm for the analysis of the Raman spectra of bloodstains and demonstrated the great potential of this approach for differentiating between human and non-human blood. However, this work only used three non-human species in the creation of their original model. The current study expands the capability of a self-referencing algorithm to discriminate between human and 18 non-human species based on the Raman spectra of blood samples. The intensity ratios between the bands at 1003 and 1341 cm−1 of the samples’ Raman spectra were compared between species to determine whether a threshold existed that separates human samples from those of non-humans. The self-referencing algorithm was capable of correctly categorizing spectra averaged from donors of all 18 non-human species. The use of this algorithm is simple and requires little training or knowledge of statistics, which makes it accessible for forensic applications, compared to computationally difficult analysis methods. This technique using Raman spectroscopy is rapid, nondestructive, and highly accurate making it a promising tool for forensic applications.
This is a visual representation of the abstract.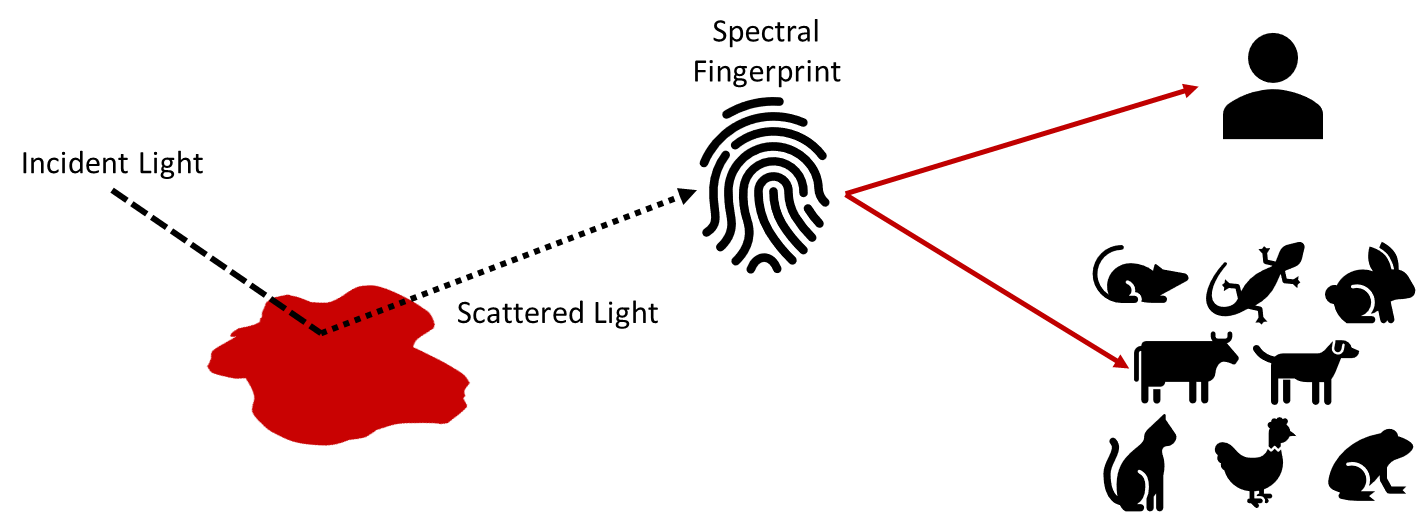
Introduction
Bloodstain traces are one of the most prevalent forms of evidence discovered during forensic investigations. 1 Blood can be found at scenes of violent crimes including homicide, assault, sexual assault, etc. 2 Blood provides significant amounts of probative information for forensic investigators, as it contains individualizing information, deoxyribonucleic acid (DNA). This can help investigators identify and locate persons involved in a crime either via a direct match of DNA to an unknown sample or by comparing the profile to other persons in a database.3,4
Blood is a heterogeneous complex fluid composed of several components. Plasma accounts for most of the volume of blood, serves as a solvent and transports cells along with sugar, proteins, and salts. White blood cells, which come in several types, serve primarily as immune response cells. Finally, red blood cells (RBCs) account for ∼45% of the total amount of human blood volume. 5 RBCs are responsible for oxygen transport from the lungs to the remainder of the body. This is facilitated by oxygen binding to the heme structure present in hemoglobin in the RBCs. Hemoglobin (Figure 1) is one of the main components of RBCs and is comprised of several peptides, which include a porphyrin ring and amino acids including but not limited to histidine and tryptophan.6,7

Structure of hemoglobin. U+1F16E Public domain, Wikimedia Commons, and Roger Burger.
While blood is found in many scenes, it is important to ensure that the stains are applicable to the crime that is being investigated. One way this is done is by determining the species of origin of the bloodstains. There are many reasons that non-human blood may be present at a crime scene but not relevant to the event under investigation. This includes hit-and-run events, crimes occurring in areas where animal food products are prepared, unrelated accidents involving domestic animals, etc. Differentiating between human and non-human blood is a high priority in the case of hit-and-run investigations. In 2017, ∼19% of all vehicle crash deaths in the United States were non-occupants such as pedestrians or cyclists. 8 In cases such as these, forensic investigators have an immediate need to determine if the blood found on a vehicle belongs to a human, indicating a hit-and-run, or non-human, suggesting the driver hit an animal. Additionally, this method can be used in domestic settings. For example, in a case of blood found in a kitchen after animal meat has been prepared this method can be used to determine that the sample is animal blood. The distinction between blood from a food preparation and that of a human being can be the difference between evidence of assault versus evidence of a steak dinner. Therefore, identification of species based on blood is a necessary capability for forensic scientists. Forensic labs currently have a few destructive methods to determine the origin-species of a blood sample.
One way forensic scientists determine whether a blood sample is human or non-human is by using an immunoassay test such as a Rapid Stain Identification (RSID) of human blood kit. RSID tests for human glycophorin A, an antigen only found in human blood, by introducing two monoclonal antibodies to the analyte sample in a buffer solution. 9 While such tests are useful in confirming whether a sample is human blood, there are downsides to this examination. The sample can be recovered from the RSID cartridge for DNA typing, although it is time-consuming. The RSID test, unlike the ABA card test, has been shown to not have cross-reactivity with ferrets and primates as well as monkeys and baboons. 9 After extraction from the cartridge, DNA typing methods are used to separate the parts of the sample for analysis and the DNA is isolated and saved. 10 Typically, the remainder of the sample is discarded. DNA analysis is considered to be the gold standard for human and species differentiation and identification and sources of individual donors from a group can be identified. Additionally, there have been numerous studies focused on species determination of blood using instrumentation methods including high-performance liquid chromatography–mass spectrometry and attenuated total reflectance Fourier transform infrared spectroscopy and Raman spectroscopy.11–14 However, these methods of analysis are still in the research stages and are not currently utilized by forensic analysts. Overall, there is a need for a nondestructive, confirmatory, time-, and cost-effective method capable of distinguishing between species via bloodstains.
Of the analytical techniques mentioned, Raman spectroscopy fits the necessary criteria. Raman spectroscopy has proven capable of rapid, confirmatory, and nondestructive analysis for forensic samples.15,16 As a type of vibrational spectroscopy, Raman spectroscopy uses light to irradiate a sample; generating vibrations between bonds in the analyte which yield inelastically scattered light that can then be presented as a Raman spectrum. The vibrational information present in the spectrum comes in the form of bands that correspond to distinct molecular vibrations; allowing for structural information about the analyte to be interpreted. This technique has been utilized for the analysis of biological samples and can differentiate between all forensically relevant body fluids. Specific to the analysis of blood, the Lednev lab has shown that Raman spectroscopy can determine the race, sex, and age of human subjects as well as estimate the time since deposition of a deposited stain.17–21 Raman spectroscopy has also been proven invaluable as a nondestructive and confirmatory method of analysis that requires little to no sample preparation. These characteristics are important in forensic applications where samples may only be present in trace amounts.
There are many visual similarities between Raman spectra of blood, both intraspecies and interspecies. This is because the Raman spectrum of blood is dominated by the signal produced by hemoglobin, which is found in both human blood and that of many other species. Therefore, the use of chemometric models is commonly required to differentiate between the otherwise indistinguishable classes of human and non-human spectra. The usage of advanced statistics has been shown to be a valuable tool for the analysis of vibrational spectroscopic data. Models based on principal component analysis (PCA) and partial least squares discriminant analysis (PLS-DA) have been proven effective in discriminating between spectra of human blood and non-human blood. 12 PCA of spectra of blood from animal species has displayed an ability to discriminate between humans, cats, and dogs without overlap at a 99% confidence interval. 22 Other work has shown that PLS-DA has been proven to be a viable option for this analysis as a discrimination model generated from Raman spectra of human blood and 11 non-human species could classify unknown samples as either “human” or “non-human” with 100% accuracy. 11 While chemometrics is extremely useful for the discrimination of species, both PLS-DA and PCA models require knowledge of statistical analysis and specific training to use effectively. The use of a method that is straightforward and easily adoptable would allow forensic practitioners to analyze spectral results in an efficient manner without the need for advanced training.
A self-reference peak algorithm compares the intensities of two bands within a Raman spectrum to create a ratio that, when compared between samples, allows for discrimination between different classes of samples. Previous work by Bian et al. 1 introduced the use of the self-reference algorithm to differentiate between human and non-human bloodstains. Their human and non-human samples were obtained from volunteers and an animal laboratory, respectively. Samples were analyzed using a Renishaw inVia micro-Raman spectroscopy system with a 785 nm excitation wavelength. They compared the bands of the resulting Raman spectra to determine which worked best for the self-referencing algorithm. In the end, they determined that the ideal bands to use for their self-reference ratio algorithm was the ratio of the intensities between 1003 and 1341 cm−1. The 1003 cm−1 band was assigned to aromatic ring breathing and the band at 1341 cm−1 was assigned to C–H bend in tryptophan. They utilized the resulting ratios to determine a threshold that is capable of differentiating bloodstains obtained from humans versus non-humans with 100% accuracy. 1 In addition, the statistical simplicity allowed users with lower levels of training to understand and utilize this method. Thus, this work makes the model more accessible to all individuals.
While the work by Bian et al.1 established a foundation for the use of a self-reference peak algorithm, this proof-of-concept study has some limitations. First, the number of species used to create the non-human species class was limited, only composed of dog, rabbit, and rat blood. In forensic investigations, it is possible to come across a plethora of non-human species, especially in cases of a vehicular accident or food preparation. Thus, it is necessary to expand the number of non-human species tested to ensure the robustness and validity of the method. Second, of the non-human species analyzed, the previous study did not investigate the interspecies differences based on the self-reference peak algorithm.
For the current work, a larger selection of species was chosen to create the model, and a ratio threshold was established based on a comparison of the intensities between 1003 and 1341 cm−1 bands. Additionally, the ratios between the non-human species were compared to determine any intraspecies patterns. The data used for this study were previously classified using a PLS-DA model for species identification in a study by McLaughlin et al. 11 The use of the self-reference peak ratio algorithm allowed for the testing of a more user-friendly method of discrimination with a greater variety of species to ensure that the same level of accuracy is maintained.
Methods and Materials
Sample Preparation
Non-human blood was obtained from 149 donors from 18 species. The samples were comprised of 10 cat (domestic shorthair, Felis catus) donors, 10 chicken (Gallus domesiticus) donors, five chimpanzee (Pan troglodytes) donors, 10 cow (Bos taurus) donors, three deer (white-tailed, Odocoileus virginianus) donors, 10 dog (beagle, Canis lupus familiaris) donors, three elk (Cervus canadensis) donors, three ferret (Mustela putorius furo) donors, 10 fish (striped bass, Morone saxatilis) donors, 10 frog (Bullfrog, Lithobates catesbeianus) donors, 10 horse (Equus caballus) donors, five macaque (Rhesus, Macaca mulatta) donors, 10 mouse (CD-1 strain, Mus musculus) donors, 10 opossum (Didelphis virginiana) donors, 10 pig (Sus scrofa domesticus) donors, 10 rabbit (New Zealand white, Oryctolagus cuniculus) donors, 10 raccoon (Procyon lotor) donors, and 10 rat (Sprague Dawley, Rattus norvegicus) donors. The chimpanzee blood samples were obtained from Chimp Haven and macaque blood samples were obtained from the Animal Resources Facility at Albany Medical College (Albany, New York). The deer, elk, ferret, fish, and frog blood samples were purchased from BioreclamationIVT, LLC. All non-human donors were selected randomly from both sexes to ensure donor diversity. Ten human (Homo sapiens) donors were purchased with consideration to diversity of sex, race, and age from BioreclamationIVT, LLC.
Sample preparation was done using the protocol described in the paper by McLaughlin et al. 11 In brief, 2 mL of blood was obtained for each donor in an Eppendorf tube from the commercial vendor and kept frozen until sample preparation. The tubes contained the anti-coagulant ethylenediaminetetraacetic acid dipotassium salt dihydrate to prevent clotting during transport and storage. At the time of sample preparation, the tubes were removed from the freezer, defrosted, and vortexed to reconstitute the sample. Each blood sample was composed of 30 µL of whole blood deposited on an aluminum-covered microscope slide. One sample was prepared per donor and three to 10 donors were tested per species. The blood was allowed to dry for a minimum of 60 min prior to measurement. All measurements were obtained within 48 h of deposition.
Sample Analysis
All samples were measured using a Renishaw inVia confocal Raman spectrometer equipped with a Renishaw Prior automatic stage and reported in previous studies.11,12 The instrument was calibrated prior to all measurements using a silicon standard. Raman maps of 35 spectra each were collected for each sample using a 20× long-range objective with a 785 nm excitation laser, in the spectral range of 250–1800 cm−1, with ten 20 s accumulations at ∼4.0 mW for each point of the map.
Data Analysis
Spectral data were reported in previous publications,11,23 to summarize preparation of the data was performed using PLS Toolbox 7.0.3 (Eigenvector Research Inc.) operating in Matlab v.R2010b, and construction of statistical models was performed using Matlab v.R2019b. All spectra were truncated to the data range 300–1700 cm−1 before being baseline corrected using a sixth-order polynomial and normalized by total area. The 35 spectra of each sample were then averaged together to form a single representative spectrum per sample using the same methodology as previous studies.11,23
The spectral intensity based on peak height at 1003 and 1341 cm−1 was taken from the donor's representative spectra to generate the ratio value for that donor by dividing the intensity of the peak at 1003 cm−1 by that of the peak at 1341 cm−1. To test the effectiveness of ratio-based discrimination, a model was created in which non-human donor ratios were compared to those of human donors. The threshold value of 2.8 was determined using a receiver operating characteristic (ROC) curve created in Excel. If the non-human donor ratio was lower than the threshold ratio value it was classified as “non-human”, and if it was above or equal to the threshold it was classified as “human”.
Results and Discussion
The end goal of this research is to create a method that is capable of doing multi-level decision-based analyses on biological stains. This includes body fluid identification, species identification, and phenotypic analysis. To eventually be integrated together, a uniform method of pre-processing is needed. In previous work for the identification of body fluids, baseline correction was performed followed by normalization by total area. The use of this pre-processing will allow the integration of this method into eventual multi-level analyses.
Blood samples from 18 species of non-human animals were analyzed to create a model capable of differentiating non-human blood from human blood. A low-level model was created based on the comparison of pre-processed Raman spectral band's intensity ratio values 1 without performing any additional statistical operations. For this model to be applicable in the forensic workflow, it is necessary to analyze many non-human species to test the usability of this technique. Therefore, the aim of this study was to create a method that provides accurate discriminatory ability for many species, with the statistical simplicity of an easy-to-use self-referencing peak ratio algorithm. This study incorporates 15 species previously unaccounted for in past research by Bain et al. for the peak ratio self-reference algorithm. When utilized, the model is able to act as a confirmatory discrimination technique between human and non-human species for bloodstains.
The additional species used to create this statistical model were selected because they are commonly encountered by humans. This includes animals being prepared and eaten by humans in domestic households (chicken, cow, deer, elk, fish, frog, pig, and rabbit), kept as pets (cat, dog, ferret, frog, horse, mouse, pig, rabbit, and rat), important in wildlife crime (deer, elk, and fish), are common in cases of automotive accidents which can be mistaken for hit-and-run (deer, elk, cow, horse, pig, dog, cat, and rabbit), or provide false positives for human blood in certain presumptive tests (chimpanzee, ferret, and macaque). 12 To create a statistically sound method for binary discrimination, which could be used to complement current blood analyses, it is important to check all possible samples that may be encountered by forensic examiners.
The Raman spectra of blood from varying species have distinct visible differences in terms of both their shape and intensity. Peaks in the Raman spectra can be sharp and narrow from the blood of one species, but wide and round for another species, as shown in Figure 2. The 1003 and 1341 cm−1 bands, for example, vary greatly in relative intensity to each other between humans and non-humans. The band at 1003 cm−1 remained consistent between species, while the band at 1341 cm−1 showed significant variability. The variations in the intensities and band shape between species allow for the creation of a ratio that can differentiate between human and non-human blood samples. However, the differences between species are not readily apparent to the human eye. Figure 3 shows the stacked and averaged Raman spectra from all 19 species examined in this study. In this figure, one can see that there are no apparent changes between species, which is why statistical models were previously used to discriminate between classes. The simpler method that is now being used is capable of discriminating between human and non-human species but will not be able to differentiate between individual species. Finally, the use of a single peak is not ideal as a discriminator since the intensity of an individual band can vary depending on the laser power used when analyzing the sample as well as the amount of blood present in said sample. The use of a ratio during the creation of the self-referencing algorithm allows for consistent comparison between spectra of the same kind despite variability based on experimental effects or instrumentational effects.
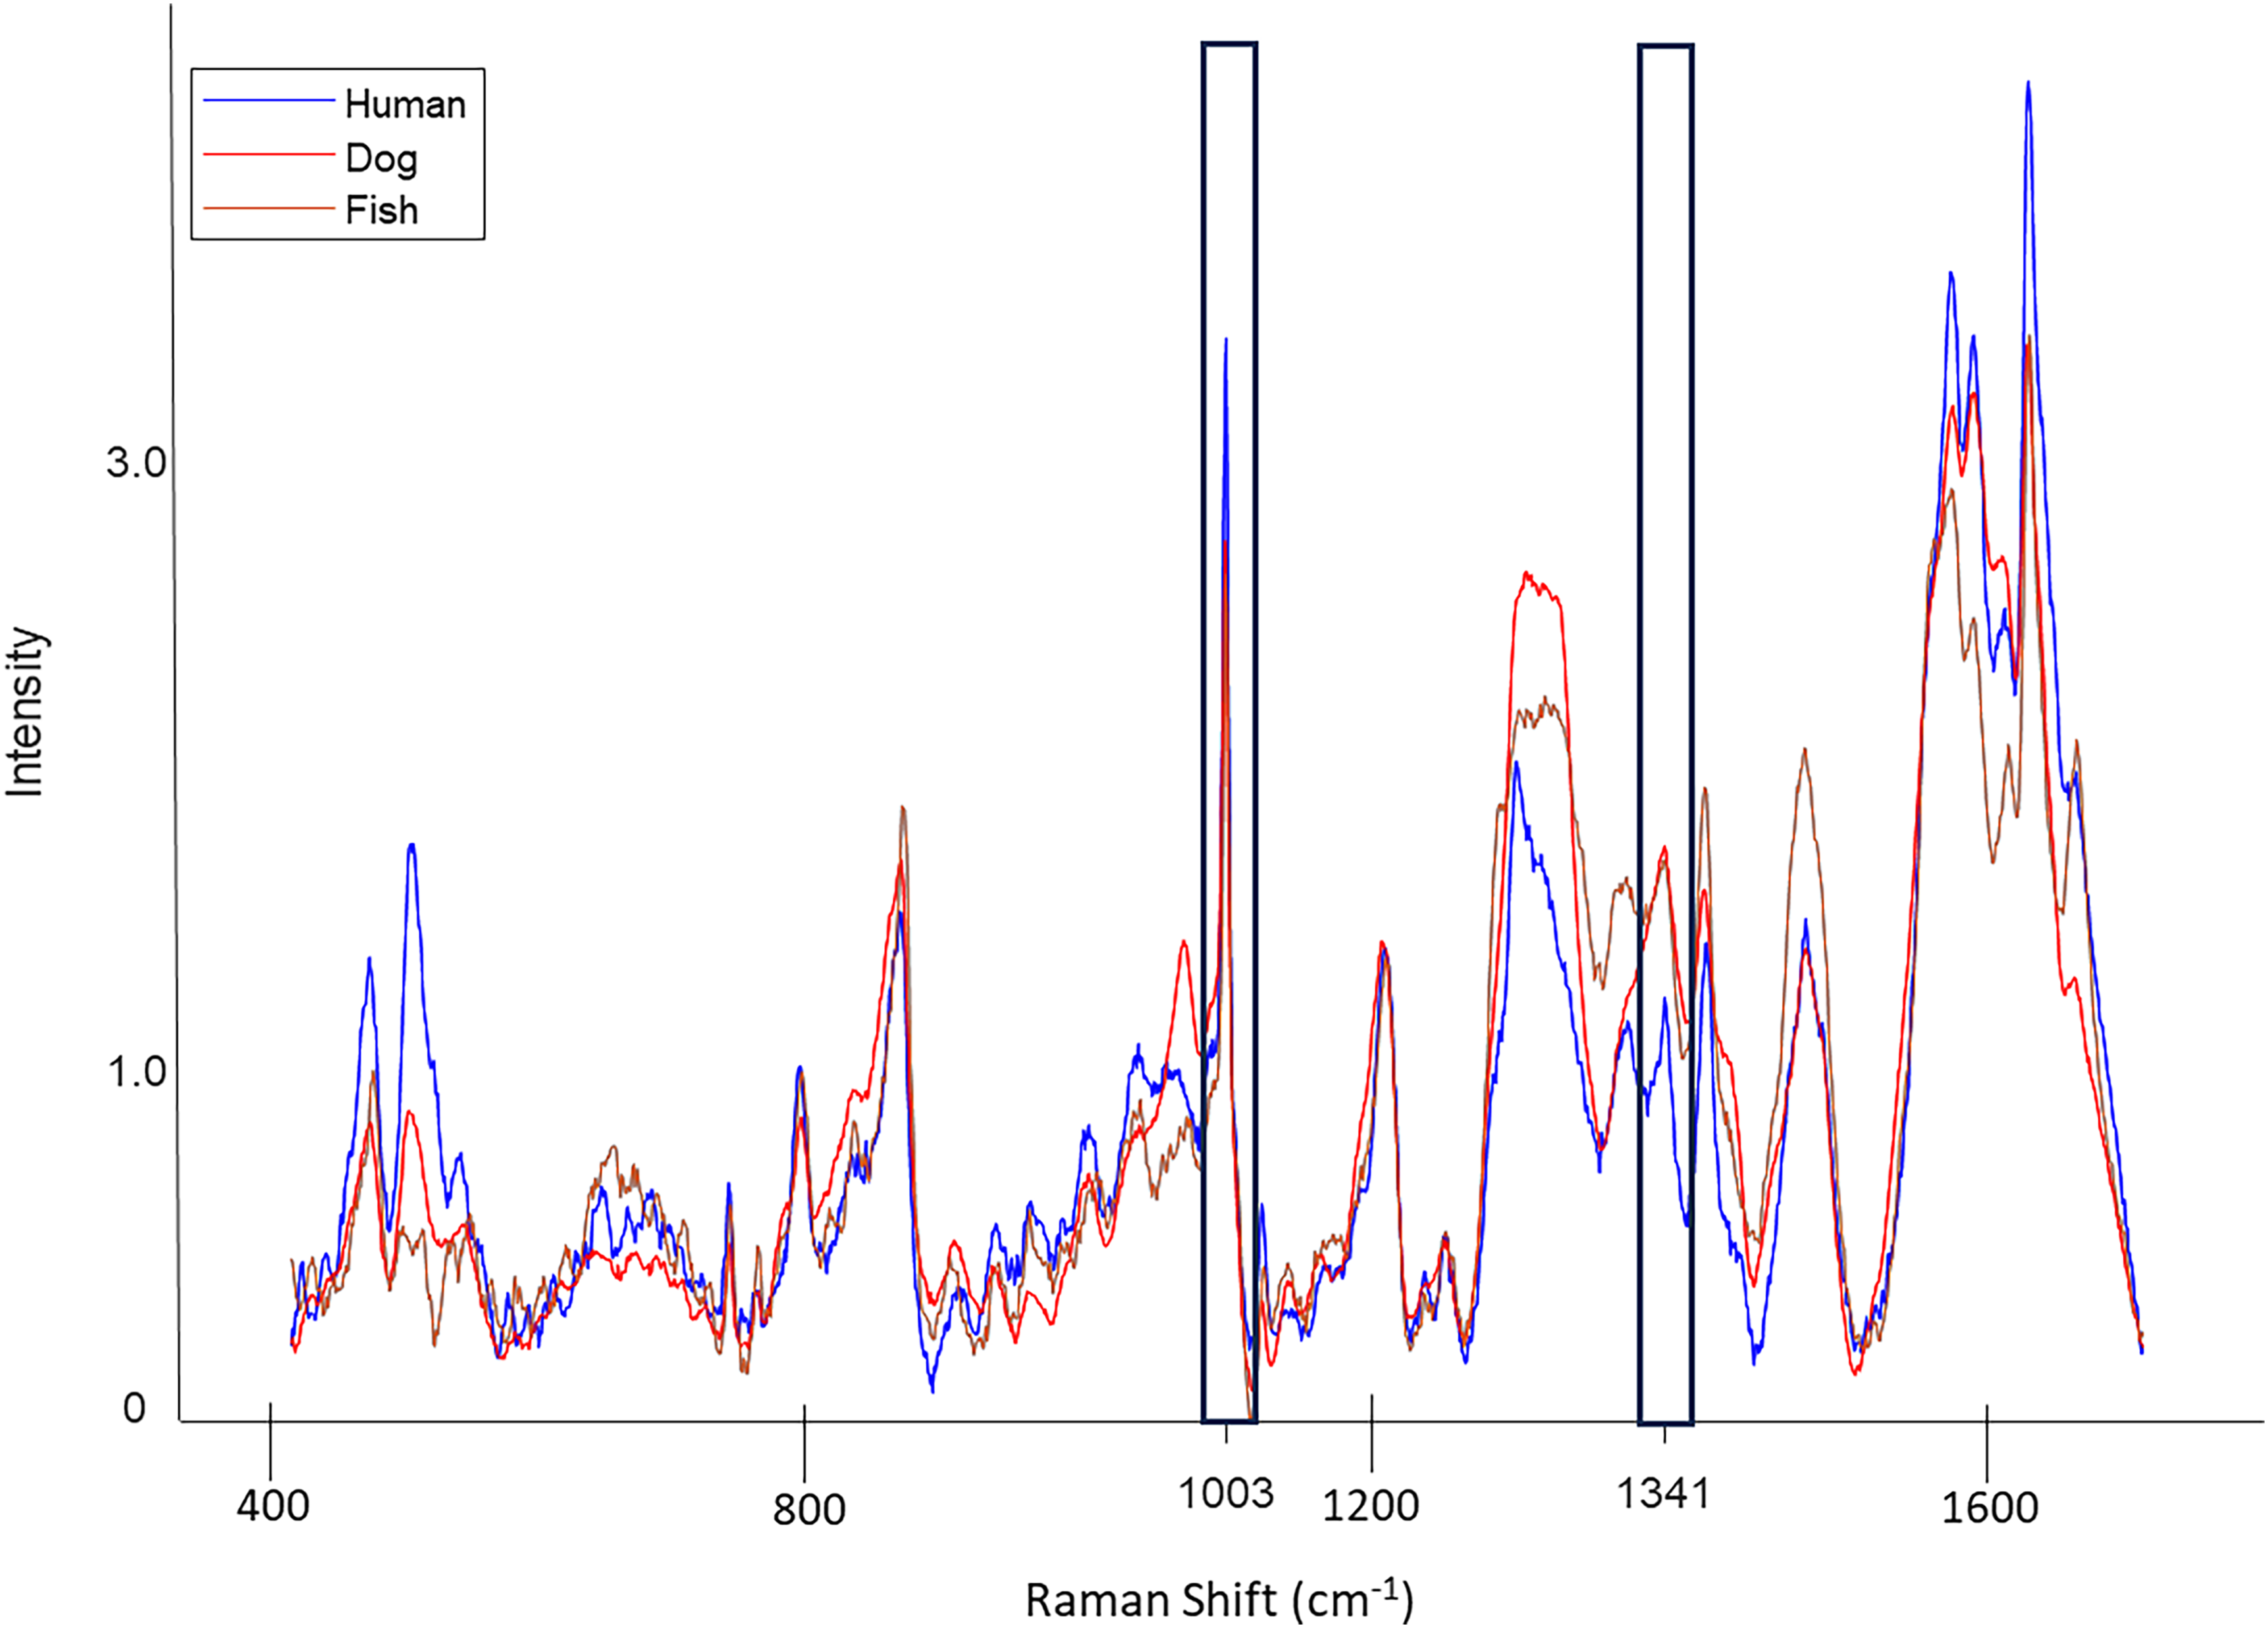
Averaged, baseline corrected, and normalized Raman spectra for three different species (human, dog, and fish). The vertical dotted lines indicate the bands that were used for the self-referencing ratio.

Stacked average Raman spectra of blood from all 19 species.
The Raman spectra of blood vary between species, but as compared to other body fluids, blood has a unique and distinctive Raman spectrum with peaks resulting from several independent components. Hemoglobin is composed of multiple peptides. These peptides are composed of proteins, which aid in oxygen transfer and are composed of many different amino acids. One such amino acid is tryptophan, which is prevalent within the overall structure of hemoglobin. 24 As hemoglobin is highly Raman active, the spectral contributions of hemoglobin have been shown to overwhelm the spectra of blood samples when irradiated using a 785 nm laser. 6 Thus, differences between species, on the basis of Raman spectra of their whole blood, are primarily attributed to the variations of vibrational modes of their hemoglobin structures. 7 The major contributions from hemoglobin are denoted at the Raman band 1341 cm−1, which is attributed to C–H bending in the tryptophan 25 and as aforementioned, 1003 cm−1, caused by the phenylalanine. As depicted in Figure 2, these peaks show the largest amount of variation between species. It was tentatively theorized that the variations in the intensity at these peaks are associated with differences in the concentration of either tryptophan or phenylalanine within hemoglobin between human and non-human blood. Thus, indicating that there are measurable differences in the composition of blood samples between species.
The next step for analysis was to determine the threshold to discriminate between human and animal bloodstains. The threshold used in the Bian et al. study was 1.7 while the ratio determined in this research was determined to be 2.8 for discriminating between human and animal species for bloodstains using an ROC curve, as shown in Figure 4. The previous work done by Bian et al. only tested three non-human species. In this work, the model was expanded to include 18 non-human species. During this process, the spread of the ratio increased for non-human species as was expected, as shown in Figures 5 and 6. The variation in the ratios between studies is attributed to the different pre-processing methods utilized. To determine the validity of the threshold, an ROC curve was generated, as shown in Figure 4. The threshold was determined by calculating the distance between the ROC curve to the ideal classification point (0.0, 1.0) shown on the orange curve. This information is shown in Table I. The threshold of 2.8 was chosen as it provided a sensitivity of 100% and specificity of 97%.
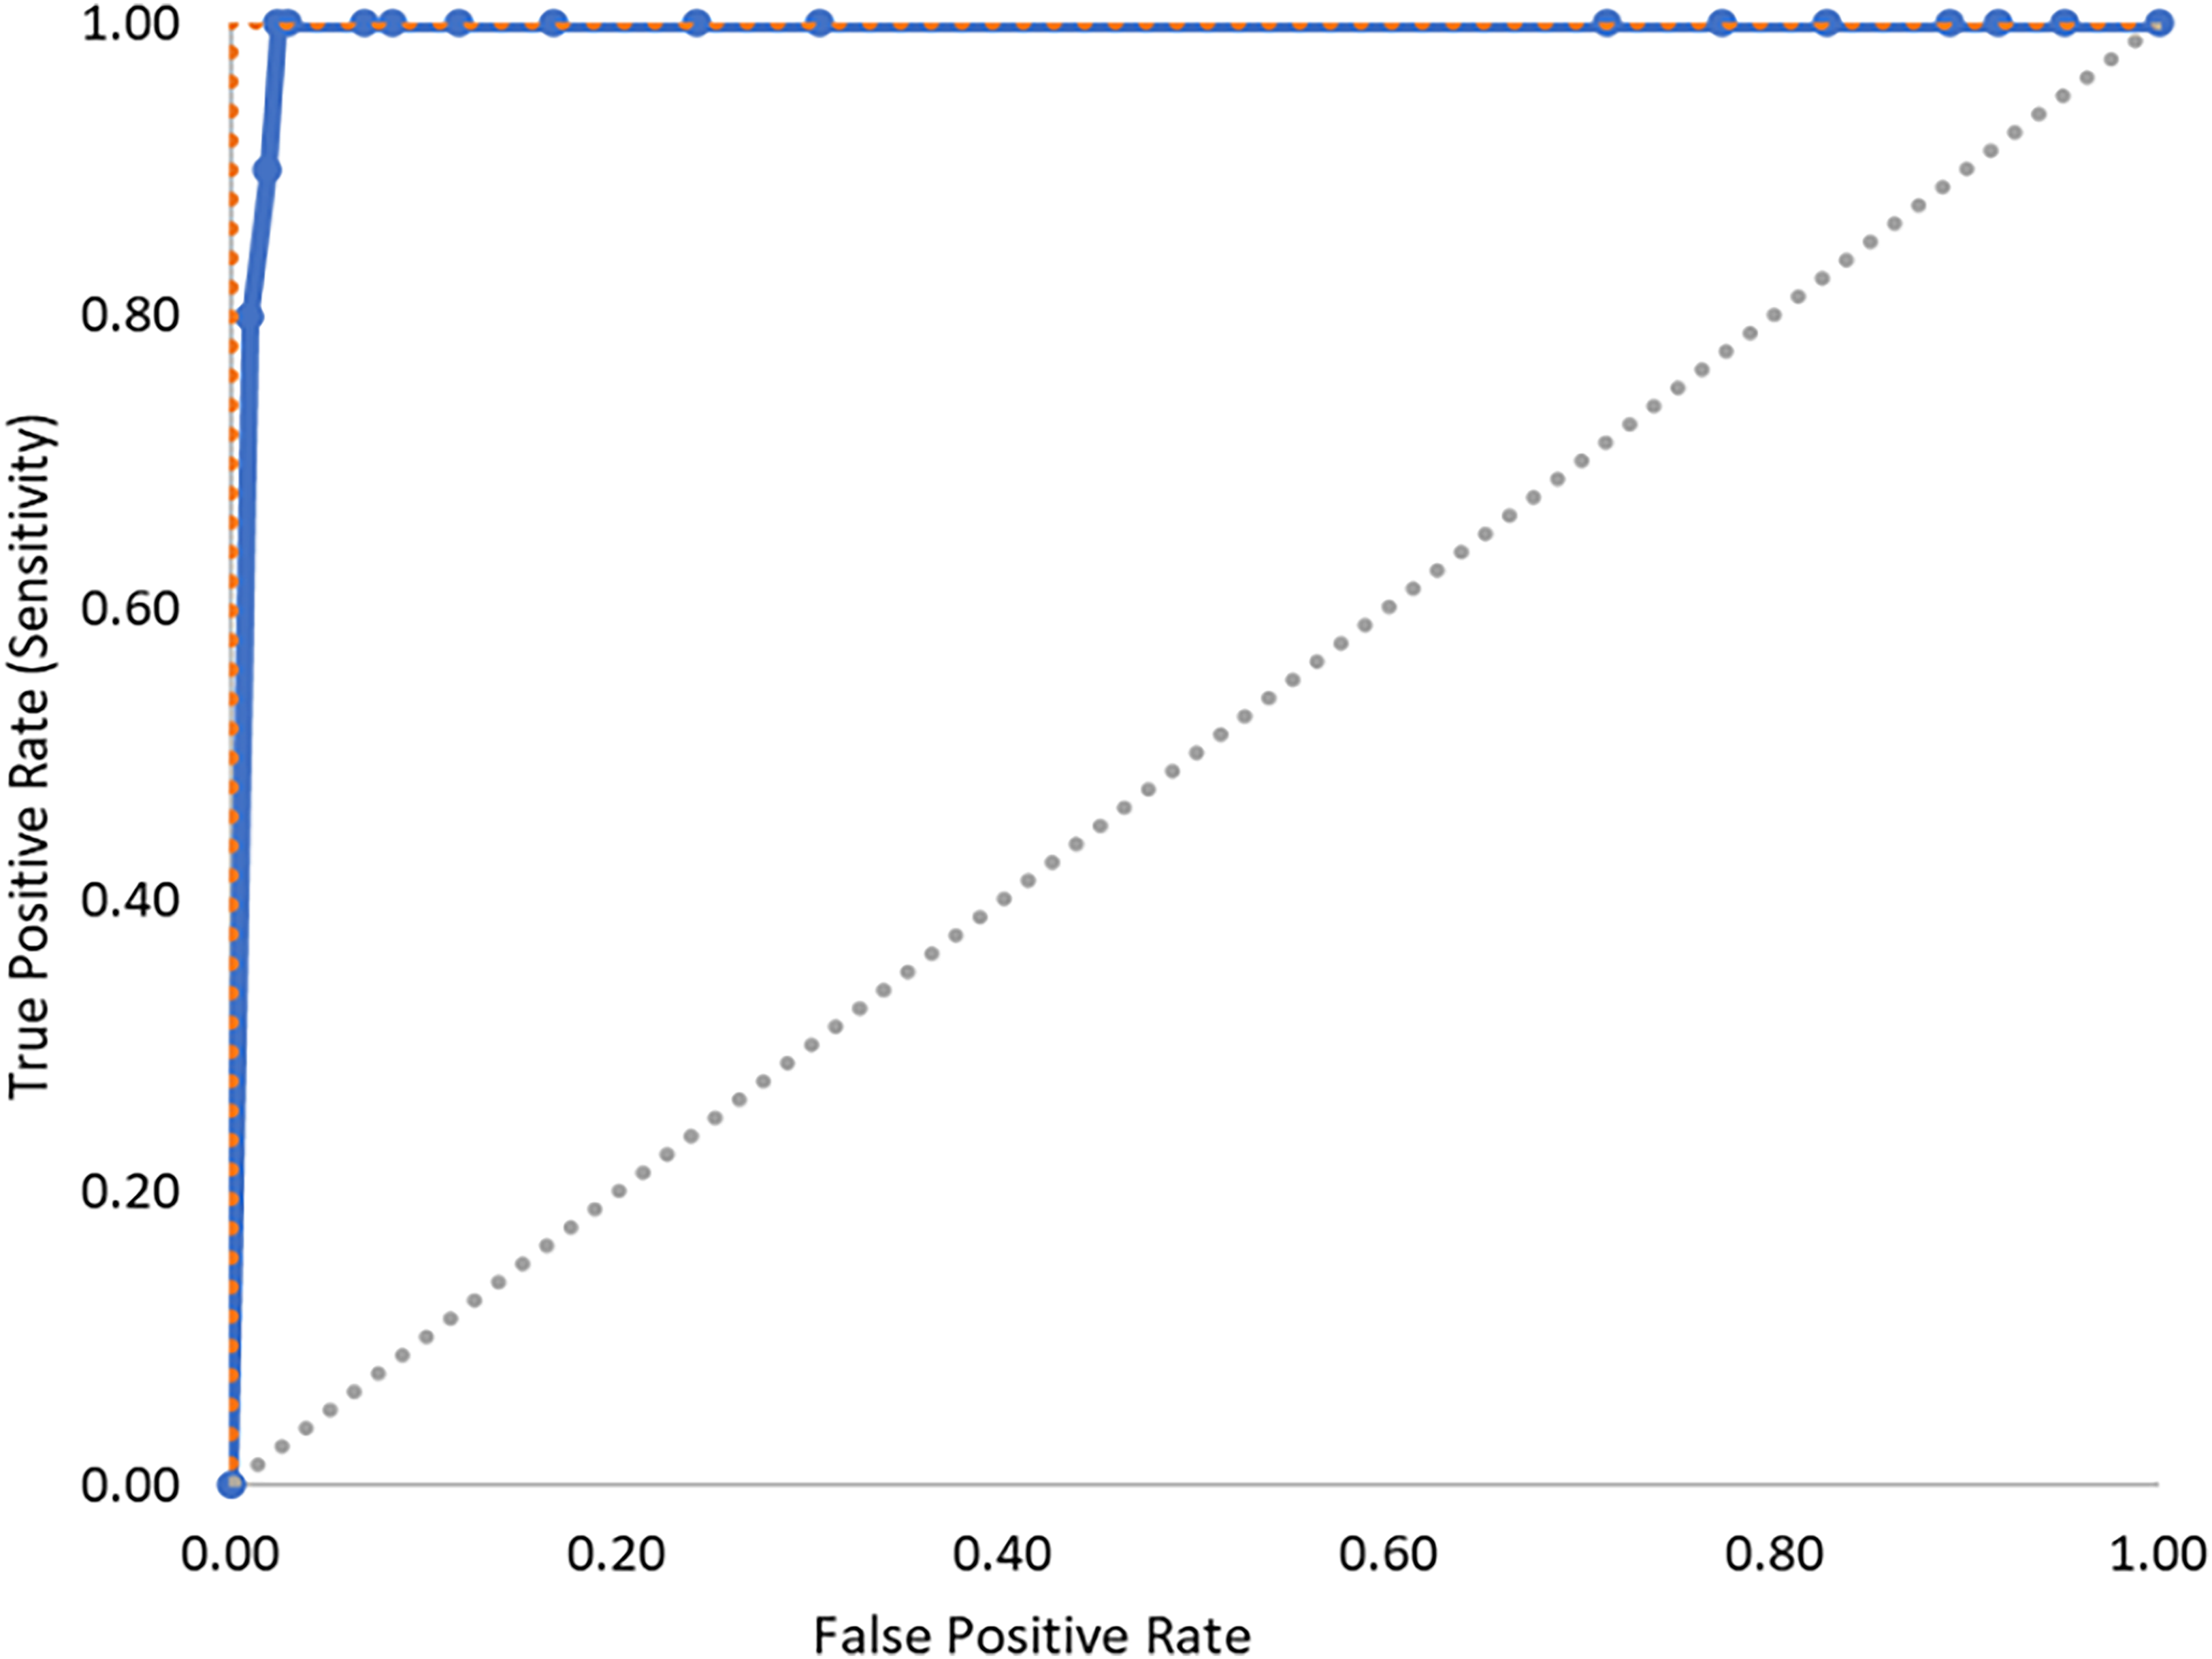
Receiver operating characteristic (ROC) curve to determine the optimal threshold to discriminate between human and animal samples.
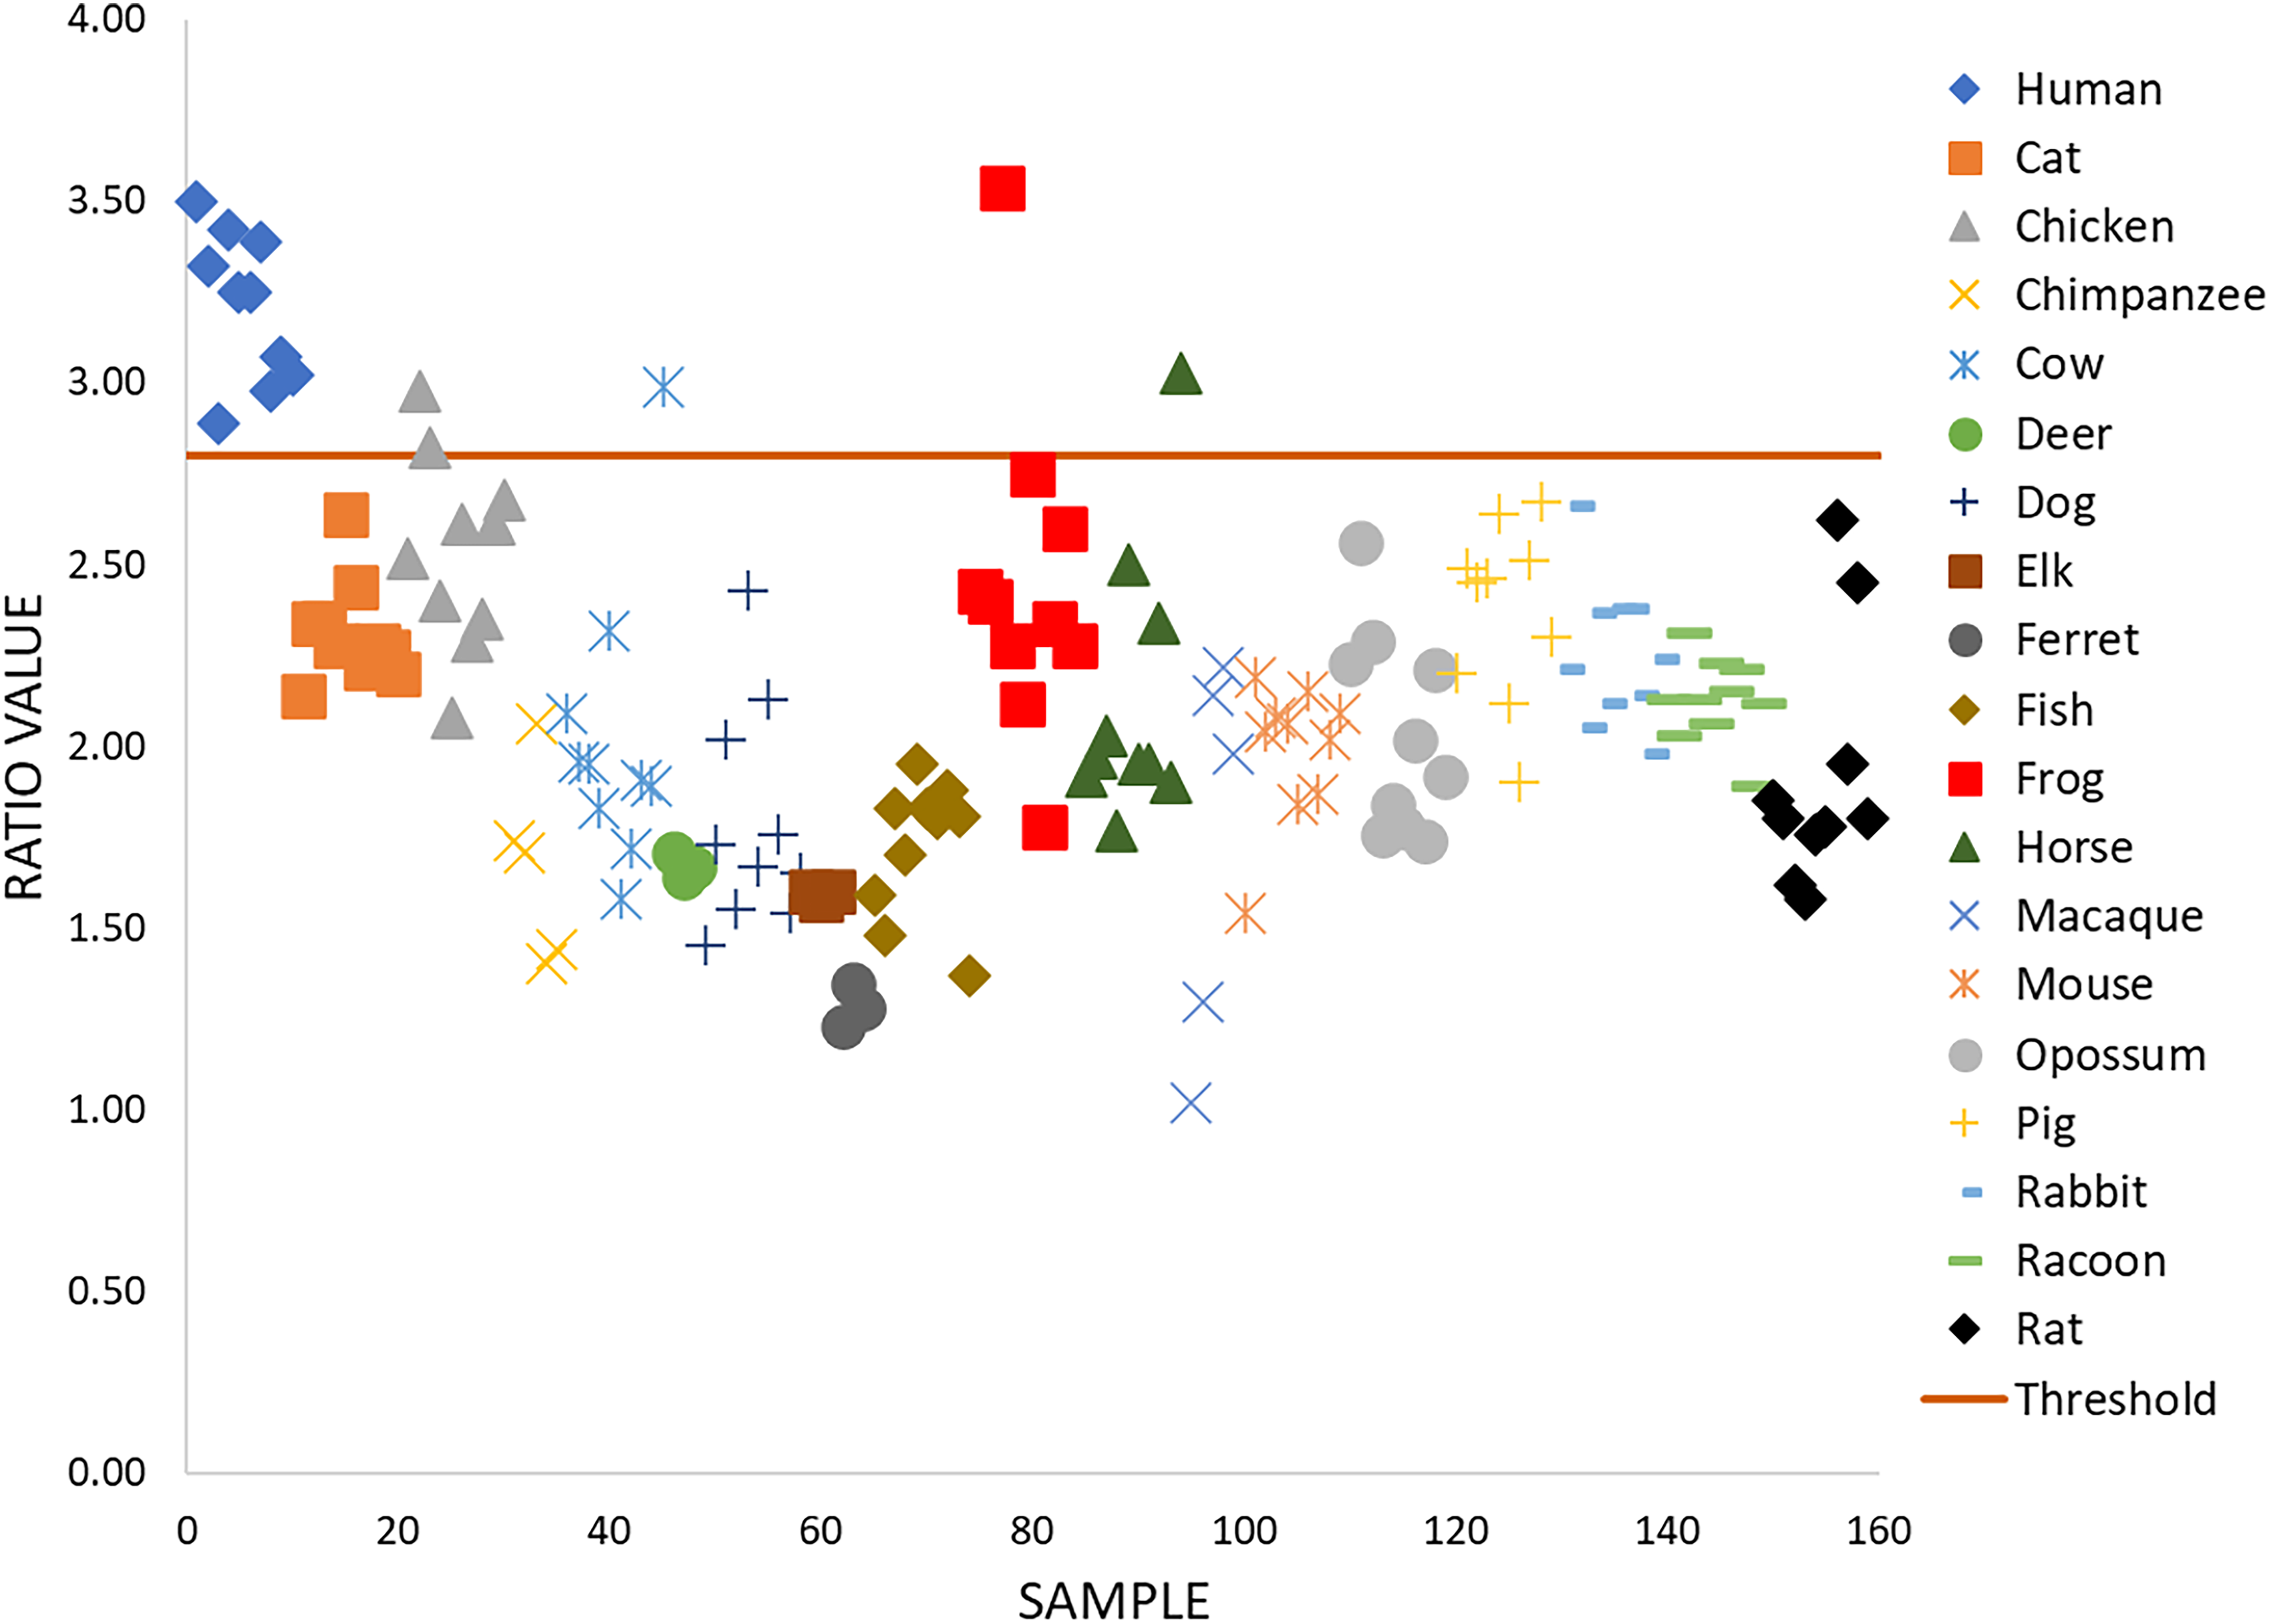
Plot of the ratio values for each donor. Each point represents the ratio of the peak intensity of 1003 and 1341 cm−1 for the average of all spectra associated with the respective donor. Specimens with ratios above the threshold are classified as human and specimens under the threshold are classified as non-human. The threshold is equal to 2.8.

A plot of the mean ratio values for each donor and lines out to one standard deviation from the mean in both the positive and negative direction. Each point represents the ratio of the peak intensity of 1003 and 1341 cm−1 for the average of all spectra associated with the respective species.
Values used for ROC curve creation to determine the ideal threshold for classification.

At each threshold value, the amount of correctly classified human and animal species are listed. Finally, the distance of each curve value from the ideal point (1.0, 1.0) is listed in the final column. The ratio value with the shortest distance was selected as the threshold.
After determining which Raman peaks to use for the ratio and the threshold, a plot of the ratio values was created for each of the samples, as shown in Figure 5. The ratio for values of peak intensity at 1003 and 1341 cm−1 varied greatly between the samples of human blood and non-human blood. This insight displays that statistically simplistic discrimination is possible between humans and non-human species. It also shows a path for biochemical and zoological investigation on why humans differ in this respect from other animals and what, if any, effect this difference has on biological processes. It is uncertain why there is such a level of diversity of variance for ratio values within each species, but the plan is to investigate this phenomenon more in future studies. Notably, a single frog donor had a ratio value that varied far enough from the rest of its species that it was misclassified as “human.” While there is no clear explanation for these factors, a study of the concentrations of tryptophan and phenylalanine in the blood of these animals may provide some insight into the matter.
Although serviceable for human–non-human differentiation, this technique will likely struggle with species determination within the non-human class due to the level of overlap in ratio value ranges. Figure 6 shows the average and standard deviation of the ratio value for each species. The associated average ratio value and the standard deviation are listed in Table II. Based solely on the study of peak ratio differences, it is difficult to conclusively state why this significant overlap between animal species exists when there is not one between humans and non-humans. However, previous research for the creation of a species-specific model attributes differences between animal species to interspecies differences in the hemoglobin structure. 11 This was shown in variations in the 1200–1265 cm−1 range in the Raman spectra of animal blood. For the self-referencing peak algorithm ratio, the peaks used for this method fall outside of this range. Therefore, it is understandable that an overlap between the various non-human species is present. A more comprehensive investigation into the biochemistry of non-human blood samples would be required to fully characterize the cause of interspecies variations.
The average band-intensity ratio value for each species and their respective standard deviation.

In this study, the proposed model can differentiate between human and non-human blood with high accuracy. The ratio between 1341 and 1003 cm−1 bands’ intensity values yielded the greatest number of positive differentiations between human and non-human blood in both this work and the study by Bian et al. 1 The set of peaks, when used to generate an intensity ratio for the algorithm in this study, correctly classified almost all non-human samples as non-human. Two chicken samples, one cow sample, one frog sample, and one horse sample were misclassified. Leading to a true positive classification rate of 96.2%. More trials with a greater quantity of specimens and species are required to expand the validity of this method. Discrimination between humans and non-human animals by means of ratio comparison allows for bloodstains to be classified with high accuracy with little statistical training for the analyst. This can enable a more accessible and effective analysis of evidence without sacrificing accuracy or the ability to perform additional analysis on the samples afterward.
Conclusion
In this study, a binary self-referencing algorithm based on Raman band-intensity ratios was shown to be a reliable method for species determination via dried blood samples. The two Raman bands used to generate these ratios were 1003 and 1341 cm−1, as these represented biomarkers that possessed the greatest human–non-human differentiation. Both the 1003 and 1341 cm−1 Raman bands are caused by inelastic scattering of light within hemoglobin. Therefore, it is tentatively hypothesized that variations in the peak intensities at these points were associated with differences in the structure of hemoglobin between human blood and non-human blood. 11 However, more research is needed to investigate these differences. In future studies, the chemical composition of each species’ blood can be further analyzed to determine the cause for the differences observed in the peak ratios. Additionally, it is important to account for environmental effects, and thus testing this model on samples exposed to common environments is necessary.
This binary model is an easy-to-use statistical technique that does not require knowledge of advanced chemometrics, making this an ideal technique for forensic examiners. The method performs well for discriminating between human and non-human samples. An ROC curve was used to determine the ideal threshold for classification of species. This was demonstrated as there was little overlap between ratio ranges between humans and most of the 18 non-human species. Two chicken samples, one cow sample, one frog sample, and one horse sample were misclassified. Accounting for the misidentifications, the true positive classification rate was 96.2%. Therefore, this analysis can be used as a method that can discriminate between human and non-human blood once the type of body fluid is confirmed. To assure the validity and expand the proven utility of this model, it is prudent that more species be continually tested and incorporated. This technique is useful in providing preliminary human-centric classification and may pave the way for models that can be used in criminal investigations to determine whether a bloodstain is human in origin without the use of chemical tests. The use of Raman spectroscopy for this type of confirmatory analysis has advantages over other current methods, it is nondestructive to the sample, shows the potential for the analysis of a sample in situ, and the resulting data can be used for multiple forms of analysis. This will allow forensic analysts to generate a significant quantity of high-quality information from bloodstain evidence; in turn, allowing it to hold greater weight during criminal investigations.
Footnotes
Acknowledgments
The opinions, findings, and conclusions or recommendations expressed in this publication are those of the authors and do not necessarily reflect those of the National Science Foundation and the U.S. Department of Justice.
Declaration of Conflicting Interests
The authors declared no potential conflicts of interest with respect to the research, authorship, and/or publication of this article.
Funding
The authors disclosed receipt of the following financial support for the research, authorship, and/or publication of this article: This project was supported in part by the National Science Foundation under Grant No. 2052030 and the National Institute of Justice, Office of Justice Programs, U.S. Department of Justice Award No. 2017-DN-BX-0135 (Igor K. Lednev).