
Abstract
Ecosystem service flow refers to the whole process of ecosystem service production, delivery and utilization, which is closely related to social-ecological processes. However, quantifying the entire ecosystem service flow process remains challenging, placing limits on the management of social-ecological systems to improve human wellbeing. Here, we explored the relationship between social-ecological processes (e.g., product transfer, matter cycling, energy flow and information delivery) and the spatial flow of ecosystem service. Then, we reviewed methods quantifying the spatial flow of ecosystem service. Finally, we proposed a comprehensive framework for quantifying the whole process of ecosystem service flow in terms of social-ecological processes. The framework consists of the quantification of ecosystem service supply and demand, the spatial flow of ecosystem service between suppliers and consumers, and the quantification of utilized ecosystem service. To better quantify the whole process of ecosystem service flow, we need to further understand the factors impacting ecosystem service flow, develop process-based models integrating beneficiaries and infrastructure, and establish social-ecological approaches to inform ecosystem service flow governance.
Keywords
Introduction
Ecosystem service flow (ESF) refers to the whole process of the generation, delivery, and final realization of ecosystem services (ES). ESF acts as a bridge between natural ecosystems and human society (Wang et al., 2022). Studying ESF is beneficial for answering these fundamental questions: Where are ES generated? How are they flowing or delivering to beneficiaries? Where and how much is realized by people? (Bagstad et al., 2013a). This information is crucial for sustainable ecosystem management. As can be seen, quantifying ESF is an important basis for ES policy application.
ESF is a concept derived from the study of ES supply and demand. Early ES studies mainly focused on the supply of ES, which were insensitive to whether people used it (Zheng et al., 2016). Gradually, researchers realized that ES can only occur when there is human demand. They found that there was usually a mismatch between the supply and demand of ES (Chen et al., 2019; Wang et al., 2019a) when it flows to beneficiaries to fulfill human demand (Lin et al., 2021). Accordingly, many researchers have tried to understand and define ESF (Figure 1). There are two main interpretations of ESF in existing studies (Wang et al., 2022). On the one hand, ESF is regarded as the amount of ES used/realized by human beings (Schirpke et al., 2019a). On the other hand, ESF is considered as a flow process of produced ES (Bagstad et al., 2013a). Recently, more and more studies have found that a comprehensive assessment of the whole process of ESF is important for effective policy implementation (Metzger et al., 2021; Wang et al., 2022). The whole process of ESF refers to how realized ES flows from ES providing area to meet ES demand, which is a result of the interaction among ES supply, spatial delivery and demand (Bagstad et al., 2013a). It shows how and how much natural ecosystems (e.g., forest, grassland and wetland) produce potential ES, how potential ES interact with human participation to deliver benefits, and then how delivered ES interact with different beneficiaries to fulfill human demand. Only by untangling the whole process of ESF can we take measures to protect and manage natural ecosystems and human-made capital to facilitate sustainable ESF management (Lin et al., 2021; Metzger et al., 2021).
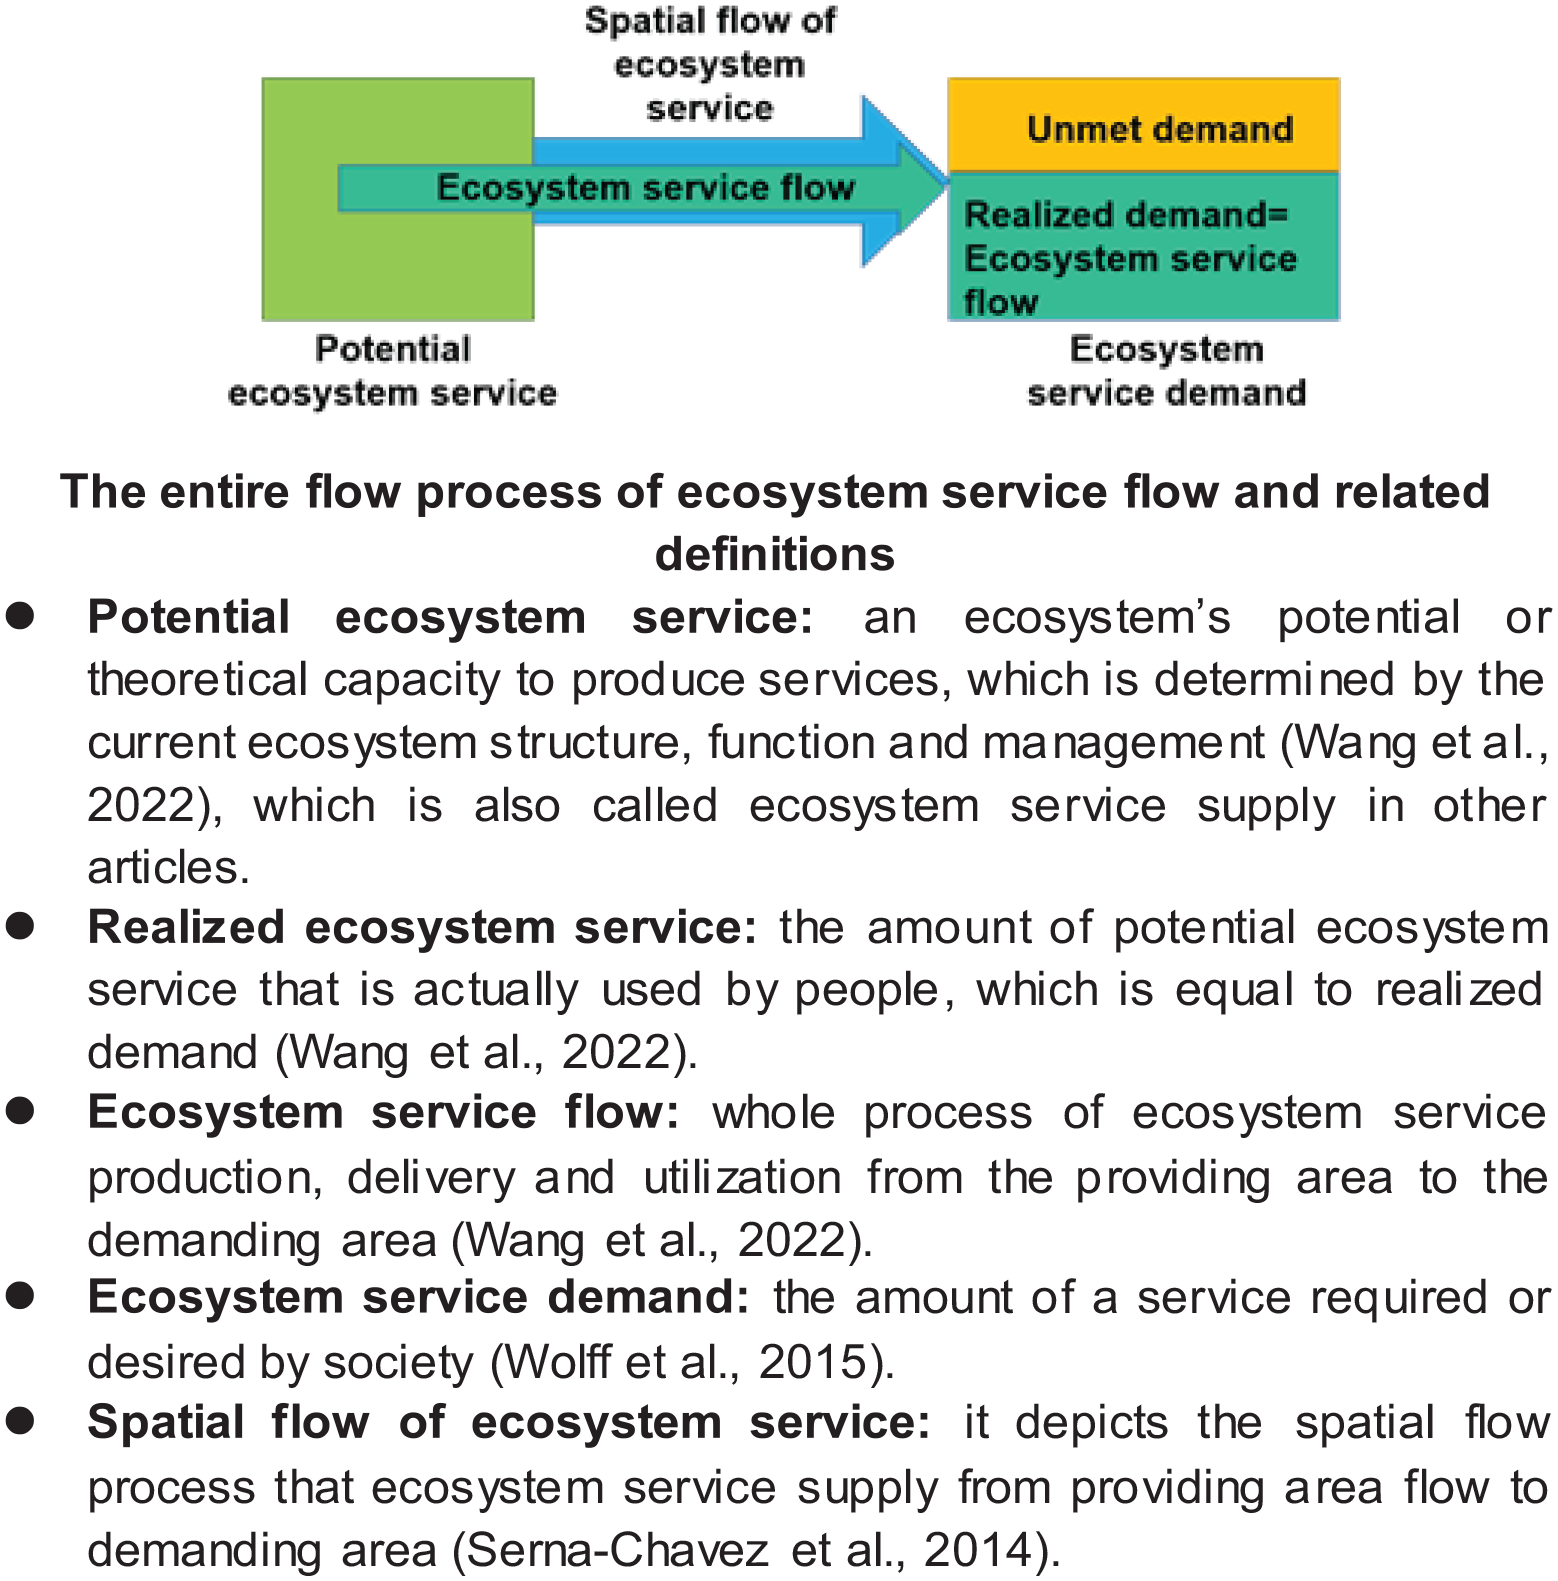
Definitions used in relation to ecosystem service flow.
Understanding the spatial flow of ES supply to beneficiaries is the key to quantifying the whole process of ESF. ES realization usually is the result of the interaction between the spatial flow of ES supply and social-ecological processes (e.g., product transfer, matter cycle, energy flow and information delivery) (Metzger et al., 2021). For example, the flow process of urban cooling effect service is the result of urban vegetation preventing the propagation of heat energy (Rioux et al., 2019). The final realization of ES is formed by coupling the ESF process with the stakeholders because ES can only be realized by human participation. For example, the freshwater provisioning service flows along a river system and becomes ESF when it is used by people downstream for drinking or irrigation, for instance. As seen, social-ecological processes play an important role in the formation of ESF (Palomo et al., 2016), however, there is no unified framework for quantifying ESF in terms of socio-ecological processes.
Because many papers have already explored the quantification of ES supply and demand (Sharp et al., 2014; Wei et al., 2017; Wolff et al., 2015), and in order to propose a comprehensive framework to quantify ESF, the main focus of this paper is on the spatial flow of ES through social-ecological processes, the quantification methods for the spatial flow of ES and the comprehensive framework for quantifying ESF. The objectives of this study were (1) to clarify the relationship between social-ecological processes and the spatial flow of ES, (2) to review the methods for assessing spatial flows of ES, and (3) to propose a comprehensive framework for quantifying ESF. We aim to provide a comprehensive framework of ESF quantification considering social-ecological processes, facilitate more focus on the social-ecological processes, and in turn bring more consistency to the quantification of ESF.
Relationships between social-ecological processes and the spatial flow of ES
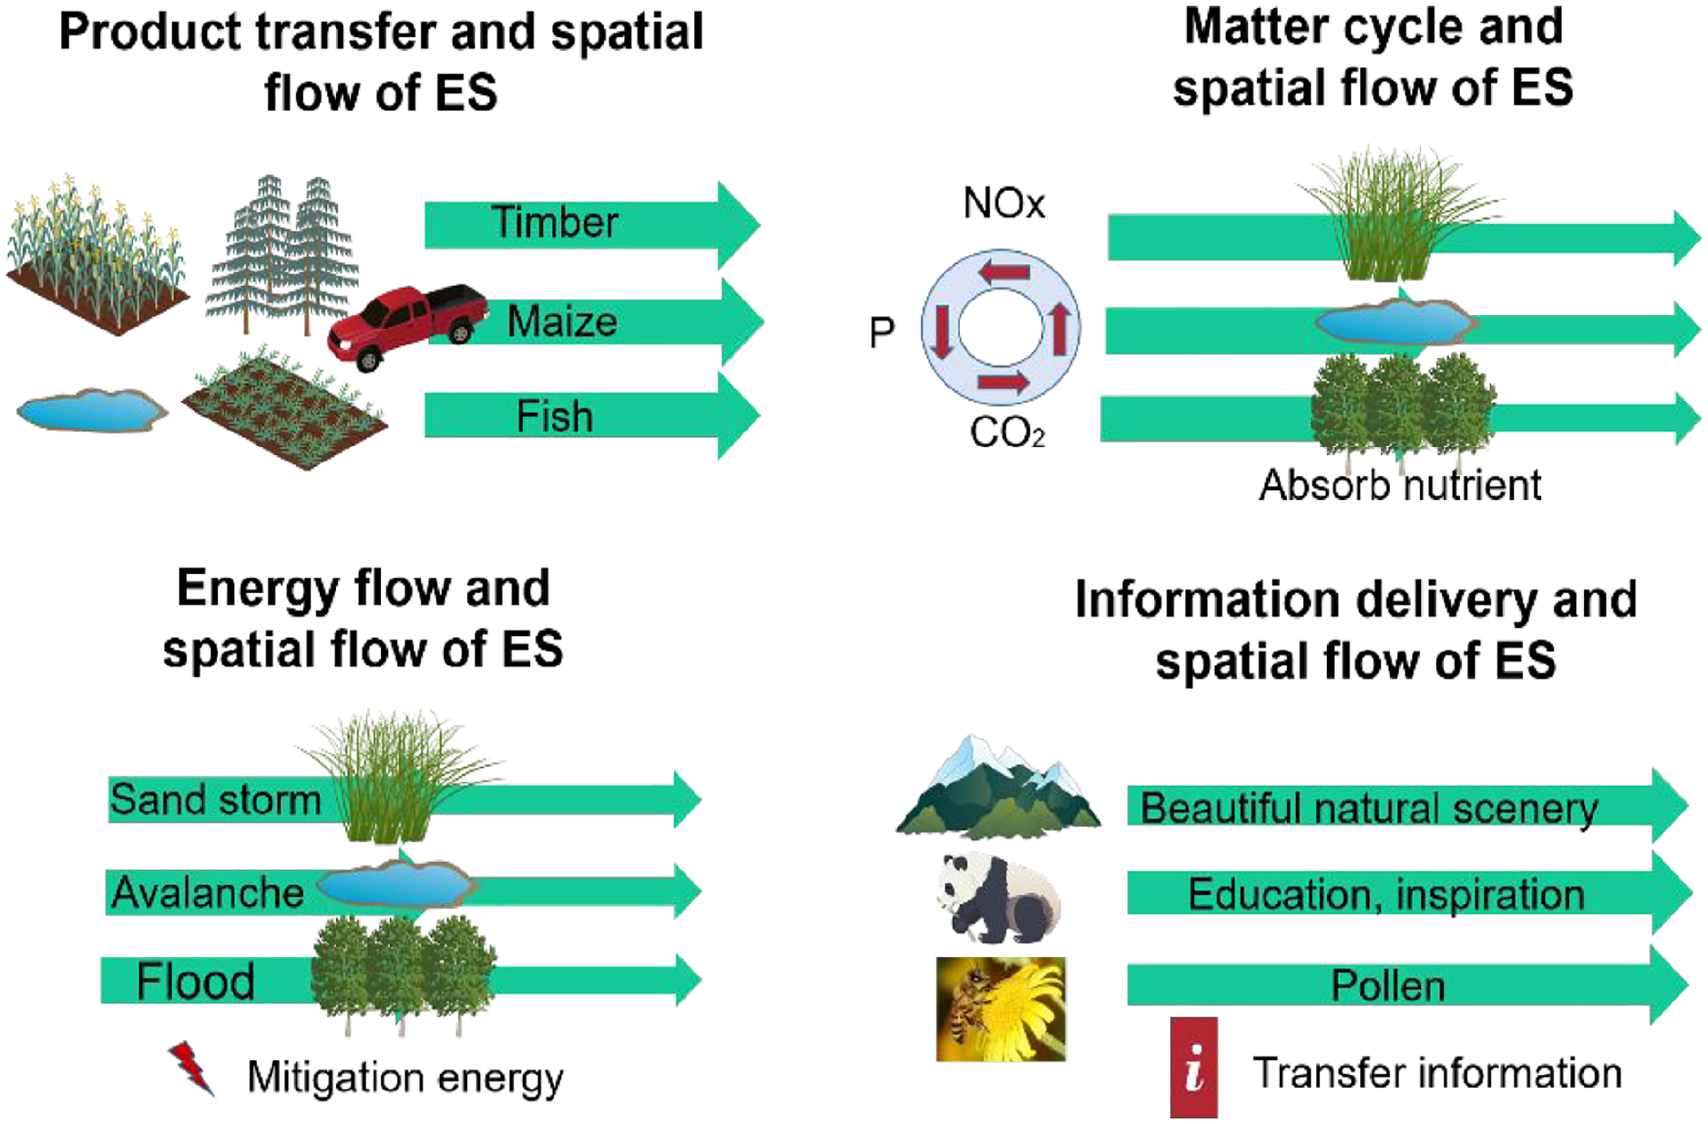
The ES providing area and benefiting area are usually spatially separated (Schirpke et al., 2019b). The spatial flow of ES is the process by which potential ES move from the providing area to benefiting area. During the flow process, the spatial flow of ES usually interacts with various ecological (e.g., matter cycling, energy flow and information delivery) and social processes (e.g., product transfer) (Schröter et al., 2018; Shen and Wang, 2021). For example, the formation of water provisioning service flow depends on the product attributes of water, while flood regulation service depends on the kinetic energy reduction process of the interaction between water and vegetation, and water-related landscape service depends on the transmission of aesthetic information. To further understand the relationship between social-ecological processes and the spatial flow of ES, we categorized the relationship into four types according to the main social-ecological process which contributed to ES realization (Figure 2 and Table 1): product transfer and ES, matter cycle and ES, energy flow and ES and information delivery and ES.
The relationships between social-ecological processes and the spatial flow of ES.
The characteristics of the spatial flow of ecosystem services.
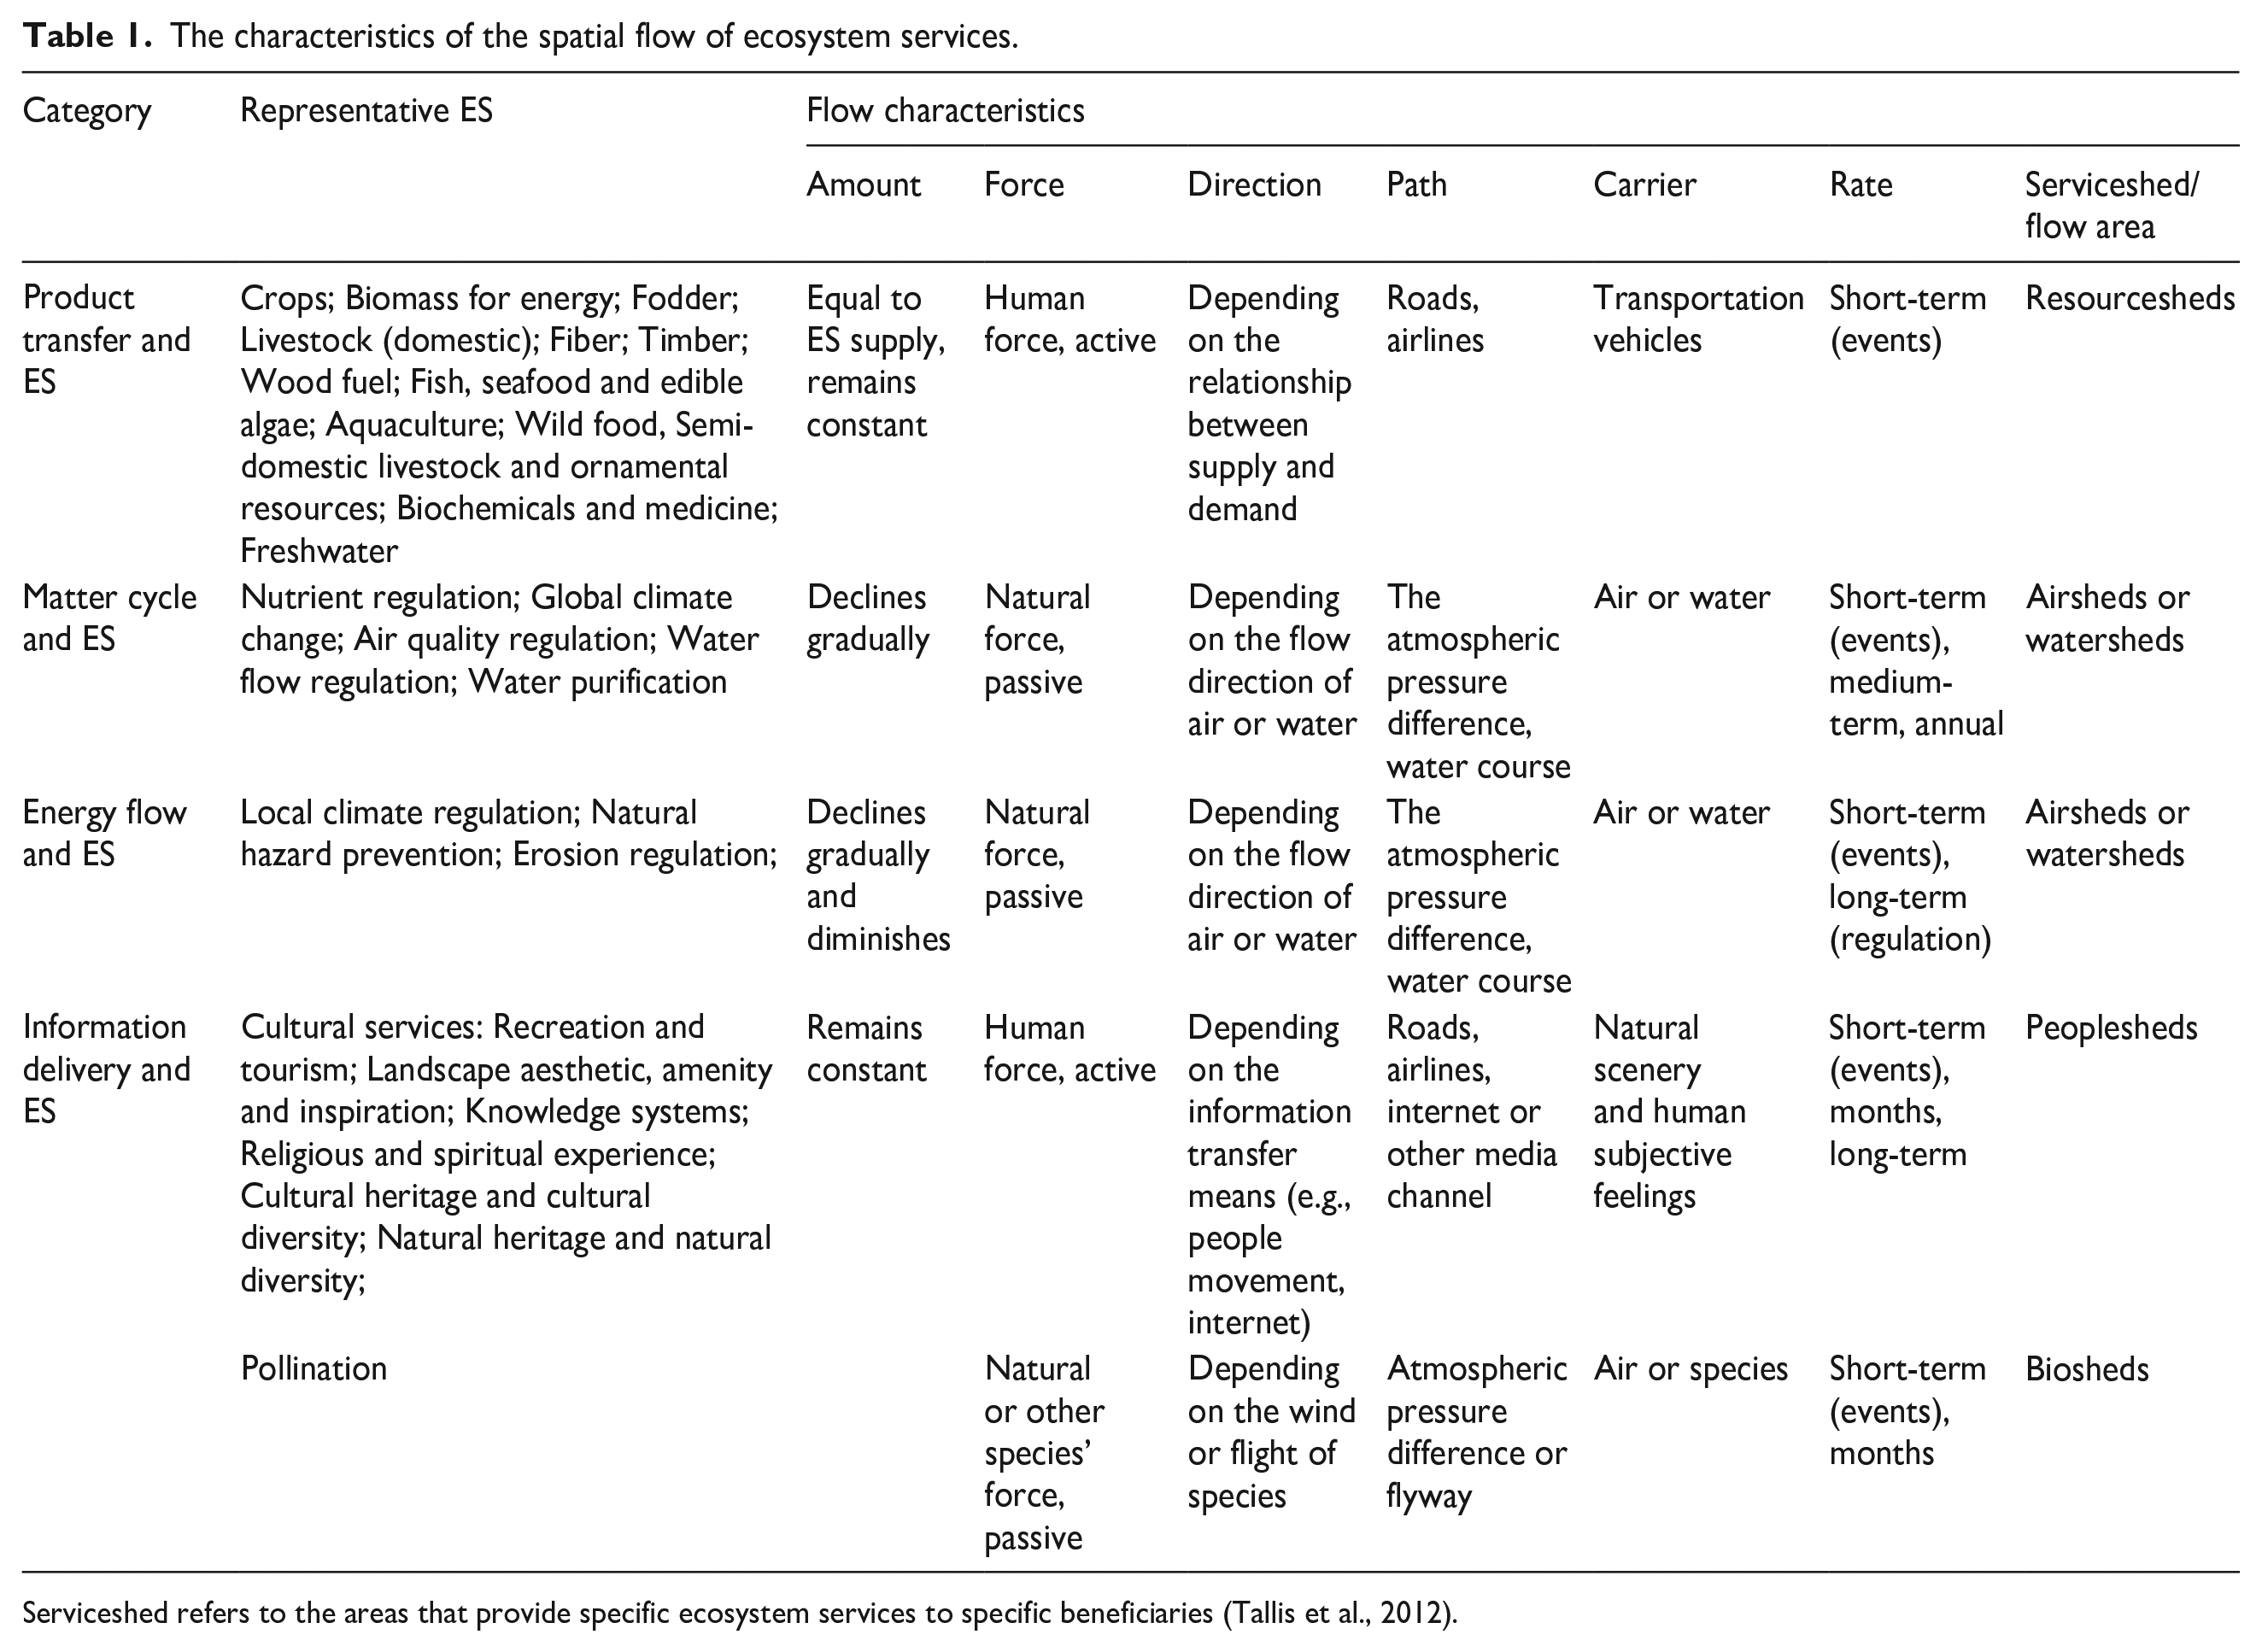
Serviceshed refers to the areas that provide specific ecosystem services to specific beneficiaries (Tallis et al., 2012).
Product transfer and ES
The relationship between product transfer and the spatial flow of ES mainly depends on social processes (in other words, human participation). This kind of relationship commonly appears in provisioning services (e.g., crops, timber and fish). For example, rice production in a region with a surplus will flow to a region with demand through commercial interactions (Dang et al., 2020). The amount of ES for product flow is usually equal to produced ES and remains constant along the flow process. The flow direction tends to depend on the relationship between ES supply and demand. Usually, produced ES travels from the supply area (e.g., farmland, forests or pond) to the demand area (e.g., rural house or urban area) on a local scale, or from the sending system (supply > demand) to the receiving system (supply < demand) through human actions (e.g., transportation vehicles along roads or airlines) on a regional or global scale (Xie et al., 2019). The flow rate of product transfer depends on the rate of transportation. The flow area between the product-producing area and the demanding area is also called a “resourceshed” (Jones et al., 2022).
Matter cycle and ES
The relationship between matter cycle and the spatial flow of ES depends on the ecological processes of the matter cycle (e.g., nitrogen oxide [NOx], phosphorus [P] and carbon dioxide [CO2]). This kind of relationship mainly appears in regulation services related to nutrients (e.g., air quality, water purification and global climate regulation). For example, the NOx in the air will be trapped or deposited through a natural system (e.g., urban trees, forest or grass) and the air quality will improve after the matter cycle (Charles et al., 2020). The flow direction of a matter cycle usually depends on the flow of the natural carrier (e.g., air, water) along a natural pathway (e.g., wind flow path or water course) and is controlled by passive natural forces (e.g., gravity or air pressure difference). The flow rate depends on the rate of the matter cycle (medium-term, annual). The flow area of the matter cycle can be local, regional or global, and can be called “airsheds” or “watersheds” (Jones et al., 2022).
Energy flow and ES
The relationship between energy flow and the spatial flow of ES mainly depends on natural vegetation to reduce the energy of natural hazards (e.g., flood, avalanche, tropical cyclone or sandstorm). This kind of relationship tends to appear in some regulation services related to hazards (e.g., flood regulation, prevention of avalanches, local climate regulation or erosion regulation). For example, wetland protection and restoration can facilitate flood attenuation (Goyette et al., 2021). The flow direction of energy-based ES is usually controlled by natural forces. For example, the energy of a tropical cyclone comes from the heat released when water vapor condenses over the ocean. Tropical cyclones usually affect coastal inhabited areas and cause loss of life, property damage and infrastructure destruction (Mansour, 2019). The flow rate depends on the event. The area of energy flow is usually local, although some are regional, and can also be called “airsheds” or “watersheds” (Jones et al., 2022).
Information delivery and ES
In order to better illustrate the relationship between information delivery and service, we first divide the relationship into two categories according to the presence or absence of human participation: human-related information delivery and ES; nature-related information delivery and ES. Human-related information delivery mainly comes from cultural services (e.g., recreation and tourism, landscape aesthetics, amenity and inspiration), the spatial flow of which depends on the movement of people (Schröter et al., 2018). For example, pandas have been transferred from China to the zoos of other countries by humans, and visitors go to the zoo, then the cultural service is realized (Schröter et al., 2018). The information transfer is usually non-material (e.g., ideals, inspiration) because the use of information depends on subjective personal feelings. Therefore, it is difficult to describe the flow direction of information. Consequently, we have to analyze the flow characteristics of a specific service according to its transmission pathway and the beneficiaries. The flow rate of information can be short-term (events), months-long or long-term, the flow area can be local, regional or global, and can be called “peoplesheds” (Jones et al., 2022). Nature-related information delivery can produce a pollination service, the spatial flow of which depends on wind or wild pollinators to carry pollen to crops (Lowenstein et al., 2015). The area where pollinators flow can be called “biosheds” (Jones et al., 2022).
Quantification methods for the spatial flow of ES
Many methods have already been developed to quantify ES supply and demand (Sharp et al., 2014; Wei et al., 2017; Wolff et al., 2015), which is the basis for quantifying the amount of ESF (Healy and Secchi, 2016). Therefore, we only focus on the quantification methods for the spatial flow of ES between supply and demand. We introduce the methods according to the relationship between social-ecological processes and the spatial flow of ES.
Product-based methods
The spatial flow of product-based ES mainly depends on human participation. Therefore, the first step to quantify the spatial flow is to determine the supply and demand relationship between two regions and/or the flow path (e.g., roads) between local producing areas and demanding areas, and in turn determine the spatial flow direction of ES. For flow at a regional or global scale, the input and output data for many product-based ES have been recorded in trade databases (e.g., The Eora Global Supply Chain Database; EXIOBASE database) (Lenzen et al., 2013; Stadler et al., 2018) because the product is usually traded in the market. In addition, the multi-region input–output model and geographic information systems have been widely used in cross-border trade and related issues, which are good ways to quantify and map the spatial flow of product-based ES (Lenzen et al., 2013; Liu et al., 2015). Furthermore, other methods quantifying the spatial flow of product-based ES are based on the principle of the first law of geography: anything is related to something else, but things in the neighborhood are more relevant than things in the distance, such as the two-step floating catchment area (2SFCA) method that combines supply and demand information with transport distance, and the linear programming method (Liu et al., 2022; Shi et al., 2020; Wang et al., 2022).
These product-based methods provide the first attempt to quantify the spatial flow of ES using statistical data or the distance principle. However, these methods lack analysis of the ecological and social attributes of the providing/sending system and the demanding/receiving system.
Matter-based methods
The process of matter cycles involves many aspects, such as the atmosphere, soil, water and vegetation. Therefore, some studies used the service flow effect method to quantify the flow of matter-based ES by comparing the final ES supply and demand, but did not depict the flow process (Goldenberg et al., 2017). For example, the flow of nutrient retention service was not measured but the flow amount was calculated as the difference between nutrient load and nutrient export in a sub-watershed (Hou et al., 2020; La Notte et al., 2017). Only a few ES studies quantify the spatial flow of matter-based ES using process-based models. For example, the spatial flow of air quality regulating ES was assessed through an atmospheric dispersion model (Gaussian puff transport model) (Charles et al., 2020); the spatial flow of soil conservation service was assessed by the model considering the sediment transport process (Xu and Pan, 2022). There are also many well-developed matter cycle models, such as the highly-integrated process-based ecosystem model (dynamic land ecosystem model) that couples major biogeochemical cycles, the hydrological cycle, and vegetation dynamics (Wang et al., 2020), which can be incorporated and developed to quantify the spatial flow of matter cycle-based ES. We recommend the incorporation of more process-based models to quantify matter-based ES.
Energy-based methods
The spatial flow of energy-based ES mainly refers to the processes by which natural ecosystems reduce the natural energy flow to humans (e.g., potential energy from floods). For example, natural forests in upstream of a watershed can mitigate a flood peak, and in turn play a role in flood regulation (Vallecillo et al., 2020). Most existing studies use simple spatial allocation methods to quantify the spatial flow of energy-based ES. For example, the spatial flow of the flood mitigation service was quantified as the product of the percentage of floodwater mitigated and the number of developed cells in a 100-year floodplain by the sub-watershed (Zank et al., 2016). There are many well-developed process-based models to simulate the spatial flow of energy-based ES, such as the hydraulic model for flood regulation service (Javaheri and Babbar-Sebens, 2014) and the advanced three-dimensional circulation model for storm surges (Sebastian et al., 2014). We recommend incorporating more process-based models to quantify energy-based ES.
These matter-based and energy-based methods provide a primary quantification of ESF or use the process-based model to quantify specific ES. However, these models are usually complex and need technical training.
Information-based methods
The spatial flow of information-based ES mainly depends on the flow of humans or other species (e.g., pollinating insects). For human-related information (e.g., beautiful scenery) delivery, we can use models (e.g., the cumulative viewshed model, InVEST recreation model) (Sharp et al., 2014; Vigl et al., 2017), or analyze the flow mode of travelers (Liu et al., 2017), or the road network and crowdsourced data from social media and outdoor activity-sharing platforms (e.g., Flickr, Weibo of China) (Havinga et al., 2020). For example, Schirpke et al. (2018) used the geo-tagged photos from Flickr’s public Application Programming Interface to depict the spatial flow of the outdoor recreation service (Schirpke et al., 2018); Liu et al., (2015) used information about pandas in newspapers and books to describe the flow of information (Liu et al., 2015). For the pollination service flow, studies have usually used the overlap area between the pollination potential and demand to quantify the realized ESF (Vallecillo et al., 2018). Less research has been done on this service’s flow. Cultural service methods have used social media data, which provides a direct measure of individuals’ aesthetic enjoyment. However, the user’s preference for different social media may bias the true results of ESF, and analysis should be careful about the results thereby derived (Havinga et al., 2021). More studies should explore the flow of these ES in the future.
Comprehensive framework for quantifying ESF
On the basis of social-ecological processes and the quantification methods for the spatial flow of ES, we proposed a framework to quantify ESF that integrates the potential ES, the spatial flow of ES and the ES demand of the beneficiary. The theoretical framework of ESF quantification is based on a cascade framework (Potschin-Young et al., 2018; Wang et al., 2022), whereby the potential ES yield from a stock of natural resources and human-related input (e.g., infrastructure, fertilizer) will interact with social-ecological processes to deliver potential ES to the beneficiary, and the delivered ES will interact with the beneficiary’s use and consumption to finally realize the ES. The whole flow process of realized ES is known as ESF, while the areas that provide specific ES to specific beneficiaries is called the service-shed (Figure 3 and Table 1). To quantify the ESF, we proposed the following five steps.
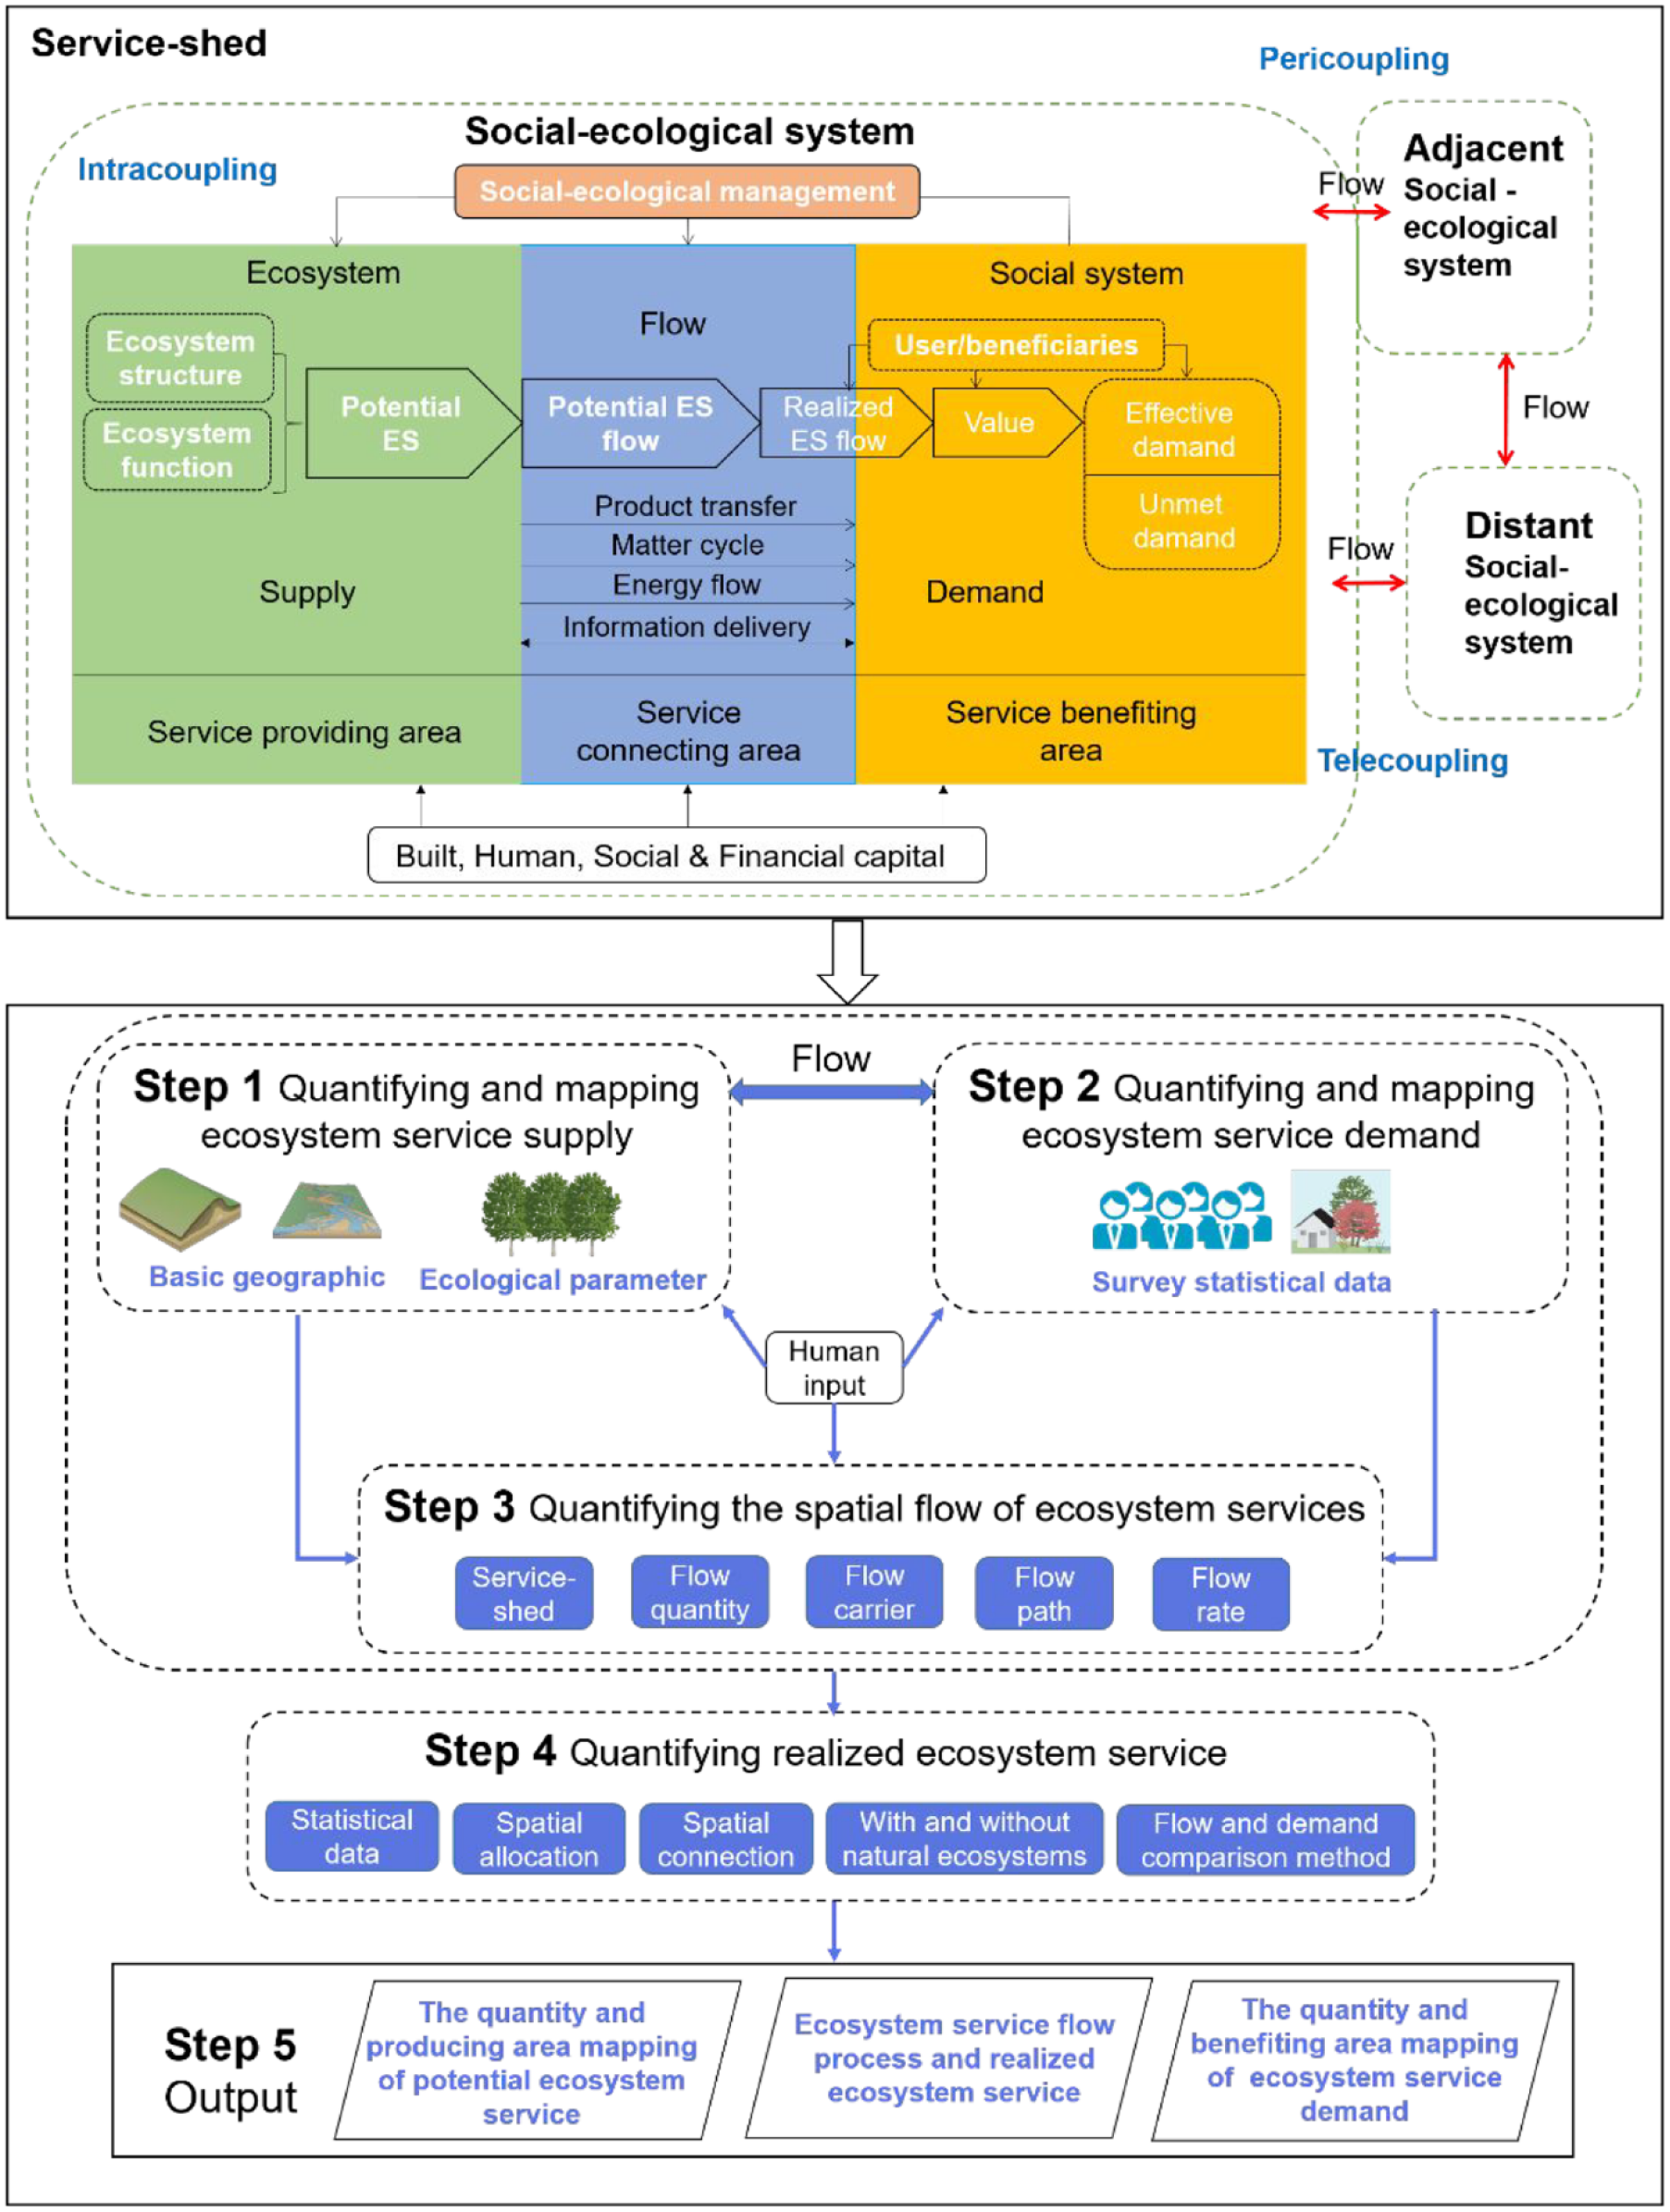
Comprehensive framework for quantifying ESF focusing on social-ecological processes. The top portion is adapted from Wang et al. (2022).
The first step is to quantify and map ES supply under specific topographic, soil, climate and vegetation conditions. The simulation of potential ES has become mature and many ES models (e.g., InVEST, SolvES, and Co$ting Nature) have been developed, which offer a good basis to simulate the flow amount of ESF (Bagstad et al., 2013b; Healy and Secchi, 2016).
The second step is to quantify and map ES demand. There are many different methods (e.g., participatory, empirical and expert-based approaches) to quantify or delineate the distribution of ES demands (e.g., risk reduction, preferences and values, direct use or consumption of goods and services) (Wolff et al., 2015). Questionnaires, statistical data and land use and land cover data can effectively inform the mapping and quantification of ES demand (Wei et al.,2017). In addition, it’s important to note that ES demand is greatly influenced by different values, perceptions, preferences and power relationships among stakeholders.
The third step is to quantify the spatial flow based on the spatial distributions and quantities of ES supply and demand. The key to quantifying ESF is to characterize the spatial flow characteristics (e.g., service-shed, flow path, flow direction and flow rate) (Shen and Wang, 2021), which combines ES supply and demand. We introduced the common methods used for this purpose in the Quantification methods for the spatial flow of ES section.
The assessments of ES supply, spatial flow of ES and ES demand form the basis for quantification of the whole ESF process. There are two possible quantification approaches to complete the above three steps. The first is to use an existing ESF model. For example, the ARIES model is the only ESF model that aims to calculate potential ES, characterize the spatial flow of ES and combine the beneficiaries for several types of ES (Bagstad et al., 2013a). However, the ARIES model is still evolving and its application is limited because it has complex calculation process and interoperability strategy (Wang et al., 2022). The second approach is to combine multiple models and methods for quantifying the potential ES, the spatial flow of ES and ES demand. This approach is based on the principle of the cascade framework (Potschin-Young et al., 2018), which allocates potential ES along the flow path and considers the beneficiary when quantifying ESF (Shen et al., 2021). This method has been used for some specific ES. For example, the freshwater service flow has been quantified by coupling hydrological models (e.g., Variable Infiltration Capacity Macroscale Hydrologic Model, Hydrological Simulation Program Fortran, or freshwater yield algorithm—a sub-module of the InVEST model) for potential ES, a spatial flow algorithm (e.g., D8 [i.e., 1, 2, 4, 8, 16, 32, 64 and 128] or stream network) for spatial flow, and a statistical method for demand (Li et al., 2017; Lin et al., 2021; Zhang et al., 2021). The sand fixation service flow has been quantified by integrating the Revised Wind Erosion Equation for potential ES, the HSPLIT model for spatial flow and a statistical/spatial distribution of people method for demand (Su et al., 2020; Xu and Zang, 2022; Xu et al., 2019). The aesthetic experiences flow has been assessed by coupling the ES matrix for capacity, cumulative viewshed models for the flow process, and the amount of viewer days for demand (Vigl et al., 2017).
The fourth step is to quantify the realized ES by beneficiaries. The realized ES is usually calculated as a proportion of the potential ES. Different methods have been used for different ES. For quantifiable services (e.g., most provisioning services), firstly, statistical data provide a good way to assess realized ES directly inside a social-ecological system (Schröter et al., 2014); for other services without statistical data, spatial allocation method that allocate potential ES by human-related information (e.g., population density) is another way to quantify realized ES (Huang et al., 2021; Rioux et al., 2019). For ESF among different systems, the flow and demand comparison method, which compares the volume of flow and the amount of demand that could be used (if potential ES flow is larger than ES demand, then ES demand is equal to realized ES; or potential ES flow is equal to realized ES). The premise of this method is that all the ES flow that reaches people can be used. For preventive services (e.g., flood regulation), there are two methods. First, the spatial connection method uses the spatial coverage to quantify realized ESF, such as the forest areas that could protect infrastructure in avalanche prevention (Schirpke et al., 2019a). Second, the “with and without natural ecosystem” scenarios method uses the amount of change in the final service with and without natural ecosystems to quantify realized service (Ouyang et al., 2020).
The fifth step is the output of the comprehensive quantification of ESF. The quantity and producing area map of potential ES, the ES flow process and the realized ES, as well as the quantity and benefiting area map of ES demand should be the output of ESF quantification. Based on these results, we are able to answer the basic question, where are ES generated, how are they flowing or delivering, and where and how much is realized? (Bagstad et al., 2014). These outputs are the basis for further ES management.
Perspectives
Owing to a deeper understanding of ES, more studies have recognized that social-ecological processes play an important role in the formation of ESF (Metzger et al., 2021; Palomo et al., 2016). In addition, quantifying ESF is the basis for accounting for nature’s contribution to people, understanding the relationship between ES supply and demand, and supporting regional planning and policy (Wang et al., 2022). Therefore, considering social-ecological processes while quantifying ESF is the basis for better policy application. This study first focused on the relationship between social-ecological processes and the spatial flow of ES, as well as the methods for quantifying the spatial flow of ES. Then, we proposed a comprehensive framework to facilitate the quantification of ESF based on social-ecological processes. To better quantify the whole process of ESF, three aspects should be improved in the future: (1) analyzing influencing factors of EFS; (2) developing or incorporating process-based models by involving the beneficiary and infrastructure; and (3) using social-ecological approaches for ESF governance.
Analyzing influencing factors of EFS
Clarifying the natural and human-made influencing factors (e.g., landscape pattern, built infrastructure or social demand) that affect ESF is fundamental to quantifying the whole process (Echeverri et al., 2022; Metzger et al., 2021). For example, built infrastructure such as reservoirs change the time of water distribution, which affects the realization of benefits from the water supply, flood regulation and other services (Brunner, 2021; Wu and Chen, 2013); different beneficiaries (e.g., farmers, residents) at different scales (i.e., local, subnational, national, and international, and their related sectors), their perceptions and values, and social power relationships will place different levels of importance on different kinds of ES (Felipe-Lucia et al., 2015; Vallet et al., 2019). In turn, these will influence the flow direction, flow amount and the realized amount of ESF. In addition, since ES are co-produced by ecosystems and people, it is important to distinguish the contributions of natural and human inputs in final ES (Bengtsson, 2015; Lin et al., 2021), which is the basis of accounting for nature’s contribution to people (Wang et al., 2022). Therefore, understanding how natural and human-made factors influence the spatial flow of ES is the first step to quantifying the whole process of ESF.
Developing or incorporating process-based models by involving the beneficiary and infrastructure
Among the existing modeling approaches, solutions exist to serve as a basis for quantifying ESF by considering social-ecological processes. Many models have been developed to simulate the transfer process of specific ES. For example, the ARIES model provides a good starting point to simulate the process of ESF (Bagstad et al., 2013a); Xu and Pan (2022) summarized more than a dozen methods that can quantify the soil conservation service flow (Xu and Pan, 2022). Moreover, based on the influencing factors of ESF, developing the ARIES model or incorporating existing process-based models by involving the beneficiary and infrastructure for specific ES is the next important step to quantifying ESF.
Social-ecological approaches for ESF governance
The realization of ESF cannot be achieved without the participation of stakeholders/beneficiaries, or the social system more generally. Therefore, the governance of ESF should be through social-ecological approaches. These include social networks analysis, participatory ES mapping and participatory scenario planning, all of which could improve management of social-ecological systems (Palomo et al., 2014). For example, Wang et al. (2019b) found that the loose connection between the management agencies in a watershed’s upstream and downstream areas caused the degradation of water ecosystems, which could be mitigated by close connections among key social groups using social-ecological network analysis (Wang et al., 2019b). Ding et al. (2022) found that ecological restoration practicality could be improved by embedding social considerations. In the future, greater knowledge of the relationships between social and ecological systems and of social-ecological approaches can improve ESF governance and guide inclusive and sustainable development (Vallet et al., 2020).
Quantifying the whole process of ESF is the key but remains a challenge in the study and management of ES because it involves both social and ecological processes. This study proposed a comprehensive framework for quantifying the whole process of ESF with a special focus on the relationship between the social-ecological process and the spatial flow of ES and the quantification methods for the spatial flow of ES. In the future, more empirical studies are needed to validate and build upon this framework.
Conclusion
The formation and realization of ESF is an interaction between social and ecological processes. Understanding the relationship between social-ecological processes and the spatial flow of ES is the premise and basis of ESF quantification. This study identified the relationship between four types of social-ecological processes (product transfer, matter cycle, energy flow and information delivery) and the spatial flow of ES, and then reviewed methods to quantify the spatial flow of ES. Finally, we proposed a comprehensive framework for the whole process of ESF quantification focusing on social-ecological processes. We recommend that three aspects need to be improved for better ESF quantification: analyze influencing factors of ESF, develop or incorporate existing process-based models by involving beneficiaries and infrastructure, and propose social-ecological approaches to manage ESF. This study provides an overall ESF quantification framework that focuses on the social-ecological processes of ESF and in turn facilitates consistent ESF quantification. This framework will support sustainable ES management.
Footnotes
Acknowledgements
Declaration of conflicting interests
The author(s) declared no potential conflicts of interest with respect to the research, authorship, and/or publication of this article.
Funding
The author(s) disclosed receipt of the following financial support for the research, authorship, and/or publication of this article: This study was supported by the National Natural Science Foundation of China, China (grant no. 41925005 and 42201304) and Special Research Assistant Grant Program of the Chinese Academy of Sciences, China.