
Abstract
To tame housing price escalation and improve housing affordability, China’s central and local governments have implemented a series of housing market regulation policies since 2009. A widely adopted policy measure is the housing purchase restriction (HPR), which aims to curb speculative demand. Using a panel dataset of 35 major cities between 2009 and 2019, this study investigates the effects of HPR on housing transactions and price volatilities. It finds that the HPR, which was a short-term action, effectively reduced housing transaction volumes and prices; however it amplified housing price volatilities in cities where the price elasticity of demand is relatively high and the price elasticity of supply is relatively low. The empirical finding can be explained as a response of housing buyers and investors to the policy based on their rational expectation for the future HPR. Such a response contributes to the undesirable outcome of HPR. Although the HPR initially achieved its goal of curbing speculation, its unintended effect on price volatilities should not be overlooked.
Keywords
Introduction
Since the housing marketization reform in 1998, urban housing markets in China have grown rapidly, resulting in significant improvement in the living conditions of most urban residents. The average housing floor area per person has increased from 14 m2 in 1998 to 38.6 m2 in 2020. However, these markets have also experienced substantial price increases. The average purchase price of new commodity housing in nominal term has risen from CNY1,854/m2 in 1998 to CNY10,323/m2 in 2021, at a growth rate of 8 percent per year. The rapid price increases attracted investment and results in the accumulation of housing assets by the affluent households, but also made housing increasingly unaffordable for others. To stabilize housing prices, the central and local governments have implemented a range of policy interventions designed to curb speculative demand and slow housing price growth.
One policy intervention widely adopted by the local governments of major cities is the housing purchase restriction (HPR). Local governments established customized eligibility requirements for housing purchase based on their specific regulatory objectives. The HPR aims to curb speculative demand by restricting households’ eligibility to purchase housing properties, contingent upon their local residential registration (hukou) status, housing properties owned, and the purchase of social security package. The HPR was a policy tool for short-term use. It was implemented, then terminated, and later reimplemented between 2010 and 2018 in most major cities in China.
This paper investigates the effects of HPR on housing transactions and price volatilities. The objective of the HPR is to restrain speculative demand and stabilize housing prices. Housing transaction volumes and prices are expected to decline during the HPR implementation, but they will rebound once the policy is lifted. However, as the rational expectation theory advanced by Lucas (1972) tells, expectations by households for the future HPR implementation may cause compensating behavior and undermine the effectiveness of the policy. With the expectation that the HPR may be reimplemented in the future, households may decide to purchase housing units ahead of time just right after the policy is lifted, and housing investors may also invest more based on their expectation that housing prices would increase given higher than usual demand. Therefore, the HPR itself and the market response together may lead to greater price increase and higher price volatility. To investigate the effectiveness of HPR in regulating the housing markets, we propose two hypotheses. The first pertains to the policy effectiveness in the short-term, when the implementation of HPR effectively curtails housing demand, leading to a decrease in transaction volumes and prices. The second hypothesis is about the longer-term impact of HPR, in which the housing prices may become more volatile.
The paper proceeds as follows. In Section 2, we provide a brief overview of the HPR policy implementation. Section 3 provides a literature review and indicates where our study stands in the current understanding of HPR effectiveness. In Section 4 and Section 5, we test the two hypotheses and discuss the results. Section 6 concludes.
An overview of the HPR policy in China
In the early years after the 1998 housing marketization reform, the central government regulated the markets through policy measures that were applied across the country, such as adjusting mortgage rates, setting differential tax rates, control on land supply, and restrictions on housing sales or purchases. These national policy measures became increasingly less effective as the local housing markets became more diversified. Some markets remained tight, with demand significantly greater than supply, while others experienced over-supply. In response, in 2016, the central government decided to decentralize the power of market control to the local governments. One prevalent measure adopted by the local governments is the HPR policy.
The implementation of HPRs during 2010–2011
The 2008 Global Financial Crisis prompted China’s central government to launch a CNY4 trillion fiscal stimulus package, with an aim to promote investment in the real economy. However, an unanticipated consequence was that much of the stimulus funds were invested in the real estate sector (Deng et al., 2011). The national average price of new commodity housing increased by 24.7 percent in 2009. On April 17, 2010, the State Council issued the “Ten National Notices,” which proposed restrictions on housing purchases in the overheated housing markets for the first time in history (Chen et al., 2018). The policy was to curb speculative housing demand and provide more affordable housing for the first-time buyers (Li et al., 2017). After the announcement of the “Ten National Notices,” Beijing became the first city to implement the HPR on April 30, 2010.
Generally, the HPR limits the purchase of each local household (i.e. household with at least one member having a local hukou) to only a certain number of housing units (mostly one or two units) within the municipal administration boundary. Non-local households are eligible to purchase housing units only after they have continuously paid for the social insurance package or personal income tax in the city for a certain number of years. Between 2010 and 2011, 47 cities implemented the HPR (Chen et al., 2018). The specific details of these HPRs varied slightly, depending on the housing market performance and the specific objectives of regulations in each city.
The lift of HPRs during 2014–2015
The restrictions on home purchases contributed to the rises in housing inventories in some cities (Yu et al., 2023). From late 2014 to 2015, there was a round of loosening regulations. By mid-2015, most cities had removed their HPRs, with the exception of Beijing, Shanghai, Guangzhou, Shenzhen, and Sanya. Besides the need to reduce housing inventories, another factor that contributed to the lift of HPRs was the decline in land prices and revenues resulting from falling housing prices. Since local governments heavily relied on land revenues to finance urban development and service local government debts, the decline in land revenues undermines the fiscal sustainability of local governments (Li et al., 2017). The removal of HPRs also effectively increased the possibility of the migrants buying housing locally (Tan et al., 2022).
The implementation of HPRs during 2016–2017
The housing transactions and prices in various cities rebounded in 2015 and 2016, triggering a new round of housing market tightening regulations. Between 2016 and 2017, 44 cities reintroduced HPRs (Yu et al., 2023). The second round of HPR implementation in major cities stimulated housing purchases for investment in the unregulated third- and fourth-tier cities, leading to higher housing prices in those regions (Zhang et al., 2021).
Government interventions could bring about drawbacks when amending market failures. For instance, the repeated implementation and removal of HPRs may influence market players’ expectations and adjusting behavior, leading to undesirable market outcomes. Individuals may be inclined to purchase a home when the restriction is lifted, even if they do not have an immediate need for housing. This behavior stems from the expectation that the HPR may be reimplemented in the future. For example, in anticipating future HPR and high prices afterward, parents may decide to help their only child buy a housing unit now and long before the young generation reaches the age of marriage. Such a behavior based on rational expectation may result in price fluctuations over time. Volatility in housing prices may attract more housing purchases for investment and speculation, thereby increasing housing prices, undermining housing affordability, and further enhancing price volatility.
Previous studies on HPR
The effectiveness of HPR attracts intense academic attention. Divergent findings are found regarding the impacts of HPR on housing markets in China. In this section, we first summarize research on both the effectiveness and failure of the HPR policy to achieve desired policy outcomes. Subsequently, we discuss studies on the side effects of the HPR policy. As the side effect of the increased in price volatility is the primary focus of this paper, we then review studies on housing price volatilities, leading to the need to examine whether the HPRs lead to increased housing price volatility in China, which is the main contribution of this study.
Some studies have found that the HPR has a negative effect on housing prices, price growth, and transactions. Based on data from 70 cities between 2014 and 2015, Li et al. (2017) demonstrated that the HPR effectively curtailed the price growth of large-size homes, and removing such restrictions could lead to a significant increase in previously contained housing prices. Lu et al. (2021) discovered that the overall housing demand became weaker and sellers were willing to lower the prices to sell more quickly after implementation of the HPR in five major cities between 2009 and 2015. Sun et al. (2017) observed nearly a quarter decline in housing prices in Beijing following the implementation of the HPR in 2010.
Some other studies, however, find that the HPRs did not yield expected policy outcomes. Jia et al. (2018) found that the home purchase limits had a positive impact on housing prices in Guangzhou between 2008 and 2011. Li (2016)’s analysis of 35 major cities between 2006 and 2014 revealed that although the HPR was effective in containing property bubbles for about two years, many cities began exhibiting signs of property bubbles again since 2012. Zou et al. (2022) suggested that the top-down administrative pressure and horizontal competition among local governments were the two key factors influencing the adoption of the HPR.
The HPR may also induce certain side effects. Alm et al. (2022) demonstrated that restrictions on quota based on household status were likely to induce strategic divorces in order to become eligible for purchasing more housing properties. Additionally, studies found that the HPR may result in welfare loss for homebuyers (Lu et al., 2021; Tan et al., 2022). Tan et al. (2022) also showed that the HPR sustained economic growth through increased savings by migrants. Yu et al. (2023) revealed that the HPR led to an increase in urban investment bonds in non-restricted nearby cities, thereby posing greater financial risks to those cities. Furthermore, in the presence of the HPR, young graduates without a local hukou may be compelled to move out of restricted cities, potentially constraining the labor supply and impeding long-run economic growth (Sun et al., 2017).
Housing price volatilities have been studied across various countries. In Canada, factors such as GDP growth rate and inflation rate have been identified as significant determinants of housing price volatility (Hossain and Latif, 2009). In the United States, the volatility of home value appreciation is attributed to the home appreciation rate and growth rate of per capita gross metropolitan product (Miller and Peng, 2006). As for the policy evaluation, housing subsidy to first-home buyers was found to effectively reduce housing price volatilities in Sydney, Australia (Lee and Reed, 2014). Housing price volatilities in China have been estimated from various aspects. Hui and Wang (2014) propose a method for decomposing actual house prices into two parts – the theoretical prices and the price anomalies, and find that Beijing’s housing prices are more volatile than Shanghai’s. Spatially, Weng and Gong (2017) find significant housing price volatility spillover effects across 10 regional housing markets in China. Zhang et al. (2016) show that theoretically, heterogeneous expectation and beliefs evolution affect housing price volatilities. However, there is a lack of comprehensive research on the impact of the HPR on housing price volatility, except for a theoretical study conducted by Chen et al. (2018), by which they show that home purchase limits initially restrain housing prices but lead to higher rents and housing price growth in subsequent periods.
Compared to the above studies, our study contributes to the understanding of the HPR policy in several aspects. Firstly, unlike most previous studies that either focus on a single round of HPR implementations (Li et al., 2017), or on a narrow scope of a few cities (Jia et al., 2018; Lu et al., 2021; Sun et al., 2017), we examine the HPRs over a longer time span by considering two rounds of HPR implementations and a round of HPR removals on a broader scope of 35 major Chinese cities. Secondly, we identify indicators of price volatility in both scenarios with and without the HPR, facilitating a comparative analysis of market performance. Thirdly, in terms of methodology, we depart from previous studies that employ difference-in-difference method (Lu et al., 2021), regression discontinuity design (Sun et al., 2017), and time series estimation models (Hossain and Latif, 2009; Lee and Reed, 2014; Miller and Peng, 2006; Tsai et al., 2010), and instead we construct a simultaneous equations model (SEM) analysis of the housing market to integrate both housing demand and supply into a unified framework. Our objective is to offer a more comprehensive understanding of the impacts of HPRs on the housing markets.
Effectiveness of the HPRs
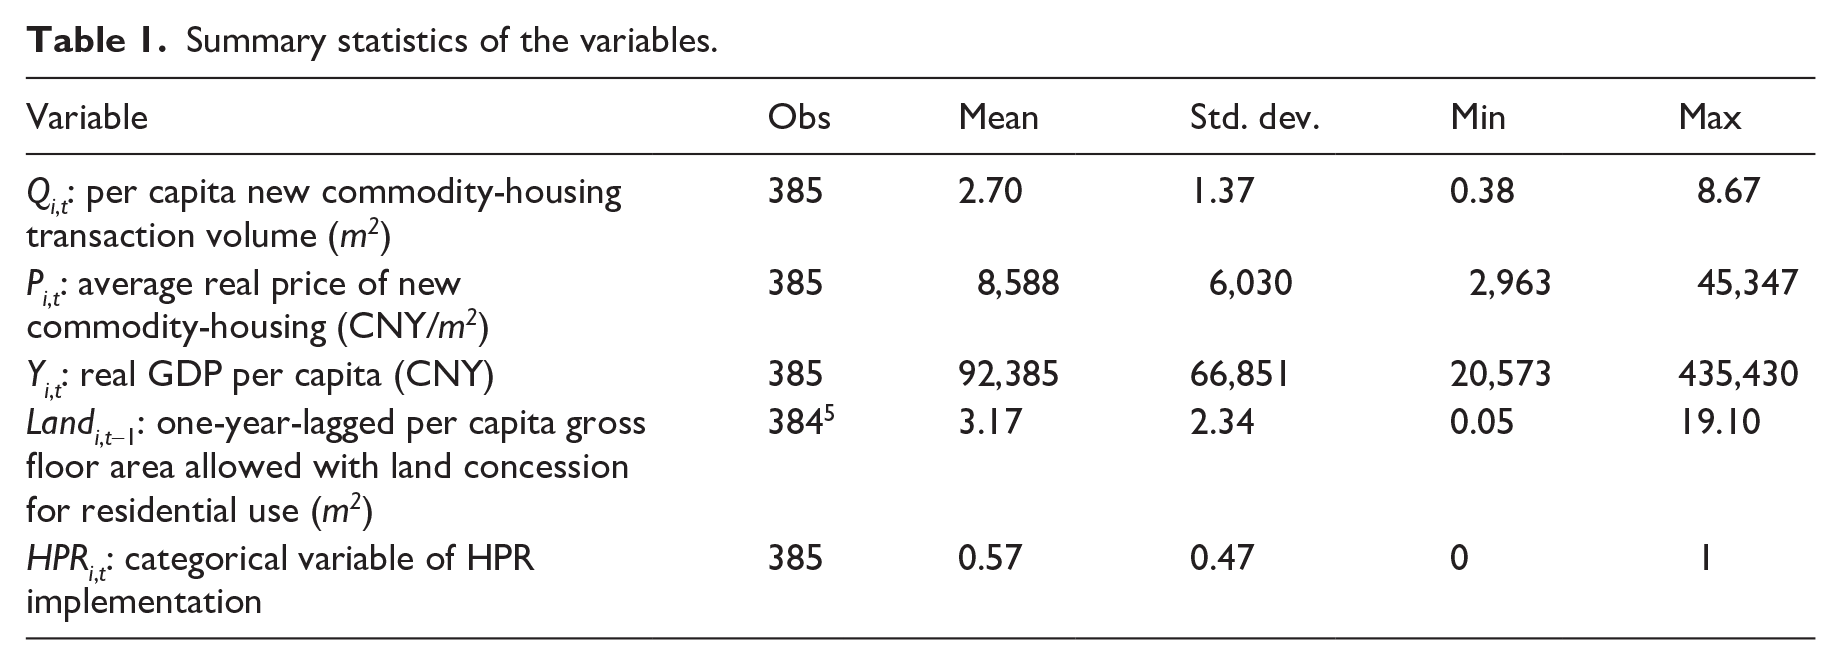
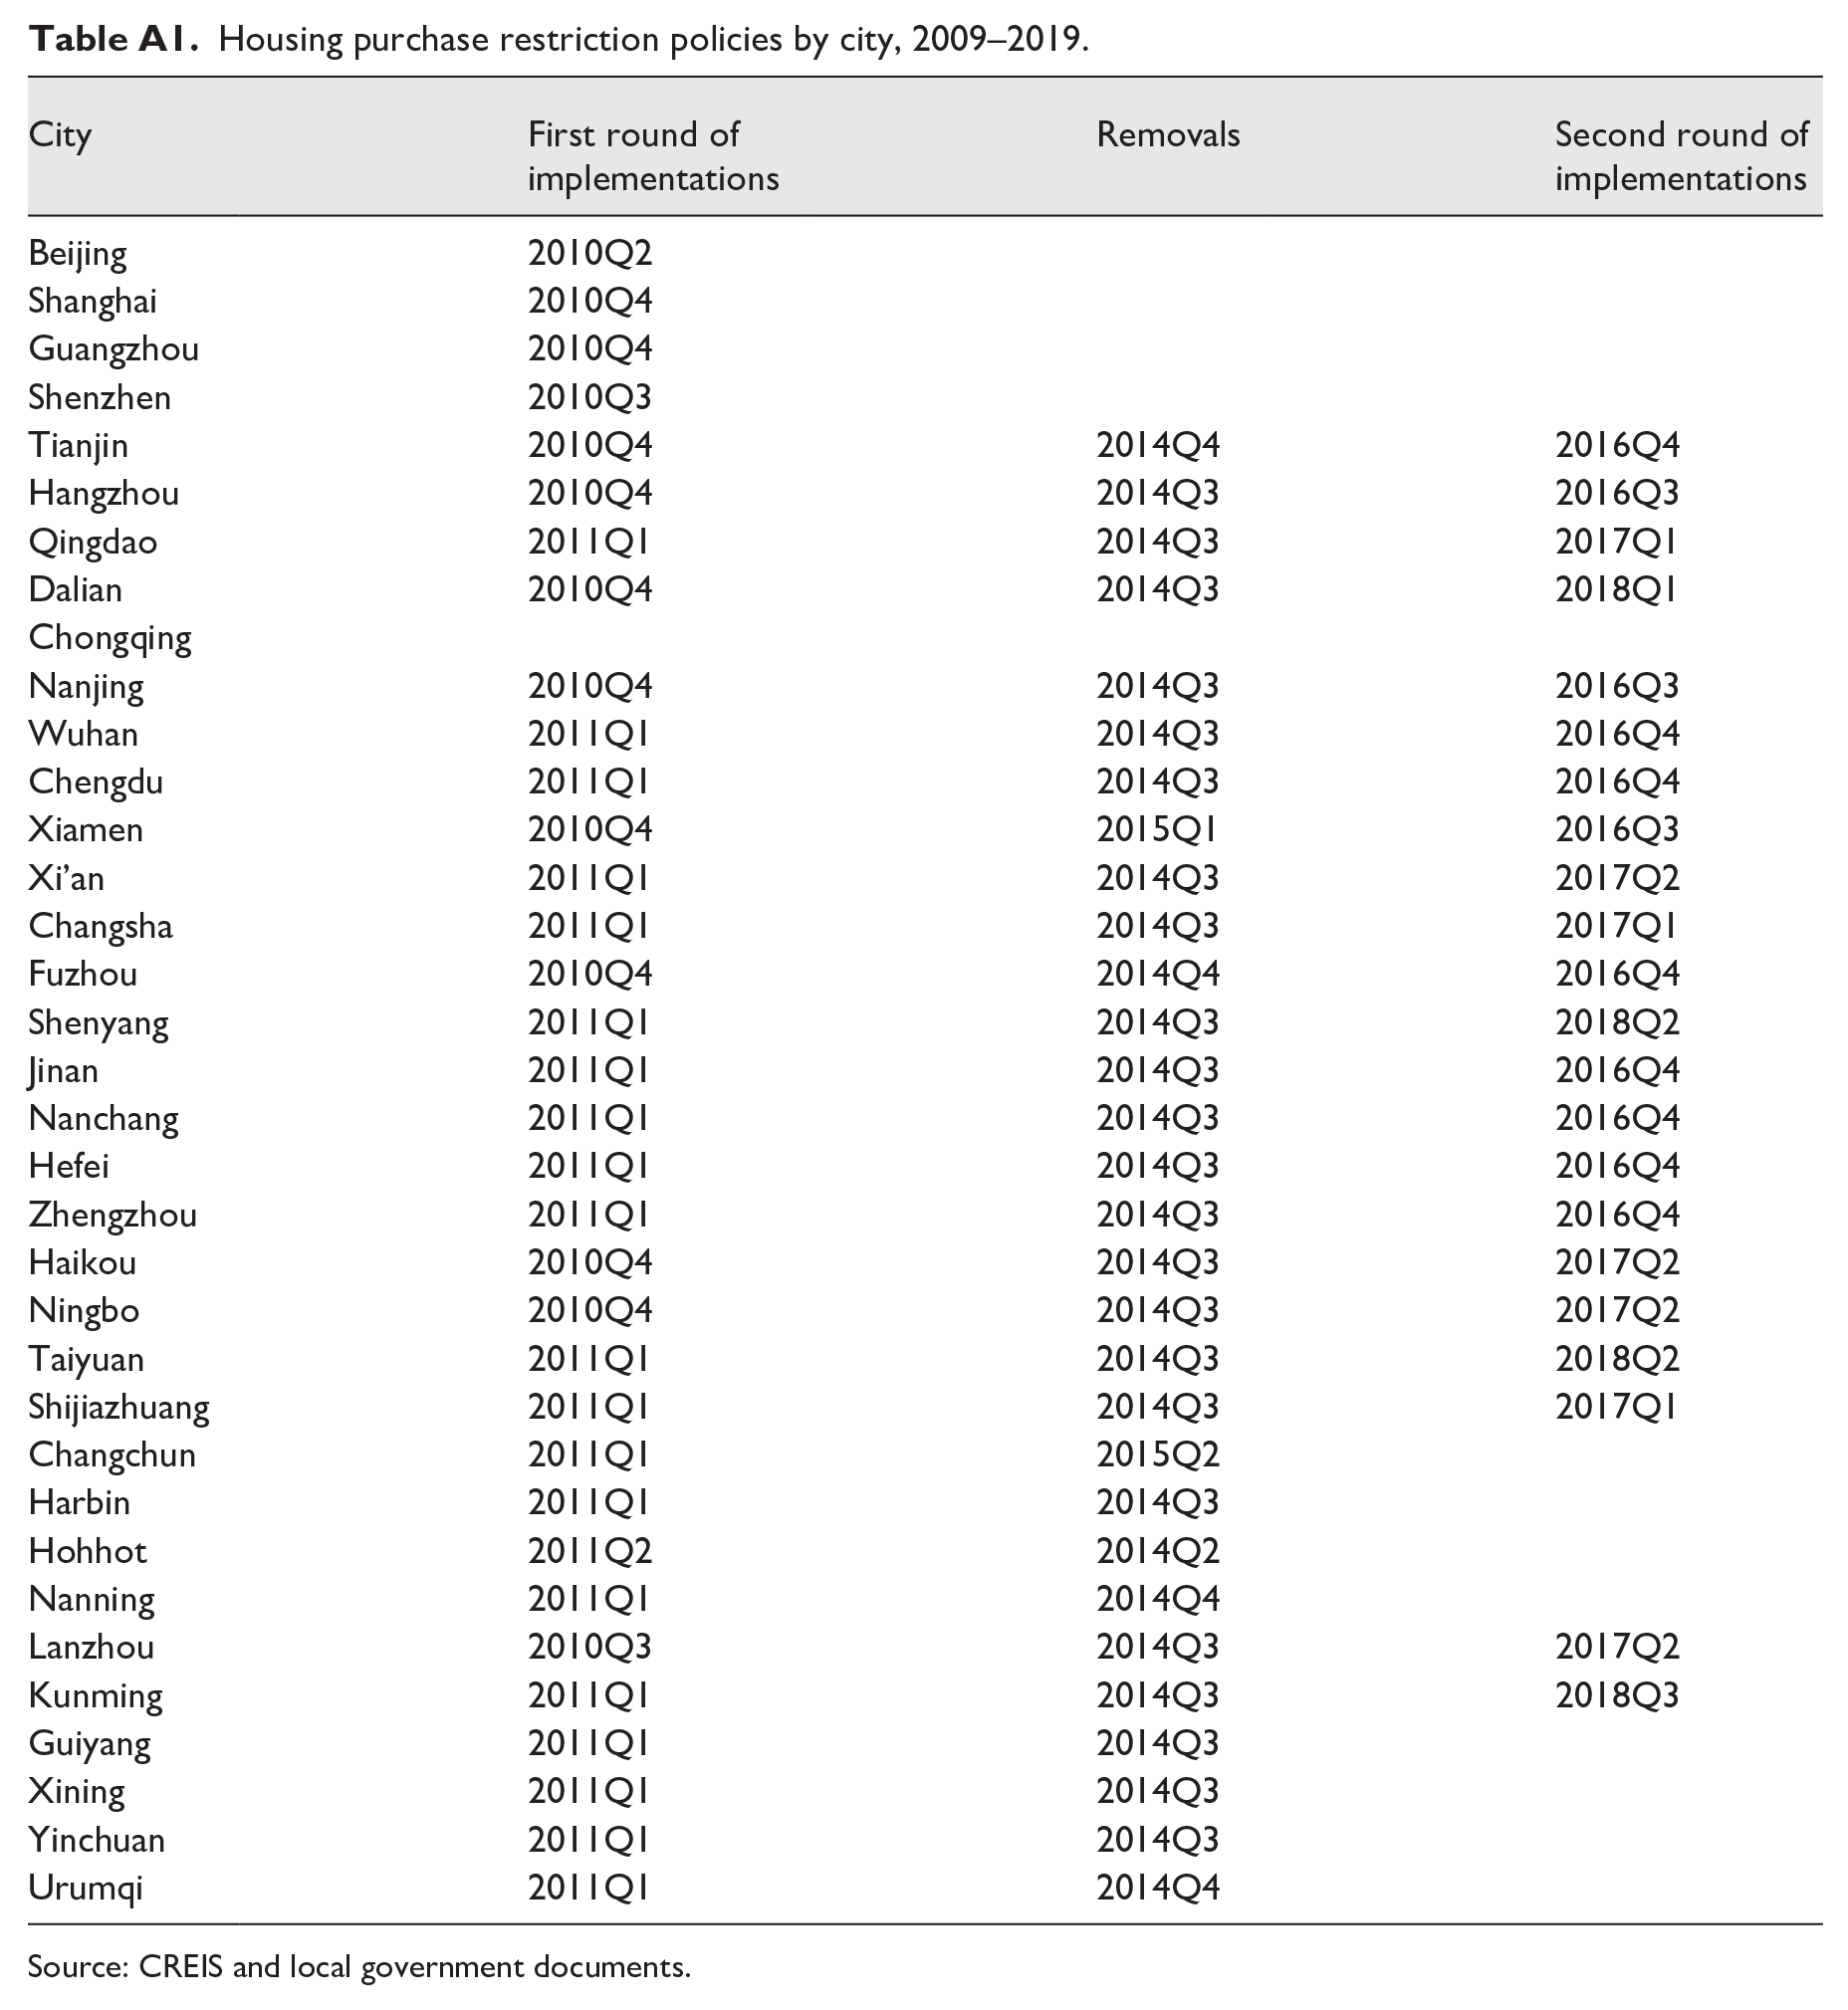
The HPRs were implemented to curb speculative demand and slow price increases in the housing markets in China. Figure 1 shows the annual growth rates of the transaction volumes and average prices of new commodity housing in 35 major cities in China, as well as the three rounds of HPR changes between 2010 and 2019. The timing of each implementation and removal in the 35 cities is shown in Appendix Table A1. Figure 1a shows that the volume of new commodity housing transaction declined after both rounds of the HPRs were implemented (−2.0% in 2011 and −5.1% in 2017) and increased after the removal of the HPRs (7.7% in 2015). We observe a similar relationship between the HPR changes and the new commodity housing transaction prices in Figure 1b. 1 However, other factors in the housing market changed during the same period of the HPR policy change, and may have contributed to the ups and downs in the market. Has the HPR significantly affected the housing transactions in China, and to what extent has the HPR had an impact? To answer these questions, we attempt to estimate the effects of the HPRs on housing transaction volumes and prices by testing the following hypothesis:
Hypothesis I: HPRs effectively reduce housing transaction volumes and prices.
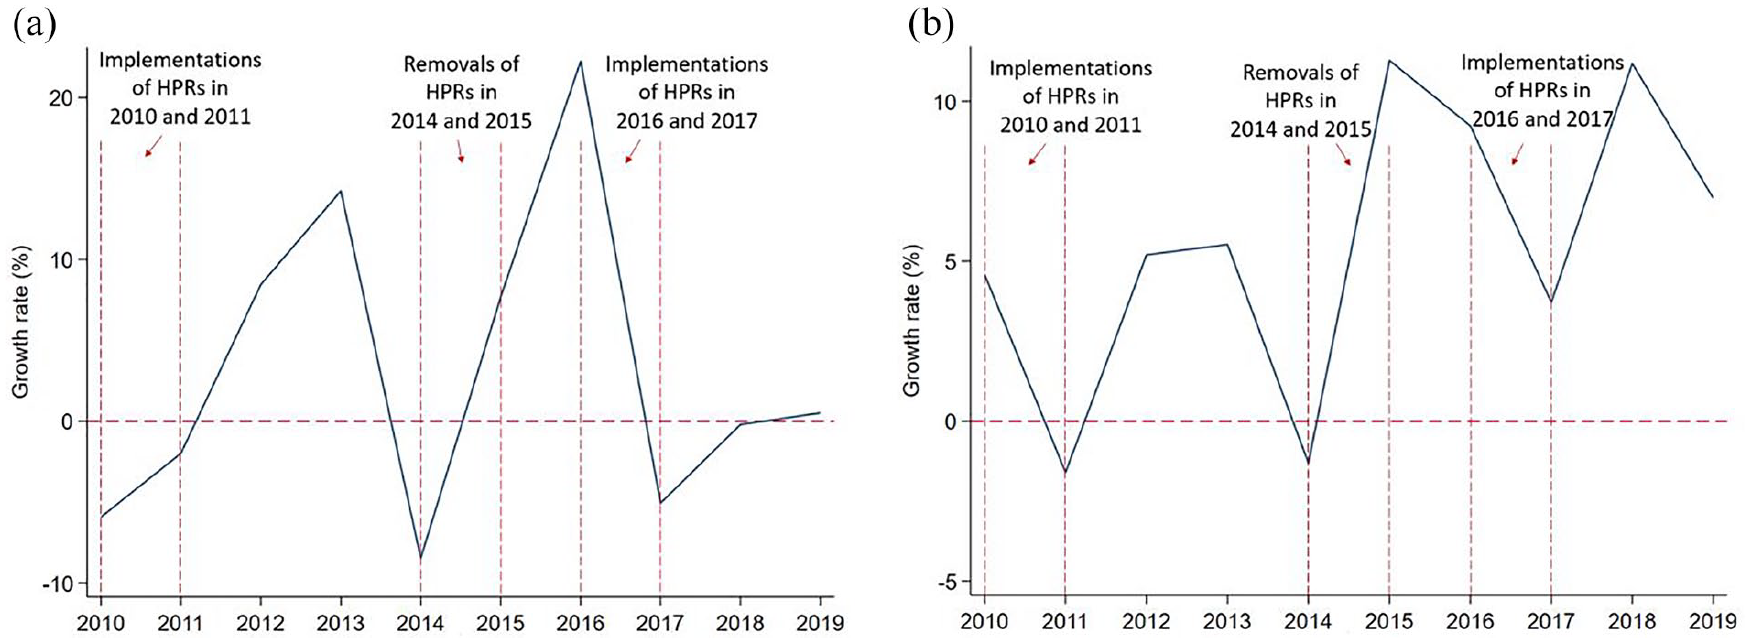
Housing market growth in 35 major Chinese cities and the HPR policy changes between 2010 and 2019. (a) New commodity housing transaction volumes. (b) Average new commodity housing transaction prices.
Model
Housing transaction volumes and prices are influenced by the interaction of housing demand and supply. In this study, we use a simultaneous equations model (SEM) of housing demand and supply, where the equilibrium housing price and quantity are simultaneously determined. We employ the three-stage-least-squares (3SLS) method to account for the endogeneity in the equilibrium price and quantity. The SEM includes per capita GDP as the demand shifter and per capita gross floor area allowed with land concession for residential use as the supply shifter. We incorporate the HPR in the model as a demand shock to the housing market. We do not bother to account for the interaction of the HPR and other market fundamentals in the estimation model because we believe that HPR’s most direct effect on the housing market is to limit the potential demand for housing. Its effect on other market fundamentals is indirect, through the demand-supply dynamics of the housing market. The demand and supply equations are defined in the log-log specification, with the exception of the categorical policy variable for HPR, which is defined in the data section below. We control for the city fixed effects in both demand and supply equations to account for city-specific heterogeneity. 2
We employ Model I depicted by equations (1) and (2) to estimate the effect of HPR on housing transaction volumes, and Model II depicted by equations (3) and (4) to estimate the effect of HPR on housing prices. Both models are estimated using 3SLS.
Model I


Model II


The variables used in the model estimation are listed below.
-
-
-
-
-
-
-
-
Data
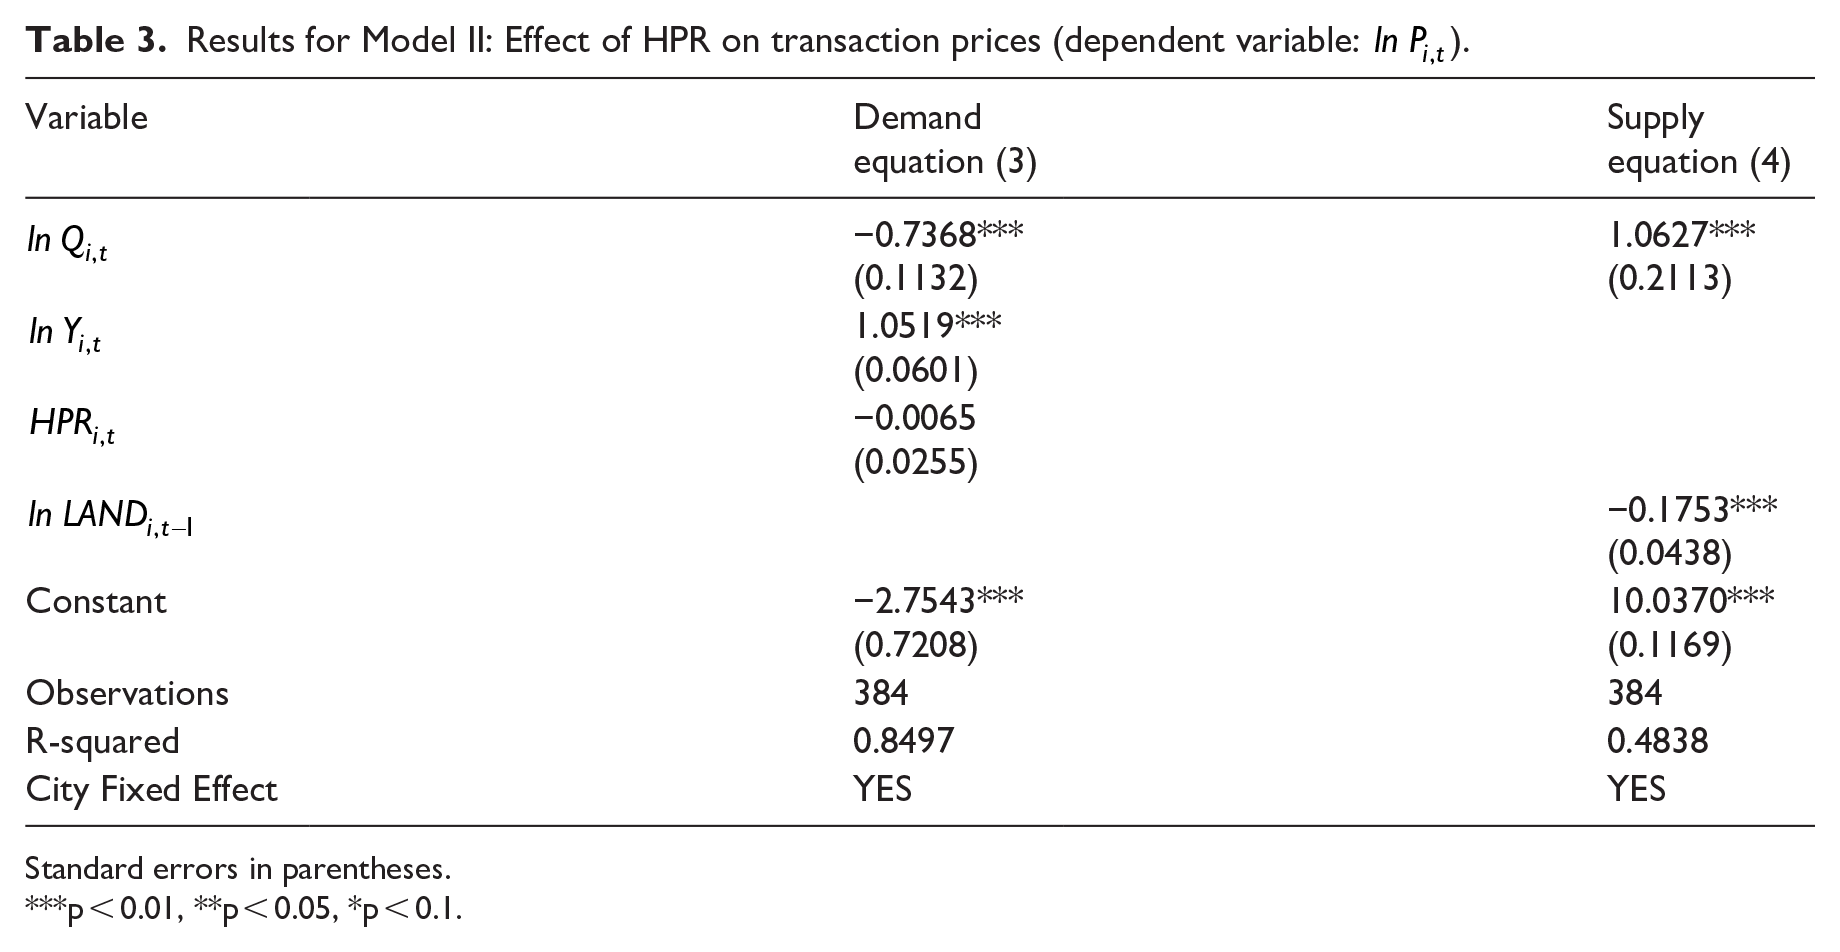
We use a panel dataset of 35 major cities between 2009 and 2019. The sample starts in 2009 to mitigate the potential impact of shocks from the Global Financial Crisis in 2008. We exclude years beyond 2019 to avoid any abnormality arising from the COVID-19 pandemic. The selected 35 cities include all four centrally administered municipalities (Beijing, Shanghai, Tianjin, and Chongqing), along with 27 provincial capital cities and four municipalities with a provincial level fiscal status (Shenzhen, Dalian, Qingdao, and Ningbo). These 35 cities account for approximately a quarter of China’s total urban population and about 45 percent of China’s total revenues from new commodity-housing sales in 2019. This sample is selected due to data availability, continuity, and coverage of China’s major housing markets.
Data on housing transaction volumes, prices, GDP, and total population are collected from the China Statistical Yearbooks. For the variable of land supply, we use gross floor area allowed with land concession for residential use, which reflects both the area of land concession and floor area ratio. Data for this variable are from the China Real Estate Index System (CREIS). Housing prices and per capita GDP are in 2010 Chinese Yuan. 4 The changes in HPR policies by city is obtained from CREIS and local government documents, and are summarized in Appendix Table A1. The summary statistics of the variables are presented in Table 1.
Summary statistics of the variables.
Empirical findings and discussion
The estimation results derived from Model I and Model II are presented in Tables 2 and 3.
Results for Model I: Effect of HPR on transaction volumes (dependent variable:

Standard errors in parentheses.
p < 0.01, **p < 0.05, *p < 0.1.
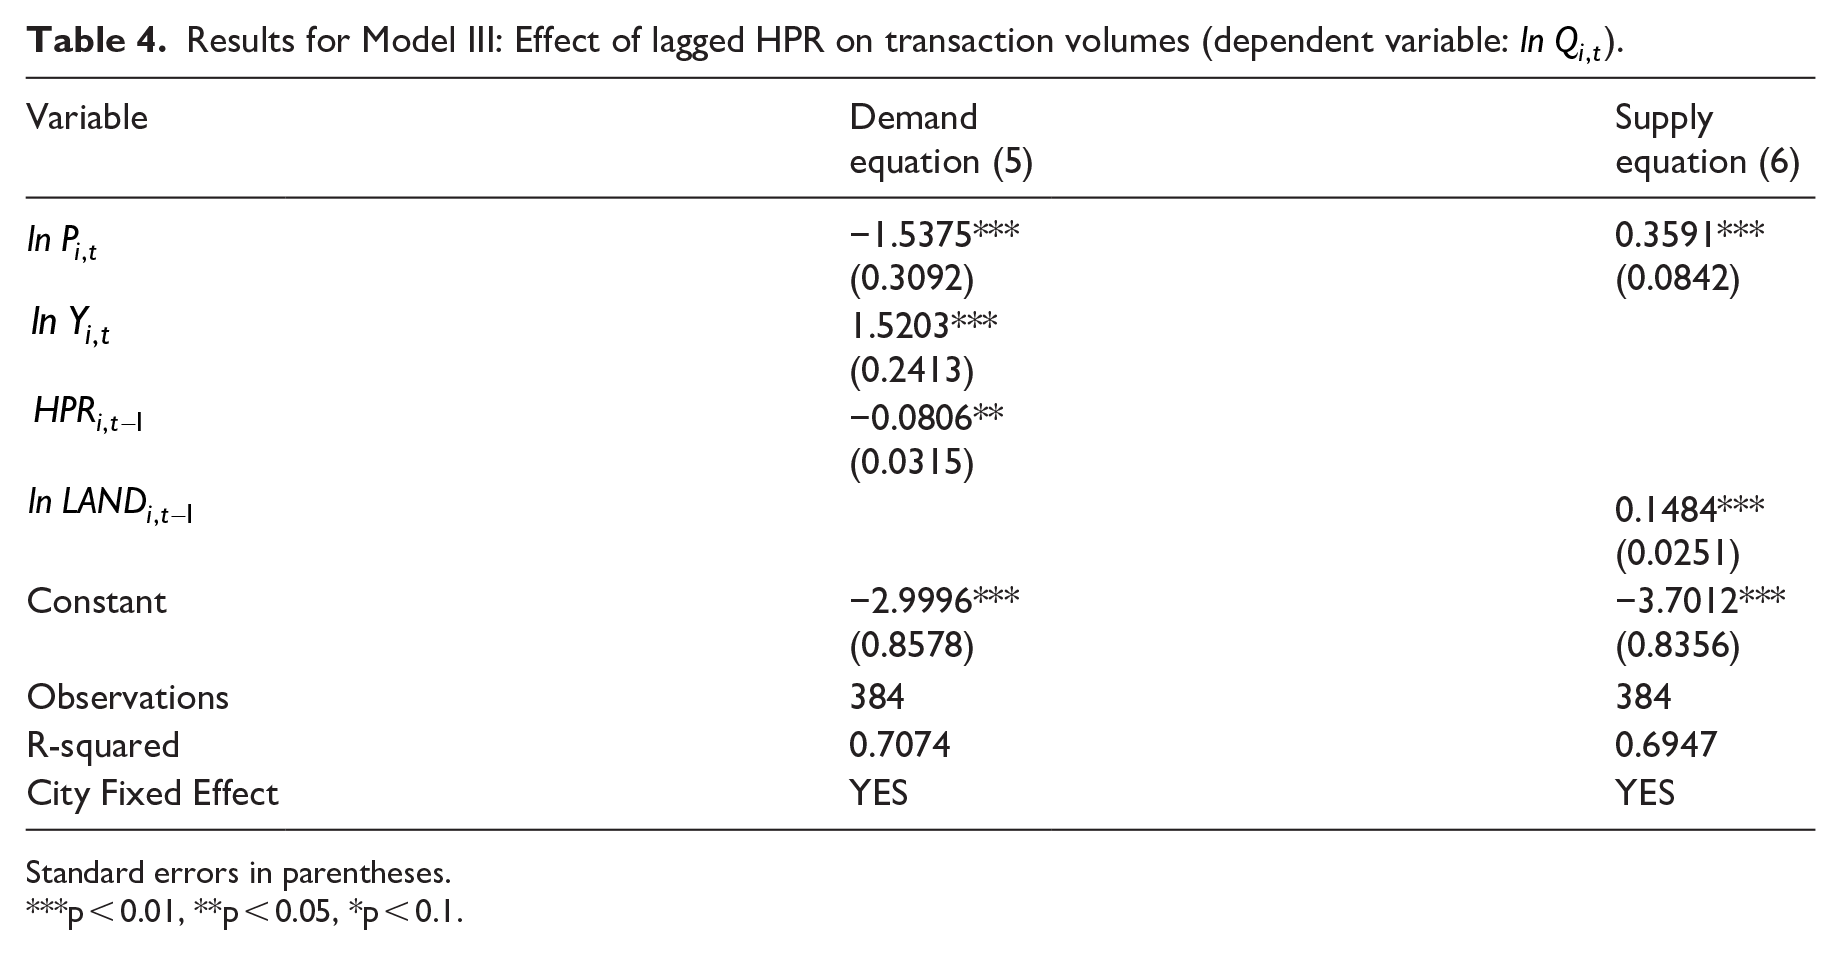
Results for Model II: Effect of HPR on transaction prices (dependent variable:
Standard errors in parentheses.
p < 0.01, **p < 0.05, *p < 0.1.
The results in Tables 2 and 3 indicate that neither housing transaction volumes nor prices are significantly affected by the HPR policy. It is worth noting that the HPR can be implemented or lifted at any point in time during the year, based on the regulatory needs of the local governments. Consequently, the policy effect on the yearly average housing transaction volumes and prices may not be evident within the current year due to a mix of restricted and unrestricted periods, but become apparent in the subsequent year. To account for this possibility, we revise Model I and Model II by replacing
Model III


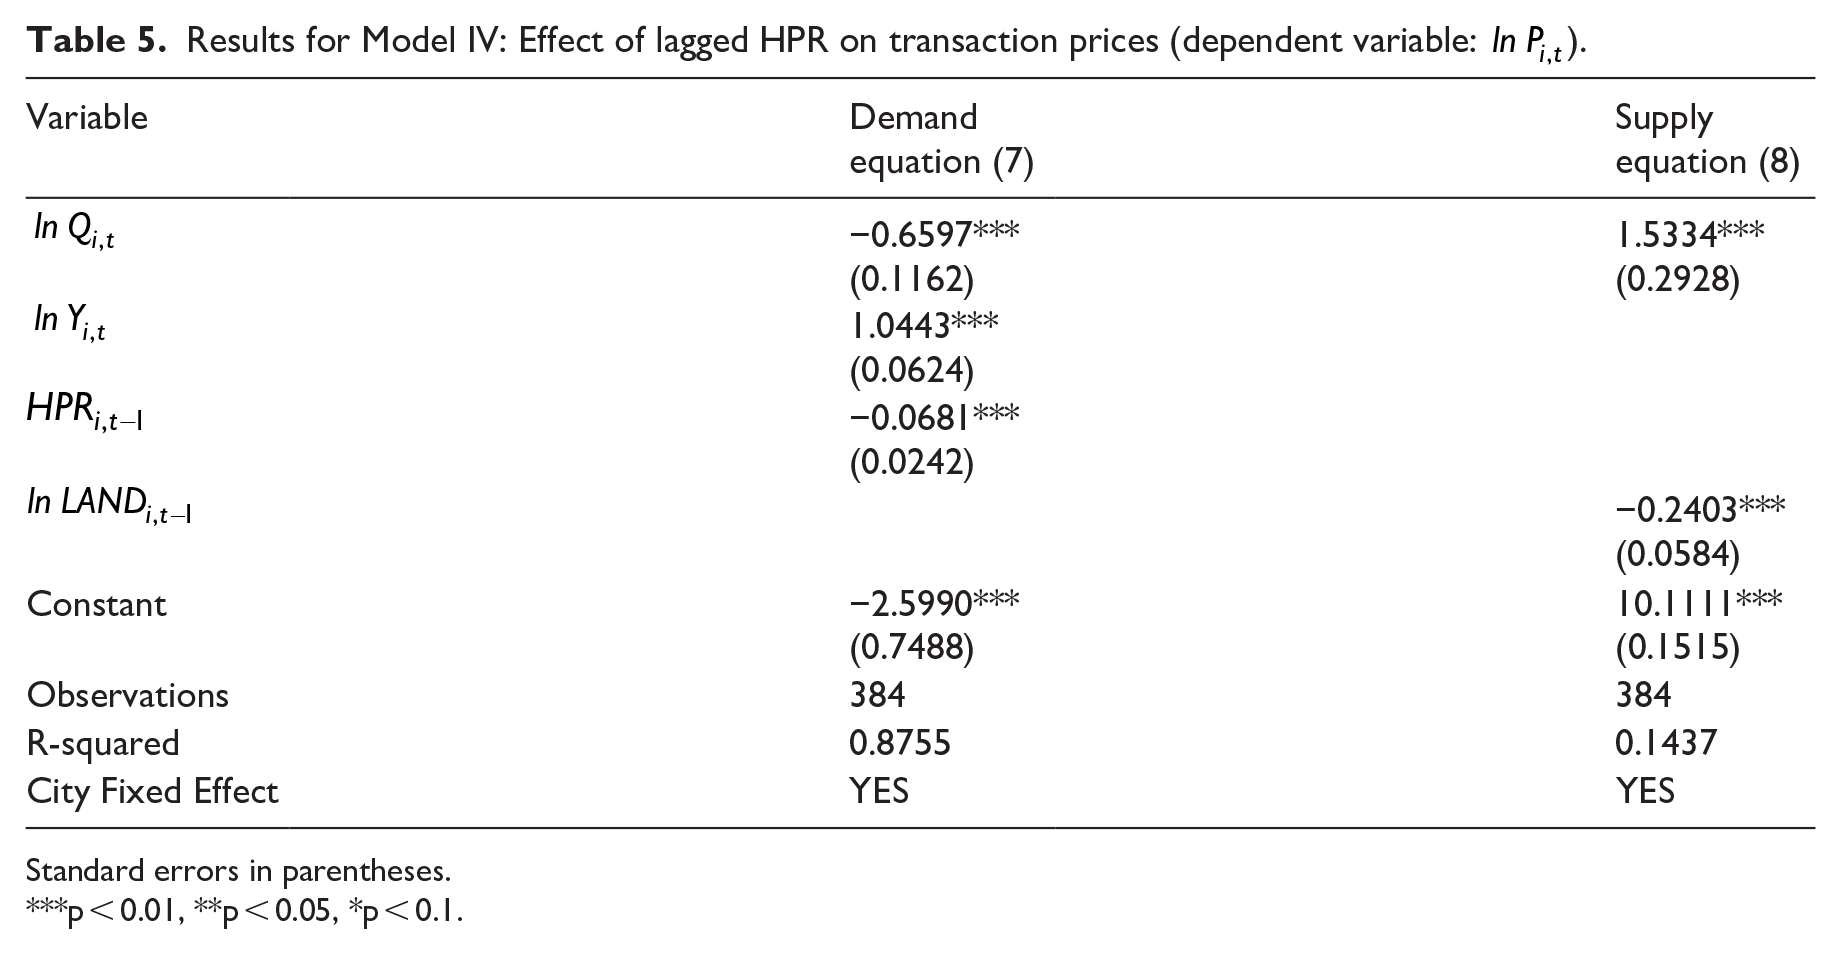
Model IV


Results for Model III: Effect of lagged HPR on transaction volumes (dependent variable:
Standard errors in parentheses.
p < 0.01, **p < 0.05, *p < 0.1.
Results for Model IV: Effect of lagged HPR on transaction prices (dependent variable:
Standard errors in parentheses.
p < 0.01, **p < 0.05, *p < 0.1.
It shown in Tables 4 and 5, when the HPR is in place for more than three quarters, housing transaction volume and prices are like to decline by 7.74 percent and 6.58 percent in the following year, while the removal of HPR reverses these effects with the same magnitudes. 6 To gain an intuition of the magnitudes of the policy effects on housing transaction volume and price for each city, we plot the actual series with the HPR effects included and simulated series without the HPR effects. The figures for transaction volumes by city are shown in Appendix Figure A1, while those for transaction prices are shown in Appendix Figure A2. The solid lines represent the actual transaction volume/price series with the HPR effects included, while the dashed lines present the simulated volume/price series without the HPR effects. The difference between the actual and simulated series represents the HPR effect. From one year after the HPR’s implementation to one year following its termination, the volume/price series without the HPR effect was above that with the HPR effect as the HPR significantly reduced housing transaction volumes/prices in the cities. The two series overlapped a year after the HPR was lifted.
Besides the policy effects, results in Tables 4 and 5 also demonstrate a downward-sloping demand curve and an upward-sloping supply curve. A 1 percent increase in per capita GDP is expected to stimulate a 1.52 percent in housing transaction volumes and a 1.04 percent increase in housing prices. Additionally, a 1 percent increase in land supply is likely to lead to a 0.15 percent increase in housing sales and a 0.24 percent reduction in prices.
Market behavior and price volatility under HPRs
Between 2009 and 2019, HPRs were first implemented, then removed, and then implemented again among major cities. In the previous section, the HPRs have shown to effectively curb housing transaction volumes and prices in major urban housing markets in China. However, the occasional changes in the HPR policies affect home buyers’ expectation toward the housing markets. Upon removals, households may anticipate the policy’s future reimplementation, leading to purchase of housing units beyond their immediate needs. This behavior can contribute to significant price rebounds and price volatility. Zhang et al. (2016) show that heterogeneous expectations affect housing price volatilities. On the contrary, housing prices may have been less volatile if the HPR has never been implemented. The absence of HPRs eliminates the anticipation-driven purchasing behavior and the subsequent price rebound typically occurs upon the HPR removals. In this section, we attempt to investigate if the HPRs have increased the housing price volatilities across cities by testing the following hypothesis:
Hypothesis II: Housing prices are more volatile in the presence of HPRs compared to the scenario in the absent of HPRs.
Measurement of the price volatility
Following Hui and Wang (2014), we decompose the housing price into two components: the theoretical price and the price anomaly. The theoretical price is determined by market fundamental factors, typically referring to the demand and supply shifters in the market, and the time-invariant city heterogeneity. Given that the HPR is usually temporary and announced abruptly, it can be considered as a shock to the market that contributes to the price anomaly. Therefore, the price anomaly includes both the policy shock and any other components which cannot be explained by the market fundamental factors or the city heterogeneity. The estimates derived from Model IV are used to compose the price anomaly series for each city. To compare the housing price volatilities in the presence of HPRs to those in the absent of HPRs, we identify the price anomaly series in two scenarios:
(1) The non-HPR scenario, in which we assume that the HPR has never been implemented. The price anomaly series includes the residuals (
(2) The HPR scenario, in which the price anomaly series include the HPR effects (
Specifically, the price volatility in this study refers to the fluctuation in price anomaly and is measured by the standard deviation of price anomaly series. A greater standard deviation of the price anomaly series indicates more volatile housing prices.
Comparation and discussion
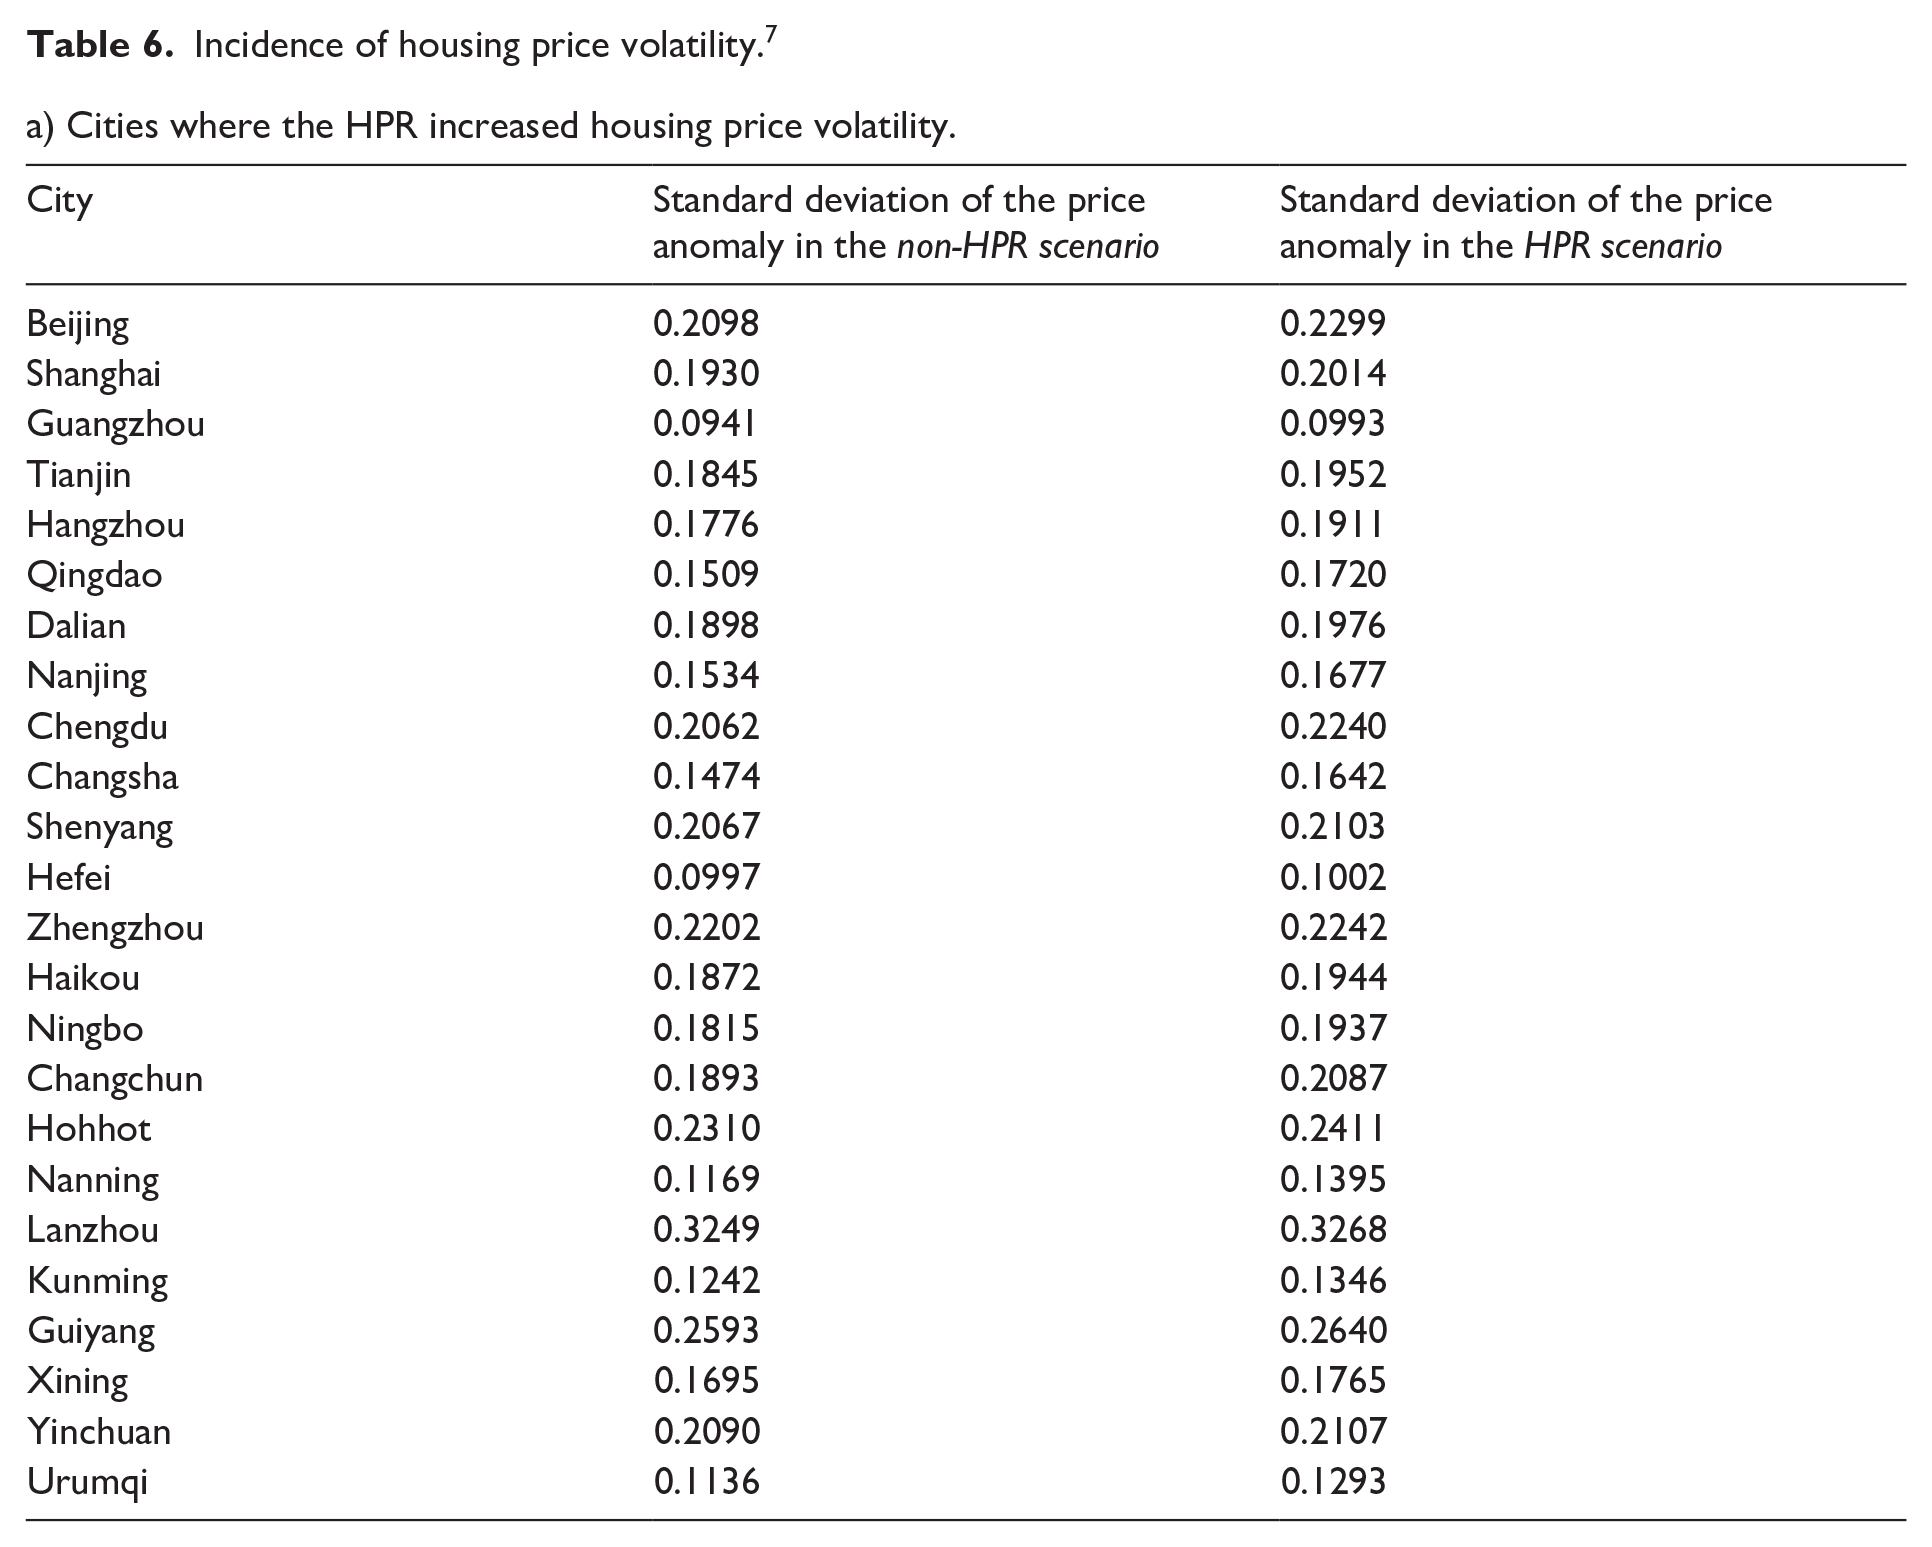
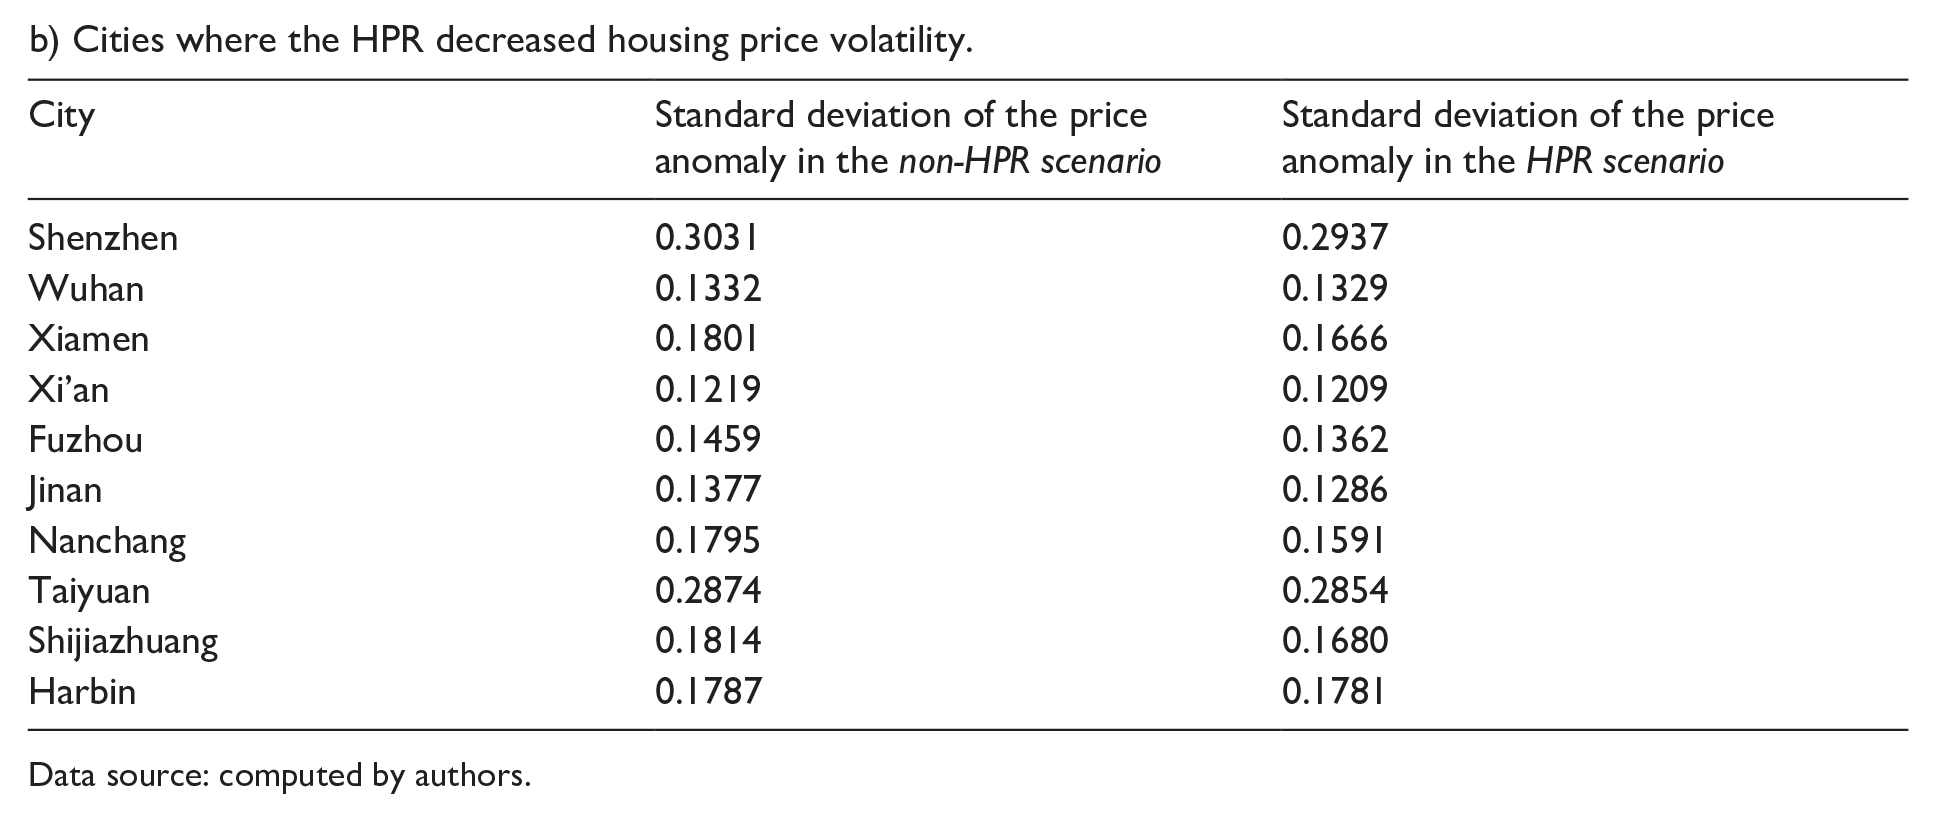
The incidence of housing price volatility for each city, indicated by the comparation of the standard deviations of the price anomaly series in the two scenarios, is shown in Table 6.
Incidence of housing price volatility. 7
a) Cities where the HPR increased housing price volatility.
b) Cities where the HPR decreased housing price volatility.
Data source: computed by authors.
Overall, the results in Table 6 indicate that the HPR led to increased housing price volatilities in 24 out of the 34 cities that implemented the HPR between 2009 and 2019.
Changes in HPR influence buyer and seller behaviors, which, in turn, impact price adjustments based on market supply and demand dynamics. Differences in price elasticities of demand and supply across cities are a potential factor contributing to variations in housing price volatilities following a policy shock. Thus we use Figure 2 to illustrate the impact of a demand shock on prices in two scenarios. In Scenario (a), demand is elastic and supply is inelastic, while in Scenario (b), demand is inelastic and supply is elastic. The same demand shock leads to a greater change in the equilibrium price (from P1 to P2 in both scenarios) in Scenario (a) compared to Scenario (b). When there are frequent demand shocks to the market, prices tend to be more volatile in Scenario (a) than in Scenario (b). Thus the HPR policy shocks amplify price volatility in housing markets in which the price elasticity of demand is relatively high and the price elasticity of supply is relatively low.
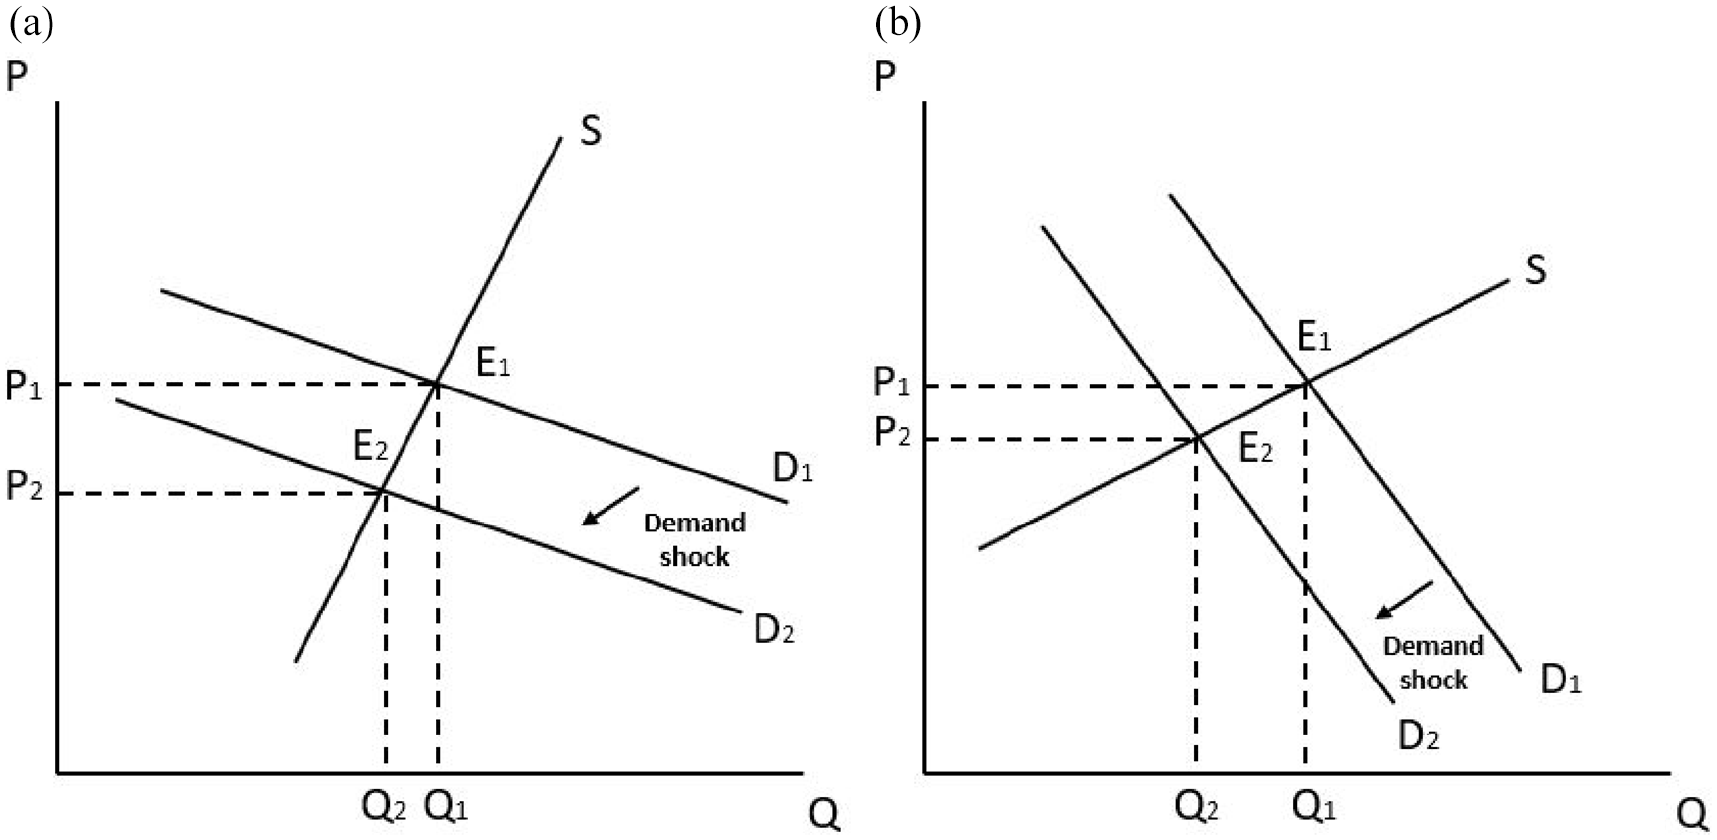
Changes in equilibrium prices under a demand shock. Scenario (a) Elastic demand and inelastic supply. Scenario (b) Inelastic demand and elastic supply.
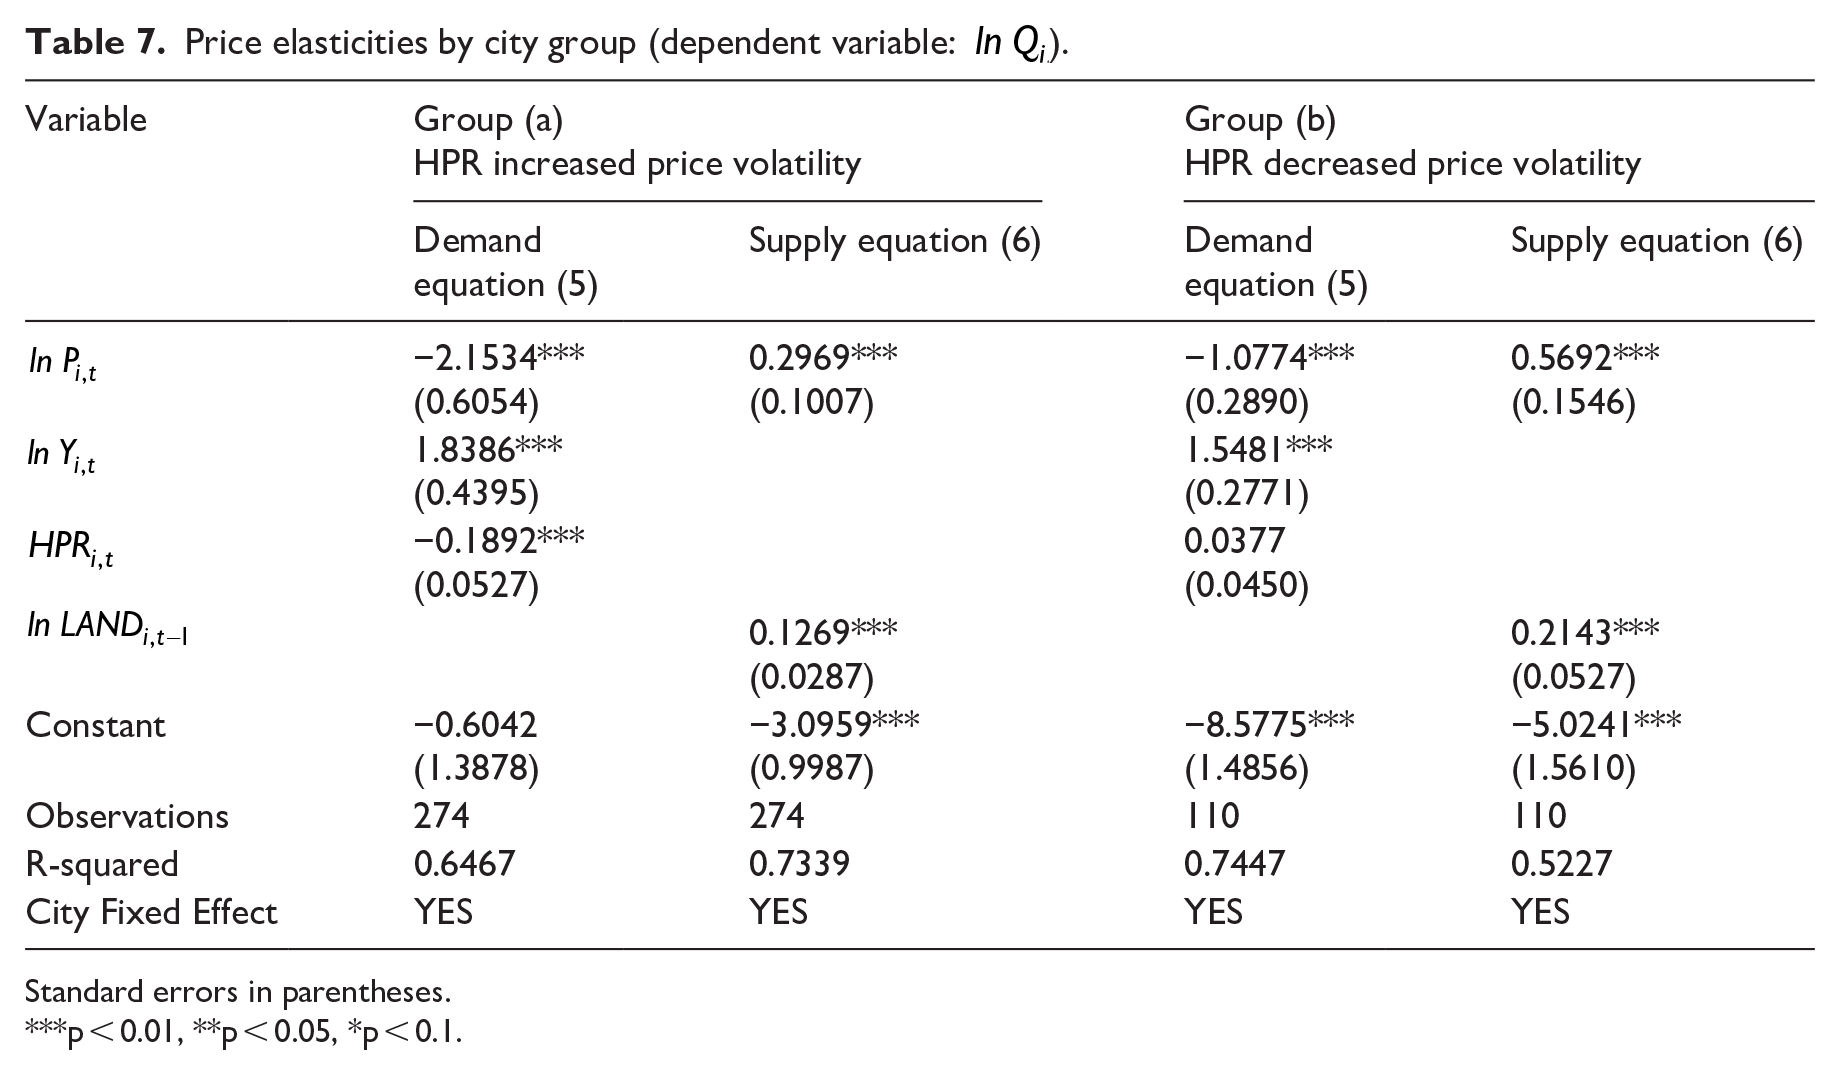
To test the above mechanism of the varying impact of HPR on price volatilities in different cities, we divide the 34 cities listed in Table 6 into two groups: (a) cities where the HPR increased housing price volatility, and (b) cities where the HPR decreased housing price volatilities. On the one hand, housing supply is generally inelastic in the short term due to the construction process. The insufficient supply of land for residential use also contributes to the inelasticity of housing supply. On the other hand, housing demand tends to be more elastic in cities with large populations and rapid economic growth, due to the large number of the potential homebuyers and their increasing purchasing power. Empirically, the 24 cities in Group (a) have an average urban population of 5.2 million in 2019 and an average annual per capita GDP growth rate of 6.7 percent between 2009–2019, while the 10 cities in Group (b) have an average urban population of 5.1 million in 2019 and an average annual per capita GDP growth rate of 6.2 percent. We would expect that, on average, the price elasticity of demand is higher and price elasticity of supply is lower in cities in Group (a) compared to those in Group (b). To test this expectation, we estimate Model IV to derive the price elasticities of demand and supply for each group. The results are shown in Table 7.
Price elasticities by city group (dependent variable:
Standard errors in parentheses.
p < 0.01, **p < 0.05, *p < 0.1.
On the demand side, cities in Group (a) have an average price elasticity of demand of −2.15, while cities in Group (b) show an average price elasticity of demand of −1.08. On the supply side, cities in Group (a) have an average elasticity of supply of 0.30, whereas cities in Group (b) have an average elasticity of supply of 0.57. Comparing to cities in Group (b), cities in Group (a) have a more elastic demand and a less elastic supply.
Regarding the policy impact, housing transaction volumes are more sensitive to the HPR in cities in Group (a) than in Group (b). Demand in Group (a) cities is more responsive to the HPR, resulting in greater price volatility compared to cities in Group (b), which is consistent with the findings derived from Table 6. In Group (a) cities, when a demand shock occurs in the housing market, their relatively more elastic demand can quickly respond, whereas their relatively less elastic supply cannot adjust quickly enough, leading to larger price fluctuations. Overall, housing markets with higher price elasticity of demand and lower price elasticity of supply tend to have higher price volatility under a demand shock, which would further induce more investment and speculative behaviors.
Conclusions
This empirical study analyzes the effects of HPRs on housing transactions and price volatilities. Our findings reveal that HPRs have effectively reduced housing transaction volumes and prices in major cities, consistent with findings in previous research (Li et al., 2017; Lu et al., 2021; Sun et al., 2017). However, in cities with more elastic demand and less elastic supply of housing, the HPRs have also made the housing prices more volatile. Short-term policy measures like the HPR can immediately and effectively curb speculative demand. However, the repeated implementation and discontinuation of such policy may alter the expectations of homebuyers. Our findings provide empirical support for the model designed by Zhang et al. (2016). When the HPR is lifted, individuals may decide to speed up their housing purchase, driven by their rational expectations regarding future implementation of the HPR. The sudden changes in demand, coupled with slow adjustment in supply, lead to price fluctuations. Frequent demand shocks can consequently result in significant price volatility. While the initial purpose of HPR was to deter speculation in the housing markets, its unintended impact on price fluctuations should not be overlooked.
While the HPR is favored by local governments for its timely effectiveness in curbing housing demand, it has unintended consequences. Home buyers’ purchasing decisions are influenced by their expectations of future market changes. The misuse of market interventions and frequent policy shifts disrupts market participants’ ability to form rational expectations, leading to heightened uncertainty and short-term speculation. Once the HPR is lifted, the surge of housing purchases driven by the anticipation of future HPR reimplementation would drive up prices and make homes even less affordable for the low- and middle-income households. Our findings align with challenges encountered in other economies. In Vancouver, Canada, the imposition of foreign buyer taxes reduced house prices temporarily; however, the price growth eventually rebounded to its pre-intervention level (Du et al., 2022). Huang and Tang (2012) demonstrate that the supply inelasticity, due to land scarcity and land use regulations, amplified price responses to the sub-prime mortgage credit expansion between 2000 and 2009 in the U.S. The cross-country evidence suggests that, when designing policies, policymakers should take into account that the policy effects may be temporary and may have unintended consequences such as amplified housing price volatilities, spillover effects in the non-regulated areas, dampened legitimate housing demand among immigrants, etc.
Given the unexpected and undesirable outcomes associated with government interventions such as the HPR, we believe that market forces should be more greatly relied on, to foster more efficient housing markets. However, it is also crucial for governments to balance between market interests and social welfare, ensuring an adequate supply of affordable housing for low- and middle-income households. Currently in China’s household sector, housing remains the most viable channel for household investment. Reforms in the financial sector to offer more viable and reliable investment opportunities to households are crucial.
Footnotes
Appendix
Housing purchase restriction policies by city, 2009–2019.
| City | First round of implementations | Removals | Second round of implementations |
|---|---|---|---|
| Beijing | 2010Q2 | ||
| Shanghai | 2010Q4 | ||
| Guangzhou | 2010Q4 | ||
| Shenzhen | 2010Q3 | ||
| Tianjin | 2010Q4 | 2014Q4 | 2016Q4 |
| Hangzhou | 2010Q4 | 2014Q3 | 2016Q3 |
| Qingdao | 2011Q1 | 2014Q3 | 2017Q1 |
| Dalian | 2010Q4 | 2014Q3 | 2018Q1 |
| Chongqing | |||
| Nanjing | 2010Q4 | 2014Q3 | 2016Q3 |
| Wuhan | 2011Q1 | 2014Q3 | 2016Q4 |
| Chengdu | 2011Q1 | 2014Q3 | 2016Q4 |
| Xiamen | 2010Q4 | 2015Q1 | 2016Q3 |
| Xi’an | 2011Q1 | 2014Q3 | 2017Q2 |
| Changsha | 2011Q1 | 2014Q3 | 2017Q1 |
| Fuzhou | 2010Q4 | 2014Q4 | 2016Q4 |
| Shenyang | 2011Q1 | 2014Q3 | 2018Q2 |
| Jinan | 2011Q1 | 2014Q3 | 2016Q4 |
| Nanchang | 2011Q1 | 2014Q3 | 2016Q4 |
| Hefei | 2011Q1 | 2014Q3 | 2016Q4 |
| Zhengzhou | 2011Q1 | 2014Q3 | 2016Q4 |
| Haikou | 2010Q4 | 2014Q3 | 2017Q2 |
| Ningbo | 2010Q4 | 2014Q3 | 2017Q2 |
| Taiyuan | 2011Q1 | 2014Q3 | 2018Q2 |
| Shijiazhuang | 2011Q1 | 2014Q3 | 2017Q1 |
| Changchun | 2011Q1 | 2015Q2 | |
| Harbin | 2011Q1 | 2014Q3 | |
| Hohhot | 2011Q2 | 2014Q2 | |
| Nanning | 2011Q1 | 2014Q4 | |
| Lanzhou | 2010Q3 | 2014Q3 | 2017Q2 |
| Kunming | 2011Q1 | 2014Q3 | 2018Q3 |
| Guiyang | 2011Q1 | 2014Q3 | |
| Xining | 2011Q1 | 2014Q3 | |
| Yinchuan | 2011Q1 | 2014Q3 | |
| Urumqi | 2011Q1 | 2014Q4 | |
Source: CREIS and local government documents.
Declaration of conflicting interests
The author(s) declared no potential conflicts of interest with respect to the research, authorship, and/or publication of this article.
Funding
The author(s) received no financial support for the research, authorship, and/or publication of this article.
Ethical consideration
There are no human/animal participants in this article.
Consent to participate
Not applicable.
Consent to publish
Not applicable.
Data availability
The data sources include China Statistical Yearbooks (www.stats.gov.cn/sj/ndsj/) and China Real Estate Index System (![]() ).
).
1.
Real prices for each city by year are calculated by using CPI with 2010 as the base year.
2.
We conducted the Hausman tests for the city fixed effects and the year fixed effects for Model I to IV. The test results indicate that it is necessary to control for the city fixed effects, but not for the year fixed effects in these models. Therefore, the models account only for the city fixed effects, not the year fixed effects.
3.
The specific measures adopted by individual cities can vary according to the covered districts, requirements on home buyers, duration of the restriction, etc. It is therefore difficult to quantify the specific policy restrictions. Therefore, we choose to use the duration of the purchase restriction as an indicator of policy intensity in this study. Compared to using the year-based duration, we believe that using quarters can more accurately reflect the length of time the policy has been in place. We have also tested a month-based duration HPR variable and obtained similar results to using the quarters.
4.
City CPIs are proxied by the corresponding provincial CPIs, obtained from China Statistical Yearbook.
5.
Data on the one-year-lagged gross floor area allowed with land concession for residential use is missing for the city of Xining in 2009.
6.
In percentage, the marginal effect of
7.
Chongqing is not listed in the table as no HPR policy was implemented in this city between 2009 and 2019.