
Abstract
Researchers have been long preoccupied with the measuring and monitoring of economic and social deprivation at small scales, neighbourhood, level in order to provide official government agencies and policy makers with more precise data insights. Whist valuable methodologies have been developed, the exercise of data collection associated with these methods tends to be expensive, time consuming, published infrequently with significant time delays, and subject to recurring changes to methodology. Here, we propose a novel method based on a straightforward methodology and data sources to generate a faster and real time indicator for deprivation at different scaling, small to larger areas. The results of our work show that our method provides a consistent view of deprivation across the regions of England and Wales, which are in line with the other indexes, but also highlight specific flash points of deep rural and highly dense urban deprivation areas that are not well captured by existing indexes. Our method is intended to aid researchers and policy makers by complementing existing but infrequent indexes.
Introduction
The need to identify, measure and categorise distinct levels of economic and social inequalities is a common issue that preoccupies both academic researchers and government agencies (Green et al., 2018; Lloyd et al., 2023a; Noble et al., 2019a, 2019b). To address this, a number of indices (Green et al., 2018; Lloyd et al., 2023a; Noble et al., 2019a; The United Kingdom Census, 2021) have been developed to compare poverty and deprivation in distinct regions across the land at both micro and macro levels. Unsurprisingly, each of these indexes provide distinct results and highlight specific features that are not easily captured by the others, as there are distinct perspectives on exactly what is being measured as well as how to measure.
In relation to what is being measured, it can be argue that the distinction between poverty and deprivation is broadly agreed, as colloquially explained by the ONS (ONS, 2019): ‘People may be considered to be living in poverty if they lack the financial resources to meet their needs, whereas people can be regarded as deprived if they lack any kind of resources, not just income’. The general understanding, therefore, effectively implies that poverty is fundamentally about money (wealth, income, etc.), and a sub component of the overall concept of deprivation. The definition of money, however, is much more vague as any kind of resource can be measured and interpreted in many ways, and this is where each of the indices starts to deviate conceptually, and so results vary significantly.
When it comes to how to measure, the traditional approach (Green et al., 2018; Lloyd et al., 2023a; Noble et al., 2019a; The United Kingdom Census, 2021) taken by researchers is to narrow down their specific conceptual definition of deprivation by compartmentalising deprivation into dimensions, or sub components, so that it becomes easier to define each lack of resource more specifically. Each domain is then weighted, either implicitly or explicitly, and an overall single index is produced. This is essentially the general approach adopted by all existing indexes described in this paper.
The above approach, however, requires significant number of arbitrary judgements (Noble et al., 2019a, 2019b) both in assigning the hierarchy and importance of each domain in the weightings used, and in the methods to harmonise individual measures of a monetary (financial and economic) or non-monetary (social) nature. Inevitably, the need to address these issues tends to lead to extensive and complex methodologies that require continuous re-assessment every time new data is published, together with expensive and time-consuming data collection exercises. As important is the fact that the process becomes costly and publication are results are infrequent with long time lags. It is of little surprise then that authorities and bodies such as the ONS in the United Kingdom are looking at potential alternative methodologies to capture real-time indicators of social change (ONS, 2024). However, whereas the existing indexes cited in this paper are helpful to provide single quantifiable values at a given point in time, it can be argued that they are essentially mathematical exercises driven by the current computational capabilities and data availability. Further, current indices do not focus on the theoretical framework underpinning the contested concept of deprivation within social sciences, leading to continuous methodological changes.
It is within this context that we place the aims of and motivation for our research. Whilst we do not attempt to define deprivation precisely given its contentious nature, we place our work in the context of some early and pioneering studies within the UK where deprivation is an emerging property resulting from the relationship between social and spatial processes that are complex and multilateral (Davidson, 1976; Haris, 1973). Importantly, short-term changes in spatial structure are primarily generated by residential moves, in particular in the context of urban renewal, new housing and rehousing that leads to increasing spatial inequalities (i.e. the divergence hypothesis) (Parker, 1973). In essence, we developed a simple measure, the Behavioural House Indicator
In order to do so, we developed a framework and methodology that is computationally simple, which has no arbitrary parameters, and requires no data transformations. Moreover, we make use of a single data source, the ‘HM Land Registry’. The HM Land Registry is a government controlled entity that keeps all the relevant property records. In particular, each time a property changes ownership, a new transaction record is recorded at HM Land Registry. This data is (a) factual and objective (i.e. no assumptions in its construction), (b) publicly available (i.e. at no cost), (c) published promptly and at short time intervals (i.e. fast) and (d) detached from any economic and social data collection (i.e. independent). In addition, the data set is longstanding, extensive, and methodologically stable.
Our process, detailed below, is to use HM Land Registry data to obtain sequences of transactions for each individual property. From this we construct a conditional probability table for the day of the week of pairs of subsequent transactions. These are studied for each region (LSOA or MSOA): we calculate the corresponding mutual information (Shannon, 1948) for each region, determine the average mutual information of the neighbours for each region, and generate our Behavioural House Indicator
Our proposed framework and method is underpinned by some important conceptual principles derived from complexity (Huang and Ulanowicz, 2014; West, 2017), information theory (Dehmer et al., 2011; Sanchirico and Fiorentino, 2008; Shannon, 1948), and mathematical finance (Rebonato, 2004). Fundamentally, we highlight the fact that we are dealing with economic and social complex systems that have features and elements highly dependent and intertwined to each other, and therefore with high levels of correlation and causality. This fact in isolation has important implications.
Firstly, it follows that any measure for deprivation must be mathematically non-additive so that the effects of correlations are not compounded (Chateauneuf and Cornet, 2022; Rebonato, 2004). This is fundamentally distinct from the traditional additive approach of aggregating different measures (where the weightings are effectively an attempt to correct from the lack of computation of correlations).
Secondly, in order to avoid poverty (monetary) measures trumping the social elements, we purposefully avoid any monetary quantities. This also has the additional benefit these monetary quantities tend to be noisy given the temporal and relative nature of money as storage of value. So we avoid complex financial issues (Biggeri and Ferrari, 2010; Whitehouse, 2009) such as inflation, purchase parity, non-declared earnings that have different effects in distinct economic regions and social classes.
Lastly, we rely on the general research findings that different forms and levels of deprivation lead to a range of distinct behaviours (Anand et al., 2021). As we are not preoccupied with specific definitions, we make use of mutual information as the preferred measure to compute changes to behaviours. Importantly, this means that our research is geared towards the relative measurement and detection of areas of high level deprivation. It does not, however, provides any specific explanation to the specific causes of deprivation.
We narrow our study to the economies of England and Wales. We exclude the two other regions of the United Kingdom, Scotland and Northern Ireland, for two reasons. Firstly, the same level of data is not publicly and freely available and, secondly, the laws and regulations concerning house transactions in Scotland are fundamentally distinct from those of England and Wales. Furthermore, the number of yearly property transactions in Scotland and Northern Ireland are much smaller, being around 10% and 3%, respectively, of all transactions within the United Kingdom. In some cases, when comparing our Behavioural House Indicator
The final aspect in our analysis is the definition of the geographical areas used for our analysis areas. We will use data from the postal service, to link properties listed in HM Land Registry transactions to postcodes. Postcodes identify small regions, typically containing 15 and usually less than 100 neighbouring properties. The ONS often provides information on three larger scales. We will discuss these definitions of geographical areas as needed in section with additional information given in Section 6 of the Supplementary Material.
It is important to note that some measures are tied to one predefined geographical structure. For example, the Index for Multiple Deprivation is only given in terms of one of these definitions, the smallest scale from the ONS known as the Lower layer Super Output Area. In this respect, our Behavioural House Indicator
Methods
Data sources and collection
We make use of three distinct groups of data sets based on their usage. The first group is the property transaction data, sourced from the HM Land Registry, which is used to compute our fast, real-time, Behavioural House Indicator
Property related data
The core data for our analysis is the Price Paid database sourced from the ‘HM Land Registry for England and Wales’. The data set records basic data (i.e. the transaction date and price paid) as well as the address for every single registered residential property sale in England and Wales from January 1995 to June 2023.
We make use of the transaction date and the postcodes as raw data fields. We compute and assign a unique ID h for the property by matching the address fields (flat and house numbers, street and postcode) within the data set.
Geographical data
Geographical data is sourced from the Office for National Statistics (‘ONS’) via the
Economic and social indices
We make use of two main data sources in relation to the economic and social indices.
The first data set we use is related to the English Index of Multiple Deprivation
The second data source is that of the 2021 Census (The United Kingdom Census, 2021), including population, households by deprivation dimensions, ethnic groups and others. This data comes from the ONS census and labour market statistics website
As detailed footnote,
Data analysis and construction of the behavioural house indicator
Each property transaction
We are interested in the day of the week so we define a map from a date t to a day
Frequency of transactions and transaction pairing probabilities
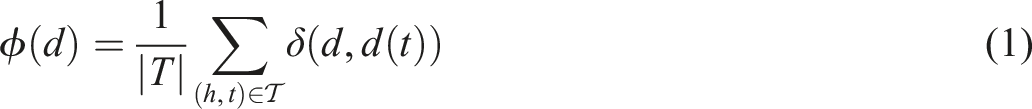
The frequency of transactions ϕ
d
for a given day of the week
Weekday pairing probability
We now focus on days of the week,
A simple way to study this is to look at consecutive transactions of one property. To do this we define a sales history s(h) for a given property h which is the sequence s(h) = [t1, t2, …, t n ] where t i < ti+1 and {(h, t i )|t i ∈ s(h)} is the subset of all transactions involving the property h.
For every single transaction (h, t
i
) from the sales history s(h) of each property


The single probability distributions P(1) and P(2) are the probabilities that a transaction chosen uniformly at random from the reduced set of transactions


Mutual information
The pointwise contribution to the mutual information I(d1, d2) and the total mutual information W (Shannon, 1948) is therefore:


Computing neighbourhood and the average mutual information of neighbours
We will also examine our results for properties in specific areas. To do this start with a partition of the total area into a set of non-overlapping smaller areas
In many situations, the areas we use are very small leading to large fluctuations. If we assume many neighbouring areas have similar properties, it makes sense to smooth our measures over slightly larger regions. We adopt a simple local aggregation procedure where we average over the values from an area and its neighbours (see Sections 7 and 8 of the Supplementary Material for a detailed example).
We define two areas a and b to be neighbours if any road (links or nodes) recorded within the Ordinance Survey Open Road data set crosses or touch the boundaries of both areas. We emphasise here that sharing boundaries is not a sufficient condition for a and b to be neighbours. Instead at least one single road must cross (or at the extreme, must touch) the boundary between these two areas. We encode this information in an adjacency matrix E ab which is 1 if areas a and b are neighbours, while it is zero otherwise (including when a = b).
This allows us to compute a separate mutual information of an area a in terms of an average of its neighbours as

Generating the behavioural house indicator
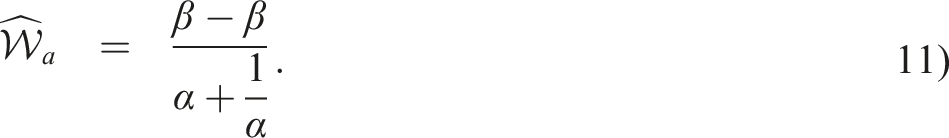
A scatter plot of the mutual information W
a
against average neighbour mutual information
Once these parameters have been obtained, we can now use them to produce an aggregation of the mutual information of an area and its neighbours to produce our Behavioural House Indicator

Ranking areas and bins
With so many areas to study, it is often helpful when discussing and visualising trends to study groups of areas with similar values of some attribute. For instance, for some real valued rating Θ (some index or measure) we often split the areas into deciles, ten equal-size subsets
Results
Data analysis: The index foundations
Our Behavioural House Indicator
The relevance of the day of the week and associated measures are illustrated by the four panels in Figure 1, where the unique characteristics associated with Friday related house purchases can be identified. The first panel 1A is a basic frequency bar chart that shows that on average most transactions (49.8%) have occurred on Friday over the last 28 years. A richer insight, however, is obtained when combining the parings of days of the week between prior and subsequent dates of transactions (or purchase and sale of the property by the homeowner). Unsurprisingly, panel 1B shows the prevalence of the Friday-Friday pairing (26.6%), but most importantly, from the perspective of a single homeowner, the date of purchase (i.e. prior transaction) conditionally affects the date of sale (i.e. subsequent transaction). Frequency of transactions by day of the week, probabilities and contribution to the point-wise mutual information for days of the week pairing combinations and geographical interconnections. Panel (A) shows the frequency ϕ of single transactions by day of the week (d), with Friday accounting for 49.8% of all transactions. Panels (B) and (C) relates to the combinations arising from the pairing of consecutive transaction for the same property by their respective day of the week (d1, d2), where the vertical axes correspond to the prior transaction and the horizontal axes equate to the subsequent transaction. Panel (B) is the heat-map for the probability of pairings P(d1, d2), where the combination Friday-Friday accounts for 26.6% of all transactions. Panel (C) shows the contribution to the point-wise mutual information I(d1, d2) for each pairing. Panel (D) provides a geographical perspective of the interrelationship between the selected quantities based on the computation of mean coordinates (latitude and longitude). The circles represent the average coordinates of all pairings (d1, d2) for three subsets of mutual information, that is, both on Fridays {Fri}, Friday and another day – or vice versa – {Fri, Oth} and both other days {Oth}. The lines and numbers represent the best fit and corresponding mean geographical coordinates of the deciles for each of the quantities associated with the two selected deprivation domains, namely the ‘Health Deprivation and Disability’ and ‘Barriers to Housing and Services’ scores. All data relates to the range between [1-Jan-1995, 30-Jun-2023].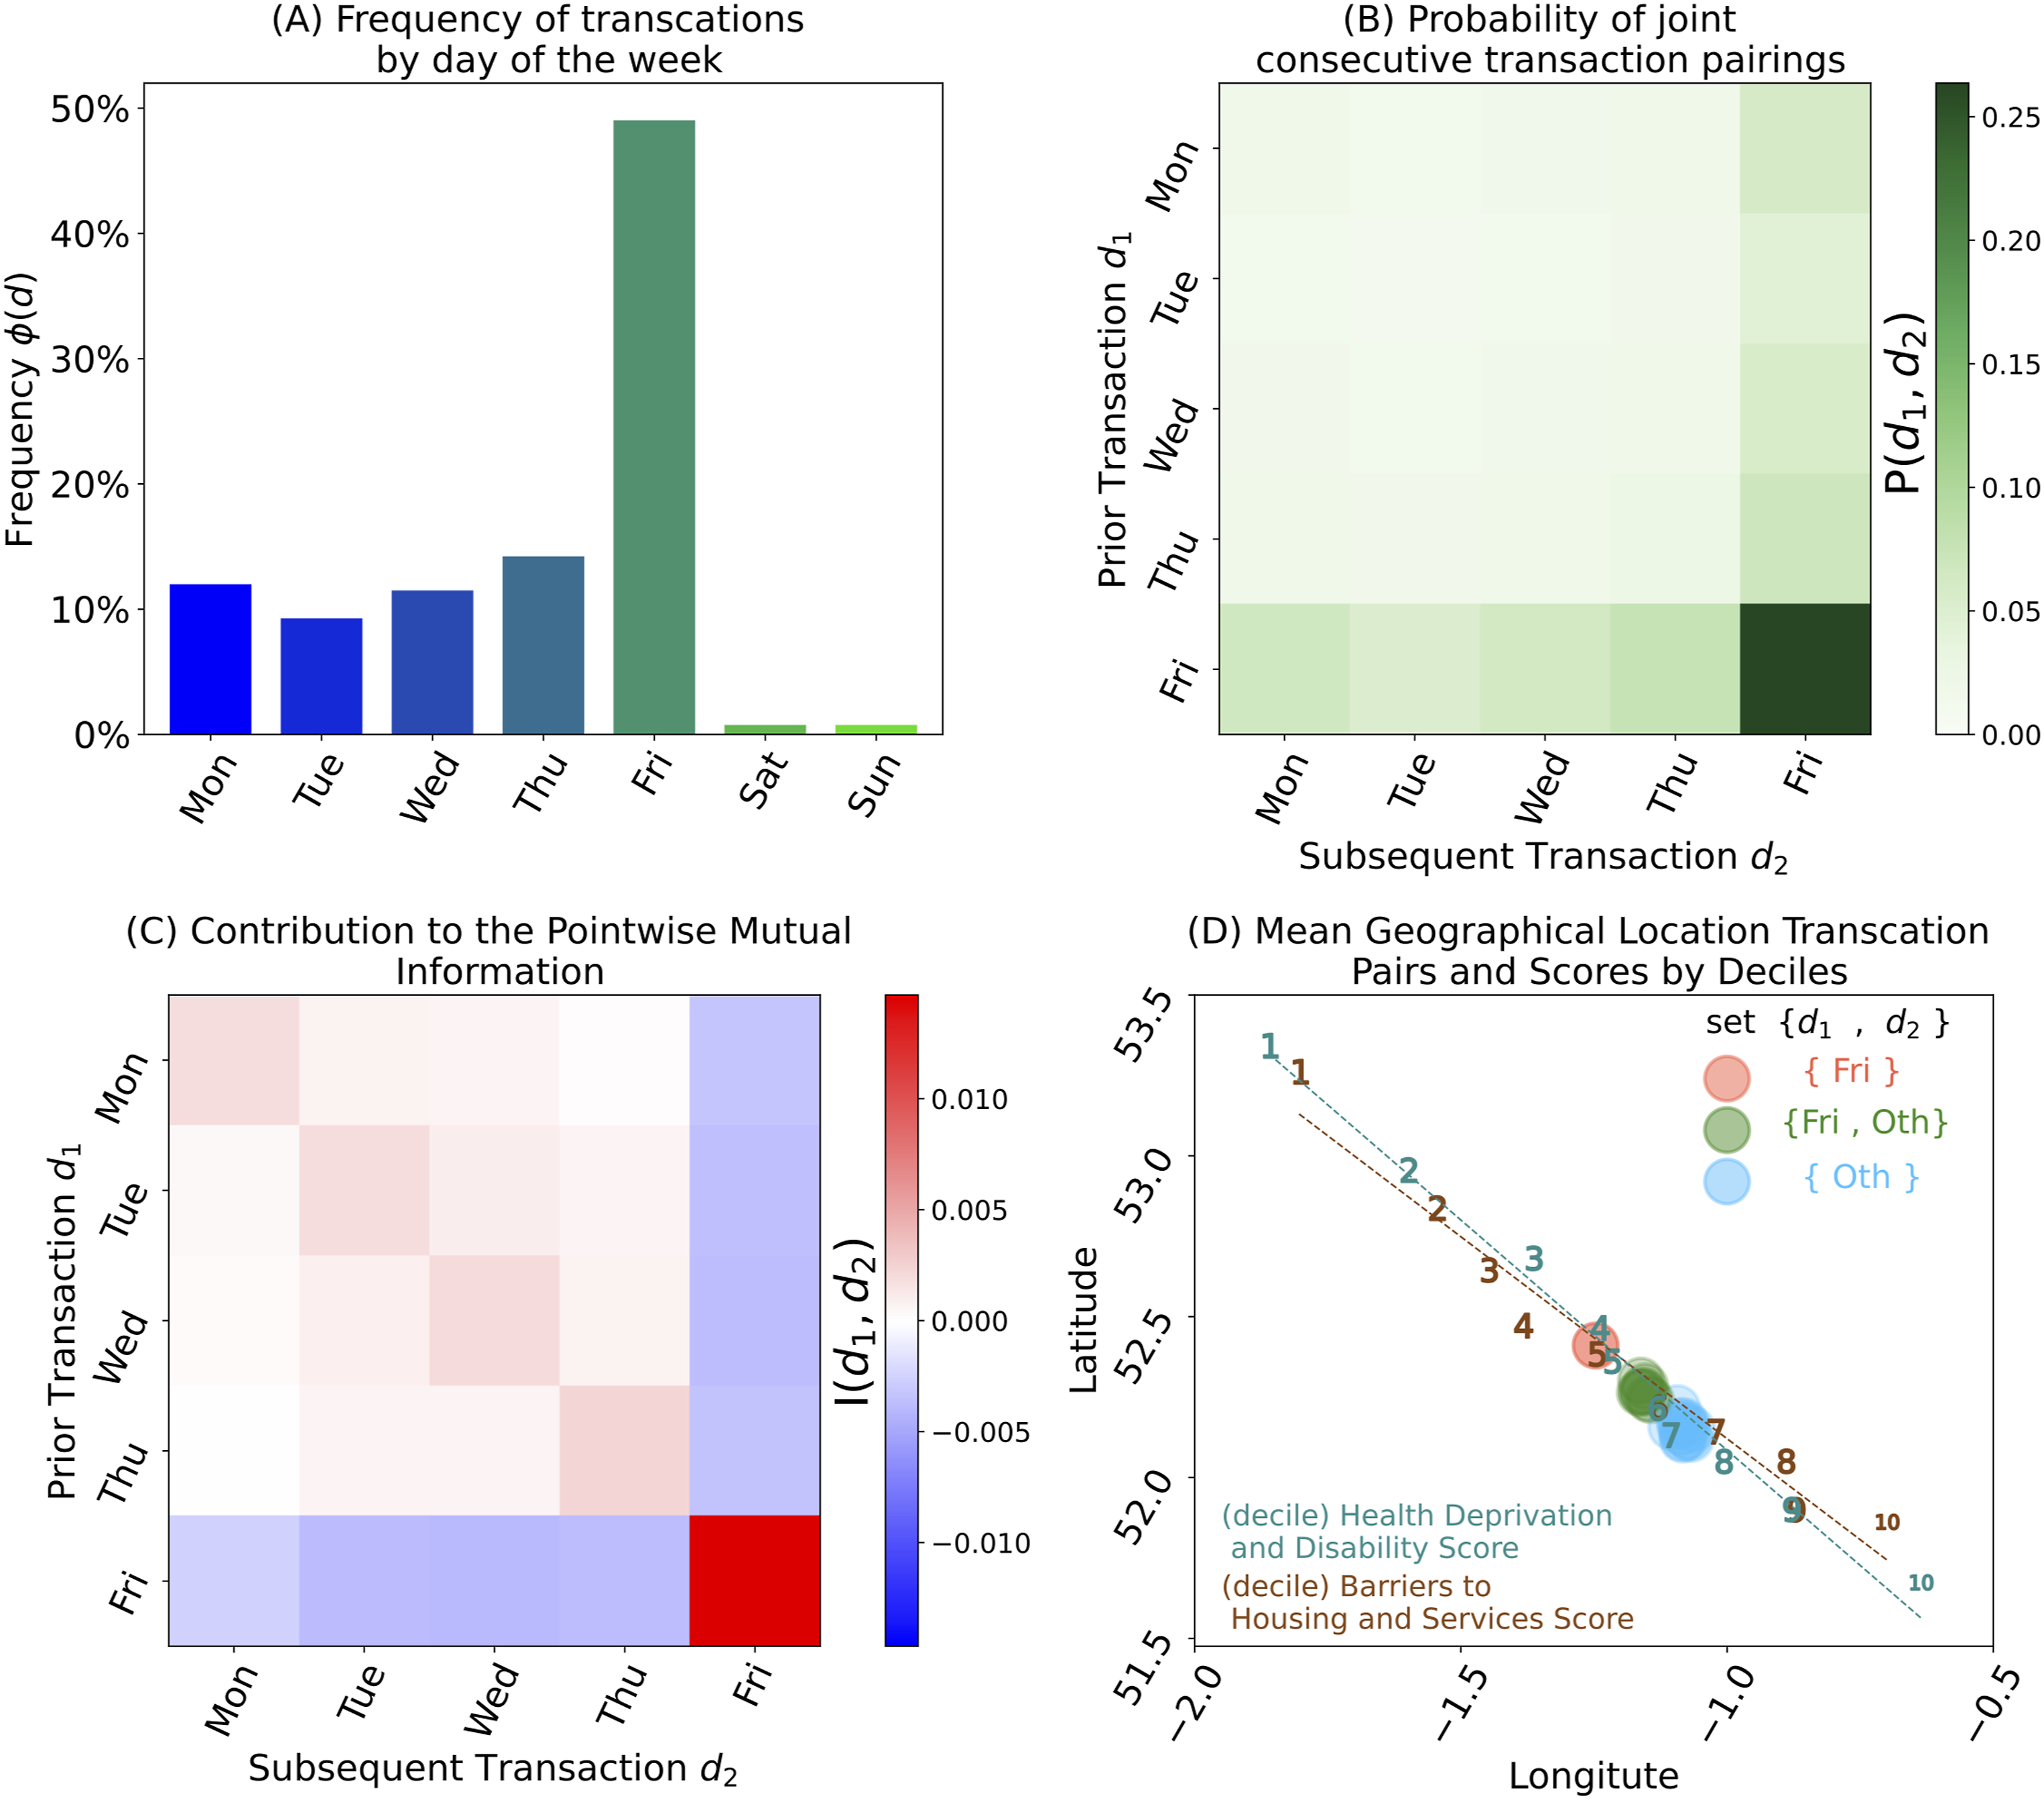
The contribution to the point-wise mutual information I(d1, d2) is shown panel Figure 1(C) and it indicates that the Friday-Friday combination occurs much more often than would be expected from random pairs of transactions (I(Fri, Fri) > 0). As a result the combination of a transaction on Friday with a previous or subsequent transactions on another day occurs less often than we would expect for random independent house purchases, I(Fri, Oth) < 0 and I(Oth, Fri) < 0.
Panel 1D is an illustration of the important association and inter-dependencies concerning the geographical location of the transactions. The mean geographical coordinates (based on latitude and longitude of the postcodes) for transactions in one of three categories are shown as coloured circles. The three types of transaction pairs shown are: both Fridays (Fri), Fridays and another day in either order ({Fri, Oth}), and both on days other than Friday (Oth).
On the same panel 1D, we show the property transactions split into deciles by for the scores of a selected deprivation domain. We do this by mapping postcodes to LSOA11) to the corresponding deciles (determined in accordance with the process described above). We show the results for two deprivation domains: the ‘Health Deprivation and Disability’ in blue and the ‘Barriers to Housing and Services’ in brown. In each case the data for a decile is shown by a number in the relevant colour with ‘1’ representing the most deprived and ‘10’ the least deprived by the associated domain. As shown by the best fit lines, the dotted lines in the appropriate colour, the point-wise mutual information for these subset all lie close to these linear fits and there is a clear geographical correlation with the measures shown. This illustrates the so called ‘North-South divide’ within England with large conurbations in the Midlands and North West often linked to post-industrial activity while the South East of England is often seen as dominated by a service-driven economy.
Relationship between the behavioural house indicator
and other deprivation indices
In this section, we highlight the relationship between our Behavioural House Indicator
The English Index of Multiple Deprivation
The results in Figure 2 show that there is a significant and meaningful relationship between Relationship between the Behavioural House Indicator 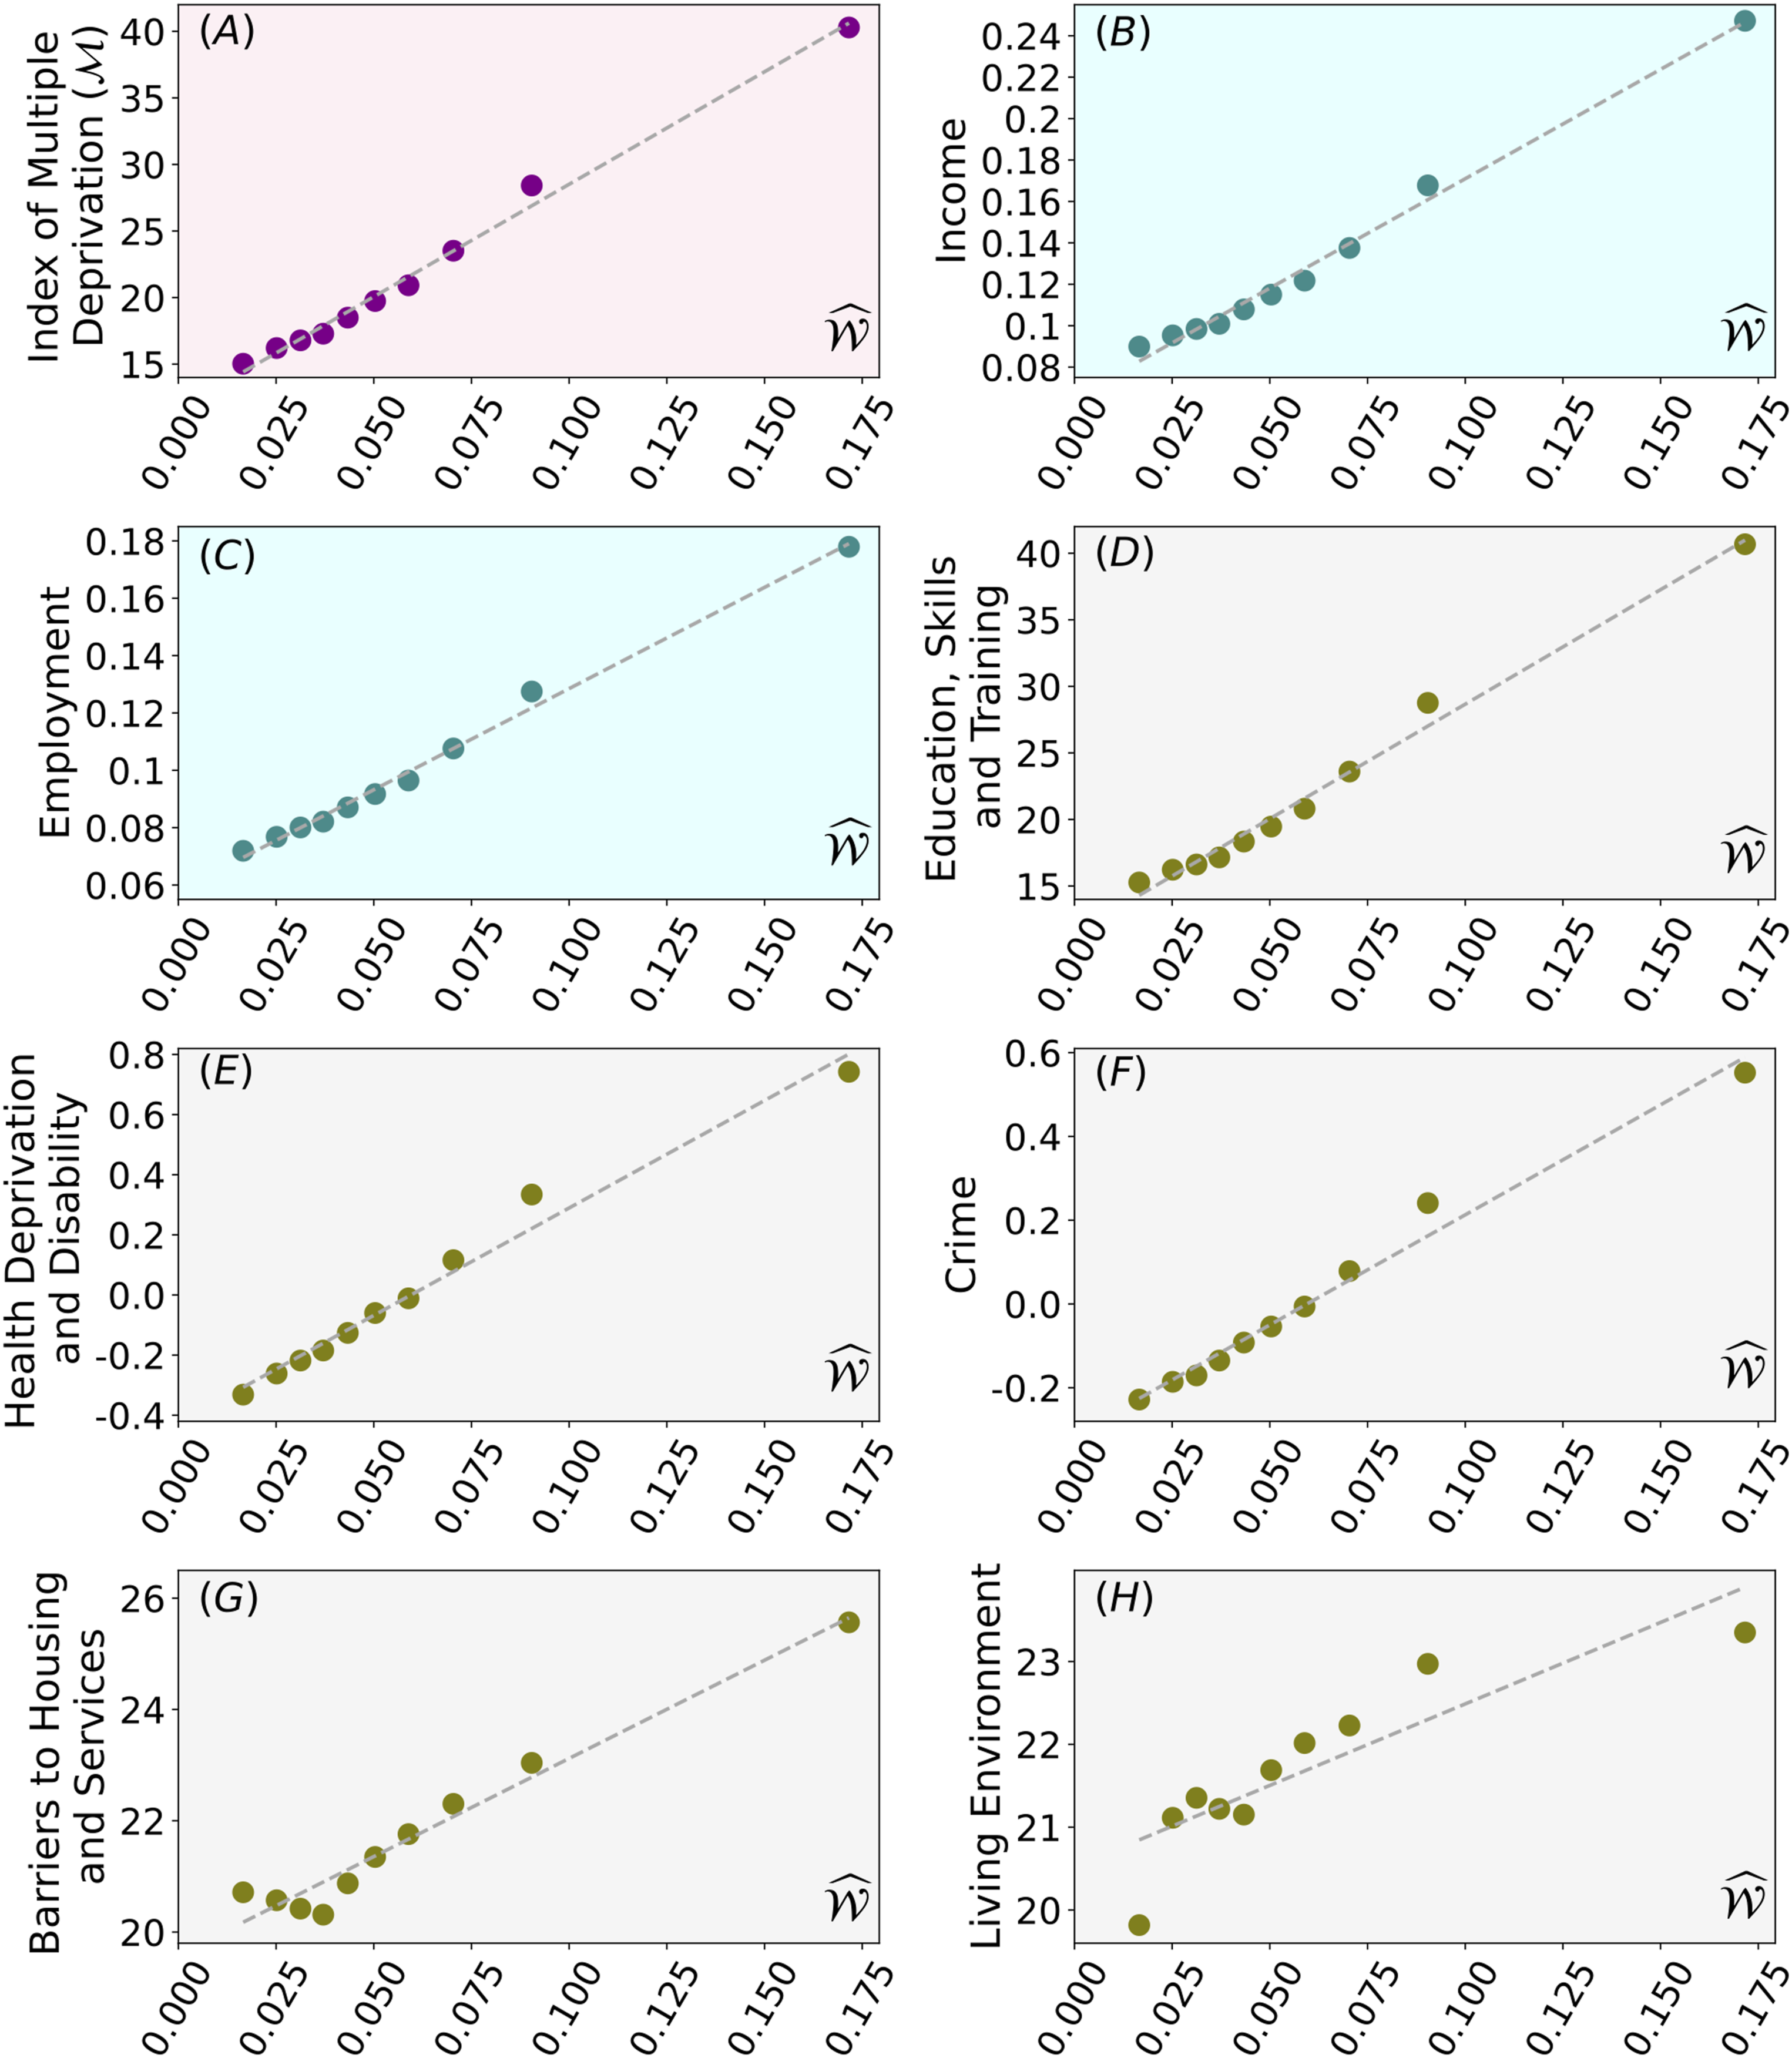
In order to substantiate the robustness of the relationship, in particular in relation to correlation and linear fitting, we also tested different combinations of bin sizes (not just the ten equal sized bins mentioned in section). We found that correlation levels are consistently high (unsurprisingly better when bin sizes and minimum data points increase) and the slope of the linear fitting remains largely stable regardless of the way we aggregate the data in plots of the type shown in Figure 2.
In addition, it is important to emphasise that these results also indicate a high correlation level among the seven domains in
The census 2021 ‘households by deprivation’ dimensions
As it can be observed in Figure 3, and similarly to the English Index of Multiple Deprivation Relationship between the Behavioural House Indicator 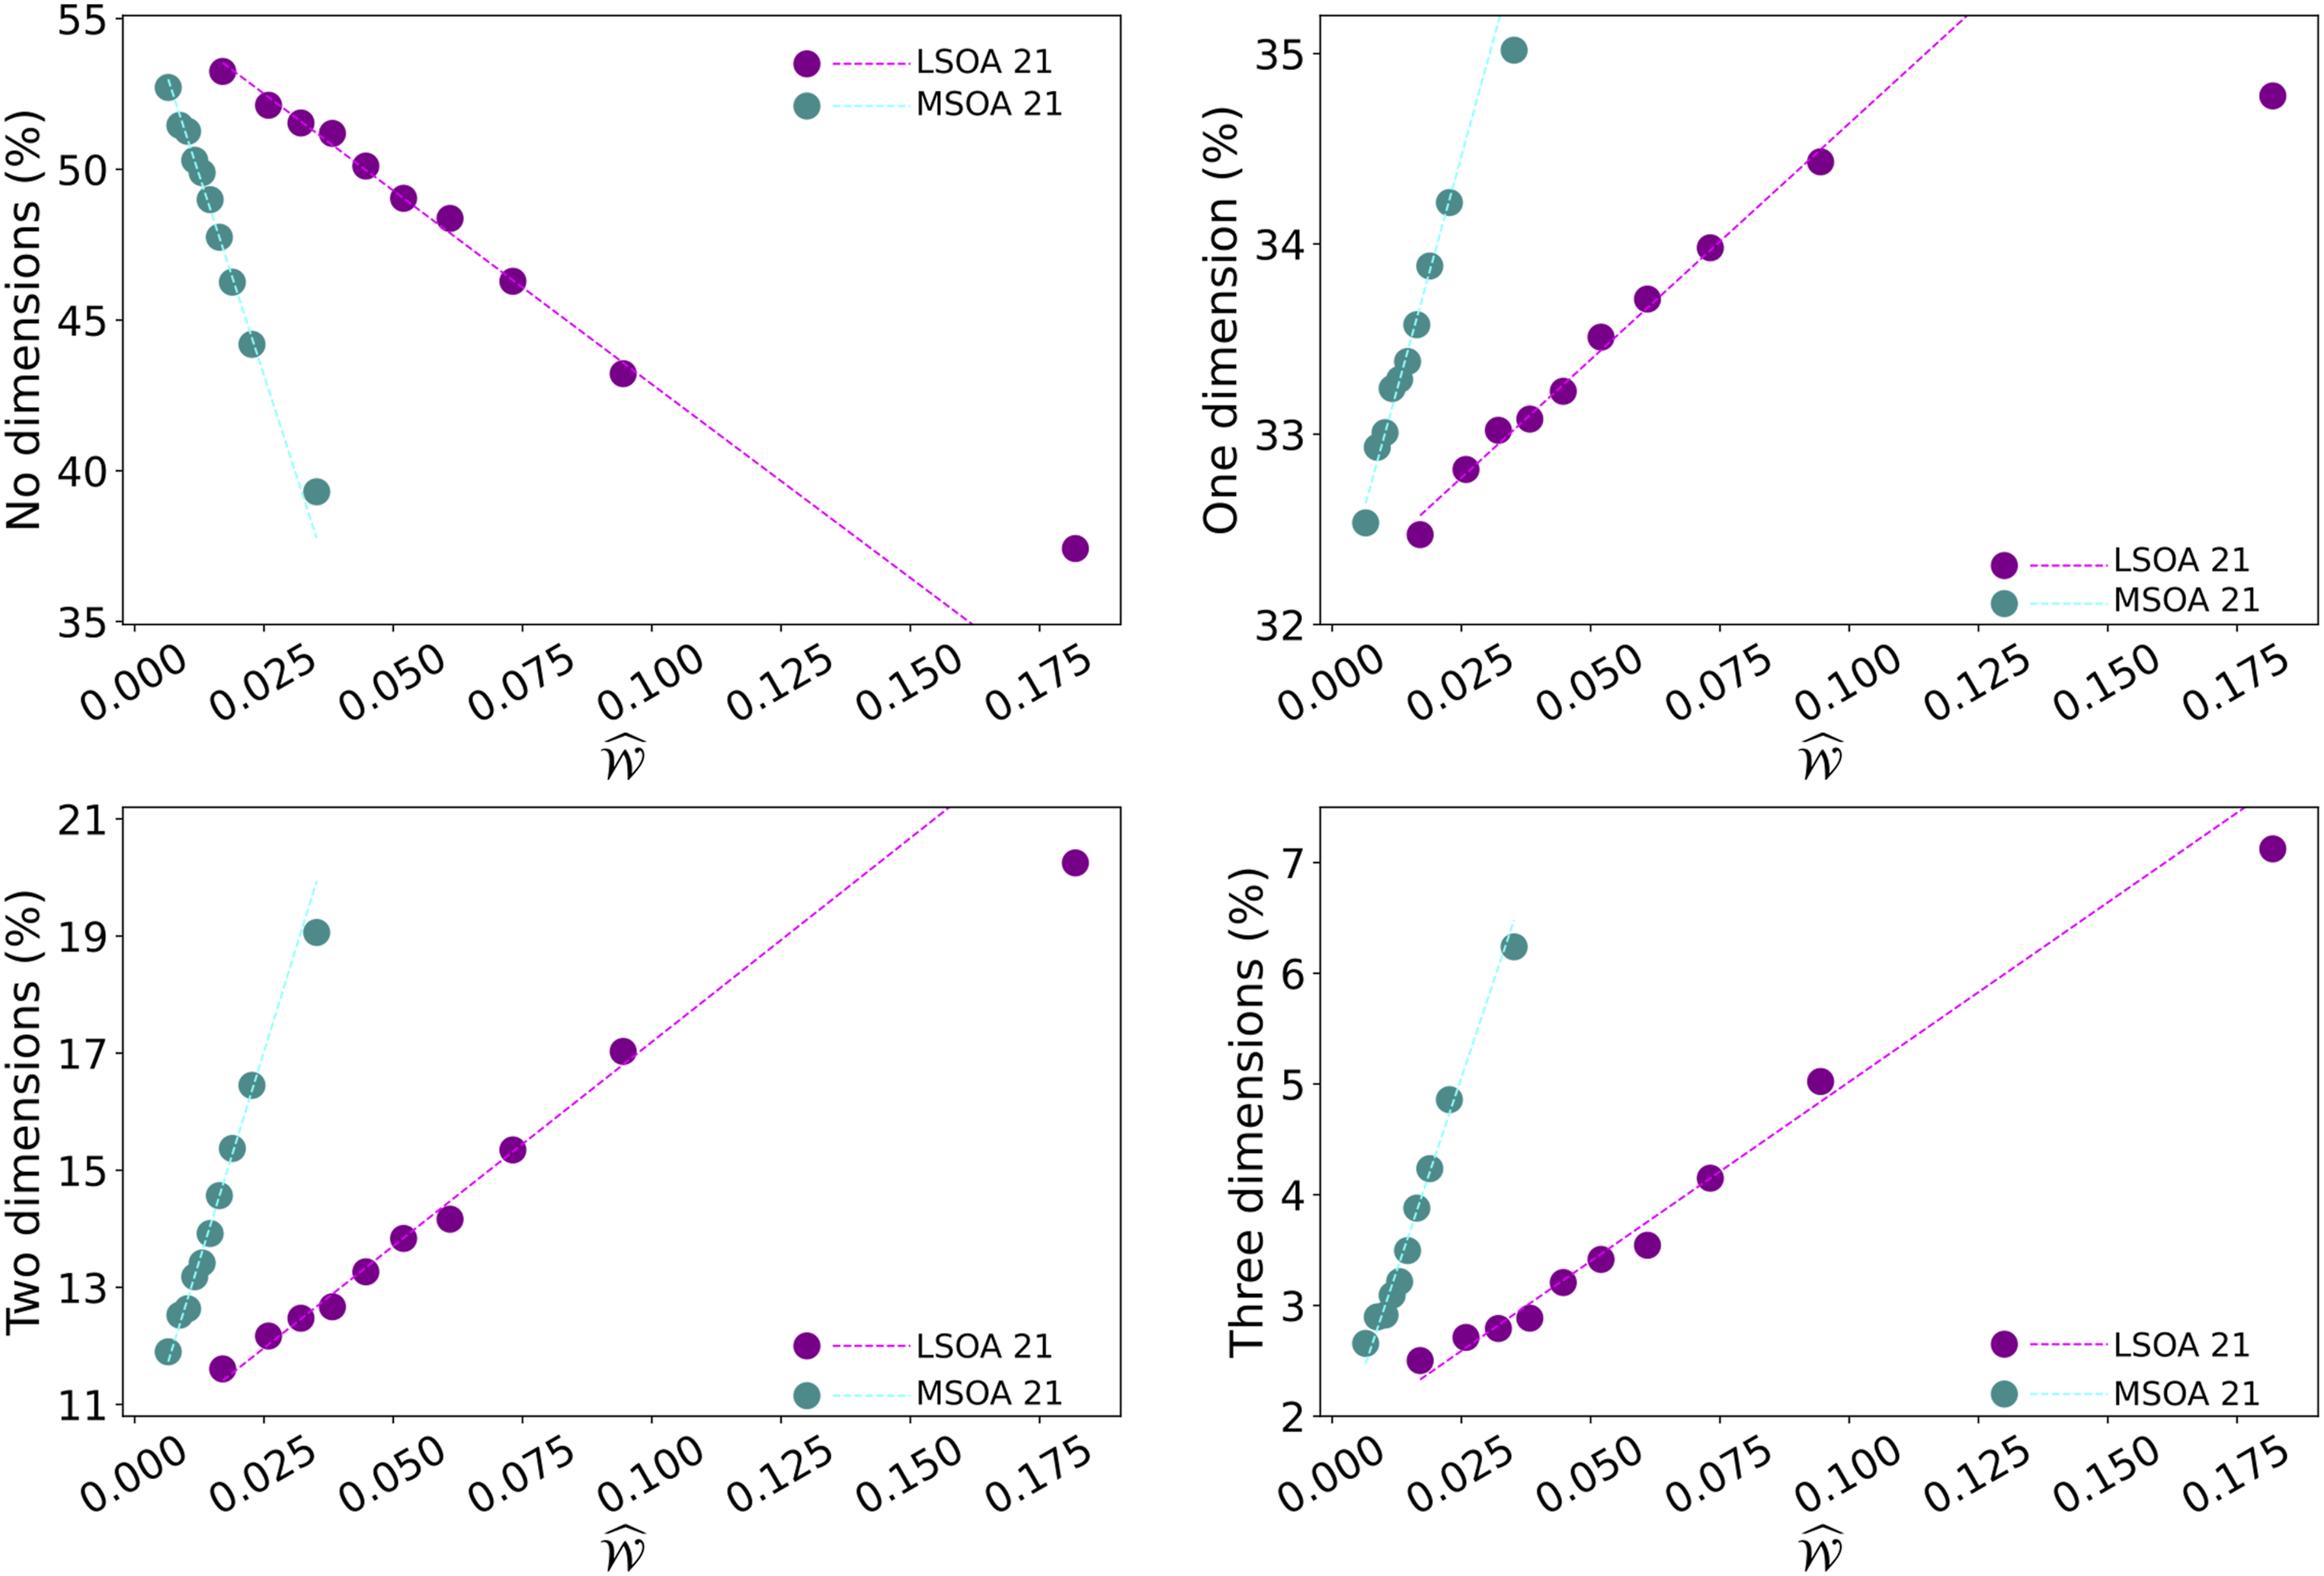
It is also important to note that
Whist the Census does not explicitly provide an index to deprivation, one can be easily derived by the ratio between the number of households with deprivation the total number of households. For the purposes of this research, we compute
Analysis of the most deprived LSOAs
Figure 4(A) shows there is a very good overlap of the most deprived LSOAs as measured by the three deprivation measures Relationship among most deprived deciles by the density categories of LSOAs. Panel A is a Venn diagram representation of the logical relation between the Behavioural House Indicator 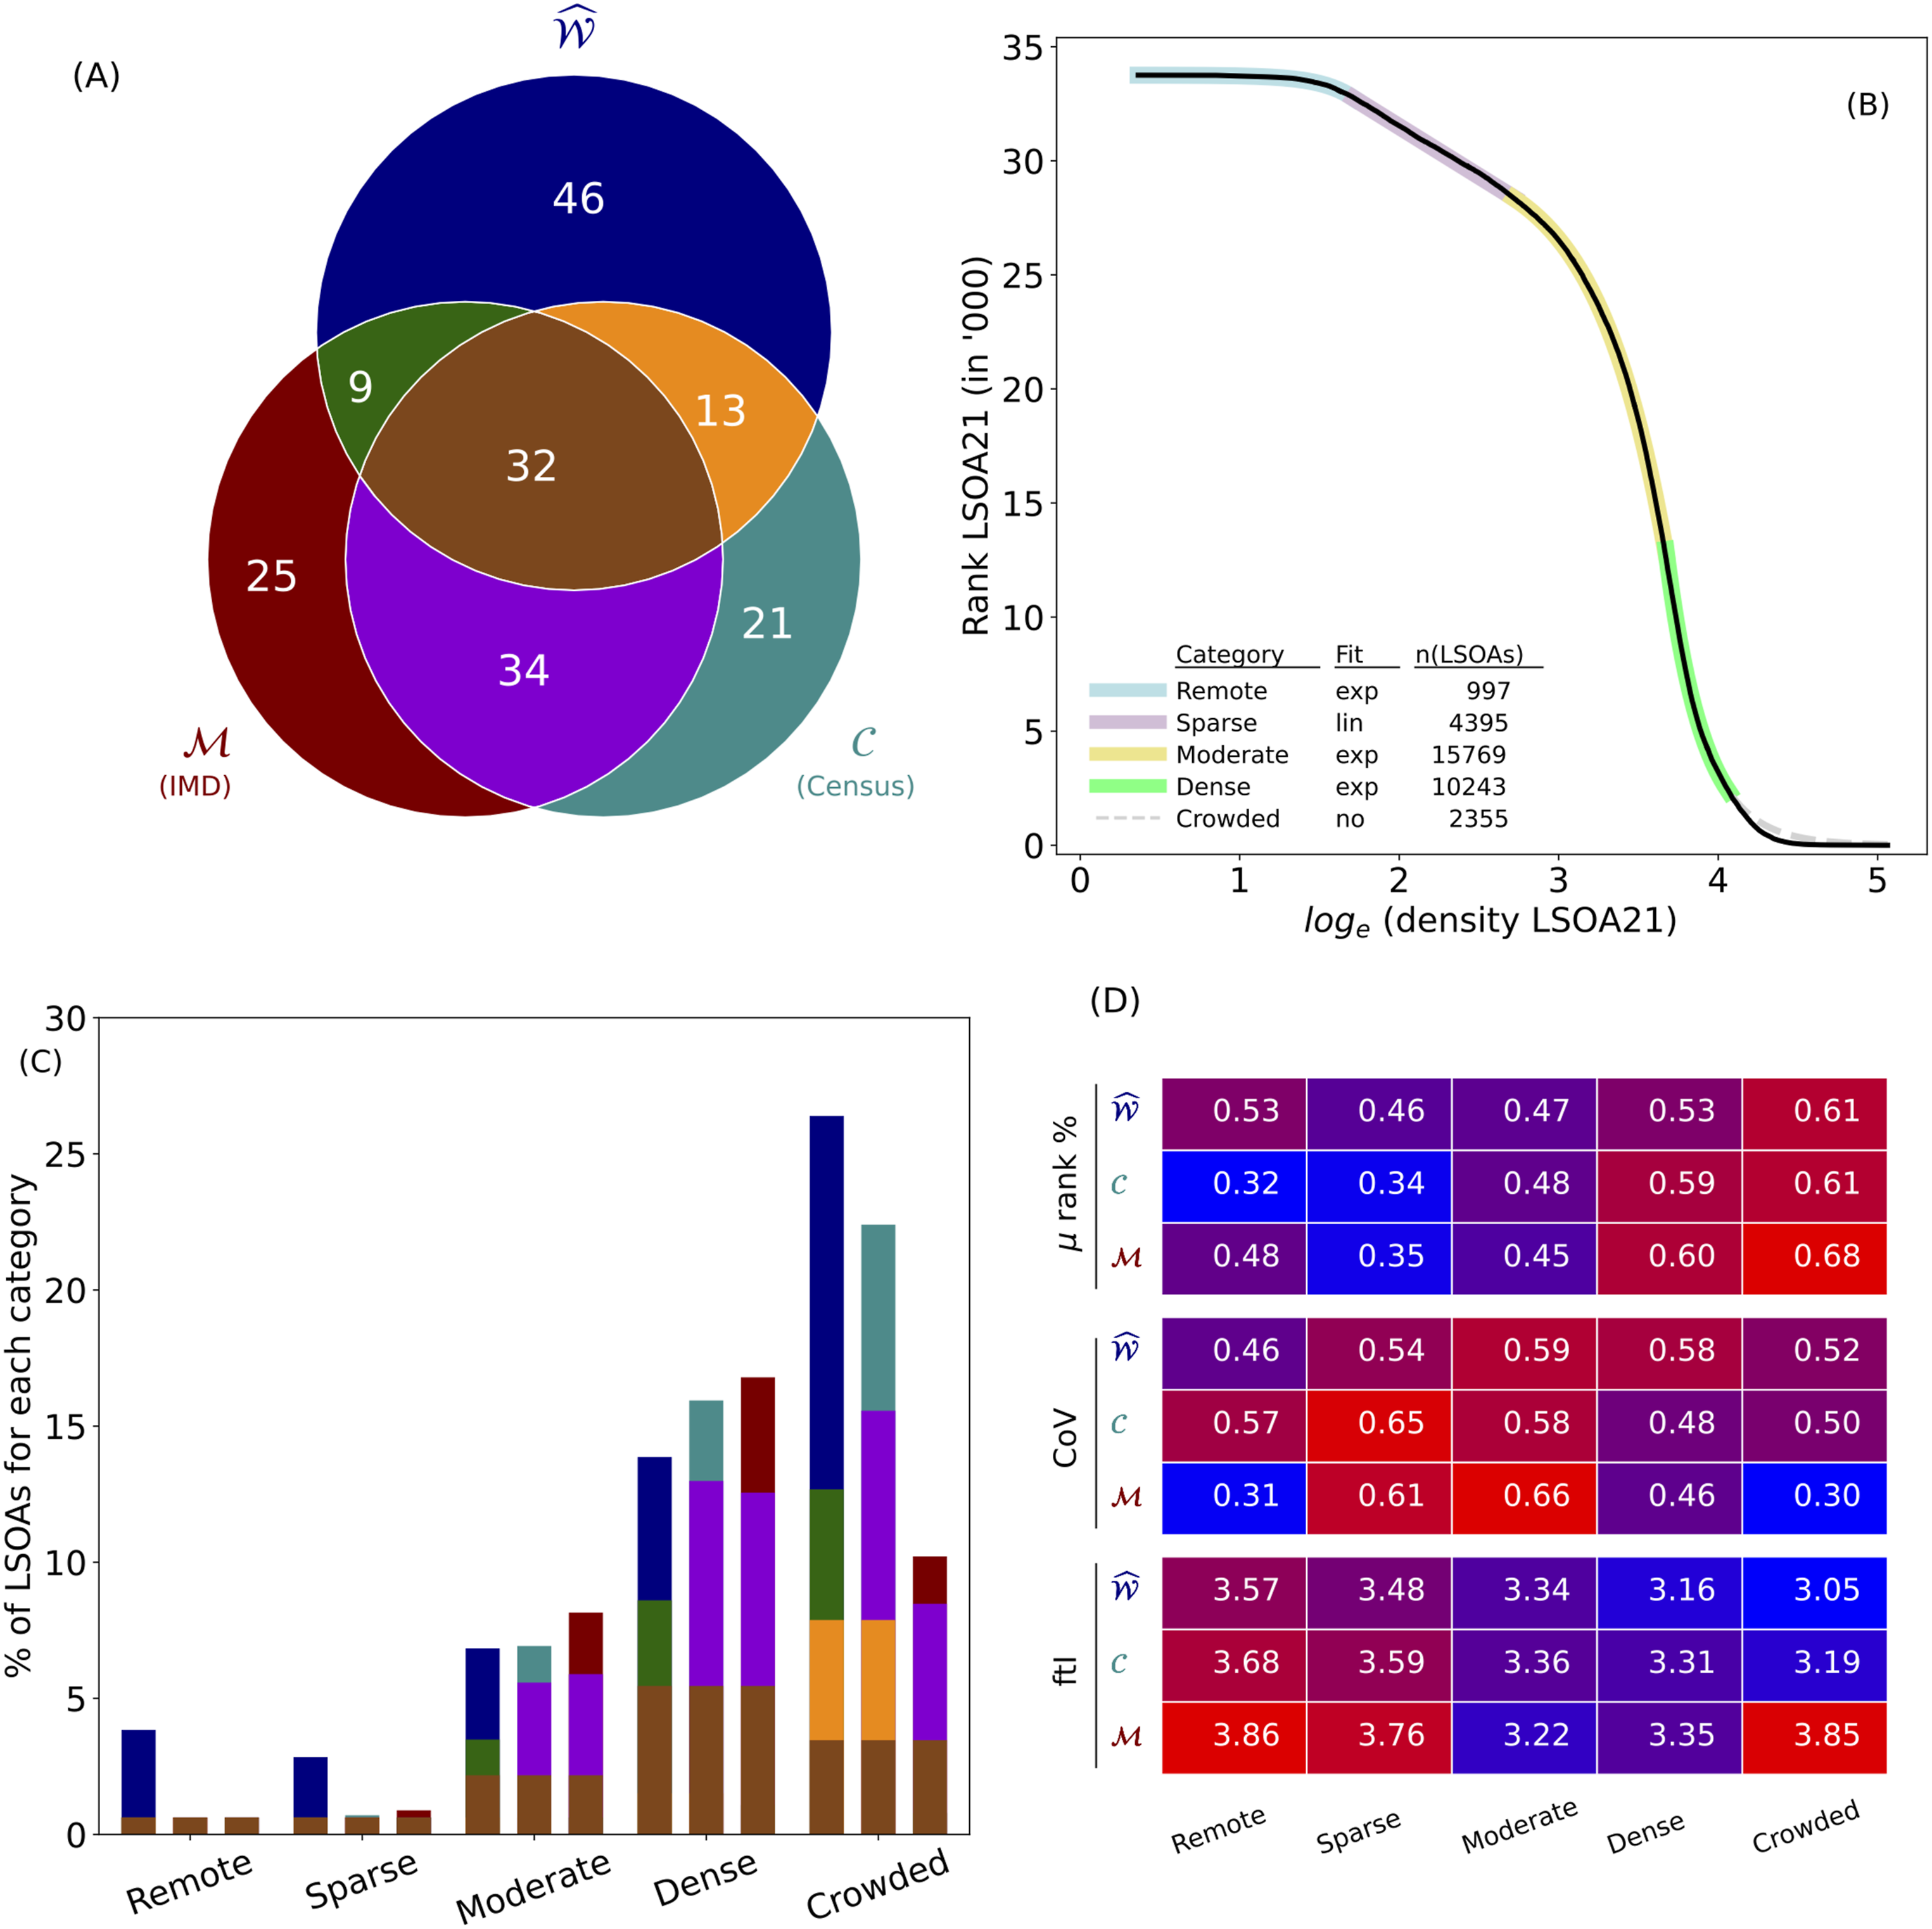
One can assert that the reason for the overlapping results to be so robust is the fact that there is a high level of correlation between the economic, social and environmental variables used by
Furthermore, additional insight and understanding can be obtained by the detailed analysis of the differences among the
Through this categorisation, we can make the following observations. Firstly,
Lastly,
Analysis of the remote and sparse areas
The remote and sparse areas account for 16% of the total number of LSOAs but 87% of the total area of England. Given these numbers, it is highly surprising that both Geographical distribution of 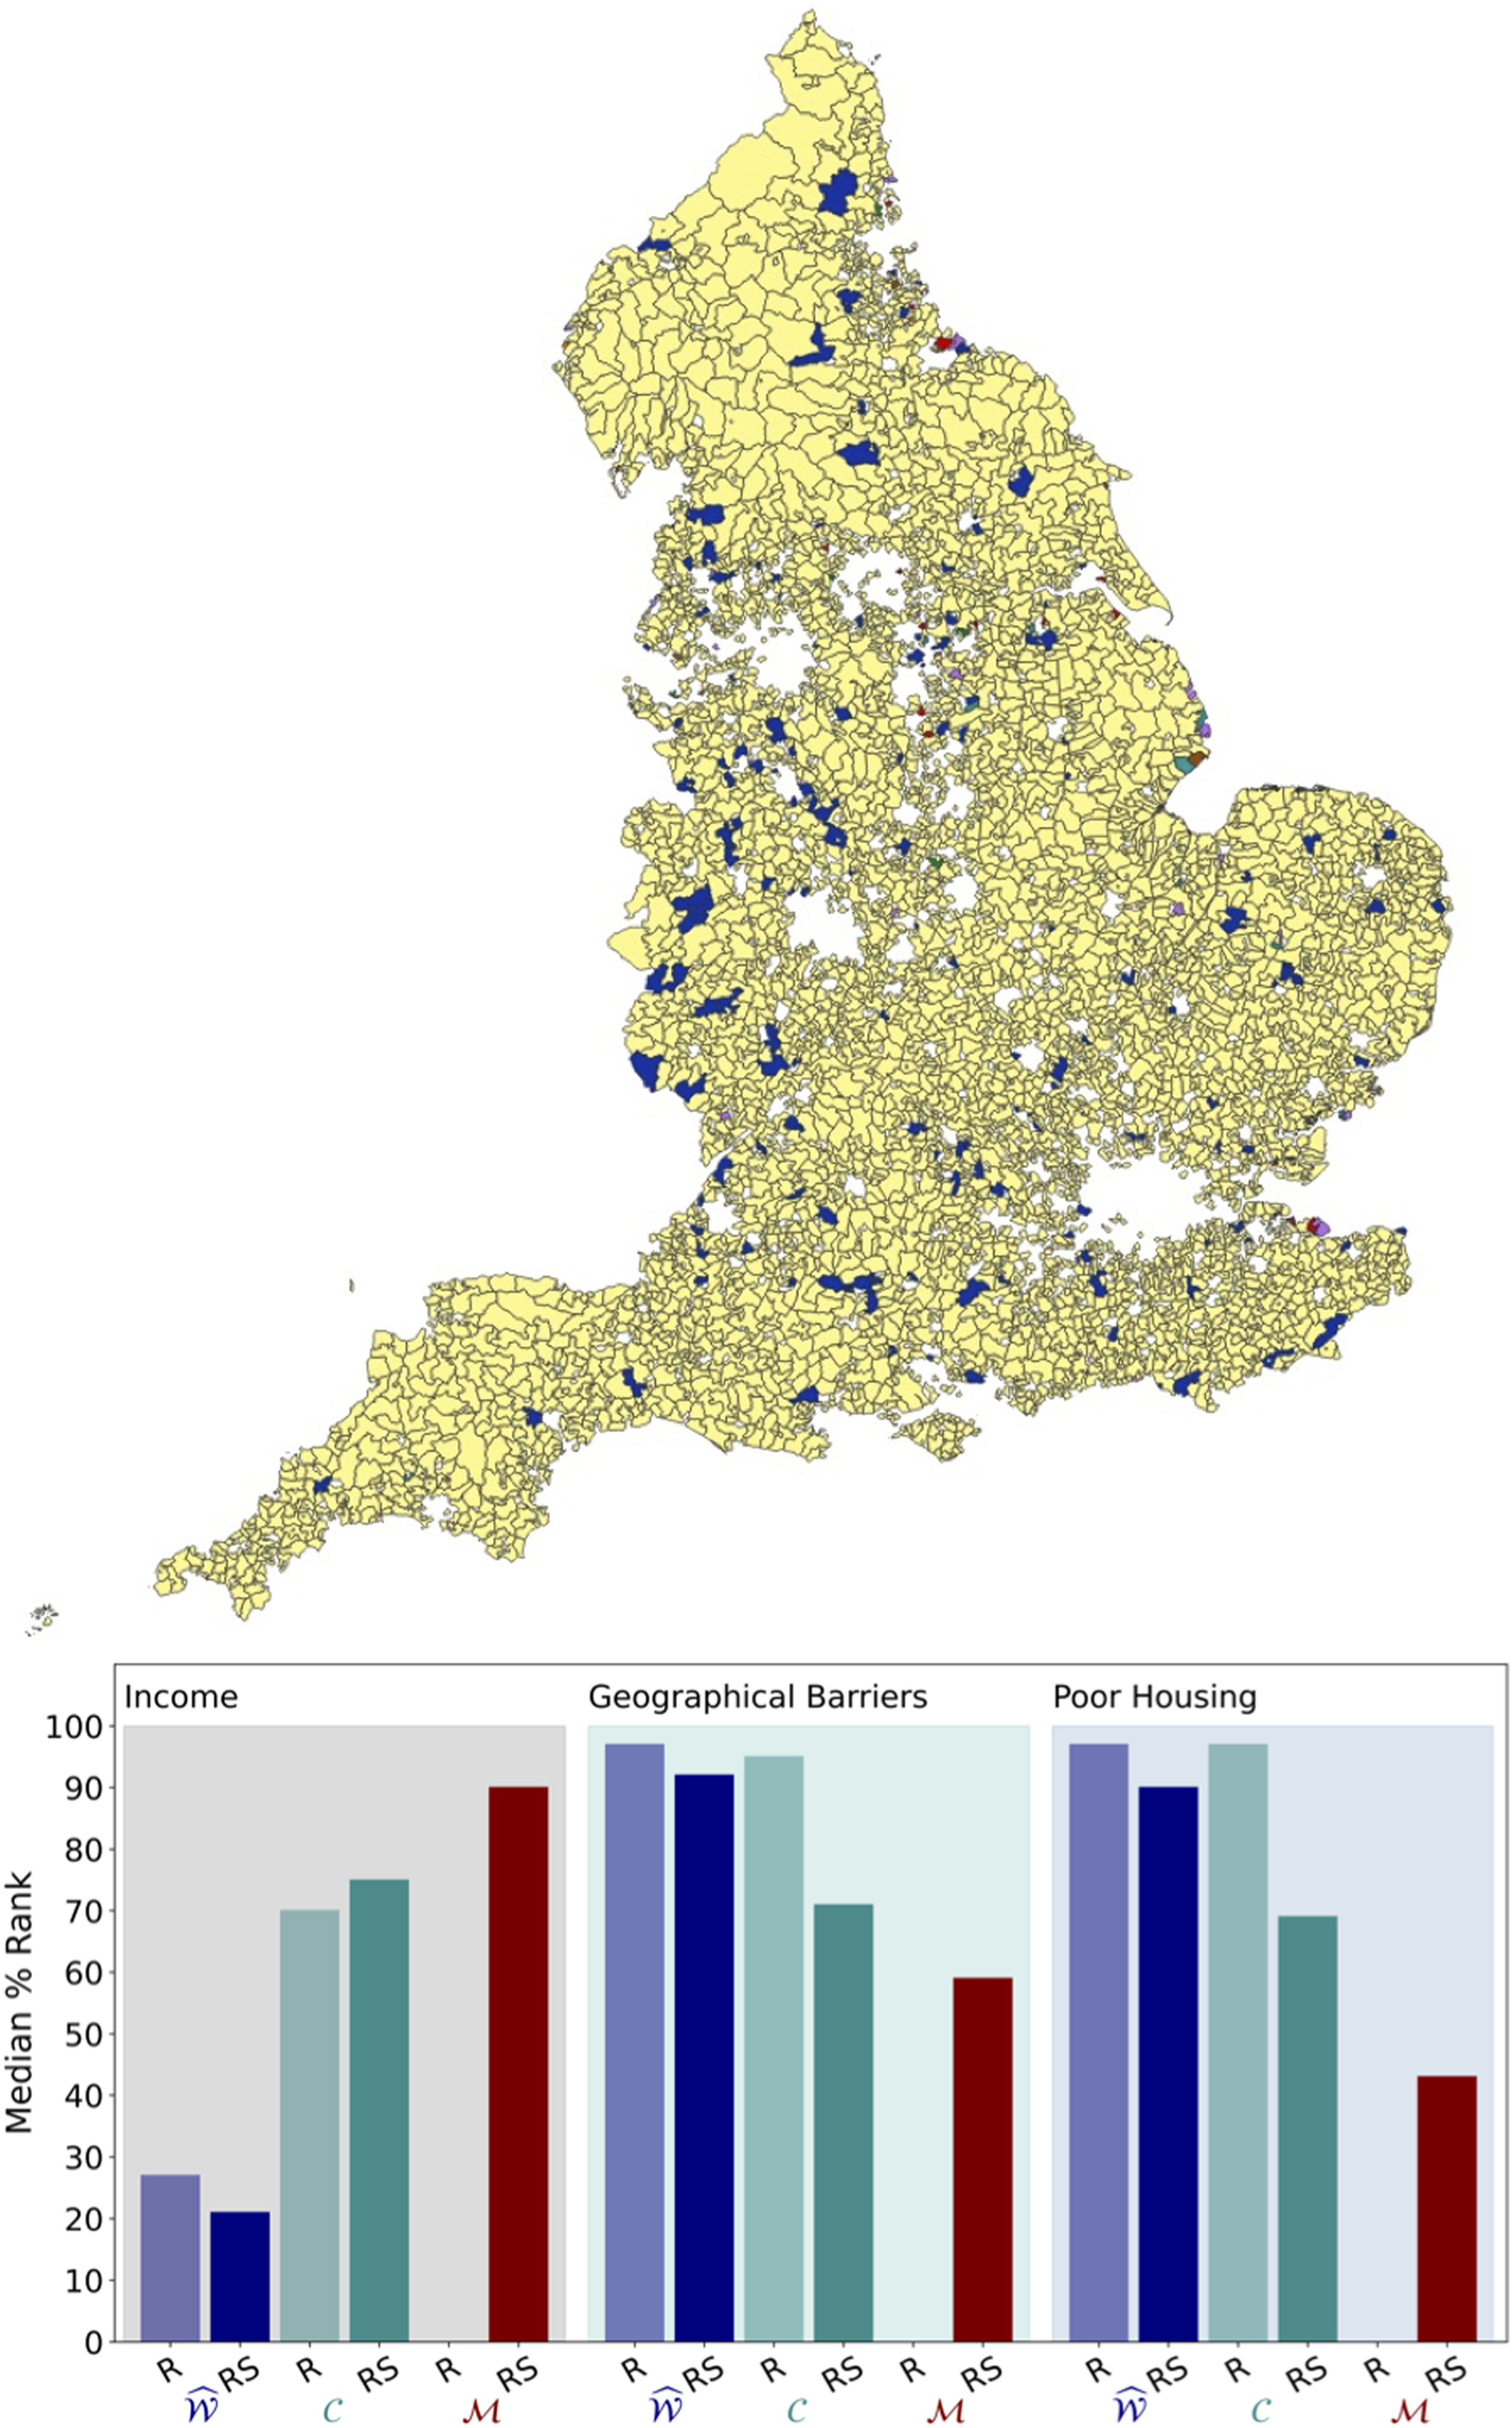
The existing bias against remote and sparse areas can be explained by the fact that
It is important to emphasise that we are not judging whether one index performs better than another, as this is a relative element and it will depend on usage. Here, we are solely emphasising the positive and negative bias of each index, and the impact to different areas of social and economic structure.
Analysis of the crowded and dense categories
Both our Behavioural House Indicator Geographical distribution of 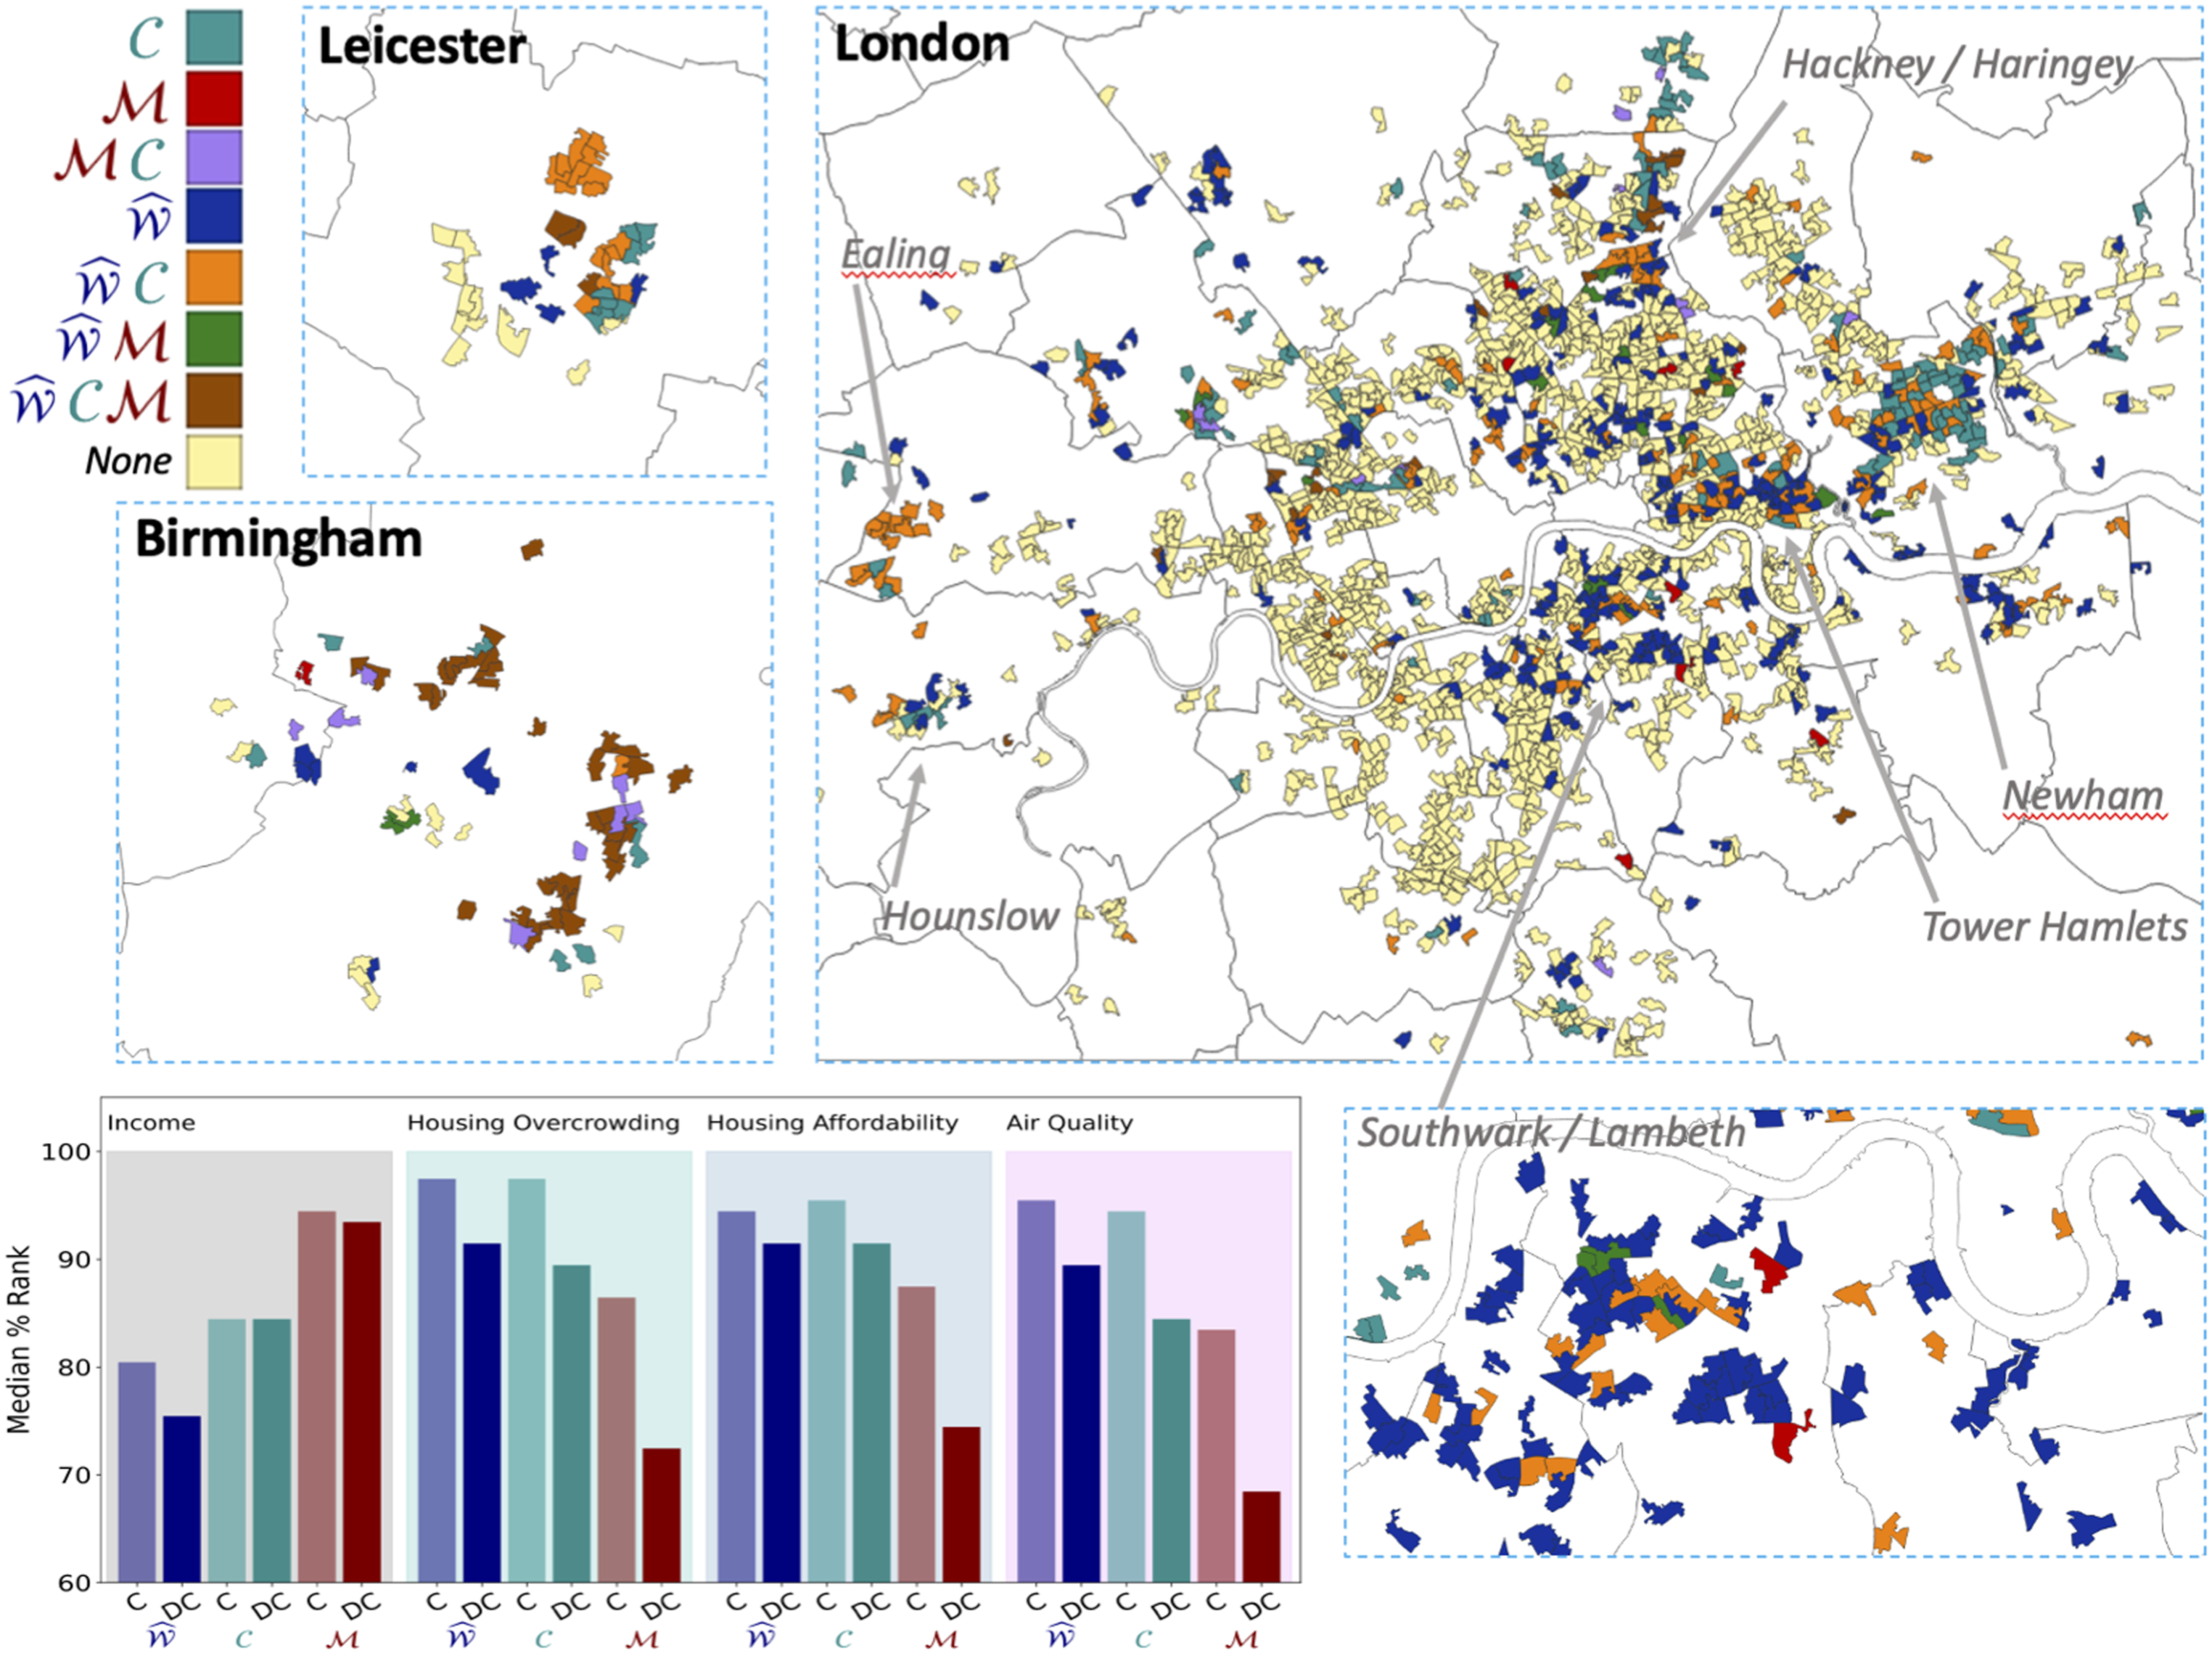
Similarly to the analysis for remote and sparse regions,
Here, we highlight the fundamental issue that tends to arise from monetary and economic measures such as the income and employment which is best encapsulated by the expression struggling to make ends meet. The population may be employed and have proportionally higher levels of income, and yet these factors are not enough to provide for basic needs as affordability (where housing plays a fundamental part) is extremely low. Therefore, we would argue that
Comparing and contrasting
Discussion
The observations made in our Results section above indicate that our proposed Behavioural House Indicator
Importantly, our results do not advocate for the replacement of any of the indexes above. Instead of we are able to show that each index performs well in different aspects of deprivation, a fact extensively researched in other recent papers (Lloyd et al., 2023b; Norman, 2015). We would argue that it is the combination of all these index that can provide a much richer picture both the levels of deprivation as well as the nature of deprivation. Indeed,
This is an important assertion given the existing speculation on scraping the census in 2031, and relying instead on a network of disparate public sector sources of data. Whereas our research shows that there is much to gain from making use of public sector sources of data as proxy to the existing economic and social measures, the authors do not agree with any potential initiative for entirely scrapping of the Census.
Having said the above, our comparative analysis together with other important recent research, poses a question as to whether
Our results also add some robust evidence to the finding of recent research on the issues surrounding the capture of deprivation in areas with large ethnic minorities (Lloyd et al., 2023a). Our proposed indicator improves the identification of these areas.
We also point out an important feature of
We also believe that the fact that the data is sourced independently from any economic and social data collection exercise to be of significant benefit for comparative analysis of performance and results, and potentially a source of quality control checks and balances. From a practical point of view, the ability to coordinate these potential checks and balances may be even easier now given that as recently as the June 2023, the sponsorship of HM Land Registry and its associated bodies moved from the Department for Business and Trade to the department of DLUHC (Department for Levelling Up, Housing and Communities). This essentially means data from the HM Land Registry and those of
Lastly, we would emphasise two specific limitations to our work. Firstly, we emphasise that we made use of the word Indicator instead of an Index to emphasise that this is a statistically and data driven method that is subject to some level of individual mis-classifications and errors due to either local level specific dynamics or insufficient statistical data (whether
Supplemental Material
Supplemental material - The behavioural house indicator: A faster and real time small-area deprivation measure for England
Supplemental Material for The behavioural house indicator: A faster and real time small-area deprivation measure for England by Eduardo Viegas and Tim S. Evans
Footnotes
Declaration of conflicting interests
The author(s) declared no potential conflicts of interest with respect to the research, authorship, and/or publication of this article.
Funding
The author(s) received no financial support for the research, authorship, and/or publication of this article.
Data Availability Statement
Supplemental Material
Supplemental material for this article is available online.
References
Supplementary Material
Please find the following supplemental material available below.
For Open Access articles published under a Creative Commons License, all supplemental material carries the same license as the article it is associated with.
For non-Open Access articles published, all supplemental material carries a non-exclusive license, and permission requests for re-use of supplemental material or any part of supplemental material shall be sent directly to the copyright owner as specified in the copyright notice associated with the article.