
Abstract
The rapid expansion of electric mobility and distributed renewable generation presents new operational challenges for low-voltage (LV) distribution networks, including increased evening peak demand, higher transformer utilization, and phase unbalance, particularly in emerging regions where options for reinforcement are constrained. This paper describes an open-source Python–OpenDSS framework that combines measured slow-charging profiles with Monte Carlo sampling of electric vehicle (EV) location, vehicle model, initial state of charge, and charging start time, with optional single-phase photovoltaic (PV) sized to offset annual customer demand. Each scenario is evaluated with 100 iterations, and 10-minute time-series power-flow simulations over a one-day (24 h) horizon are summarized using ensemble statistics (e.g., mean and selected percentiles). The framework is applied to a real 50 kVA urban LV feeder in Cuenca, Ecuador (62 residential customers), whose model was built from the utility GIS database and corroborated through an on-site inspection, under EV penetration levels of 5%, 10%, and 15% with EV-only and EV+PV configurations. For the range studied, steady-state voltages and voltage unbalance remain within typical LV compatibility limits, while transformer utilization increases from about 59% in the baseline to around 90% at 15% EV penetration. Co-located PV reduces the net daily energy exchanged with the upstream network but has limited impact on evening transformer peaks. A 7-day extension of the 15% EV scenario is included to illustrate multi-day studies using the same workflow.
Keywords
Introduction
Electric transport is expanding as battery costs decline, policy incentives spread, and charging infrastructure develops. Electric vehicles (EVs) are being adopted in both high-income and emerging economies, supported by national programs and municipal initiatives. Recent assessments by the International Energy Agency report a global EV stock exceeding 40 million units in 2024, with continued growth expected through 2030 (International Energy Agency, 2024). Infrastructure planning literature reflects this expansion and stresses the importance of context-specific metrics and definitions, with global syntheses reporting wide variability in assumed charger utilization and a need for evidence in underrepresented regions such as Latin America (Xylia et al., 2025). Regional works address location and sizing from multiple angles: multi-criteria GIS methods for public chargers and substation capacity reserves in Cuenca, Ecuador (Chumbi et al., 2024), evolutionary multi-objective placement integrated with mobility simulation for urban stands (Utreras and Armas, 2023), interurban fast-charging layout based on maximum distance between charges validated in simulation (Buenaño et al., 2023), and GIS, expert-based siting that incorporates urban risks in Costa et al. (2019). In parallel, feasibility analyses of PV-powered charging underscore how local resource and cost conditions shape economic outcomes (Buestan-Morales et al., 2024). Although adoption remains concentrated in regions with mature e-mobility ecosystems, Latin American countries—Ecuador among them—show steady uptake supported by pilot projects and institutional fleets; recent reviews also point to limited availability of public, high-resolution data for the region (Morejón-Monteros et al., 2024(@).
Integrating EVs into distribution networks introduces technical and operational challenges that are most visible at the low-voltage (LV) level, where residential and small commercial charging occurs. Slow charging during early adoption reshapes demand profiles, elevates evening peaks, stresses distribution transformers, and affects power quality through voltage deviations and phase unbalance. Measurements and datasets indicate that charging behavior and on-board charger designs vary across vehicle models, with implications for power factor, harmonic content, and susceptibility to voltage fluctuations (Ziyat et al., 2023). Surveys and case studies summarize mechanisms and typical ranges of harmonics and supraharmonics during charging and discuss mitigation measures such as power factor correction and filtering (Qin et al., 2022; Rajeshwari et al., 2025). Reviews focused on combined renewable–EV integration further document interactions among converter-driven effects, unbalance, and voltage profiles (Saritha and Manitha, 2022). These impacts are assessed against established limits, including the allowable steady-state voltage range in IEC 60038 and VUF guidance in IEC 61000-3-13 (International Electrotechnical Commission, 2009, 2015).
Distributed photovoltaic (PV) generation adds further interactions. Daytime PV output can reduce midday loading and, under some conditions, alleviate voltage drops. At the same time, irradiance variability and inverter control dynamics can introduce voltage fluctuations, while widespread single-phase connections may increase unbalance. Studies that vary joint EV–PV penetration in LV networks report non-monotonic outcomes: some combinations mitigate worst-case indicators whereas extreme one-sided penetrations (all-EV or all-PV) can produce the largest deviations (Dubravac et al., 2023). PV-powered charging stations can support local supply during daylight hours, though the net benefit depends on resource seasonality, charger power levels, and storage economics (Buestan-Morales et al., 2024). In feeders where evening EV charging dominates, the temporal mismatch between PV production and charging demand limits relief during peak periods, which motivates time-resolved analysis.
Prior studies examine EV and PV impacts with a range of modeling approaches. For example, Monte Carlo assignment combined with time-series power flows has been used to mix smart-meter demand with sampled EV charging and PV generation to study reliability and economic indicators in residential networks; (Vorapojpisut et al., 2023) however, such studies often prioritize aggregate indicators and may not incorporate measured, vehicle-specific slow-charging traces or provide an end-to-end workflow that can be reproduced and adapted to local feeders. Control-oriented work explores decentralized voltage regulation that coordinates EV flexibility with PV reactive and active power actions to reduce curtailment while meeting charging requirements; (Wang et al., 2022) these formulations, by design, focus on managed flexibility and do not target early-adoption conditions dominated by dispersed household slow charging with uncertain start times. At the facility and network interface, simulation-based analyses describe charger operation, control strategies, and mitigation measures, and evaluate how integration choices affect performance and grid interactions; (Diaz et al., 2024) yet they do not typically resolve customer-level EV allocation within a detailed LV feeder model. In parallel, regional planning studies emphasize siting and sizing of public infrastructure, but they generally require a separate coupling to LV time-series analysis to quantify feeder-level voltage behavior, unbalance, and transformer loading. Buenaño et al. (2023); Chumbi et al. (2024); Costa et al. (2019); Utreras and Armas (2023) These gaps are more pronounced in Latin American settings, where feeder characteristics, codes, and data availability differ from contexts where many benchmark datasets originate. Morejón-Monteros et al. (2024(@) Table 1 summarizes representative directions in the literature and the planning-oriented gap addressed in this work.
Synthesis of representative EV/PV impact studies and the planning-oriented gap addressed by the proposed framework.
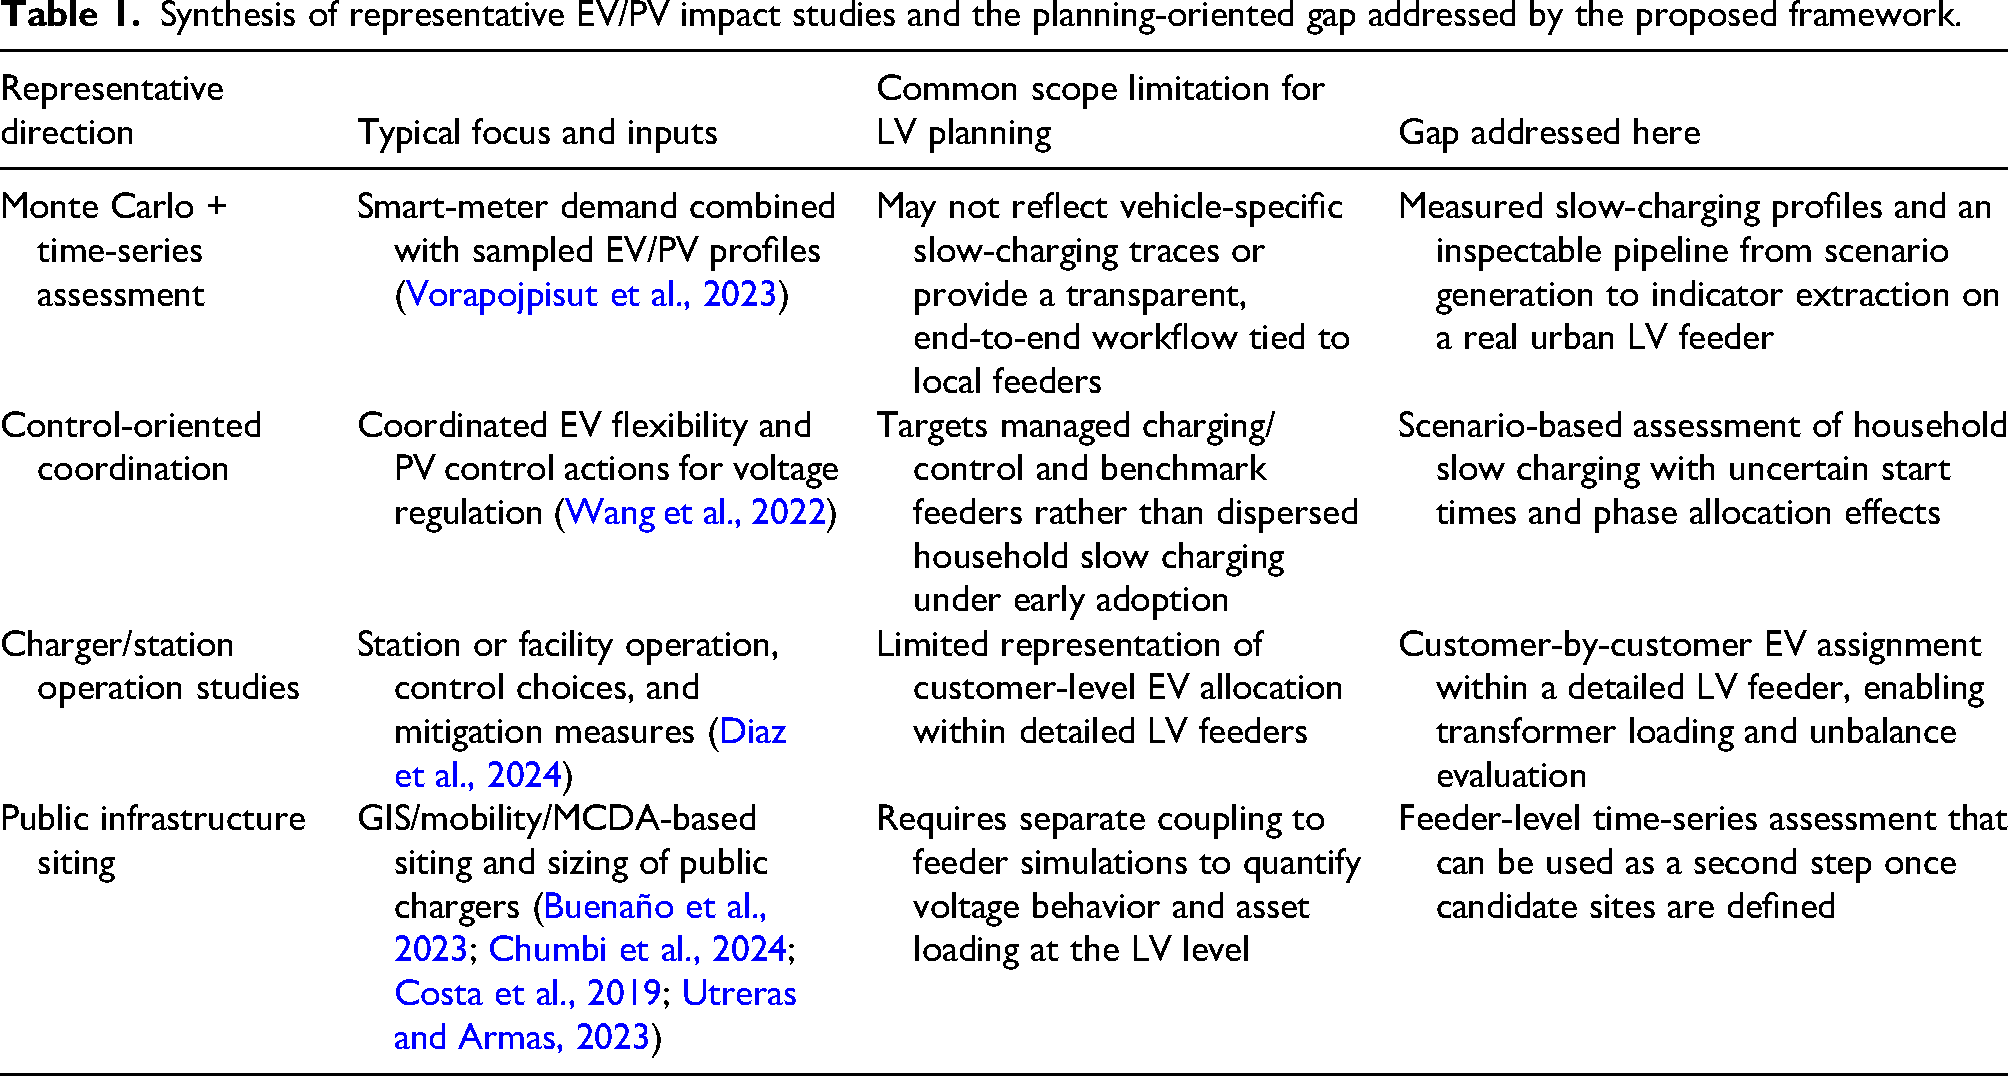
Synthesis of representative EV/PV impact studies and the planning-oriented gap addressed by the proposed framework.
This study develops an open-source simulation framework in Python that (i) uses a Monte Carlo procedure to assign EV charging behavior across LV customers (location, vehicle model, initial state of charge, and start time), (ii) optionally deploys distributed PV systems among users to examine combined interactions, and (iii) performs 10-minute resolution time-series power flows in OpenDSS to extract voltage profiles, voltage unbalance, and transformer loading (Dugan and McDermott, 2022). The workflow is tailored to planning studies where residential charging is geographically dispersed and timing is uncertain; public fast-charging hubs are treated as point installations and are therefore outside the present scope. The case study reports penetrations up to 15% as an upper-bound stress test for the current urban context, while the framework itself accepts any penetration level up to full adoption if required by the study. All input time series are aggregated to 144 intervals per day (24 h
The contributions are threefold:
A reproducible Python–OpenDSS workflow that links measured EV charging curves (vehicle-specific slow-charging traces) with stochastic user allocation to generate spatially disaggregated demand scenarios. A unified assessment of voltage deviation, voltage unbalance (VUF), and transformer loading under EV-only and EV+PV conditions. A case study grounded in a Latin American LV feeder, intended to reflect typical conductor sizes, transformer ratings, and single-phase connection practices in the region.
The remainder of the article describes the framework, the case study and simulation scenarios, and the main findings on network performance under increasing EV penetration with and without distributed PV. A discussion follows with planning implications and options for extending the tool to managed charging and additional DER configurations.
Scope statement
The scope of the study is intentionally bounded to support reproducibility while using empirical inputs available for the case study feeder. The analysis considers a single representative LV feeder in Cuenca, Ecuador, and evaluates a one-day horizon with a 10-minute quasi-static time-series power-flow (144 steps), which supports the assessment of transformer loading, voltage deviation, and voltage unbalance trends over the day. The scenarios focus on slow single-phase residential charging (Mode 2) using measured charging profiles from two commercial EV models, with stochastic allocation of EVs and (when applicable) co-located rooftop PV systems sized for annual energy compensation. The EV behavioral patterns are represented through discrete connection-time distributions and sampled initial state of charge values, and the Monte Carlo engine generates an ensemble of realizations to capture variability in user allocation and daily charging conditions. The study does not model harmonics, supraharmonics, or transient phenomena, and it does not attempt IEC-compliant flicker assessment at the adopted 10-minute resolution; analyses that require sub-minute voltage fluctuation information (e.g., flicker indices computed from standardized flickermeter processing) are reserved for dedicated follow-on work using higher-rate voltage data. The conclusions should therefore be interpreted within these boundaries, and extensions to multi-day horizons, weekday-specific connection patterns, higher-power charging, different PV clustering assumptions, and alternative load compositions can be implemented within the same workflow as the corresponding datasets become available.
Python-based calculation tool
The framework is implemented in Python and organized as four modules that interact through well-defined inputs and outputs. Figure 1 outlines the process from data ingestion to time-series simulation and metric extraction, and Table 2 summarizes the modules. To define the injections passed to the simulator, the active and reactive powers at each node

Workflow of the Python–OpenDSS framework.
Software modules, inputs, and outputs.

Module 1: Data import
Input datasets include: (i) measured EV slow-charging profiles, originally sampled at 1 min and aggregated to 10-minute intervals; (ii) optional PV generation profiles derived from local monitoring systems or typical meteorological year (TMY) data, scaled by installed capacities and resampled accordingly; (iii) network topology and component parameters including lines, transformer, and user connections; and (iv) baseline demand series per customer. All time series are standardized to 144 time steps per day (24 h
Module 2: Monte Carlo scenario generation
For each penetration level
The EV power trace for user

Module 3: OpenDSS time-series simulation
Scenario injections (1) are passed to OpenDSS through the COM interface (Dugan and McDermott, 2022). The solver runs a 24 h horizon at ten-minute resolution. The time-series simulation is executed once per Monte Carlo iteration
Module 4: Results processing and visualization
Post-processing aggregates indicators and prepares comparisons across scenarios. For each penetration level, the reported metrics are computed over the full set of 
The case study considers a representative LV feeder in Cuenca, Ecuador (Figure 2 and Table 3). The feeder corresponds to an existing urban LV circuit used as the testbed for the proposed workflow. A pole-mounted 50 kVA transformer at
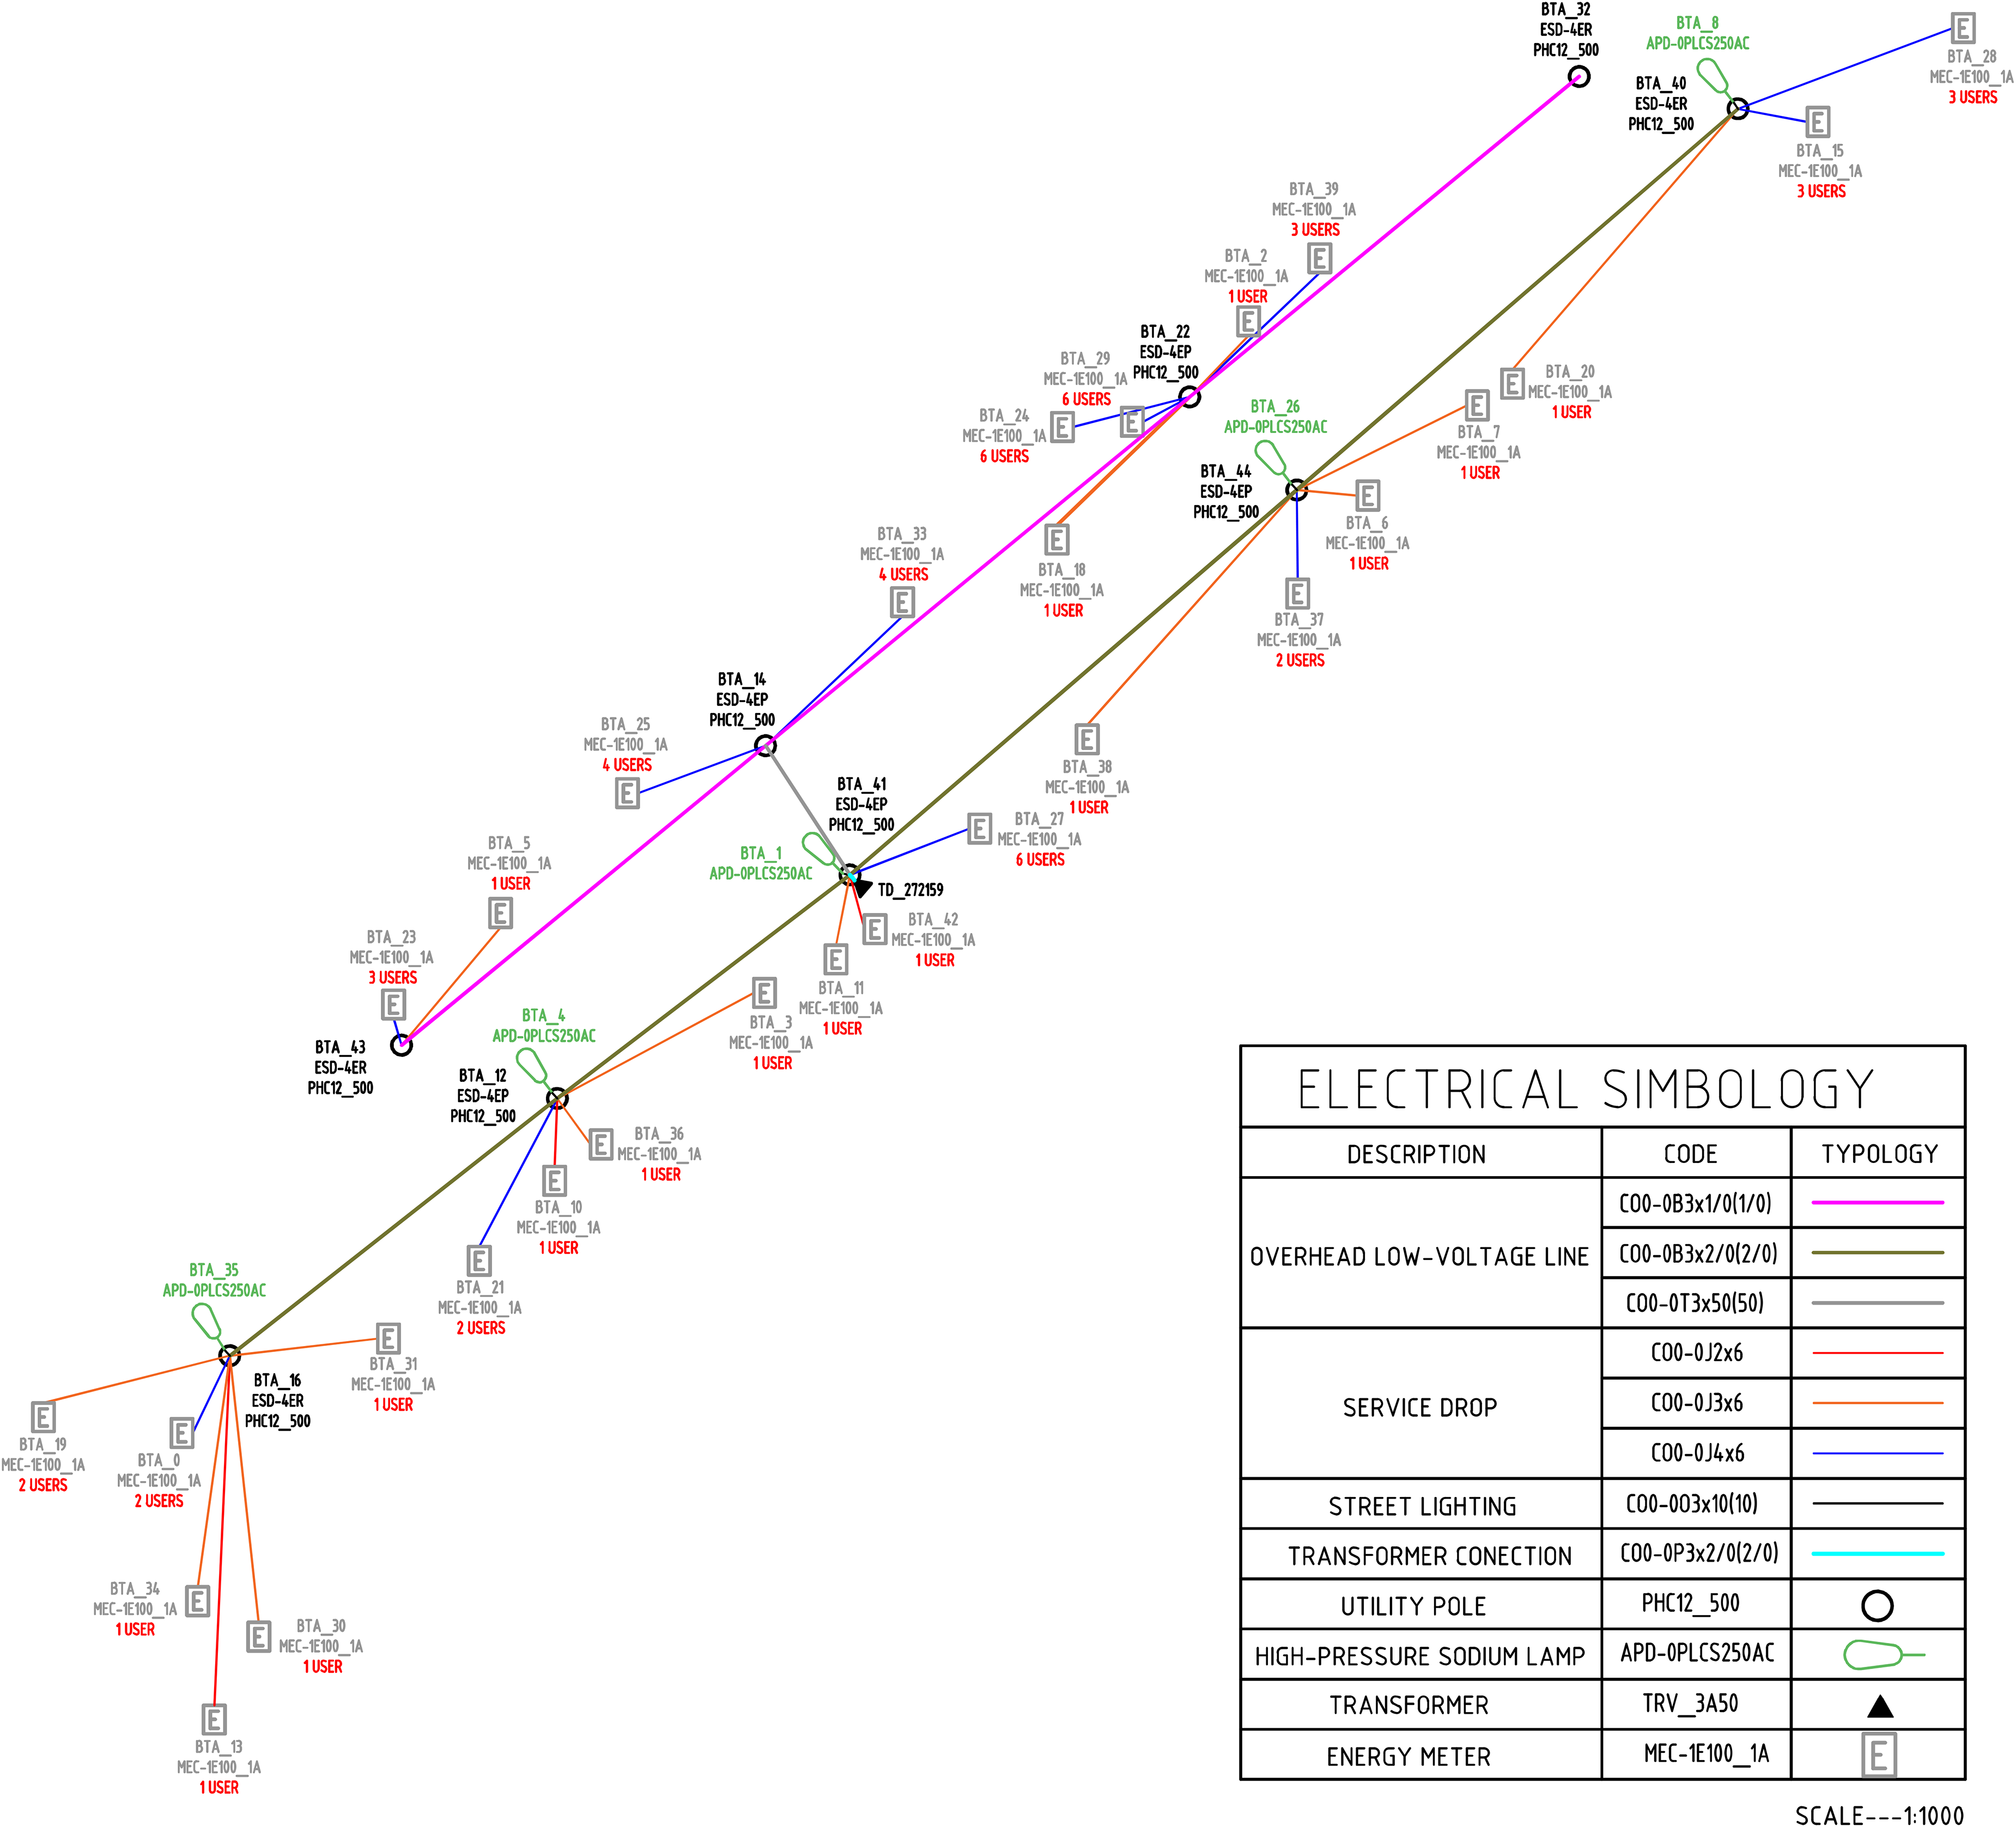
Distribution system under study. The map highlights the pole-mounted 50 kVA transformer, LV lines, and customer connection points. Approximate geographic coordinates (WGS84):
Feeder and dataset summary (including monte carlo setup and feeder model verification).

Two commercial EVs (BYD T3, Kia Soul) were characterized under single-phase AC charging in the Universidad de Cuenca Microgrid Laboratory (Ochoa-Correa et al., 2025). The BYD T3 operates at a nominal charging power of 3.3 kW (Mode 2), while the Kia Soul reaches up to 6 kW under similar conditions. Power was logged at 1-minute resolution and aggregated to 10-minute intervals (144 steps/day) for simulation (Figure 3). These measured, vehicle-specific charging traces are used as direct inputs to the scenario generation process, and the resampling step aligns them with the 10-minute simulation resolution.

Visual summary of the EV models used. From left to right: photographs of the BYD T3 and Kia Soul units in the Microgrid Laboratory; 10-minute aggregated slow-charging profiles of each vehicle as recorded during real operation. (a) Photo panel (BYD T3, Kia Soul), (b) BYD T3 slow-charging profile and (c) Kia Soul slow-charging profile
For context, Figure 4 presents a typical daily residential demand profile at the supplying primary feeder, while Figure 5 shows a representative local irradiance curve derived from annual measurements in the study area (Villa-Ávila et al., 2024). In Figure 4, eight demand classes summarize the diversity of residential behavior over a 24 h period, based on actual measurements conducted on the LV network under study. The class labels, ordered from 1 to 8, indicate their relative representativeness within the population of 62 residential users. Class 1 shows low daytime consumption with a pronounced evening peak, typical of households that remain unoccupied during working hours. Class 2 maintains a more continuous average demand with both morning and evening peaks, representing homes with partial daytime activity. Class 3 exhibits a steadier profile with slightly higher average consumption, associated with dwellings that have more constant use. Class 4 shows higher demand during daytime hours, suggesting residences with greater activity throughout the day. Class 5 resembles class 1 but with stronger nighttime demand, linked to families with more intense evening use. Class 6 corresponds to households with high and nearly constant demand, possibly due to large or automated equipment. Class 7 represents the lowest and most stable consumption level, typical of dwellings with few occupants. Finally, class 8 corresponds to a 12-hour stepped profile associated with public lighting. Together, the measured demand classes, the local irradiance profile, and the real feeder model ground the scenarios in observed urban operating conditions; the resulting indicators therefore reflect the inputs and assumptions documented in the methodology.

Typical daily residential demand profile recorded at the primary feeder supplying the study area.

Representative local irradiance profile (sunny day with intermittent clouds) constructed from annual measurements near the study area.
Three EV penetration levels (
A set The EV-only setup is retained and, in addition, each

Empirical distribution of EV charging start times based on observed usage in an Andean city in Ecuador.
Each scenario runs for 24 h at ten-minute resolution. Outputs include time series of (i) per-node voltage magnitude and feeder-wide minimum voltage; (ii) VUF as in (4); and (iii) transformer loading.
Case study results
The baseline demand allocation is first described before introducing EVs and PV. Each residential user connected to the transformer is assigned a daily load profile drawn from the typical demand shape in Figure 4. Users are modeled as predominantly single-phase consumers, and the 62 customers are grouped into 28 metering points. The random assignment of demand templates across customers and phases (without EVs or PV) yields the transformer phase-wise base demand shown in Figure 7. This plot summarizes the aggregated active power per phase over the 24 h horizon, and serves as the reference case against which EV and EV+PV scenarios are later compared. Unless stated otherwise, all scenario-level metrics reported in this section are summarized over

Baseline transformer loading without EVs or PV.
On top of this baseline, the Monte Carlo module allocates EVs to a subset of users according to the target penetration level. For each scenario (
Figure 8 illustrates the charging patterns resulting from the stochastic allocation of EVs across users. This figure is included to visualize one example realization of user-level charging sessions over the 24 h horizon, while the reported performance metrics are based on the full set of

Aggregated EV charging power at the transformer for the three penetration levels considered. (a) 5% EV penetration, (b) 10% EV penetration and (c) 15% EV penetration.
Transformer loading
Figure 7 shows the baseline transformer loading for the studied feeder. In this reference case, without EVs or PV, the transformer utilisation factor (TUF) is approximately 59%, with a net daily energy (NDE) throughput of about 414.4 kWh.
When EV charging is added, the daily loading profiles change according to the penetration level, as illustrated in Figure 9. For 5% EV penetration, the TUF rises to 65% and the NDE increases to approximately 455.4 kWh. At 10% penetration, the transformer operates with a TUF of 69% and an NDE of about 479.9 kWh. For the highest level considered, 15% EV penetration, the TUF reaches 90% and the NDE attains roughly 589.0 kWh over the simulated day.

Daily transformer loading profiles under EV-only scenarios for three levels of penetration. (a) 5% EV penetration, (b) 10% EV penetration and (c) 15% EV penetration.
The EV + PV scenarios in Figure 10 retain the same TUF values as their EV-only counterparts for each penetration level (65%, 69%, and 90% for 5%, 10%, and 15% EV, respectively), while modifying the net daily energy exchanged with the upstream network. With 5% EV + PV, the NDE falls to about 372.4 kWh, with no net export. At 10% EV + PV, the NDE is further reduced to approximately 319.6 kWh, with surplus PV energy injected to the upstream network equivalent to 37.589% of the daily demand (see Table 4). For 15% EV + PV, the TUF remains close to 90%, but the NDE decreases to around 427.9 kWh; in this case, the PV surplus injected corresponds to 49.104% of the daily demand. These numerical results for all scenarios are summarised in Table 4.

Daily transformer loading profiles under EV + PV scenarios for three levels of penetration. (a) 5% EV + PV penetration, (b) 10% EV + PV penetration and (c) 15% EV + PV penetration.
Transformer utilization factor (TUF), net daily energy (NDE), and PV energy surplus for the different EV and EV + PV scenarios.

Voltage deviation
The time-series simulations in OpenDSS, driven by the net injections in (1), provide phase-wise nodal voltage magnitudes over the 24 h horizon for each scenario. From these series, the maximum steady-state voltage deviation
Maximum steady-state voltage deviation per phase for the different EV and EV + PV scenarios.

Across all scenarios, phase
Voltage unbalance
The voltage unbalance factor (VUF) was calculated from the negative and positive sequence components of the simulated phase voltages using (4), in line with IEC 61000-3-13 for LV systems. Table 6 summarises the resulting daily average VUF for each scenario. The baseline case exhibits an average unbalance of 0.324%. For 5% and 10% EV penetration, the VUF increases to 0.355% and 0.379%, respectively, and decreases slightly to 0.322% and 0.375% when PV is co-located with EV users. At 15% EV, the average VUF reaches 0.475%, and the corresponding EV + PV case attains 0.532%. All values remain below the compatibility levels specified for LV networks.
Daily average voltage unbalance factor (VUF) for each scenario.

To show that the workflow can be executed beyond a one-day window using the same modules and inputs, we extended the most demanding case (15% EV penetration) to a 7-day horizon at the same 10-minute resolution. The multi-day run uses the same random seed as the one-day study; therefore, the EV and EV+PV allocations (i.e., the customers assigned with EVs and PV systems) match those analyzed in the one-day horizon, enabling a direct comparison of operating patterns across horizons. The week-level indicators reported below focus on (i) maximum phase-wise voltage deviation, (ii) maximum voltage unbalance factor (VUF), (iii) maximum transformer apparent power
Seven-day summary indicators for the 15% EV penetration scenario (EV-only and EV+PV).

Seven-day summary indicators for the 15% EV penetration scenario (EV-only and EV+PV).
Figure 11 (a) reports the aggregated feeder demand and transformer apparent power over seven consecutive days (10-minute resolution) for the EV-only configuration. Over the 7-day horizon, the maximum apparent power reaches 38.66 kVA (77.3% of a 50 kVA transformer), the maximum phase-wise voltage deviation remains below 2%, and the maximum VUF is 0.433%. The total energy imported from the upstream network over the week is 3805.21 kWh.
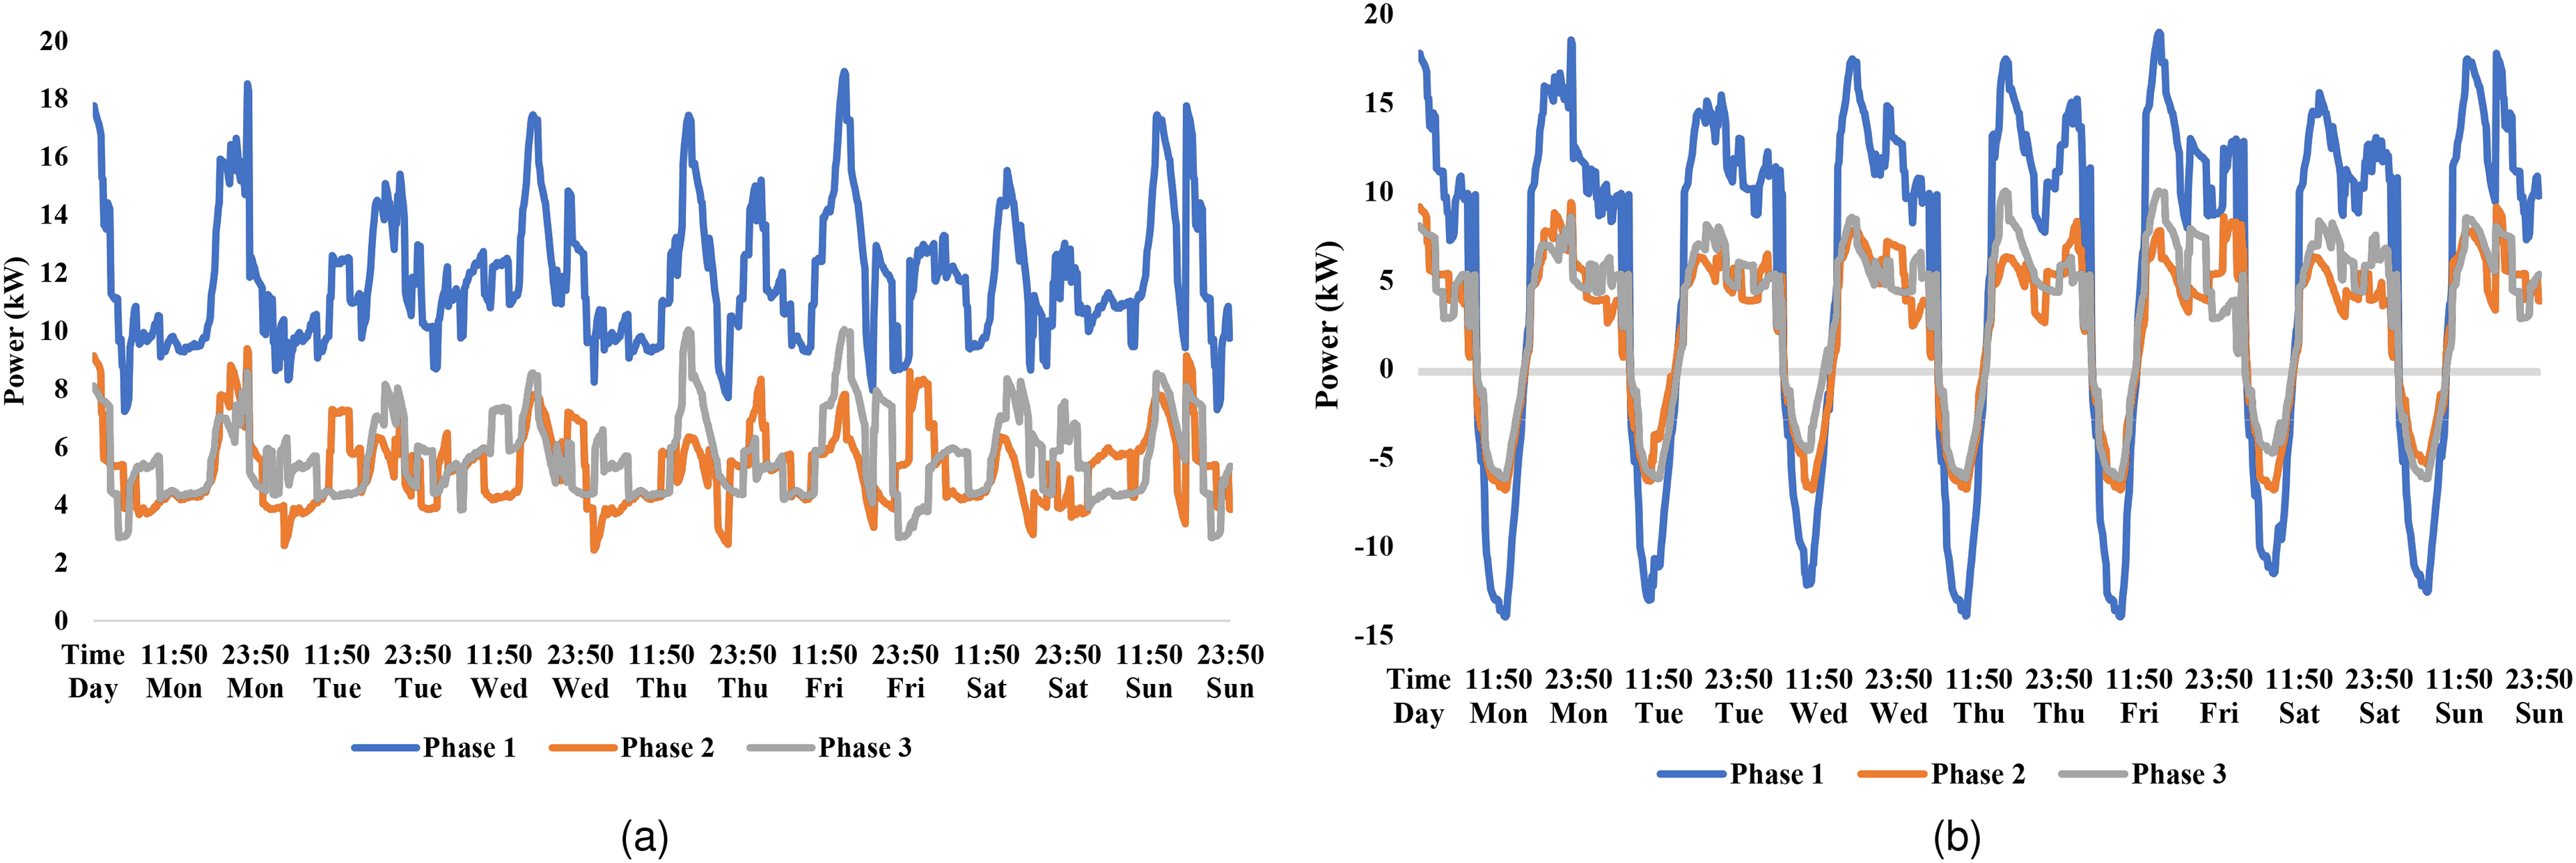
Seven-day time-series extension of the 15% EV penetration scenario. (a) EV-only and (b) EV+PV. (a) EV-only (15% EV, 7 days) and (b) EV+PV (15% EV, 7 days)
Figure 11 (b) shows the EV+PV extension over the same 7-day window so that day-to-day changes in PV production are visible alongside demand. Under EV+PV, PV improves the maximum phase-wise voltage deviation (from 1.824/0.847/0.893% to 1.248/0.579/0.634%) and reduces the maximum VUF from 0.433% to 0.397%. The maximum transformer apparent power remains 38.66 kVA, consistent with PV primarily affecting daytime net demand rather than the evening charging window in this feeder. Over the week, PV reduces imported energy from 3805.21 kWh to 2629.46 kWh (a 30.9% reduction) under the same EV penetration and allocation.
Discussion
The simulation results allow a joint reading of transformer loading, voltage performance, and voltage unbalance under gradual EV penetration with and without distributed PV. All results referenced in Tables 4–6 are computed over
Transformer loading and energy exchange
The transformer indicators in Table 4 show that, for this feeder, EV adoption primarily translates into higher utilization and daily energy throughput on average across the
The comparison between EV-only and EV + PV scenarios highlights the different roles of energy and power in this context. The presence of PV reduces mean NDE substantially for all penetration levels (e.g., from 479.9 kWh to 319.6 kWh at 10% EV, and from 589.0 kWh to 427.9 kWh at 15% EV), with periods of net export to the upstream network. However, the mean TUF remains essentially unchanged between EV-only and EV + PV cases (65%, 69%, and 90% for 5%, 10%, and 15% EV, respectively), because the dominant transformer peaks occur in the evening, when PV production is low or zero. In other words, PV substantially reshapes the daily energy balance but has limited influence on peak loading under the charging habits modelled here. For LV feeders with similar demand and irradiance profiles, this underlines the need to consider managed charging, storage, or transformer reinforcement if EV penetration is expected to grow beyond the levels simulated, even when distributed PV is present and sized to offset annual consumption.
Voltage deviation and compliance with limits
Voltage deviation results in Table 5 reveal a different pattern across the
The EV + PV scenarios further reduce voltage deviations in most cases. For instance, the mean
Voltage unbalance
The VUF values in Table 6 confirm that, for the studied feeder, voltage unbalance stays at a low level across all scenarios, although a gradual increase with EV penetration is present. The baseline average VUF of 0.324% rises to 0.355% at 5% EV and 0.379% at 10% EV (mean values across
The EV + PV scenarios show a mixed effect. At low and intermediate penetrations, the average VUF is close to or slightly below the EV-only values (0.322% for 5% EV + PV, 0.375% for 10% EV + PV), which indicates that the co-located PV injections do not materially worsen unbalance and may even bring minor improvements at certain times of day. In contrast, at 15% penetration the EV + PV case exhibits a VUF of 0.532%, higher than its EV-only counterpart. This points to a regime where the combination of unbalanced demand and unbalanced generation begins to accumulate, especially when PV capacity is sized to offset annual energy without an explicit phase-balancing criterion and when the set of EV + PV adopters is unevenly distributed across phases. The upward trend is modest within the simulated range, but it suggests that higher penetrations or more clustered deployments could lead to VUF values that approach or exceed compatibility thresholds, in line with observations from studies that stress LV feeders with one-sided PV or EV placement (Dubravac et al., 2023; Saritha and Manitha, 2022). This reinforces the value of phase-aware connection policies and simple heuristics for assigning chargers and PV systems to phases in emerging LV networks (e.g., allocating new single-phase chargers across phases in proportion to existing customers, enforcing phase caps at the transformer level, or prioritizing phase selection actions that minimize expected VUF and neutral current when phase reassignment is feasible).
Implications for LV planning and tool use
Taken together, the indicators highlight a consistent picture for the representative feeder in Cuenca. Within the range of EV penetration studied (up to 15% with slow single-phase chargers), standard voltage limits are not challenged and VUF remains low, although it increases gradually under combined EV and PV integration. Transformer loading, by contrast, approaches high utilization levels—especially in the 15% scenarios—which suggests that thermal constraints may require attention earlier than voltage-related indicators. Because the framework is scenario-based, the reported metrics summarize an ensemble of plausible allocations rather than a single deterministic realization, and the critical-iteration definition provides a consistent reference for discussing high-demand operating conditions. In practical planning workflows, this supports feeder screening and reinforcement prioritization and can be extended to sensitivity studies by sampling uncertain feeder attributes (e.g., phase assignments or customer locations) when network records are incomplete.
Limitations
This assessment is constrained by the scope of the available inputs and by the modeling choices required to keep the study reproducible. The case study covers a single LV feeder and a one-day quasi-static time-series with 10-minute resolution, which is adequate to track feeder loading, voltage deviation, and unbalance trends over the day, but it cannot represent sub-minute voltage fluctuations; for that reason, the manuscript restricts the power-quality discussion to indicators compatible with the adopted time step and reserves IEC-style flicker evaluation for a dedicated analysis based on higher-rate voltage data and standardized flickermeter processing. The EV connection-time pattern used for the scenarios reflects weekend behavior, so the conclusions should be interpreted as representative of that regime unless weekday distributions and longer horizons are supplied. A measurement-based validation of simulated voltages for this specific feeder is not yet possible because it would require time-synchronized LV voltage recordings at multiple locations together with customer phase identification over the same horizon, which are not currently available under the required monitoring and access conditions; the realism of the results in this stage therefore relies on the use of measured slow-charging profiles, empirically derived connection-time distributions, and PV and demand profiles built from real records, propagated through a detailed OpenDSS feeder model. Finally, the present scenarios focus on slow single-phase charging and PV sized for energy compensation; higher-power charging, different PV clustering patterns, and alternative load compositions can shift the timing and magnitude of peak stress, and the observed increase of VUF at higher penetrations indicates that phase assignment and unbalanced deployments can materially affect outcomes, motivating phase-aware allocation strategies in follow-on studies.
Conclusions
The open-source Python–OpenDSS framework developed in this work provides a transparent way to combine measured slow-charging profiles, Monte Carlo allocation of EVs and PV systems, and detailed LV feeder models to examine how emerging e-mobility and rooftop generation interact with transformer loading, voltage quality, and unbalance in a Latin American context. For the representative 50 kVA feeder in Cuenca, simulations with EV penetration up to 15% under single-phase 3.3 kW and 6.0 kW slow charging indicate that steady-state voltage deviations and VUF remain comfortably within typical LV compatibility limits, while transformer utilization approaches high values in the most demanding scenarios, even when PV is dimensioned to offset annual consumption. These results point to transformer loading as a key quantity to monitor under similar conditions and show that distributed PV, sized for energy compensation, does not necessarily relieve evening peaks associated with residential charging. These findings align with prior LV impact studies discussed in Results and Discussion Section, which commonly identify transformer loading and phase unbalance as early planning concerns under single-phase residential charging, while reporting that PV sized for energy compensation tends to reshape daily energy exchange more than evening peak loading. In our Cuenca feeder, the same pattern appears: PV reduces net daily energy while leaving the evening loading window largely unchanged, and unbalance becomes more sensitive as penetration rises. Because the framework is designed for planning-oriented scenario analysis, its outputs are conditional on the accuracy of the feeder model and time-series inputs supplied by the user; when feeder attributes such as topology details, customer locations, phase connections, or baseline injections are uncertain, these uncertainties can be represented through alternative input sets or probabilistic sampling within the Monte Carlo procedure. At the same time, the analysis rests on a single feeder, a one-day horizon, 10-minute resolution, and slow charging only, without explicit modelling of harmonics or coordinated control. Future extensions will therefore focus on multi-day and annual simulations with realistic adoption trajectories, finer temporal resolution for EV and PV traces, and the inclusion of additional distributed resources such as battery storage, supercapacitor banks, and other flexible loads, as well as managed charging and demand response schemes. These enhancements will broaden the range of questions that utilities and researchers can address with the framework, from transformer fleet planning to the joint assessment of EVs, PV, storage, and other DER technologies in low-voltage networks.
Footnotes
Acknowledgements
The authors thank the Universidad de Cuenca, Ecuador, for easing access to the facilities of the Micro-Grid Laboratory of the Faculty of Engineering, necessary to carry out the work described in this article.
Funding
The author(s) received no financial support for the research, authorship, and/or publication of this article.
Declaration of conflicting interests
The author(s) declared no potential conflicts of interest with respect to the research, authorship, and/or publication of this article.
Supplementary material
Supplemental material for this article is available online. Supplementary material (including the EV charging and PV generation profiles used in this study, as well as the scripts required to load and preprocess them) will be provided by the authors upon reasonable request.