
Abstract
ROEWE E50, JAC iev4, ZOYTE 5008EV, and BYD E6 battery electric vehicles are being demonstrated in 25 cities of different scale represented by Shanghai, Shenzhen, and Hefei. This article presented four battery electric vehicles total lifecycle ownership cost model based on urban driving cycles and traffic data of that three cities. Five scenarios were given about basic, local government subsidy, battery price decreasing, gasoline price increasing, and battery price decreasing with gasoline price increasing and an analysis was made of battery electric vehicles’ market competitiveness during 15 years nominal lifecycle. The results show that the high purchase cost is the biggest obstacle factor for battery electric vehicle commercialization. Within battery price decreasing scenario and gasoline price increasing scenario, battery electric vehicles under ¥150,000 have competitiveness. When battery price decreases with the increase in gasoline price both under optimistic scenarios, battery electric vehicles under ¥200,000 will be more competitive than Conventional Vehicles. The sensitive factors to battery electric vehicles total ownership cost in proper sequence are battery cycle life, local government subsidy, power consumption, average daily mileage, battery price, and charging price. This article suggests that battery electric vehicles with different battery capacities such as 30, 25, and 20 kWh are suitable for use in metropolitan, large- and medium-sized, and medium- and small-sized cities, represented by Shanghai, Shenzhen, and Hefei.
Keywords
Introduction
In order to ease energy pressure, reduce air pollution, promote the evolution and upgrade of auto industry, “The CPC central committee’s proposal to formulate the 13th five-year plan for national economic and social development” put forward the goal of China’s electric car ownership by 2020 to be 5 million vehicles. This is an important indicator of China’s economic development. Currently, this target will be completed on schedule.
However, the excessively high cost is the bottleneck that limits the commercial application of electric vehicles. 1 Yetano et al. 2 pointed out that consumers care a lot on purchase and usage cost based on quantitative analysis of public attitude and needs of alternative energy vehicles. According to the survey on consumers conducted by author in 2011, 87% of 2702 interviewees thought that cost is the most important factor to purchase battery electric vehicles (BEVs). 3 From related literatures, it can be found that the factors affecting BEVs’ cost include purchase cost, battery price, gasoline price, government subsidy, charging price, and so on.4–6 However, the previous studies only used the static method to calculate cost, without considering the influences of parameter changes such as battery price and gasoline price on lifecycle cost of BEVs.
The sensitivities of battery price, gasoline price, battery cycle life, and government subsidy were analyzed by Zhu et al., 7 Qi et al., 8 and Wang et al., 9 at the same time the cost advantages of BEVs over Conventional Vehicles (CVs) were analyzed as well. Werber et al. 10 compared total lifecycle cost of BEVs with CVs within different driving range of BEVs and gasoline price scenarios. Most of these studies above just used the New European Driving Cycle (NEDC) to evaluate the energy consumption, which may be unbiased. But the road condition between China and Europe is different, the NEDC may not necessarily reflect the true driving situation in different cities of China. The studies conducted by Hendrickson et al., 11 Traut et al., 12 Kelly et al., 13 and Neubauer et al. 14 showed that average daily mileage and driving conditions have very significant impact on energy consumption cost. Taking gasoline price, charging price, battery price, and vehicle service life as variables, Sharma et al. 15 researched the scenarios that were good for the development of Australia’s electric car market under three types of driving cycles, for example, Australia, ECE-EUDC, and US-FTP. Karabasoglu and Michalek 16 took the five types of driving cycles, for example, UDDS (represents city driving conditions for light-duty vehicles which are characterized by relatively slow speed), HWFET (represents highway driving conditions under 60 mph), US06 (an aggressive driving cycle with high acceleration and high engine loads), NYC (represents low speed urban driving with frequent stops), and LA 92 (an aggressive driving cycle in city conditions), as research targets and compared the economy of BEVs under conditions of different gasoline price, charging price, vehicle types, battery capacities, carton taxes, and vehicle discounts.
Therefore, it is necessary to consider the impact of practical application conditions and dynamic change of related costs when analyzing market competitiveness of BEVs. However, the previous studies lack analysis of BEVs’ total lifecycle ownership cost (TLOC) based on real urban driving cycles and traffic data. At the same time, the previous studies lack the sensitivity analysis on government subsidy, charging price, average daily mileage, power consumption, battery cycle life, and battery price under different scenarios. These factors have a very important role in the formulation of governmental electric vehicle policy. Meanwhile, the analysis of TLOC model can give a bright sight into the cost of every relevant part and thus help automakers choose appropriate battery capacity to adapt the market actual needs.
The sections of this article are organized as below. First, total lifecycle ownership cost model of BEVs is established based on purchase cost and usage cost. The three urban driving cycles for cities of different scale, Shanghai, Shenzhen, and Hefei, are fitted. Second, ownership costs of BEVs are calculated in different scenarios, at the same time the single-factor sensitivity analysis is carried out in each of scenario. Moreover, the multi-factor sensitivity of variables is analyzed by Monte Carlo model and the suggestions of suitable BEVs for different cities are presented. Finally, all conclusions and policy implications are summarized from the whole study.
Total lifecycle ownership cost model of BEVs
Total lifecycle ownership cost model
The TLOC model of BEVs consists of two parts: purchase cost and usage cost, as shown in equation (1)

where
Purchase cost consists of vehicle price, purchase tax, and government subsidy, as shown in equation (2)

where
Usage cost includes energy cost, maintenance cost, and battery replacement cost, as shown in equation (3)

where
Energy cost is closely related to average daily mileage, power consumption, and charging price, as shown in equation (4). In this article, it is assumed that a car drives 360 days a year

where
Maintenance cost is mainly related to average daily mileage. According to survey, annual maintenance cost for a BEV is about ¥6.16/100 km and ¥14/100 km for a CV. 17
Battery replacement cost is mainly related to average daily mileage, battery cycle life, battery capacity, and battery price, as shown in equation (5)
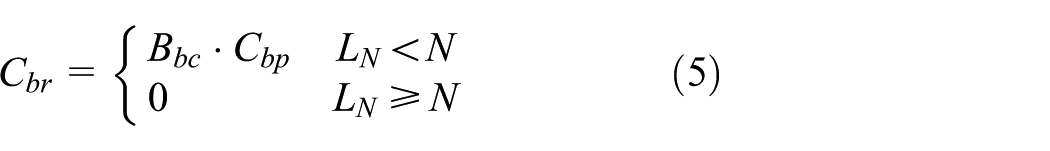
where

where
According to the above analysis, the factors that influence TLOC of BEVs mainly include purchase cost, government subsidy, average daily mileage, power consumption, charging price, battery cycle life, battery capacity, and battery price. Therefore, the TLOC model of BEVs can be obtained, as shown in equation (7)

where
In the same way, the TLOC model of CVs can be obtained, as shown in equation (8)
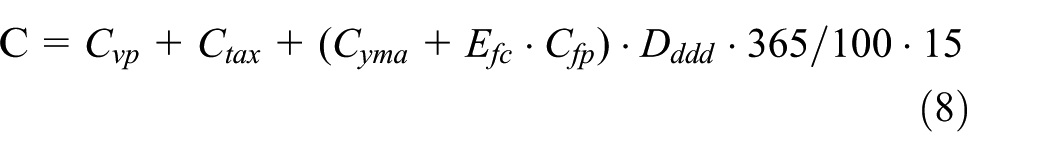
where
Model parameters definition
BEVs model
To analyze ownership cost, this article chooses four types of typical BEVs that spans from small car to multi-purpose vehicles (MPV). Meanwhile, the similar CVs in shape, interior, structure, and size are chosen as comparable vehicles with BEVs. Except for ROEWE E50 and BYD E6, all other two BEVs are modified based on existing CVs which are chosen as the compared vehicles. ROEWE E50 is newly developed by SAIC MOTOR and it has no fuel prototype vehicle. Benben LOVE made by CHANGAN is similar to ROEWE E50 in shape, structure, size, and therefore, it can be chosen as the comparable vehicle of ROEWE E50. BYD E6, which is a MPV, has the same production platform with BYD G6. Thus, it is very reasonable to choose BYD G6 as the comparable vehicle of BYD E6. The parameters of BEVs and CVs are presented in Table 1. It is noted that the fuel consumption values are obtained from China’s official FCR database.
Parameters of vehicles.

Driving cycle
Driving cycle directly affects power consumption and usage cost.15,23 In this article, based on 25 new energy vehicle demonstration cities in China, the urban driving cycles of three cities in different scale, for example, Shanghai, Shenzhen, and Hefei, are selected to estimate the energy consumption economy of BEVs.
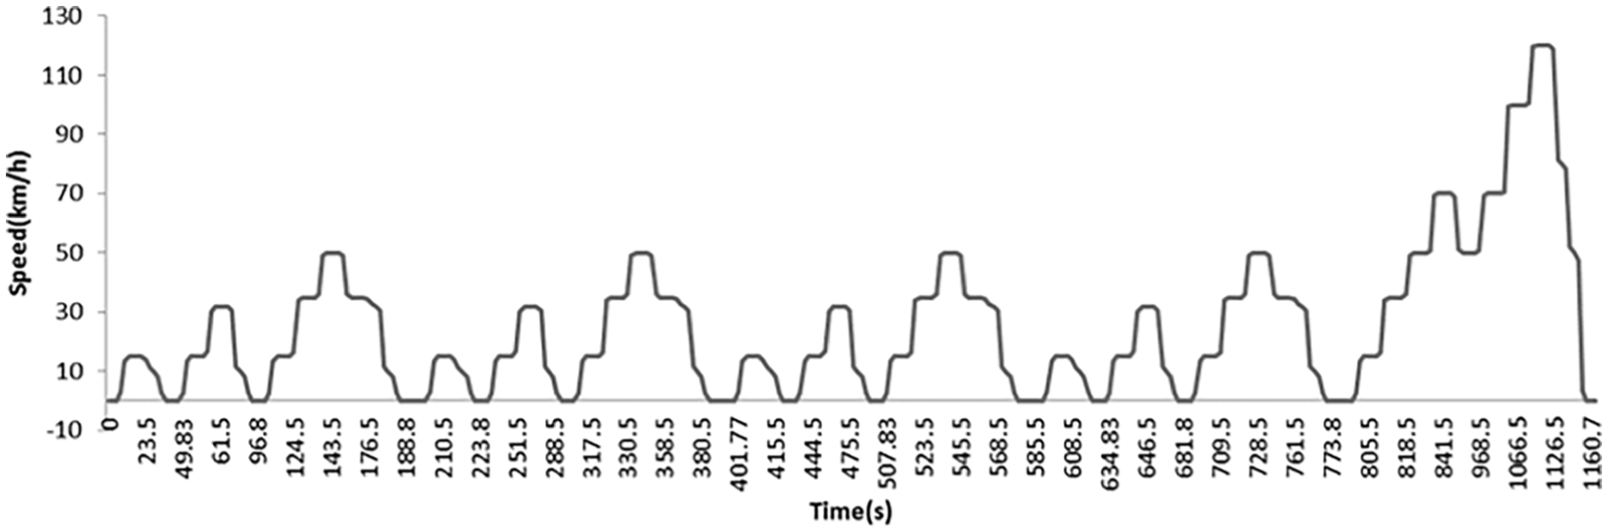
Shanghai Driving Cycle. 24 With more vehicles driving on road and more new roads built, driving condition is not same as before. The existing data of Shanghai Driving Cycle is very old and may be not very adaptive for today. 25 In this article, the road test data which comes from the results of nine diesel taxis operating 1 year in Shanghai is used as the data of Shanghai Taxi Driving Cycle. Through data processing and analyzing, Shanghai Taxi Driving Cycle can be obtained, which includes two low-speed driving cycles, two medium-speed driving cycles, and a high-speed driving cycle, as shown in Figure 1. As we know, the starts/stops number of taxis is more than that of private cars. When Shanghai Taxi Driving Cycle is used, power consumption is a little higher than that in Shanghai Driving Cycle. But from the overall view, Shanghai Taxi Driving Cycle has the same road driving condition as Shanghai Driving Cycle and thus this article will use Shanghai Taxi Driving Cycle instead of Shanghai Driving Cycle to calculate the power consumption.

Shanghai Taxi Driving Cycle.
Shenzhen Driving Cycle. Zhang 26 showed that the two characteristic values of average speed and maximum speed have the biggest impact on the performance of driving cycle. According to previous studies,27,28 the average speed and maximum speed of Shenzhen Driving Cycle are 29.45 and 75 km/h, respectively. Meanwhile, it is found that the two characteristic values are between that of NEDC and Passenger Car Driving Cycle in urban road (PCDC). 29 Thus, power consumption in Shenzhen Driving Cycle should be between the two driving cycles. NEDC and PCDC are shown in Figures 2 and 3, respectively.
New European Driving Cycle.

Passenger Car Driving Cycle in urban road.
Hefei Driving Cycle. Although there is no urban driving circle data in Hefei, existing driving circles which have similar characters with Hefei Driving Circle can be used instead. Through comprehensive analysis of the studies conducted by Jiang et al., 30 Zhang, 31 Mao, 32 and Li, 33 the average speeds of Hefei Driving Cycle and Japanese 10-15 Mode Cycle (Ja1015) are 24.49 and 22.7 km/h respectively, and maximum speeds are 65.075 and 70 km/h, respectively. There are 7.3% error of average speed and 7.56% error of maximum speed between Hefei Driving Cycle and Ja1015. The errors are lower than 10%. 34 Therefore, it is reasonable that Hefei Driving Cycle can be replaced by Ja1015, as shown in Figure 4.

Japanese 10-15 Mode Cycle.
The characteristic values of different driving cycles are shown in Table 2.
The characteristic values of different driving cycles.

NEDC: New European Driving Cycle; PCDC: Passenger Car Driving Cycle.
Government subsidy
The central government subsidy standard for purchasing a BEV is that the BEVs with driving range of 100–150 km, 150–250km, and 250 km or higher are qualified for ¥20,000, ¥36,000, and ¥44,000 subsidies, respectively. The actual purchase costs of ROEWE E50, JAC iev4, ZOYTE 5008EV, and BYD E6 are ¥168,900, ¥102,500, ¥172,000, and ¥325,800, respectively, after deducting the central government subsidy. The local government subsidy standard for purchasing a BEV in Shanghai is that the BEVs with driving range of 100–150 km and 150 km or higher are qualified for ¥10,000 and ¥30,000 subsidies, respectively. The local government subsidy standard for purchasing a BEV in Shenzhen is that the BEVs with driving range of 100–150 km, 150–250 km, and 250 km or higher are qualified for ¥10,000, ¥18,000, and ¥22,000 subsidies, respectively. While in Hefei the local government subsidy is the half of the central government subsidy when the driving range of BEVs is 150 km or higher.
Average daily mileage
A survey on consumer daily mileage was conducted by author in 2011 on the official website of SOHU. A total of 2702 samples were collected, including Shanghai 102, Guangdong 225, and Anhui 65. The distribution of consumer daily mileage is shown in Figure 5. According to “The fourth comprehensive traffic survey and development countermeasure research in Shanghai,” the average daily mileage of private cars in Shanghai is 39 km. 35 The daily mileage with highest percentage in Guangdong and Anhui are 10–50 km and 5–30 km, respectively. In this article, the average daily mileages in Shanghai, Shenzhen, and Hefei are, respectively, 40, 35, and 25 km.

The distribution of consumer daily mileage (N = 2702).
Battery cycle life
Sarasketa-Zabala et al. 36 found that the cell storage aging tendency just changed at very high temperature (50°C and 70% SOC) after ca. 1 year. Considering that the temperature in Shanghai, Shenzhen, and Hefei is not very extreme and sometimes they are similar in summer, the effect of temperature on battery cycle life and energy consumption was consumed to be minor and not taken into account in this article. Therefore, the battery cycle life in the three cities was assumed to be the same. Combining with comprehensive analysis of papers conducted by Xue et al., 37 Li, 38 Li 39 and Li 40 and field researches in Hangzhou, Hefei, Shenzhen, and Beijing, battery cycle life is about 600–1200 times. This article assumes that the battery cycle life is 800 times.
Charging price
As of October 2017, charging prices in Shanghai, Shenzhen, and Hefei are ¥0.617/kWh, ¥0.68/kWh, and ¥0.5953/kWh, respectively. And charging efficiency of BEVs is assumed as 85%.
Power consumption
CRUISE software is used to simulate dynamic performance, fuel economy, and emission performance of vehicles. This article chooses Electric Vehicle model in CRUISE simulation software as simulation model of power consumption.41,42 Electric Vehicle model is shown in Figure 6. The results of simulating power consumption in different driving cycles are shown in Figure 7. The power consumption in NEDC is higher than that in PCDC, so this article uses NEDC to replace Shenzhen Driving Cycle.

Electric vehicle model.

Power consumption of BEVs.
Battery price
The total battery pack cost includes three parts: cell component costs, pack component costs, and other enterprise expenses. 43 According to the prices of battery materials predicted by Element Energy and Consultants R B S, 44 a bottom-up and component-based prediction approach of battery price is developed in this study. The Li-ion battery price is predicted in three scenarios: optimistic, baseline, and conservative scenario. The prediction results are shown in Figure 8.

Prediction of Li-ion battery price.
The results show that in 2020, the battery prices in optimistic scenario, baseline scenario, and conservative scenario are ¥1,287/kWh, ¥1,411/kWh, and ¥1,529/kWh, respectively.
Gasoline price
Based on historical retail prices of domestic refined oil from 1 June 1998 to 1 October 2017 (Figure 9), ARIMA (1,1,1)(0,0,0) prediction model is established to predict the gasoline price in three scenarios: optimistic, baseline, and conservative scenario. The upper limit value of ARIMA prediction model at 95% confidence level is used as the optimistic gasoline price. The predicted value of ARIMA prediction model is used as the baseline gasoline price. And the gasoline price with 3% increase each year is used as the conservative gasoline price. The prediction results are shown in Figure 10.

The change of gasoline price.

Prediction of gasoline price.
Results show that in 2030, gasoline price will be more than ¥10/L in baseline scenario and ¥9.46/L in conservative scenario. With gasoline price increasing, BEV will show its long-term competitiveness.
Fuel consumption of CVs
With the improvement of automotive technology, fuel consumption of CVs will gradually decrease, which will directly affect the market competitiveness of BEVs. According to “Energy Saving and New Energy Vehicle Industry planning,” average fuel consumption of passenger cars will decrease to 5 L/100 km in 2020. Average fuel consumption of own-brand vehicles is 6.65 L/100 km in 2015, so in order to achieve 5 L/100 km enterprise target in 2020, fuel consumption needs to decrease by 5.6% each year.
The changes of national policies and technology level of automobile enterprises should be considered when predicting the change of fuel consumption. In this article, according to “Energy Saving and New Energy Vehicle Industry planning,” the decrease in fuel consumption is 5% each year from 2015 to 2020. And considering the technology level of automobile enterprises, the decrease in fuel consumption is 1% each year from 2020 to 2030. The changes in fuel consumption are shown in Table 3.
The change in fuel consumption.

Analysis of total lifetime ownership cost
Different scenarios definition
With development of manufacturing technology, battery price and average fuel consumption will gradually decrease, while gasoline price will gradually increase. In order to compare and analyze the market competitiveness of BEVs and sensitivity of variables, this article defines five scenarios: basic, local government subsidy, battery price decreasing, gasoline price increasing, and battery price decreasing with gasoline price increasing scenario.
The variation of parameters under these different scenarios can be summarized in Table 4.
Parameters under different scenarios.

Ownership cost analysis in different scenarios
Basic scenario
In basic scenario, because of high purchase cost, BEVs have no economic benefits during the defined 15 years. Figure 11 presents the analysis results of ownership cost in this scenario. The jump in the figure was caused by battery replacement cost, and so is in all the figures. The single-factor sensitivity analysis is made on every variable in the ownership cost model. The results show that vehicle price is the most influential factor, followed by battery capacity and battery price, average daily mileage, charging price, and power consumption. Table 5 presents the results of single-factor sensitivity analysis. With the enlargement of city scale, TLOC is more and more sensitive to power consumption and average daily mileage.
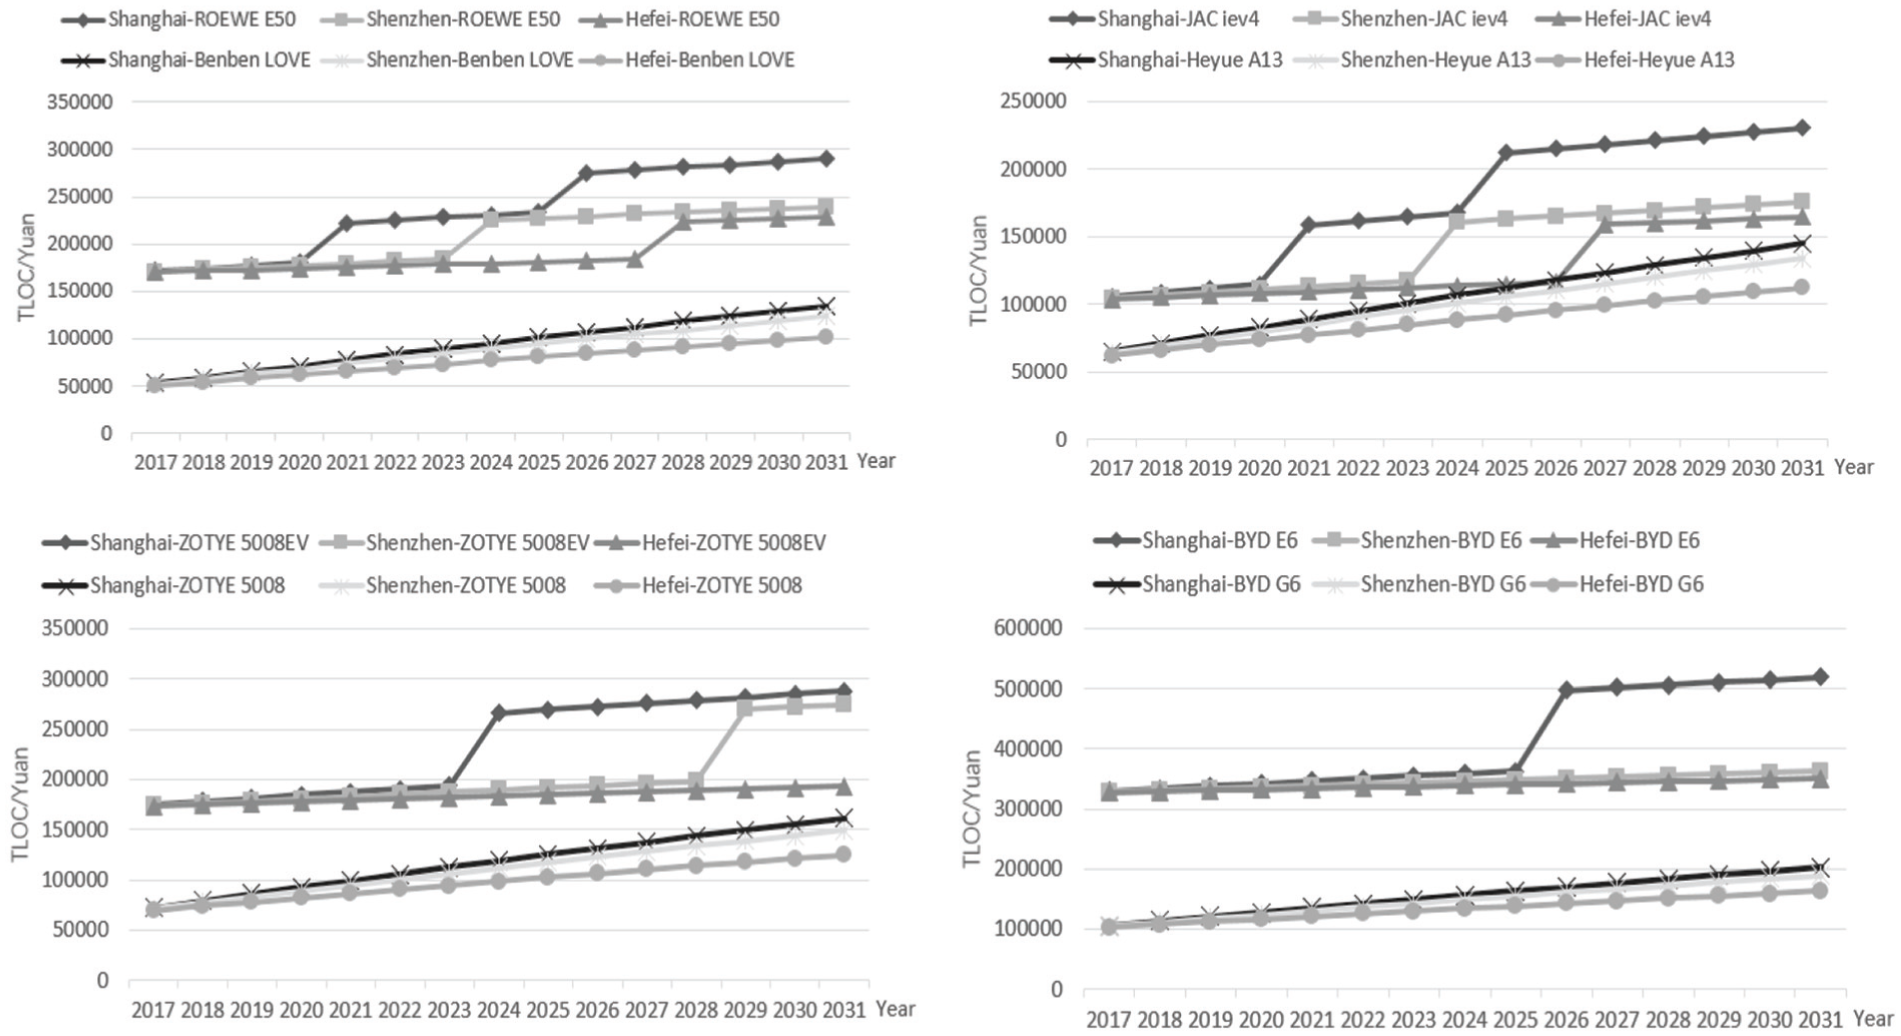
TLOC of BEVs in basic scenario.
The single-factor sensitivity analysis in basic scenario.

The BEV does not replace battery during 15 years vehicle service life, so the sensitivity of battery price and battery capacity cannot be analyzed.
Local government subsidy scenario
In local government subsidy scenario, because of high battery replacement cost, BEVs still have no market competitiveness with double government subsidy, as shown in Figure 12. In this scenario, the sensitive factors to BEV’s total ownership cost in descending order are vehicle price, battery capacity and battery price, average daily mileage, charging price, and power consumption, as shown in Table 6.

TLOC of BEVs in local government subsidy scenario.
The single-factor sensitivity analysis in local government subsidy.

The BEV does not replace battery during 15 years vehicle service life, so the sensitivity of battery price and battery capacity cannot be analyzed.
Battery price decreasing scenario
With the battery price decreasing as predicted in section “Battery price,” only JAC iev4 has competitiveness after using 10–12 years in Shenzhen, while other vehicles have no competitiveness, as shown in Figures 13 and 14. In this scenario, the sensitive factors to BEVs total ownership cost in descending order are vehicle price, battery capacity, average daily mileage, local government subsidy, charging price, and power consumption, as shown in Table 7. With the enlargement of city scale, TLOC is more and more sensitive to average daily mileage, charging price, and power consumption. The sensitivities of local government subsidy and battery capacity have obvious difference in different city scale.

TLOC of BEVs in optimistic scenario of battery price decreasing scenario (1: central government subsidy, 2: double government subsidy).

TLOC of BEVs in conservative scenario of battery price decreasing scenario (1: central government subsidy, 2: double government subsidy).
The single-factor sensitivity analysis in battery price decreasing scenario.

The BEV does not replace battery during 15 years vehicle service life, so the sensitivity of battery price and battery capacity cannot be analyzed.
Gasoline price increasing scenario
In gasoline price increasing scenario, only JAC iev4 has competitiveness after using 11–15 years in Shenzhen, as shown in Figures 15 and 16. Only when total government subsidies are more than ¥130,000 in Shenzhen, BYD E6 may reflect economic superiority. In this scenario, the sensitive factors to BEVs total ownership cost in descending order are vehicle price, battery capacity and battery price, average daily mileage, local government subsidy, charging price, and power consumption, as shown in Table 8. And there is a positive correlation between average daily mileage, charging price, power consumption, and city scale. The sensitivities of local government subsidy, battery price, and battery capacity have obvious difference in different cities scale.

TLOC of BEVs in optimistic scenario of gasoline price increasing scenario (1: central government subsidy, 2: double government subsidy).
TLOC of BEVs in conservative scenario of gasoline price increasing scenario (1: central government subsidy, 2: double government subsidy).
The single-factor sensitivity analysis in gasoline price increasing scenario.

The BEV does not replace battery during 15 years vehicle service life, so the sensitivity of battery price and battery capacity cannot be analyzed.
Battery price decreasing with gasoline price increasing scenario
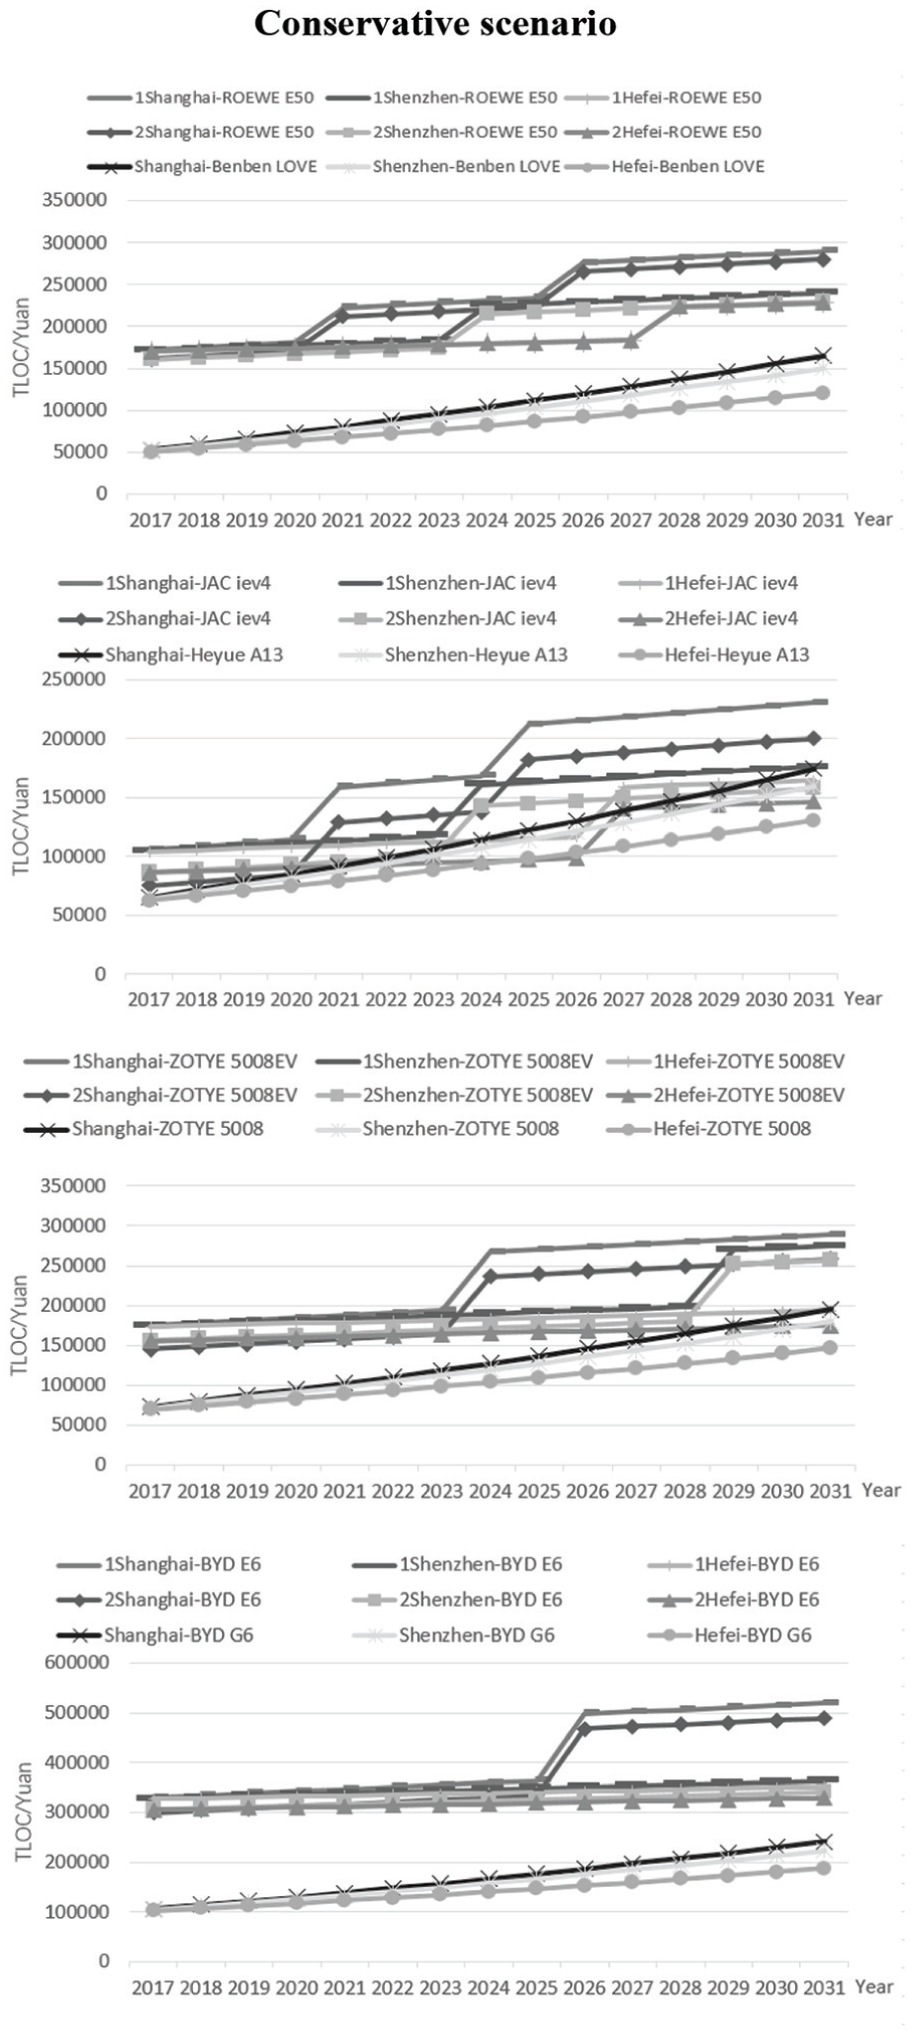
In battery price decreasing with gasoline price increasing scenario, BEVs only have competitiveness with double government subsidy, as shown in Figures 17 and 18. In optimistic scenario, with double government subsidy JAC iev4 in Shanghai, Shenzhen, Hefei can show competitiveness after using 9th year, the 5th year, and 7th year, respectively; ZOTYE 5008EV with double government subsidy shows economic benefits after using 15th year in the three cities. In conservative scenario, JAC iev4 and ZOTYE 5008EV only in Shenzhen can show economic benefits. ROEWE E50 and BYD E6 still have no market competitiveness due to high purchase cost and battery replacement cost.

TLOC of BEVs in optimistic scenario of battery price decreasing with gasoline price increasing scenario (1: no subsidies, 2: double government subsidy).

TLOC of BEVs in conservative scenario of battery price decreasing with gasoline price increasing scenario (1: no subsidies, 2: double government subsidy).
Sensitivity analysis by Monte Carlo model
Monte Carlo model is an effective method to solve the problems of uncertainty variables. Based on defining random variables, Monte Carlo model will produce corresponding random numbers that have the same changes as random variables. And through the operation of variables, the random number collections of corresponding objective function can be obtained. Finally, the probability model of objective function can be obtained by Monte Carlo simulation. In this section, Monte Carlo model of Crystal Ball software is used to analyze the multi-factor sensitivity of TLOC with changes of charging price, local government subsidy, power consumption, average daily mileage, and battery cycle life at the same time.
The probability distribution of variables: (1) Local government subsidy: according to local government subsidy standard in 2014 given by 88 new energy vehicle demonstration cities in China, the discrete distribution of every BEV’s local government subsidy can be obtained. (2) Average daily mileage: according to the survey of average daily mileage conducted by author in 2011 on the official website of SOHU (School of Automotive Studies, Tongji University, 2011), the average daily mileage obeys normal distribution with average value 35, variance 3.5. (3) Charging price: according to the charging prices of first 25 new energy vehicle demonstration cities, the charging price obeys normal distribution with average value 0.79, variance 0.08. (4) Power consumption: power consumption in Hefei Driving Cycle is used as 5% lower limit value of normal distribution and the respective 95% upper limit value is the power consumption in Shanghai Driving Cycle. Thus, the average power consumptions of ROEWE E50, JAC iev4, ZOTYE 5008EV, and BYD E6 are 19, 19.5, 21, and 28 kWh/100 km, respectively, and the variances are 2.43, 2.74, 3.04, and 6.08, respectively. (5) Battery price: the battery prices in optimistic and conservative scenario in 2025 are used as 5% lower limit value and 95% upper limit value of normal distribution, respectively. Therefore, the average battery price is 1392 and variance is 148.34. (6) Battery cycle life: the battery cycle life of 600 times is used as 5% lower limit value of normal distribution and the respective 95% upper limit value is 1200 times. Average battery cycle life is 900 times and variance is 234.09. The probability distributions of all variables are shown in Table 9.
The probability distributions of variables.

Figures 19 and 20 show the TLOC of BEVs and variables sensitivity that are simulated by Monte Carlo model with experiments for 30,000 times, respectively.
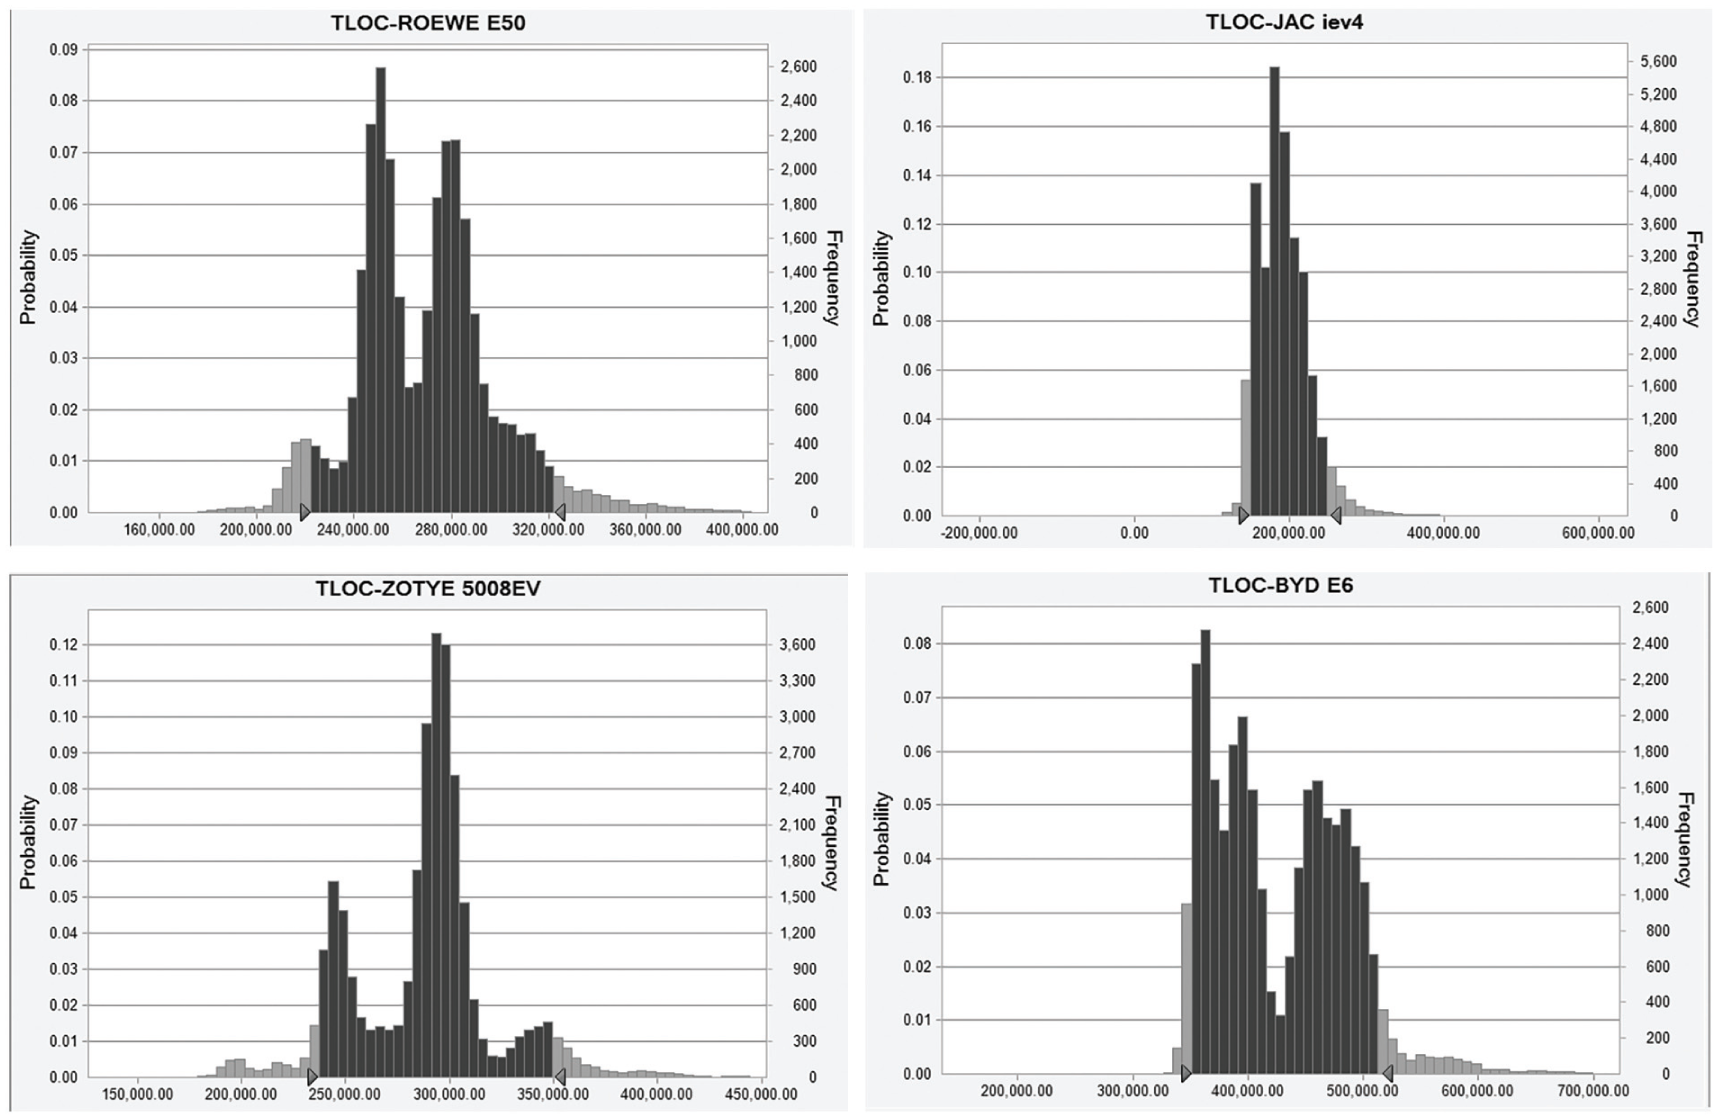
The prediction results of TLOC by Monte Carlo model.
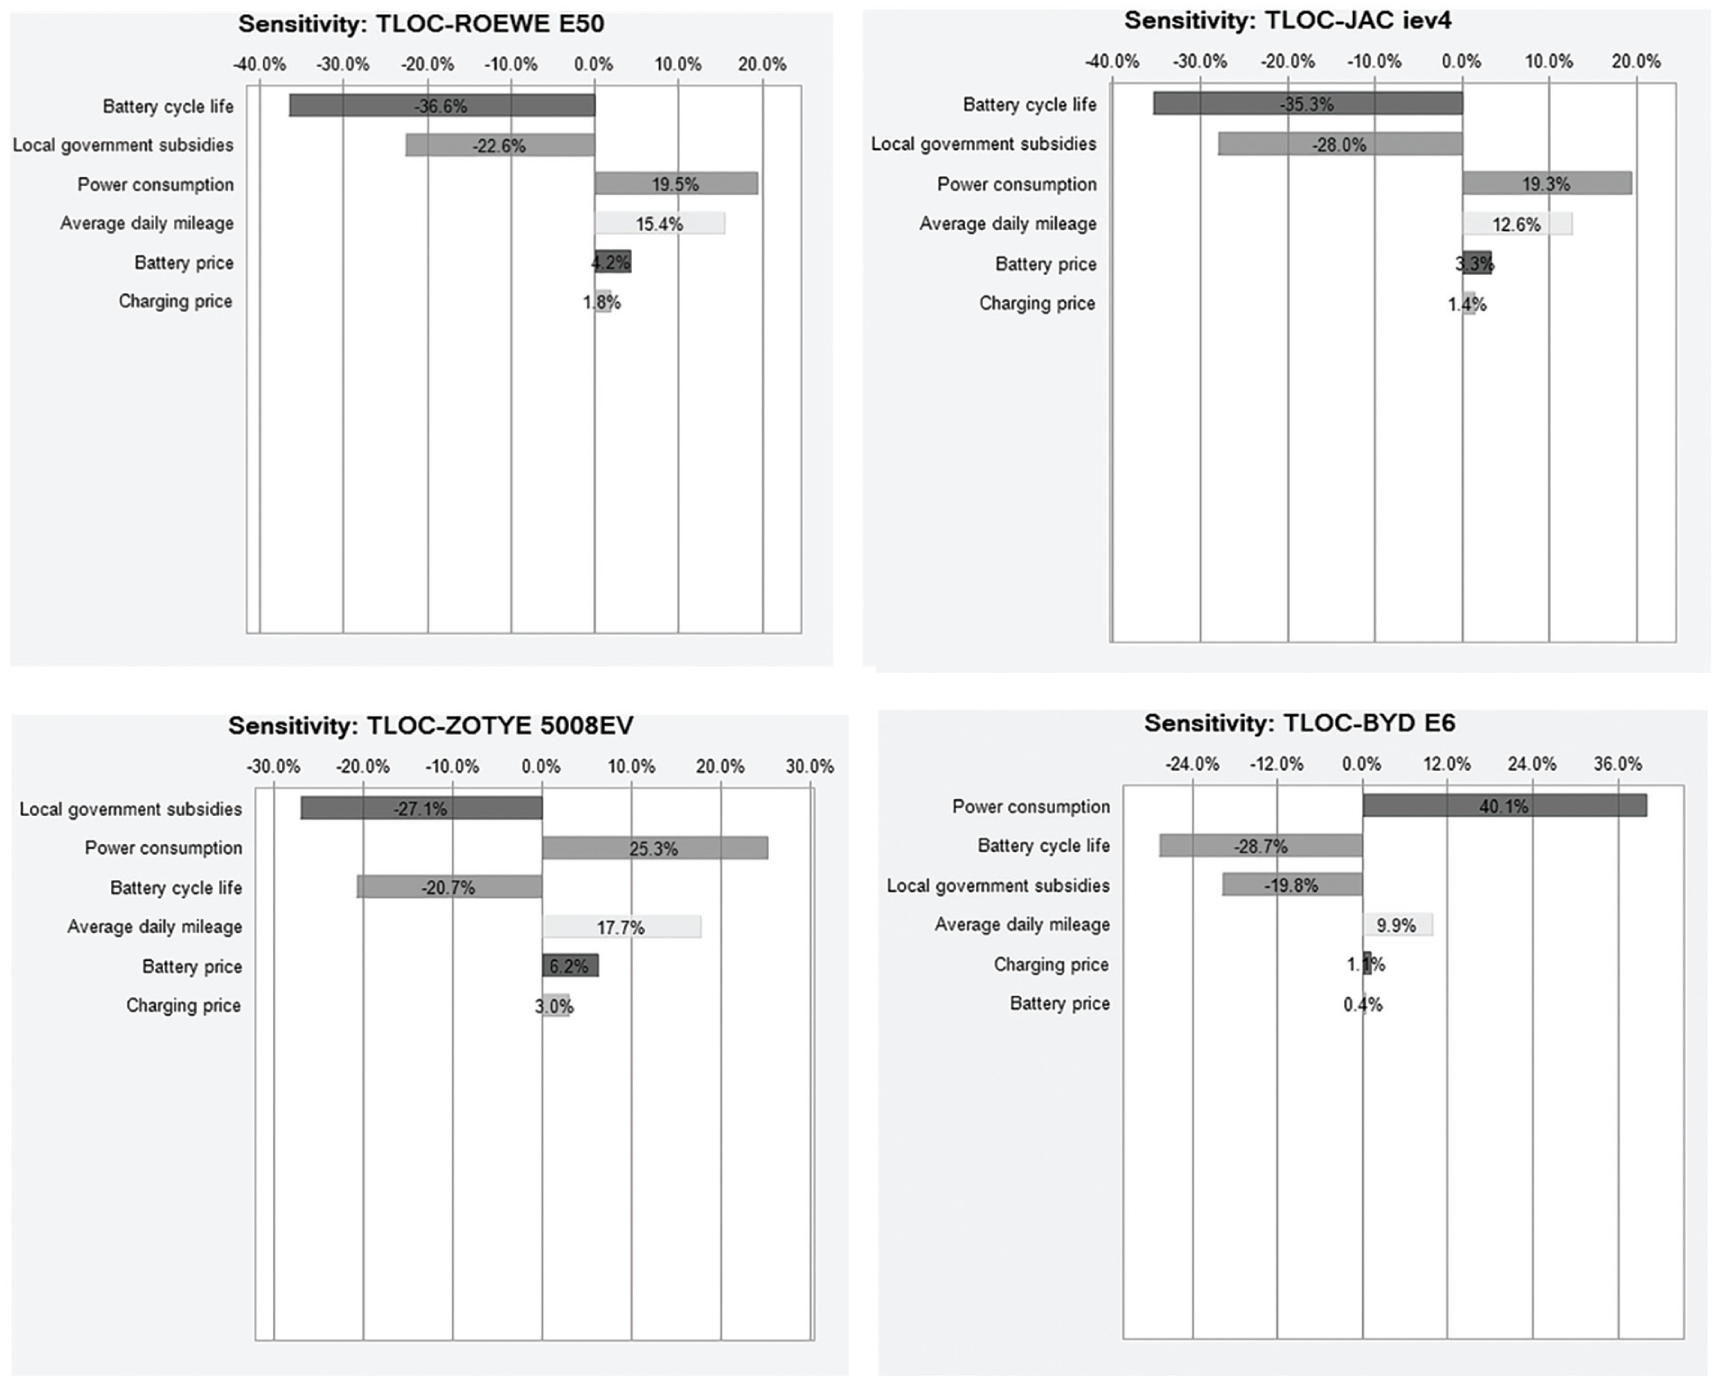
Variables sensitivity simulated by Monte Carlo model.
Ownership cost is most sensitive to battery cycle life and the highest value reaches to 36.6%. The sensitive factors to BEVs total ownership cost in descending order are battery cycle life, local government subsidy, power consumption, average daily mileage, battery price, and charging price. The higher the power consumption of BEVs is, the more sensitive of TLOC to power consumption is. The power consumption sensitivity of BYD E6 is 40.1%.
The results simulated by Monte Carlo model show that the ranges of TLOC within 90% probability distribution for four types of BEVs, ROEWE E50, JAC iev4, and ZOTYE 5008EV, are ¥222,648–¥321,297, ¥149,377–¥249,506, ¥237,308–¥349,617, and ¥352,606–¥514,497, respectively. And the average total lifecycle ownership costs are ¥270,134, ¥193,374, ¥289,030, and ¥427,971, respectively. After 15 years usage, the average total cost of ROEWE E50 has little difference from that of ZOTYE 5008EV; JAC iev4 has the lowest TLOC, which is less than ¥200,000 while BYD E6 has the highest TLOC, which is more than ¥420,000.
Average daily mileage and power consumption have important influence on battery capacity selection, as shown in equation (6). Power consumption mainly correlates with BEV models and urban driving cycles. The power consumptions of ROEWE E50, JAC iev4, ZOTYE 5008EV, and BYD E6 in different driving cycles of Shanghai, Shenzhen, and Hefei are simulated by CRUISE. The average battery mass and energy consumption of four BEV models in the same city is used as the index for the relationship between battery mass and power consumption for the city. The equations are expressed as follows

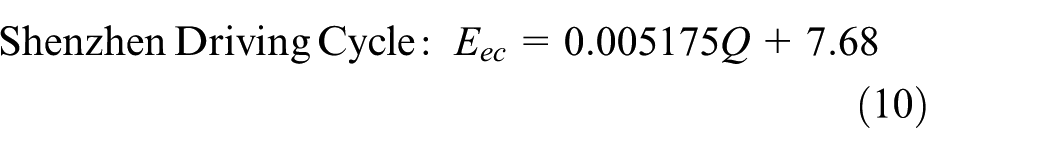

where Q is battery mass in kg.
Now, energy density of battery pack is about 0.11 kWh/kg, 41 and thus the relationship between battery capacity and battery mass is

According to equations (6) and (9)–(12), the critical points of replaced battery capacity for consumers in Shanghai, Shenzhen, and Hefei are 27, 20.5, and 14.5 kWh, respectively. Considering the differences of average daily mileage in different cities, this article suggests that BEVs with different battery capacities 27–32, 21–25, and 15–20 kWh are suitable for Shanghai, Shenzhen, and Hefei, respectively.
Conclusion and policy implications
From the view of TLOC, this article established TLOC model based on three new energy vehicles demonstration cities of different scale represented by Shanghai, Shenzhen, and Hefei. The economic benefit of BEVs compared with CVs was analyzed in a variety of scenarios and then Monte Carlo model was used to explain the sensitivity of variables in total ownership cost model. Eventually, the strategies to choose suitable BEVs for different cities were proposed. Results were as follows:
BEVs have no market competitiveness in basic scenario and local government subsidy scenario. In battery price decreasing scenario and gasoline price increasing scenario, only small car (represented by JAC iev4) can show economic benefits and at the same time, small car and SUV (represented by ZOYTE 5008EV) would be more competitive than others.
Vehicle price and battery replacement cost are the main factors to hinder the development of BEVs. When battery cycle life is about 800 times and battery price is in optimistic scenario, the total costs of vehicle price plus battery replacement cost are between ¥209,551 and ¥457,356. Minimum value of ¥209,551 is more than TLOC of an ordinary A0-Segment CV (small car).
In single-factor sensitivity analysis, TLOC is most sensitive to vehicle price and the sensitivity coefficient is about 0.7, followed by battery capacity and battery price, average daily mileage, charging price and power consumption, and local government subsidy. The bigger the city scale is, the more sensitive TLOC to average daily mileage, power consumption, and charging price is. The sensitivities of local government subsidy, battery price, and battery capacity have obvious difference in different cities scale.
In sensitivity analysis by Monte Carlo, TLOC is most sensitive to battery cycle life, followed by local government subsidy, power consumption, average daily mileage, battery price, and charging price. With TLOC increasing, the sensitivity of local government subsidy will gradually decline. The higher the power consumption of BEVs is, the more sensitive TLOC to power consumption is.
According to different market segments with different urban traffic conditions and consumers’ travel demands, it is suggested that different BEVs should be selected. For example, BEVs with different battery capacities, 30, 25, and 20 kWh, are suitable for use in metropolitan, large- and medium-sized, and medium- and small-sized cities, represented by Shanghai, Shenzhen, and Hefei, respectively. If battery cycle life can reach to 1200 times, there is no need to replace battery during 15 years (the vehicle service life) in Shenzhen and Hefei, which means BEVs are more competitive than CVs.
Footnotes
Handling Editor: Andy Williams
Declaration of conflicting interests
The author(s) declared no potential conflicts of interest with respect to the research, authorship, and/or publication of this article.
Funding
The author(s) disclosed receipt of the following financial support for the research, authorship, and/or publication of this article: This study was supported by Soft Science Foundation of Science and Technology Commission of Shanghai Municipality and Fundamental Research Funds for the Central Universities (kx0170020172681).