
Abstract
Electric vehicles (EVs) are increasingly promoted in many countries to reduce transportation-related greenhouse gas emissions, offering numerous environmental and economic benefits, such as lower tailpipe emissions and operating costs. However, predicting EV adoption entails access to comprehensive data sets. This study introduces a cost-effective alternative by leveraging open-source socioeconomic and demographic (SED) data from census records and machine learning (ML) models. Focusing on high-resolution geography at the dissemination area level, this study examines the association of SED characteristics, urbanization, annual vehicle kilometer traveled (VKT), and charging infrastructure to predict EV adoption. Ensemble ML models, particularly eXtreme Gradient Boosting, achieve superior predictive accuracy (up to 95%), with forward sequential feature selection identifying 18 key features that enhance model performance. Furthermore, Shapley Additive exPlanation analysis indicates that higher education, income, urbanization, and charging infrastructure availability are strong drivers of EV adoption. In contrast, high population density, longer VKT, and extended commuting durations pose barriers. This approach validates the existing determinants of EV uptake and introduces a scalable, reproducible framework for policymakers. This study demonstrates the feasibility of high-resolution spatial forecasting by leveraging publicly available data. In addition, it provides actionable insights to support targeted policies and infrastructure development to accelerate EV adoption.
Electric vehicles (EVs) have emerged as a viable solution to environmental concerns and climate change in transportation ( 1 ). Motivated by technological advancements and the need to reduce transportation-related greenhouse gas emissions, the adoption of EVs has steadily increased ( 2 – 4 ). This increase is supported by various measures, including government policies promoting clean energy ( 5 , 6 ), advancements in battery technology, cost, driving ranges ( 7 , 8 ), and growing consumer interest in reducing carbon emissions ( 4 , 9 , 10 ).
Understanding the factors influencing EV adoption is crucial for policymakers, urban planners, and the automotive industry ( 3 , 6 , 11 ). Accurate predictive models are critical for forecasting future trends ( 12 ) and guiding infrastructure deployment ( 13 , 14 ). Identifying the determinants of EV adoption also enables stakeholders to make informed decisions that support the transition to electric mobility.
The current literature on EV adoption provides a comprehensive overview of various factors influencing this transition ( 3 , 5 – 7 , 9 , 11 , 15 , 16 ). Various studies highlighted the significance of policies, socioeconomic and demographic (SED) characteristics, and national commitments in shaping EV demand ( 6 , 15 , 17 – 19 ). Policies, demographic trends, consumer behavior, and purchasing choices are pivotal in EV adoption ( 6 , 15 – 18 ). These findings emphasize that aligning EV policies with consumer preferences is essential for encouraging broader EV deployment.
Comparative analyses across different regions highlight commonalities in factors influencing EV adoption. Research on the European Union and the US indicates that demographic characteristics, including age, education levels, population density, income levels, subsidies, and taxes, significantly impact EV market penetration ( 5 ). Moreover, exploring EV adoption in a mature market in Norway highlights the effects of SED characteristics, climate conditions (e.g., wind speed, temperature, and precipitation), and charging station availability on EV adoption patterns ( 3 ). These studies suggested that urban areas with high-income and well-educated individuals and more available charging stations tend to support EV adoption. In contrast, high-density areas with lower minimum temperatures and older populations (over 50 years) often have lower EV adoption rates. Similarly, a recent longitudinal study in Canada from 2013 to 2023 found increased consumer awareness of zero-emission vehicles (ZEVs), particularly in understanding charging methods and public charger availability, alongside higher valuations for home and fast charging in 2023. However, persistent confusion about hybrids and unchanged preferences for ZEV drivetrains suggest that awareness and infrastructure improvements alone may not drive sales growth without regulatory support ( 20 ).
Despite these insights, most previous studies on EV adoption relied on primary data collected specifically to predict the likelihood of EV adoption. The dominant approaches include stated and revealed preference approaches ( 4 , 10 , 21 – 23 ). However, this data collection entails substantial costs, effort, and sampling limitations in scope. Therefore, there is a growing need to utilize publicly available data sets (e.g., census data) to predict EV adoption. This facilitates a more cost-effective and comprehensive approach without relying on primary data sets. This approach could offer a practical alternative, expand the understanding, and forecast EV adoption trends.
Machine learning (ML) models are emerging as powerful tools with promising prediction capabilities. Traditionally, ML models have been employed to predict EV adoption by addressing factors such as customer attitudes, SED characteristics, and vehicle-related attributes ( 24 – 26 ). These studies demonstrated that ML models can explain interconnected relationships and offer valuable insights into the determinants of EV adoption by integrating attitudinal factors, including pro-EV attitudes, environmental concerns, and interest in EV technology. Techniques, such as the gradient boosting machine (GBM) and K-means clustering, have examined user preferences and forecast market uptake based on socioeconomic characteristics and vehicle preferences ( 24 , 25 , 27 ). These approaches identified market segments and tailored strategies to different customer groups to understand potential EV adopters.
In addition, ML techniques have been applied to identify EV-related factors, including vehicle range, charging duration, costs, tax incentives, and existing charging infrastructure ( 9 , 11 , 16 , 28 ). These studies reported that ML models can predict EV deployment in the automotive market, supporting strategic planning and market trend forecasting ( 9 , 28 ). Their findings indicated that ML models provide valuable insights into the key parameters influencing EV adoption ( 10 , 11 ), enabling informed decision-making for policymakers and industry stakeholders ( 4 ).
Contributions to the Literature
Previous studies have significantly contributed to identifying the determinants for EV adoption, emphasizing the importance of factors such as income, education, infrastructure, and environmental concerns. However, the reliance on expensive surveys in most studies often limits the scope and applicability of their findings, as outlined in Table 1.
Comparative Analysis of Electric Vehicle Adoption in the Current Literature
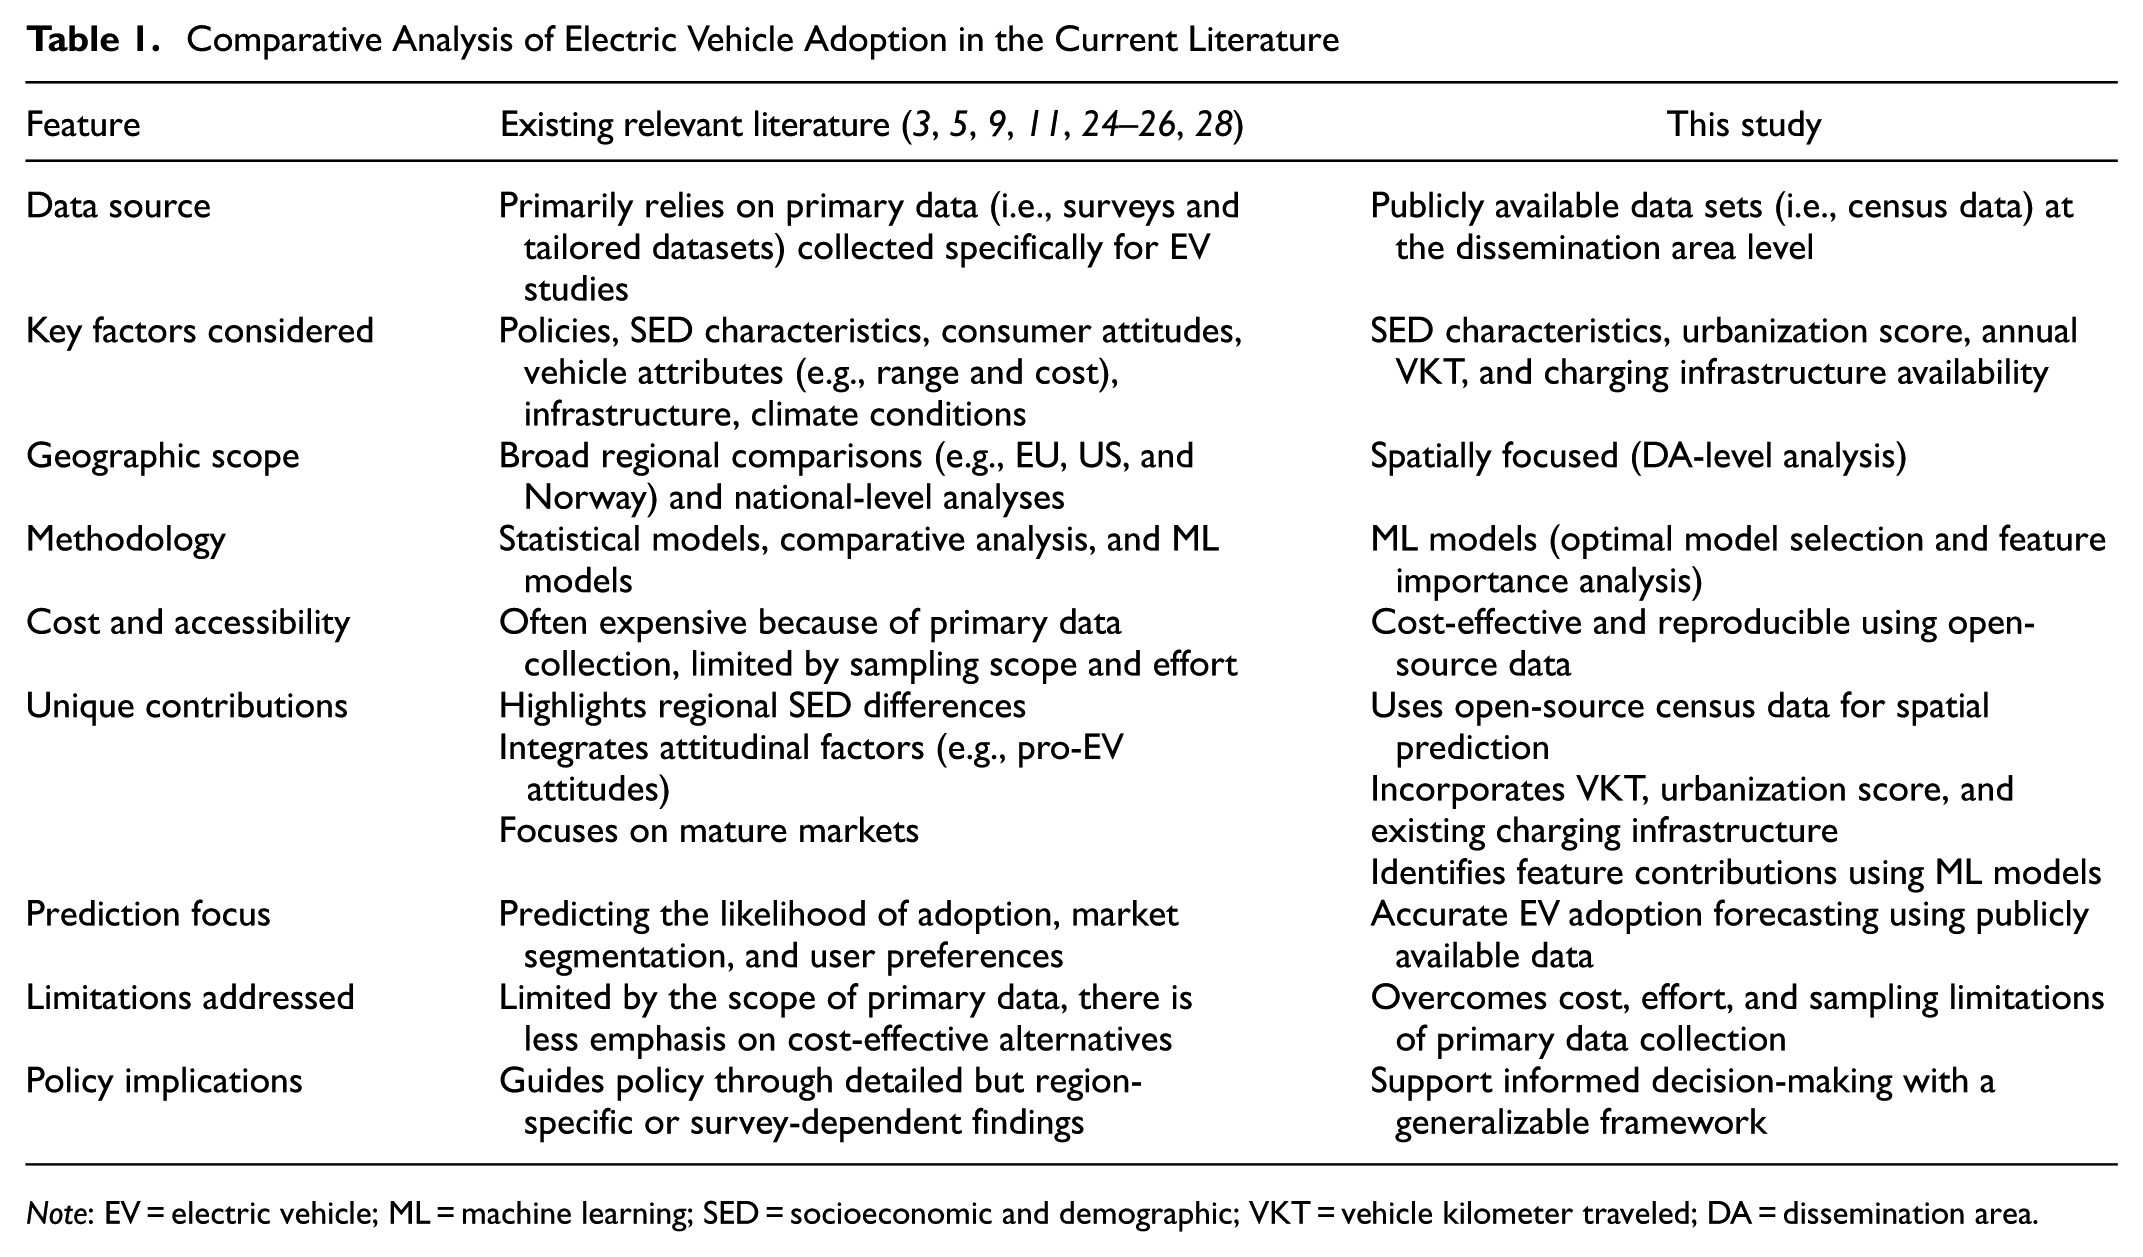
Note: EV = electric vehicle; ML = machine learning; SED = socioeconomic and demographic; VKT = vehicle kilometer traveled; DA = dissemination area.
The comparative analysis in Table 1 highlights that previous research on EV adoption relies heavily on resource-intensive primary data collection and focuses on regional comparisons or attitudinal factors. Therefore, there is a dire need to develop a comprehensive framework that predicts EV adoption using ML models from publicly available data. Although it does not cover all aspects shaping EV adoption decisions, this approach utilizes ML models to provide accurate predictions and valuable insights into the factors influencing EV adoption through readily accessible data, enabling generalization and reproducibility.
Therefore, this study develops a comprehensive framework employing ML techniques to examine the impact of various SED characteristics, urbanization score, annual vehicle kilometer traveled (VKT), and availability of charging infrastructure on EV adoption.
The main contributions of this study include.
Utilizing open-source census data to spatially predict EV adoption at the dissemination area (DA) geographical aggregation.
Addressing the impact of SED, annual VKT, urbanization level, and existing EV charging infrastructure on EV adoption.
Identifying the optimal ML model and determining the contribution of each feature (explanatory variables) and their overall association to predict EVs.
Data and Methods
Data
This study aims to identify the factors influencing the adoption of EVs in Ontario, Canada, using ML models and publicly available census data. According to the 2021 Canadian census data ( 29 ), Ontario spans approximately 0.89 million/km2 and has a population of 14.22 million inhabitants residing in over 5.49 million dwellings. The population is distributed across more than 20,000 DAs.
The SED characteristics for each DA in Ontario were obtained from the 2021 Statistics Canada census ( 29 ), Canada’s most recent census data. Utilizing the SED characteristics for this analysis provides a comprehensive set of explanatory variables at the DA level to understand the factors influencing EV adoption. For instance, Figure 1 shows the spatial distribution of the average household size at the DA level across Ontario. Of note, the Greater Toronto and Hamilton Area (GTHA) refers to the contiguous urban region that includes some of the largest cities and metropolitan areas by population in Ontario. This region includes the Greater Toronto Area and the City of Hamilton ( 30 ).
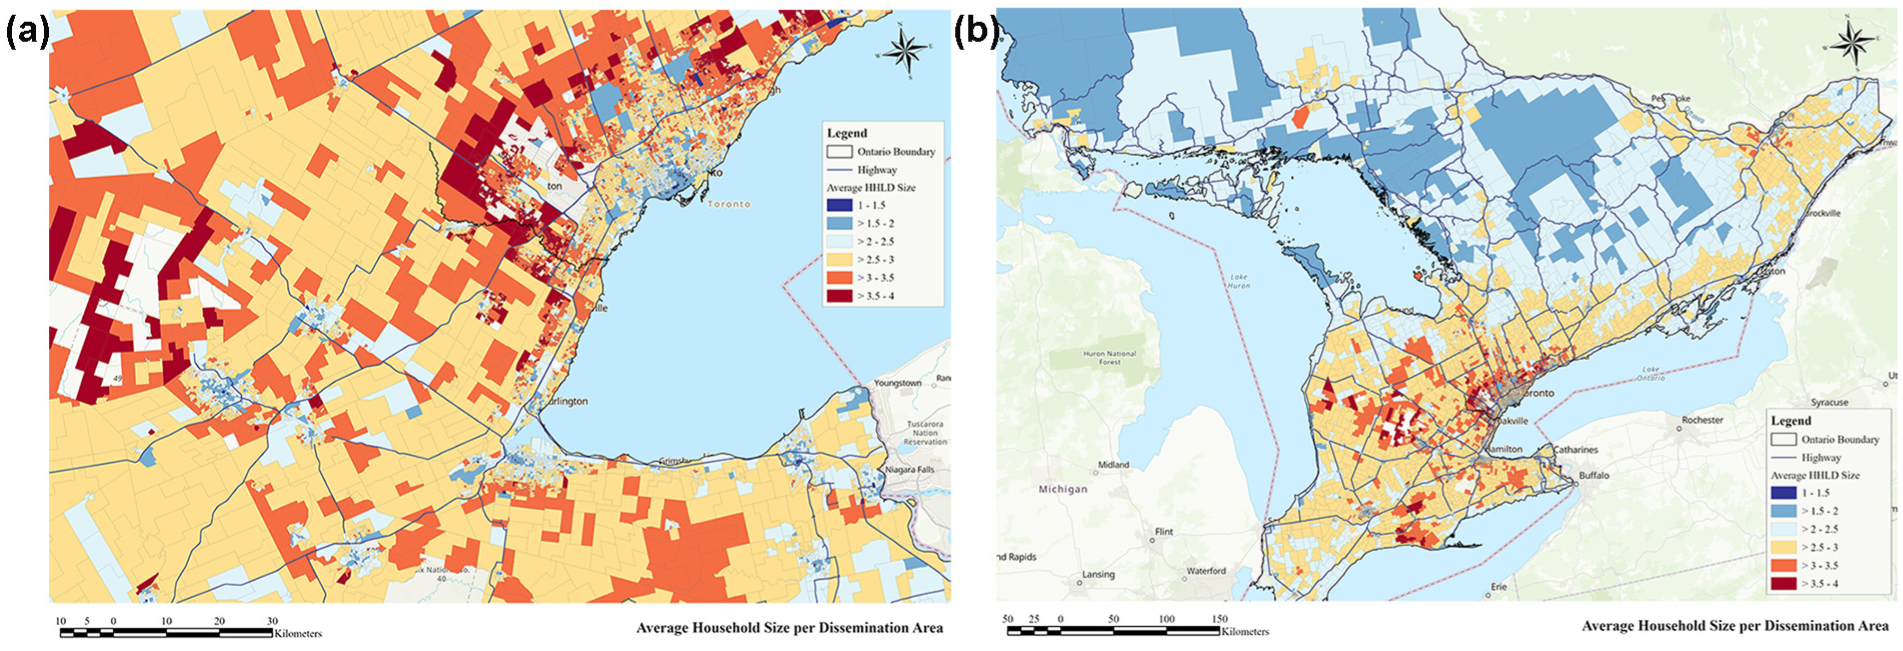
Spatial distribution of average household size across Ontario at the dissemination area level: (a) shows the GTHA, while (b) represents Ontario.
Table 2 summarizes the descriptive statistics for dependent and independent variables used in this study. This model includes population density, age, dwelling characteristics, employment rate, journey-to-work attributes, marital status, total income, dwelling value, and education levels. The maximum population density is 10,696.8 persons/km2, with a mean value of 3,384.3. Some DAs have no recorded population density. The average age per DA is 42.6 years, and the mean employment rate is 54.5%.
Descriptive Statistics of Study Parameters
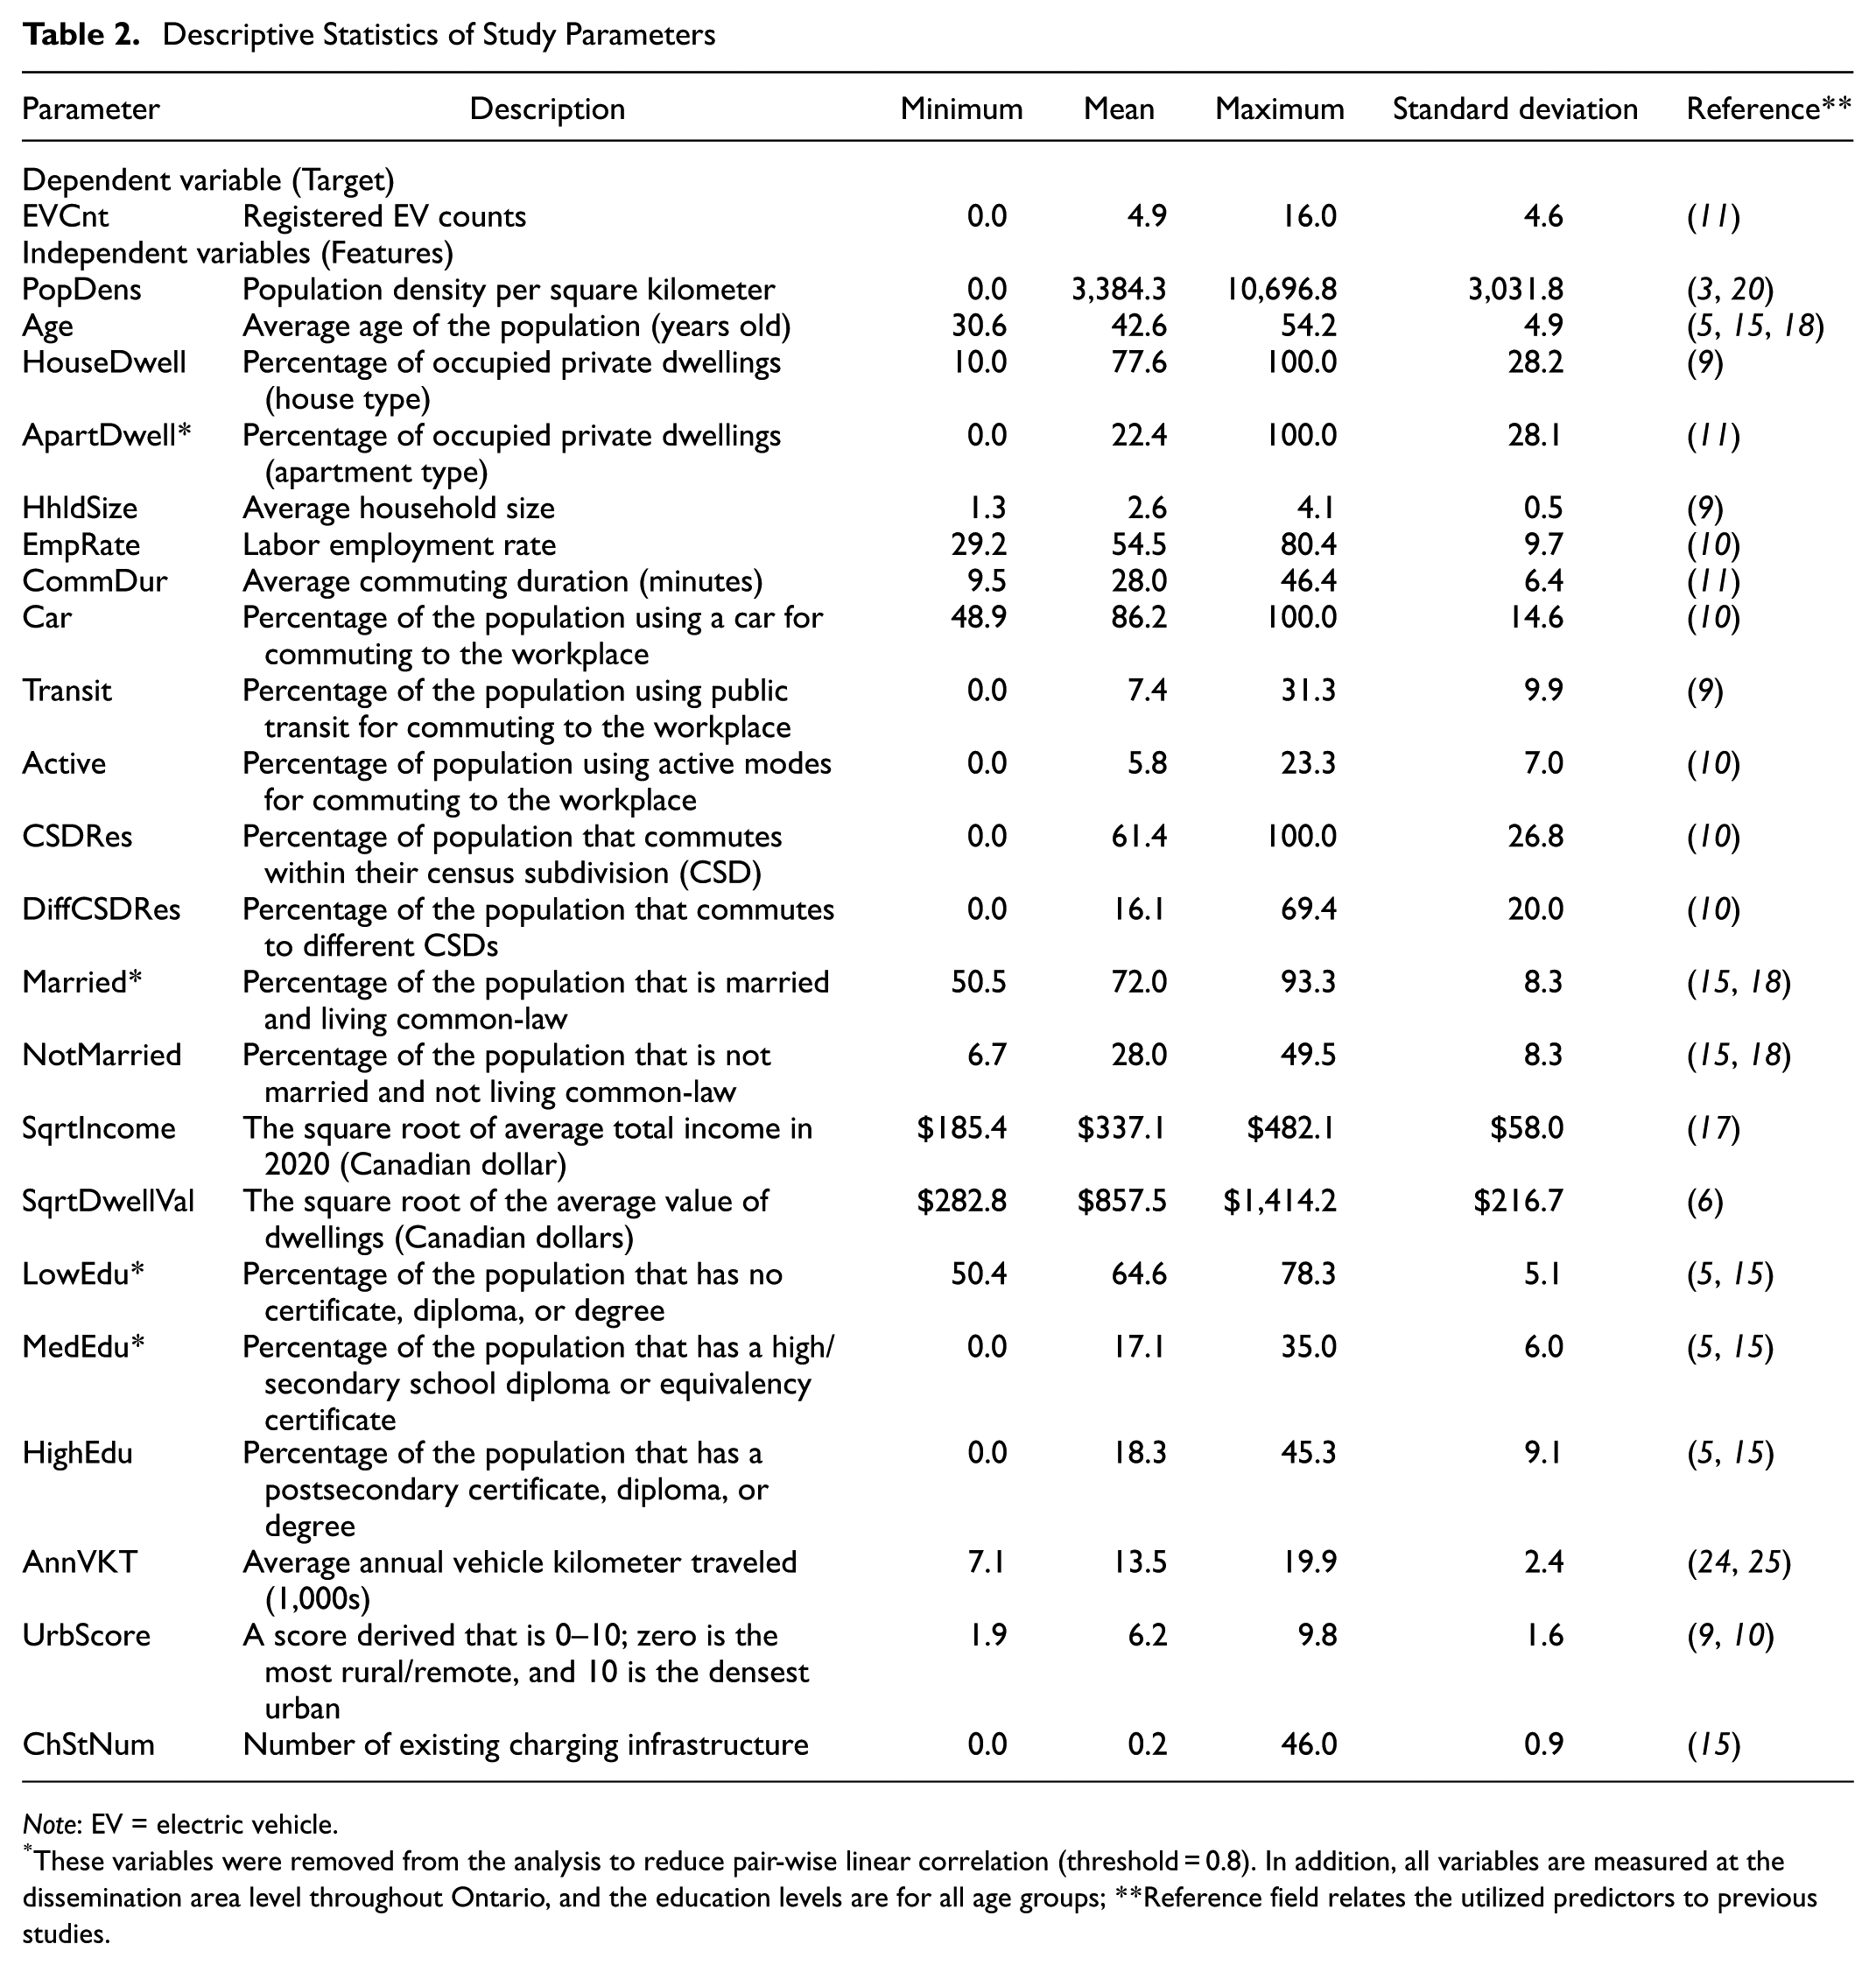
Note: EV = electric vehicle.
These variables were removed from the analysis to reduce pair-wise linear correlation (threshold = 0.8). In addition, all variables are measured at the dissemination area level throughout Ontario, and the education levels are for all age groups; **Reference field relates the utilized predictors to previous studies.
In addition, this study examines the impact of the annual VKT, urbanization score, and the number of existing EV charging infrastructures on EV adoption. Figure 2 shows the distribution of the existing EV charging stations, including Level 2 and DC fast charging technologies, across Ontario ( 31 ). For home charging, this study assumes that home charging can be indirectly measured by considering individuals who dwell in houses (i.e., the HouseDwell variable in Table 2), as they typically have a dedicated garage and access to home charging. This is because home charging data is not publicly available.
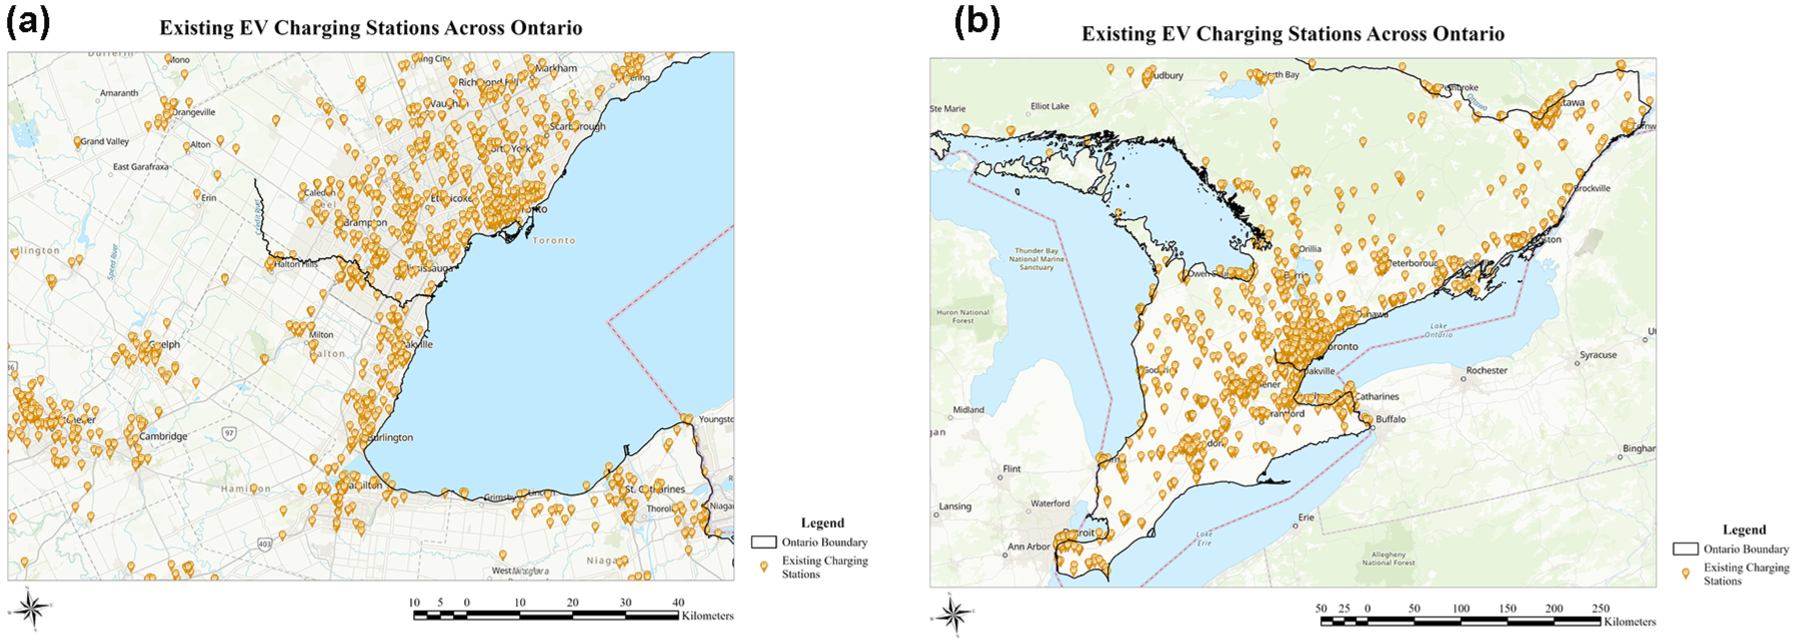
Spatial allocation of existing public electric vehicle charging stations across Ontario: (a) shows the GTHA and while (b) represents Ontario.
The maximum number of existing charging infrastructures and EV counts per DA are 46 and 16, respectively. This indicates that EV adoption in Ontario is in its early stages. For EV adoption, it was predicted from EV registration data (counts) at the DA level. Of note, the urbanization score (0–10) was estimated from multiple census indicators, including population density, housing density, employment rate, commuting patterns, and education levels, that reflect the degree of urbanization in each region ( 10 ).
A correlation analysis is conducted to identify and remove the highly correlated variables (i.e., correlation coefficient > 0.8). Of note, the Transit variable is retained to examine the impact of different transit modes on EV adoption. Figure 3 shows that the correlation values (upper triangle) are not excessively high, allowing for further relationship-based analysis. In addition, the pair plot (lower triangle) in Figure 3 shows nonlinear relationships between the model variables, suggesting that ML models are highly recommended for this analysis. The diagonal presents the distribution of the model variables.
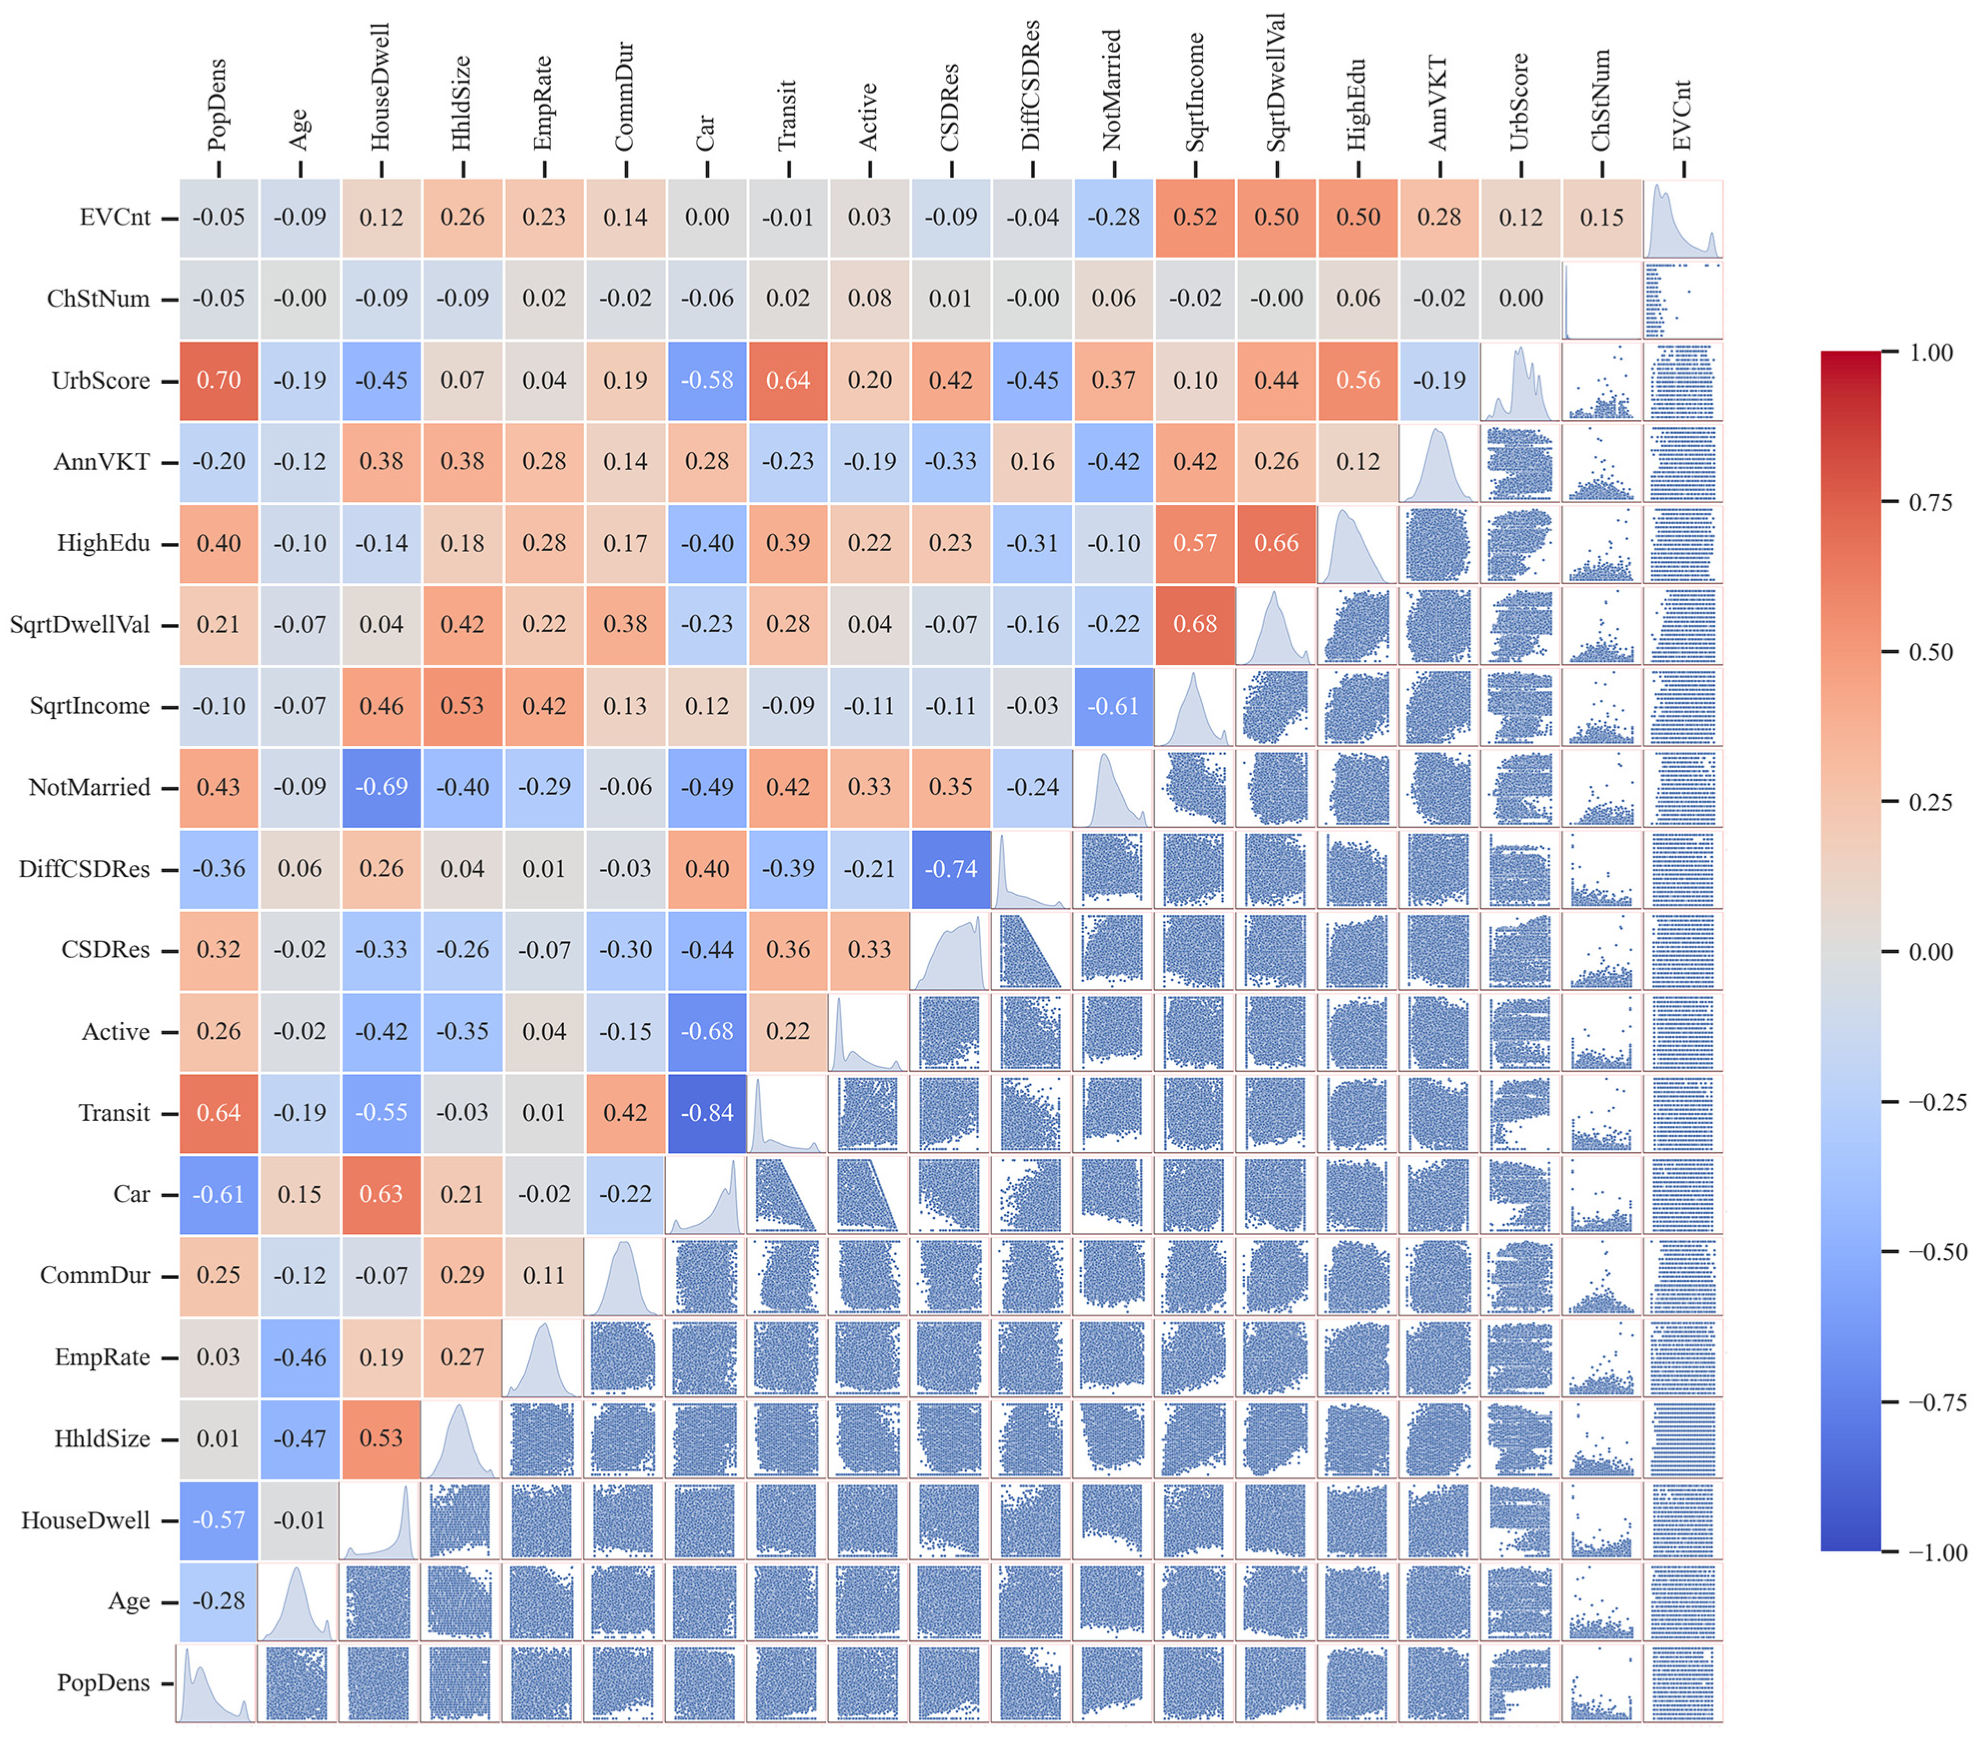
Correlation matrix of model variables.
Methods
This study develops a comprehensive framework for predicting EV adoption using ML models, as shown in Figure 4. The overall aim is to determine the association of several factors, including various SED characteristics, urbanization, annual VKT, and the existing charging infrastructure, to predict EV uptake. The analysis begins with raw data from the 2021 Statistics Canada Census ( 29 ).
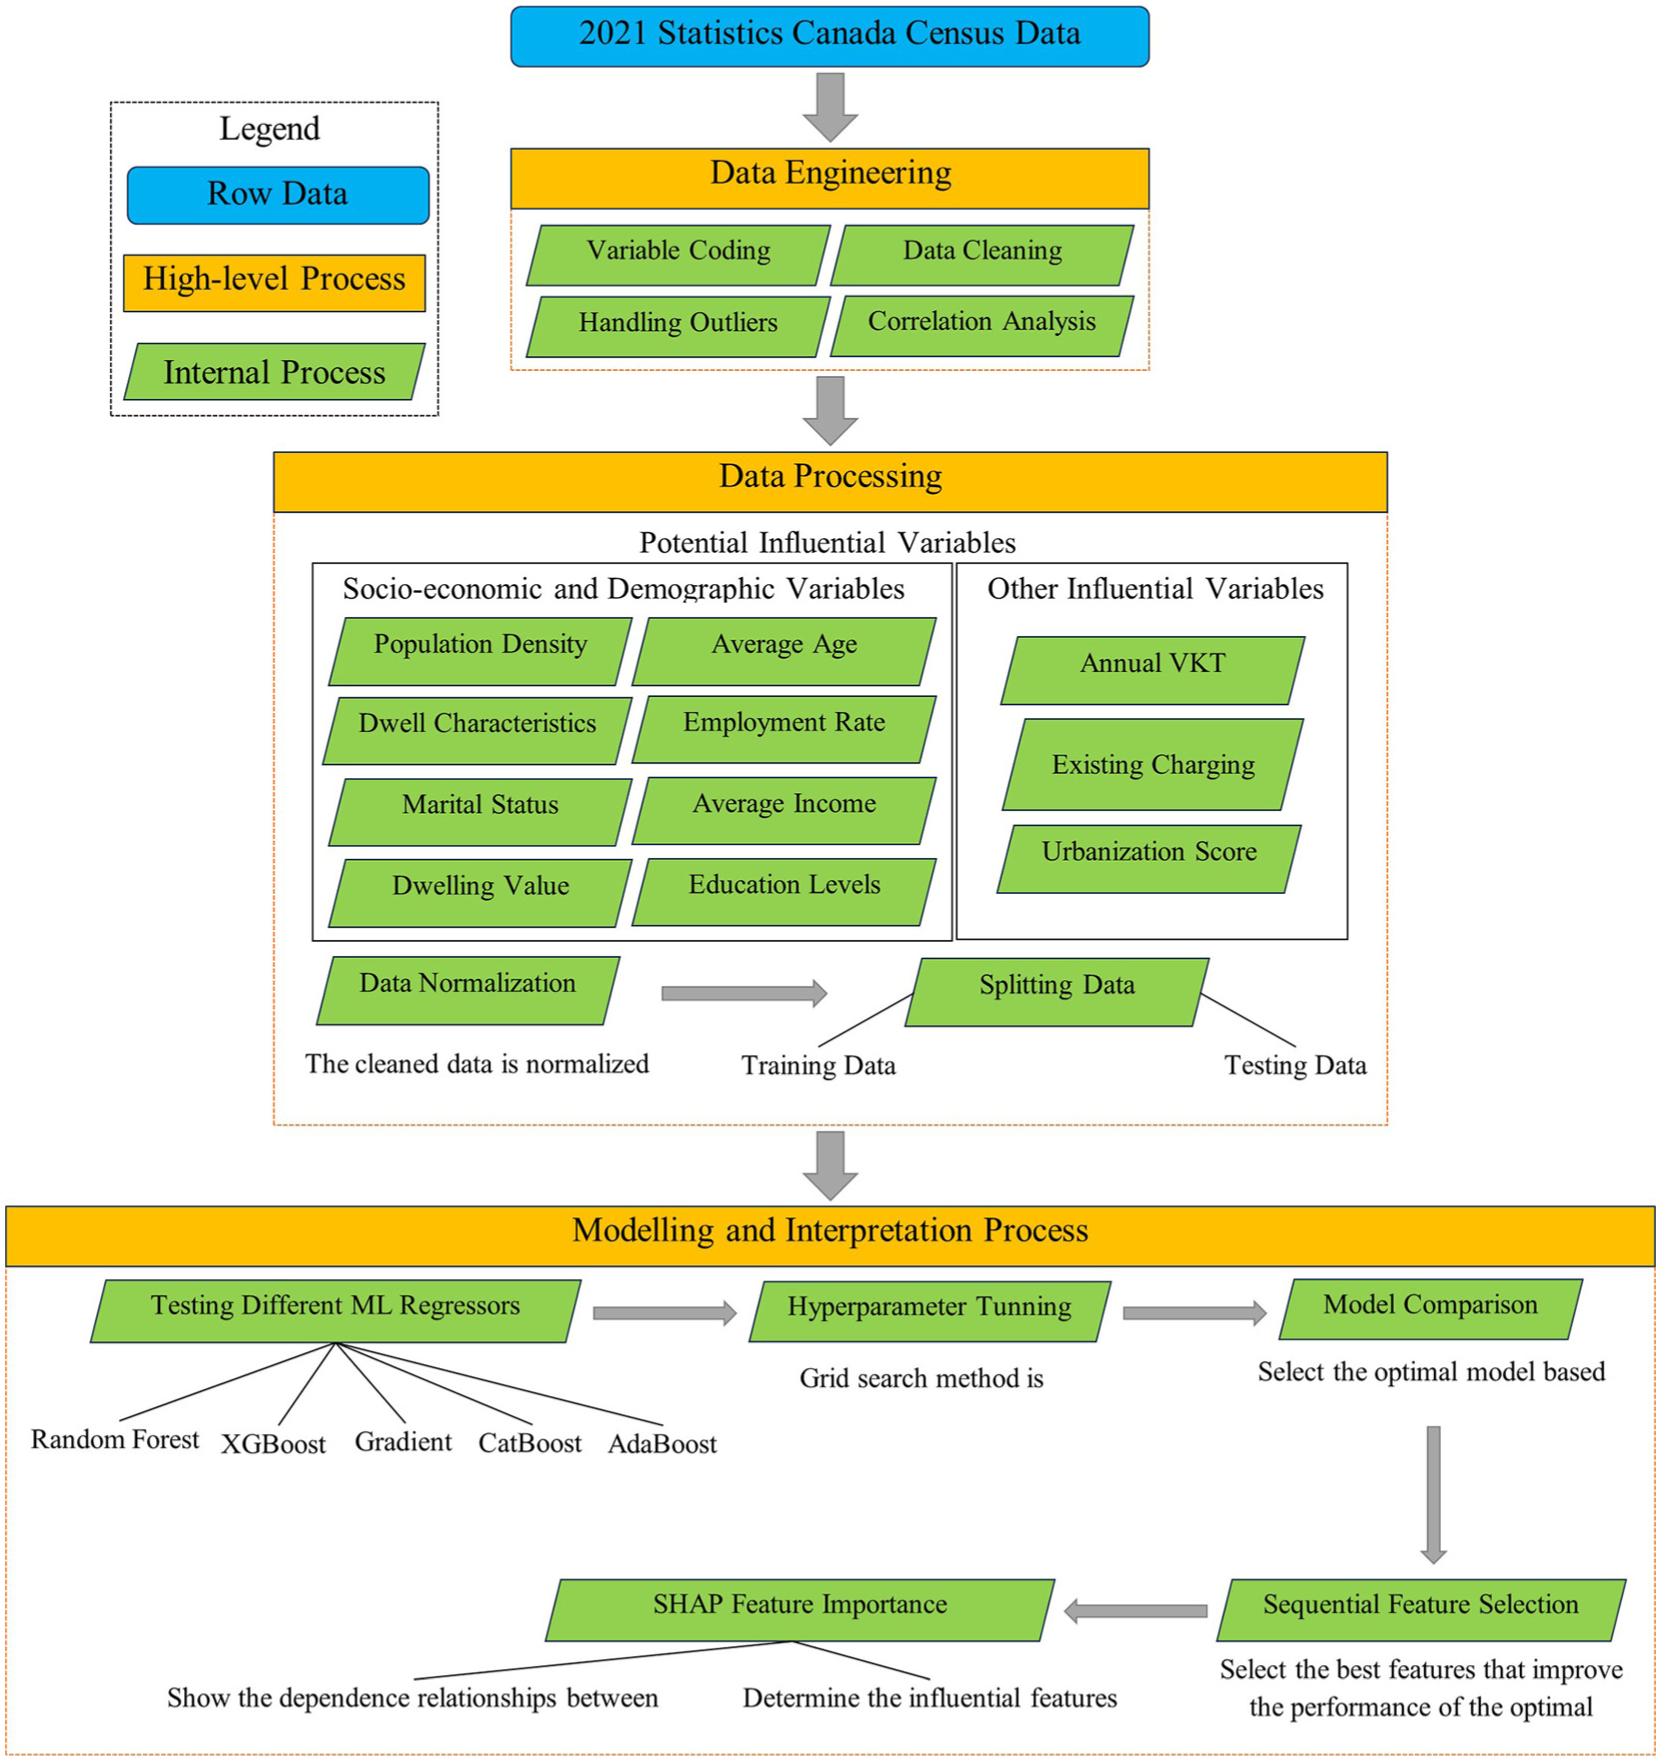
Analytical framework for the proposed methodology.
Several preliminary steps were conducted to prepare the data for modeling. First, the variables were coded, and the raw data were converted into meaningful variables. Then, the data was cleaned by addressing the missing values to ensure reliability. The missing values associated with a variable were replaced with the median of the sample. Outliers were handled using the interquartile range (IQR) method to prevent their impact on model performance. The IQR method starts by calculating
Once the data was cleaned, various SED variables (Table 2) were normalized using a Min-Max scaler, which transforms features by scaling each feature between zero and one to ensure comparability between all variables. The data set was then split into training (70%) and testing (30%) sets to facilitate the model-building and evaluation.
In addition, five ensemble ML models (i.e., Random Forest [RF], eXtreme Gradient Boosting [XGBoost], Gradient Boosting, CatBoost, and Adaptive Boosting [AdaBoost]) were evaluated to identify the most suitable model for predicting EV adoption. Hyperparameter tuning was performed to optimize the parameters of the selected models, enhancing their performance. The tuned models were then compared to select the best-performing one for accuracy and standard errors.
Once the optimal model was identified, a forward sequential feature selection (SFS) was employed to refine the model further by selecting the features based on their importance and contribution to the model’s performance. Finally, Shapley values were estimated using Shapley Additive exPlanations (SHAP) to interpret the significance of each feature, providing insights into how different variables predict EV adoption.
The developed framework utilizes publicly available data to gain insights into EV adoption determinants without relying on expensive surveys. By following this structured approach, the proposed framework ensures a robust and interpretable model that can assist policymakers and stakeholders in understanding and promoting EV adoption.
In this study, the dependent variable (i.e., EV counts at the DA level) was derived from detailed vehicle registration data. The data was aggregated at the DA level to mask personal identifier data. This involves integrating detailed six-digit postal code information with constraints imposed by broader three-digit postal code data, known as Forward Sortation Areas. The estimated EV counts were then mapped to their corresponding DAs using a postal code conversion lookup table, as shown in Figure 5. Of note, EV counts encompass battery electric vehicles and plug-in hybrid electric vehicles. In addition, the registered EV data is based on the same years as the census data.
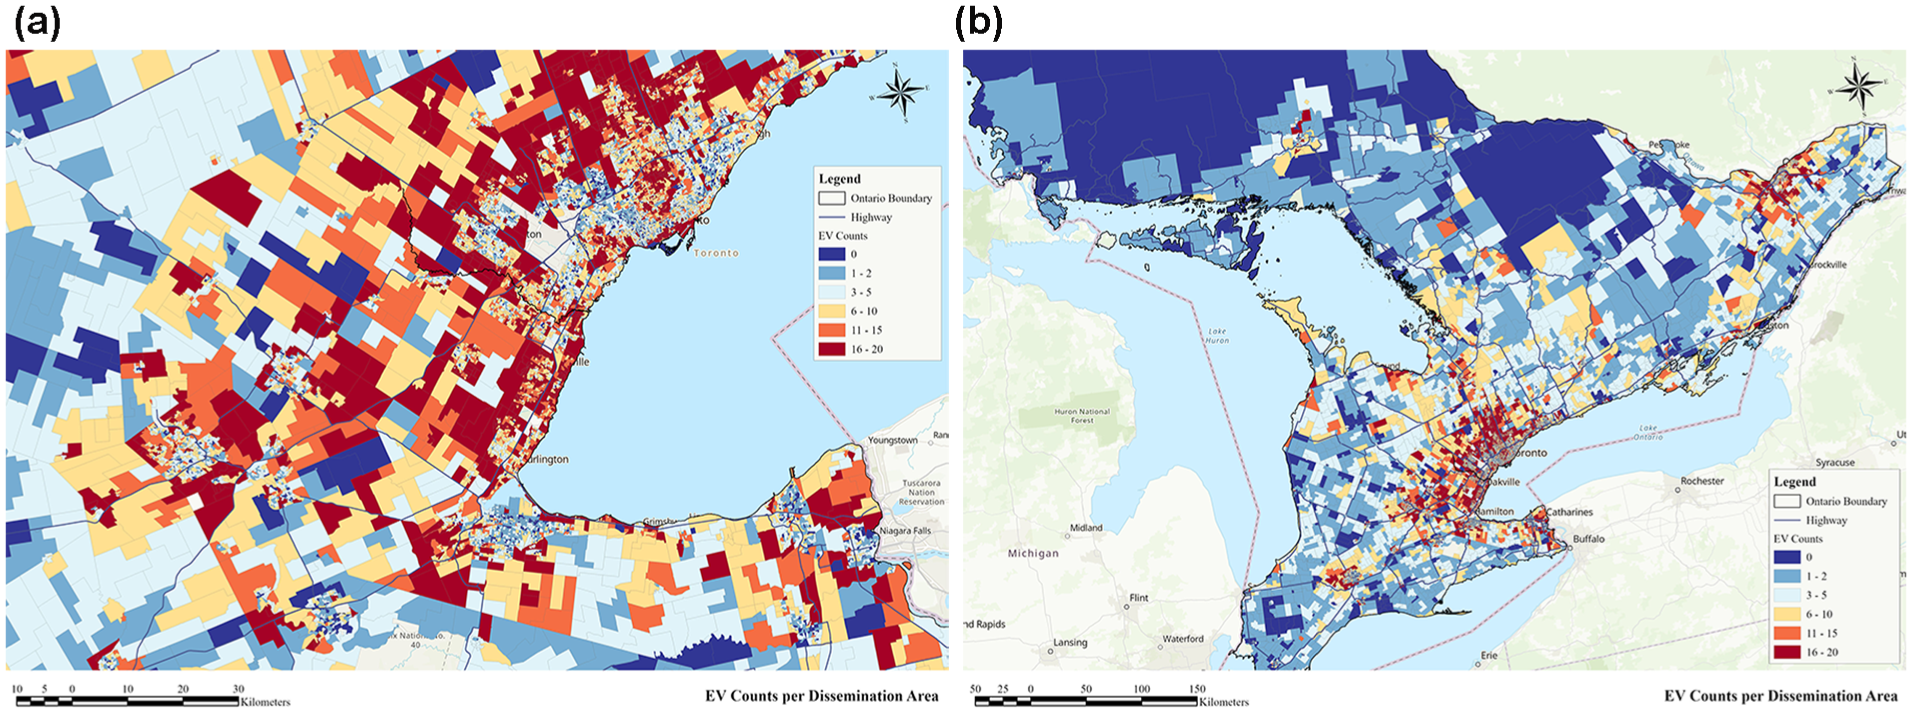
Spatial distribution of electric vehicle counts across Ontario at the dissemination area level: (a) shows the GTHA, while (b) represents Ontario.
Machine Learning Models
This study utilizes and compares ensemble ML methods, including RF, gradient boosting, and extreme gradient boosting, to evaluate EV adoption. These ensemble methods combine predictions from multiple models to enhance accuracy, reduce the risk of overfitting, and improve generalization. Ensemble methods can be categorized into two main types: bagging and boosting. Bagging involves training multiple models in parallel on different subsets of the training data and then averaging their predictions to achieve a final result. In contrast, boosting trains models sequentially, with each new model addressing the errors made by previous models.
The RF method, introduced by Breiman (
32
), employs a bagging approach to perform classification and regression tasks. The RF algorithm starts at the root node with the entire data set, divided into in-bag (training) and out-of-bag (validation) samples. This division allows the evaluation of each predictor variable based on its ability to separate the nodes. The algorithm uses a tree-based approach with pruning and cross-validation to minimize overfitting. Each decision tree in the RF predicts a given input

where
The GBMs are powerful techniques for supervised ML applications ( 33 – 36 ). GBMs construct an ensemble of weak prediction models, typically decision trees, added sequentially to minimize a loss function ( 36 ). Each new model is trained to move toward the negative gradient of the loss function for the predictions to address the errors made by previous models. By adjusting key parameters, such as the number of trees, tree depth, and learning rate, GBMs can achieve high predictive performance.
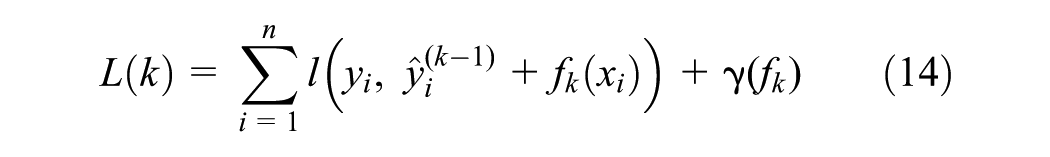
The GBM algorithm starts with a base model, usually the average of the target values for regression problems, as detailed in Equation 2, where

In each iteration


The model is then updated by adding the new weak learner scaled by the learning rate

The eXtreme Gradient Boosting (XGBoost) is an advanced and optimized GBM version known for its exceptional performance and various practical applications ( 35 , 37 , 38 ). XGBoost excels in scalability and processing speed, making it suitable for large datasets and complex problems ( 11 , 35 , 36 , 39 ). XGBoost addresses overfitting and manages the bias–variance trade-off by incorporating bagging–bootstrap aggregation and feature randomness.
XGBoost uses an additive function to predict the target (dependent) variable. Let


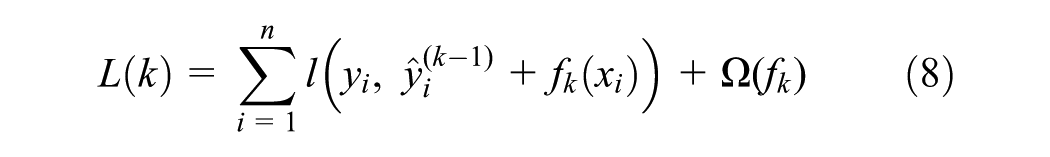
XGBoost uses the objective function in Equation 8 to optimize the ensemble of trees and minimize errors, where

AdaBoost is a boosting algorithm that constructs a strong classification and regression by sequentially training weak learners and adjusting their weights to emphasize incorrectly predicted samples. Unlike gradient boosting, which relies on minimizing a differentiable loss function, AdaBoost assigns higher importance to incorrectly predicted observations.
Given a data set of

The model minimizes the exponential loss function at each iteration, given by Equation 11, where


CatBoost is a gradient boosting algorithm that enhances predictive accuracy while maintaining computational efficiency. Unlike traditional gradient boosting methods, CatBoost utilizes ordered boosting, which mitigates overfitting by ensuring that each data point is based on past observations. In addition, it employs the oblivious trees method, where the same splitting condition is used across all nodes at a given level. This approach leads to better generalization and computational efficiency.
Let
Sequential Feature Selection
SFS is a method used for feature selection or dimensionality reduction in sample sets, aiming to enhance the accuracy scores or improve the performance of ML models on complex datasets. SFS operates in two modes: forward and backward SFS ( 40 ). Forward SFS constructs a feature set by initially having no features and then incrementally adding one feature at a time. The feature that contributes the most to the improvement in prediction model performance, as determined by a specified metric (e.g., R-squared [R2], MSE, or cross-validation score), is included in the set. This iterative process continues until the cross-validation results indicate no further significant enhancement in the model’s performance.
In contrast, backward SFS starts with the complete feature set and progressively removes the least essential feature at each step. Of note, forward SFS is particularly efficient for high-dimensional data because it evaluates fewer features at each iteration ( 40 ). Therefore, this study employs forward SFS to identify the most relevant features for predicting EV adoption.
Mathematically, let

Shapley Additive exPlanations
The concept of Shapley originates from cooperative game theory, introduced by Shapley (
41
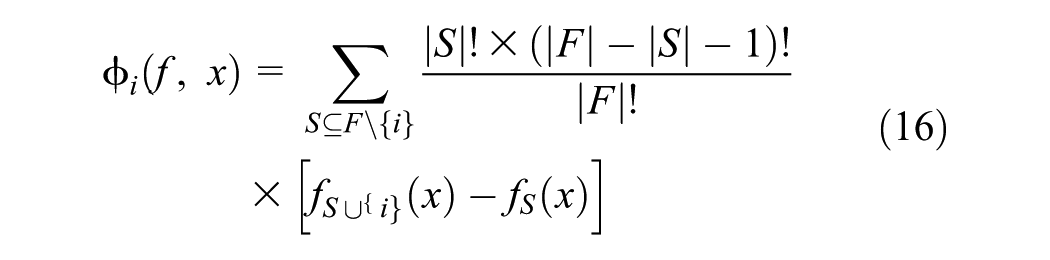
), aiming to fairly distribute the total payoff among players based on their contributions. Therefore, the Shapley value for a player
In ML, Shapley values are employed to identify the contribution of each feature to the model’s prediction using SHAP, proposed by Lundberg and Lee ( 42 ). In brief, SHAP adjusts the concept of Shapley values to explain the importance of features in predictive models. Each feature is treated as a player in a cooperative game where the payoff is the target variable (i.e., the model’s prediction). The aim is to distribute the predicted value among the features fairly, reflecting their respective contributions ( 43 ).
For a given observation
In addition, SHAP values ensure that the sum of all feature contributions equals the difference between the prediction for an observation and the expected value (i.e.,

Therefore, this study employs SHAP to observe the degree of contribution of each feature (i.e., SED characteristics, urbanization, annual VKT, and existing charging infrastructure) and their overall association to predict EV adoption using ML models.
Results
ML Models Performance
The performance of various ensemble ML models (after tuning key hyperparameters) for predicting EV deployment (i.e., EV counts) at the DA level throughout Ontario is shown in Figure 6. Each model is evaluated using four well-known accuracy metrics: MSE, mean absolute error (MAE), Root mean squared error (RMSE), and R2 values on training and testing datasets. Lower MSE, MAE, and RMSE and higher R2 values indicate better performance.
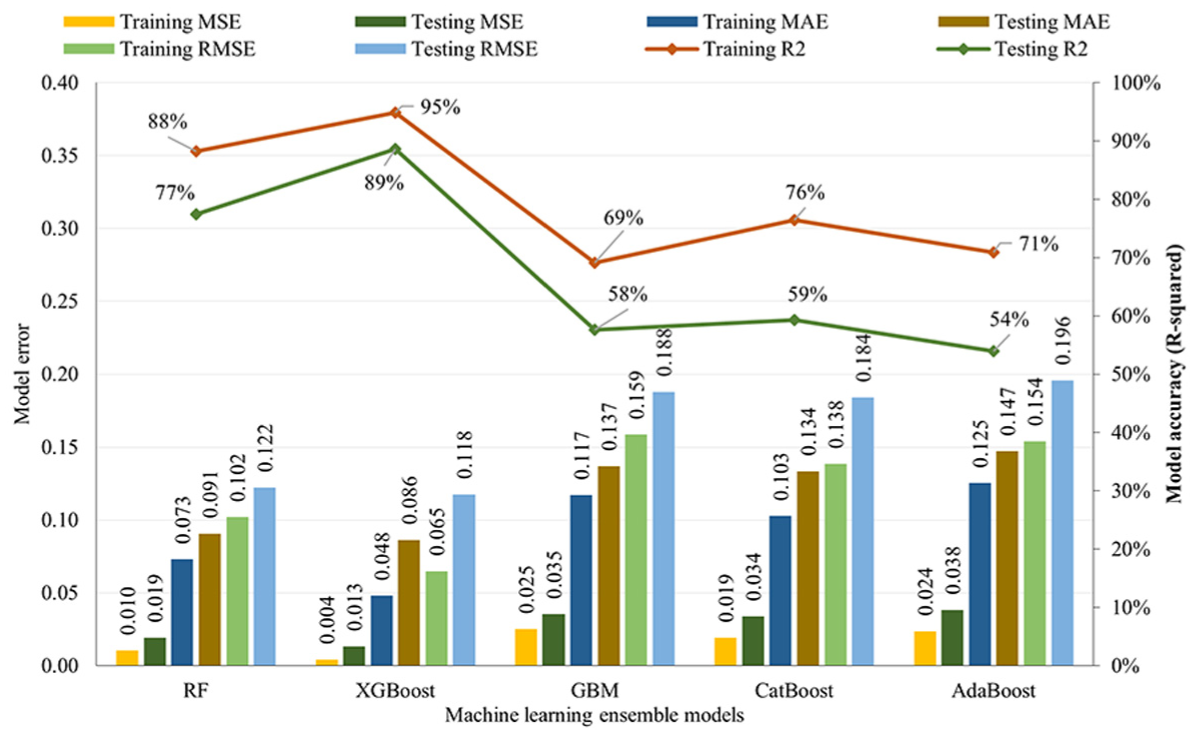
Comparison of performance metrics for all machine learning models.
The results demonstrate the effectiveness of using ensemble ML models to predict EV adoption with satisfactory accuracy. The XGBoost achieved the highest performance across all metrics, with 95% accuracy on the training data set and 89% on the testing data set. Based on these results, the XGBoost model is utilized for the subsequent analysis.
Figure 7 shows the residual distribution and probability density function for the differences between the actual and predicted EV counts at the DA level for all utilized ensemble models. The XGBoost model exhibits the narrowest range of residuals, indicating higher predictive accuracy. Therefore, based on the prediction accuracy results, the XGBoost model is utilized for the subsequent analysis.
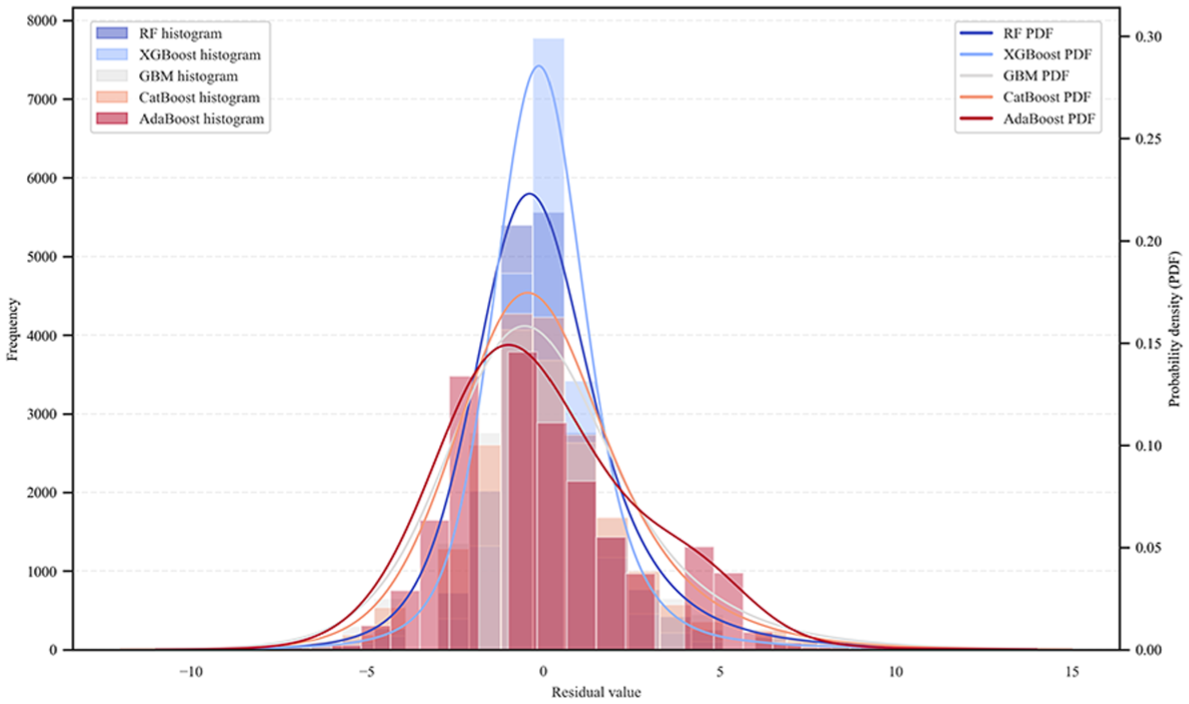
Residual distribution (all models).
Figure 8 shows the spatial distribution of EV counts predicted by the XGBoost model throughout Ontario at the DA level. Compared with the initial EV count representation shown in Figure 4, the findings shown in Figure 9 highlight the effectiveness of utilizing ML models with publicly available census data to predict and map EV adoption spatially. This approach demonstrates the potential of leveraging open-access data for detailed regional analysis and forecasting in EV adoption studies.
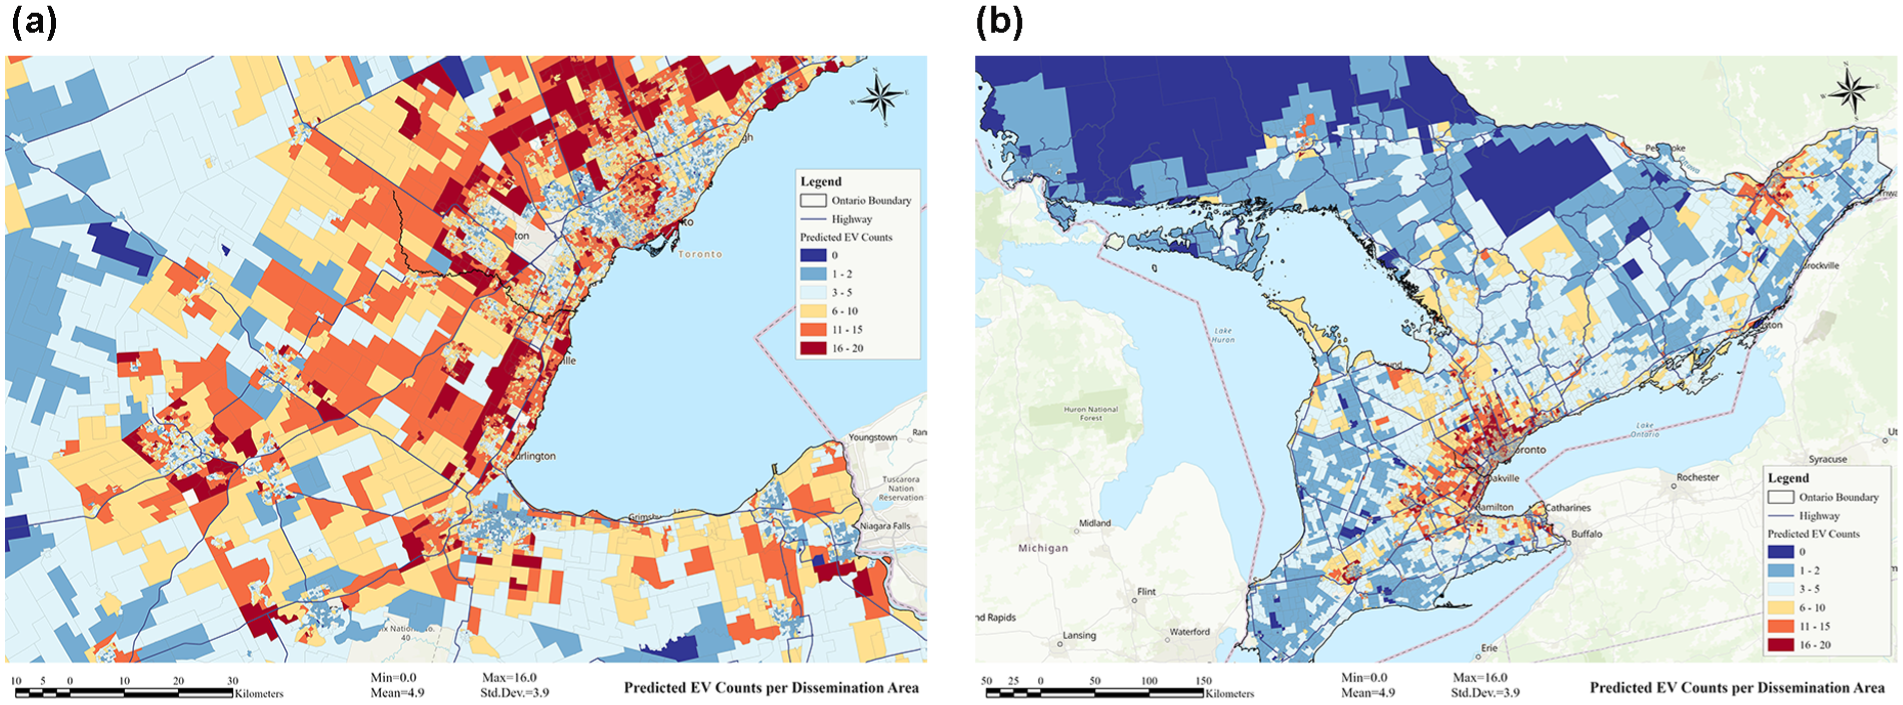
Spatial distribution of predicted electric vehicle counts across Ontario at the dissemination area level: (a) shows the GTHA, while (b) represents Ontario.
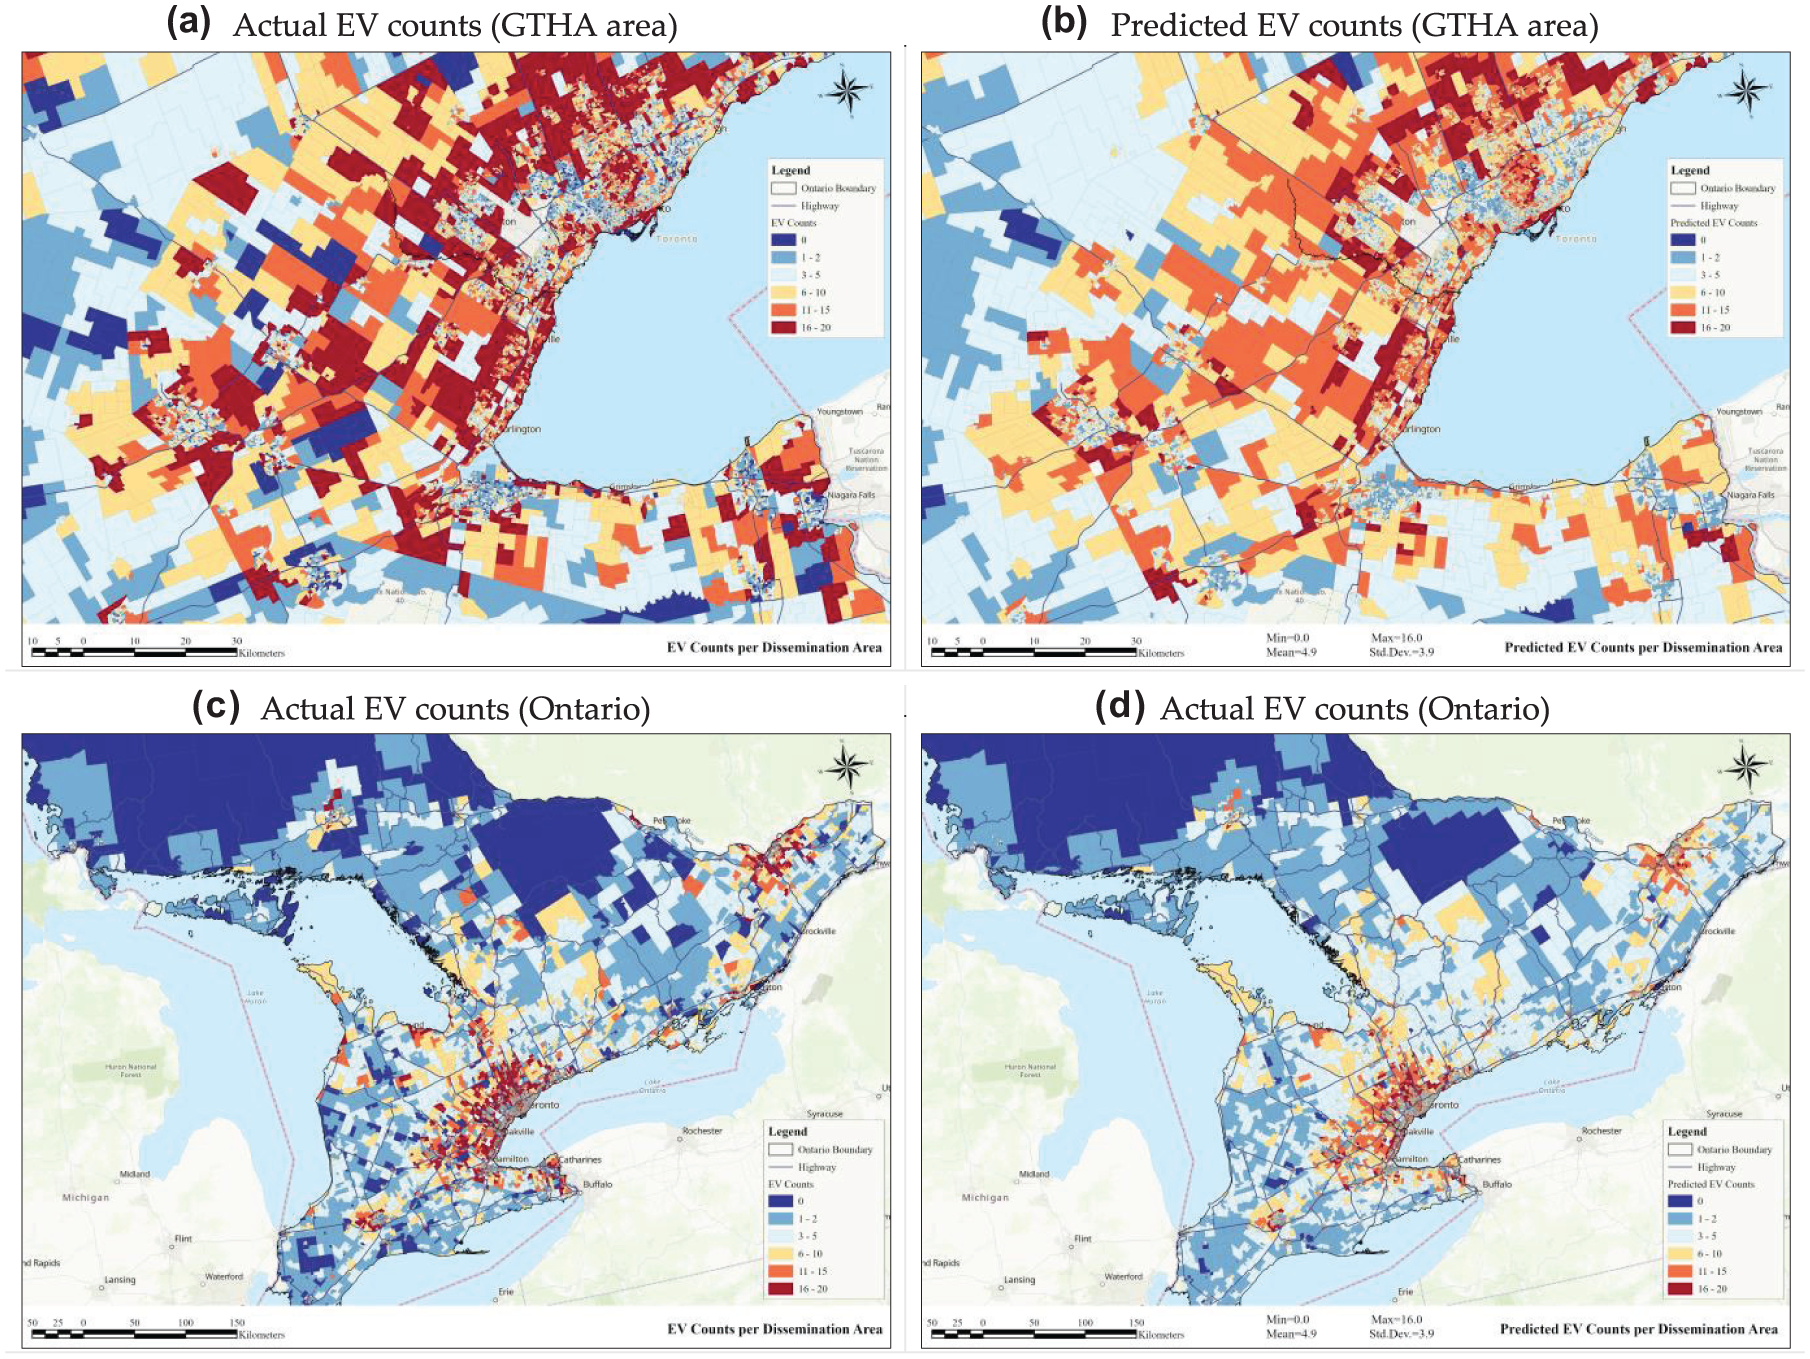
Actual versus predicted electric vehicle counts across Ontario at the dissemination level: (a) represents the Actual EV counts (GTHA area), (b) represents the Predicted EV counts (GTHA area), (c) represents the Actual EV counts (Ontario), and (d) represents the Predicted EV counts (Ontario).
Influential Factors for EV Adoption
A forward SFS was applied to identify the most relevant features that enhance the prediction of EV adoption. Figure 10 shows the results of applying forward SFS to the final predictions of the XGBoost model, using cross-validation to optimize the MSE metric. This process results in 18 key features that significantly improve the model’s performance and are critical to EV adoption prediction.
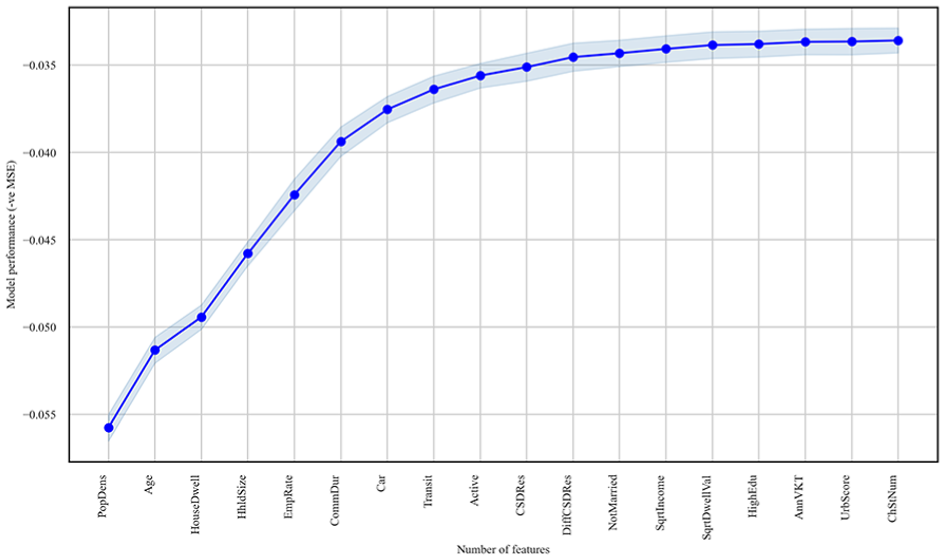
Forward sequential feature selection results—with standard error.
Figure 11 shows the absolute mean SHAP value for each feature, indicating the magnitude of each feature’s contribution to predicting EV adoption at the DA level. Features are ranked in descending order from top to bottom according to their SHAP value, reflecting their importance to the model’s prediction. In addition, the SHAP summary plot shown in Figure 12 clarifies the impact of various features on EV adoption outcomes. The SHAP values are grouped by different features on the y-axis, with color indicating the feature value (red for high and blue for low). Positive SHAP values on the right side of the y-axis indicate a positive impact on EV adoption and vice versa. The features are also ordered by their association with predicting EV deployment at the DA level.
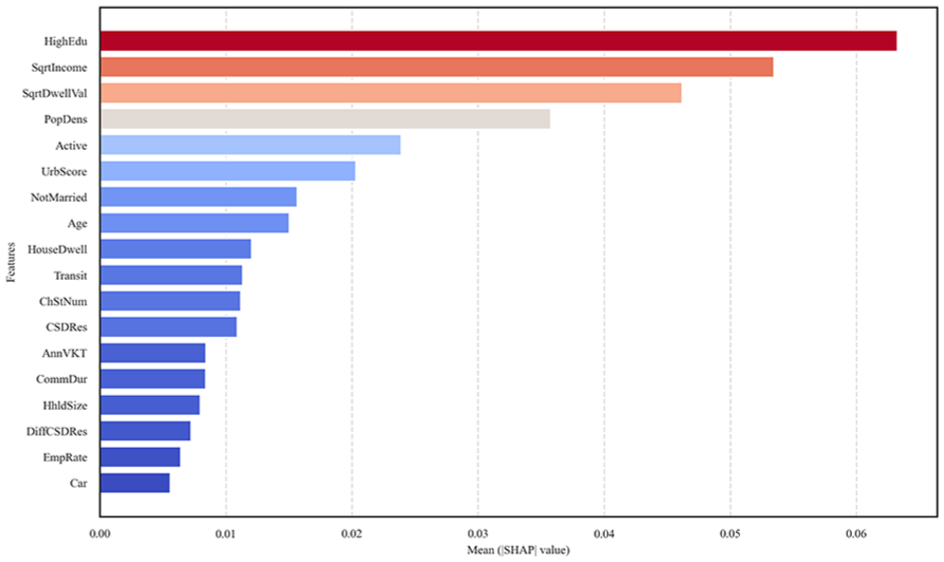
Shapley Additive exPlanations feature importance plot.
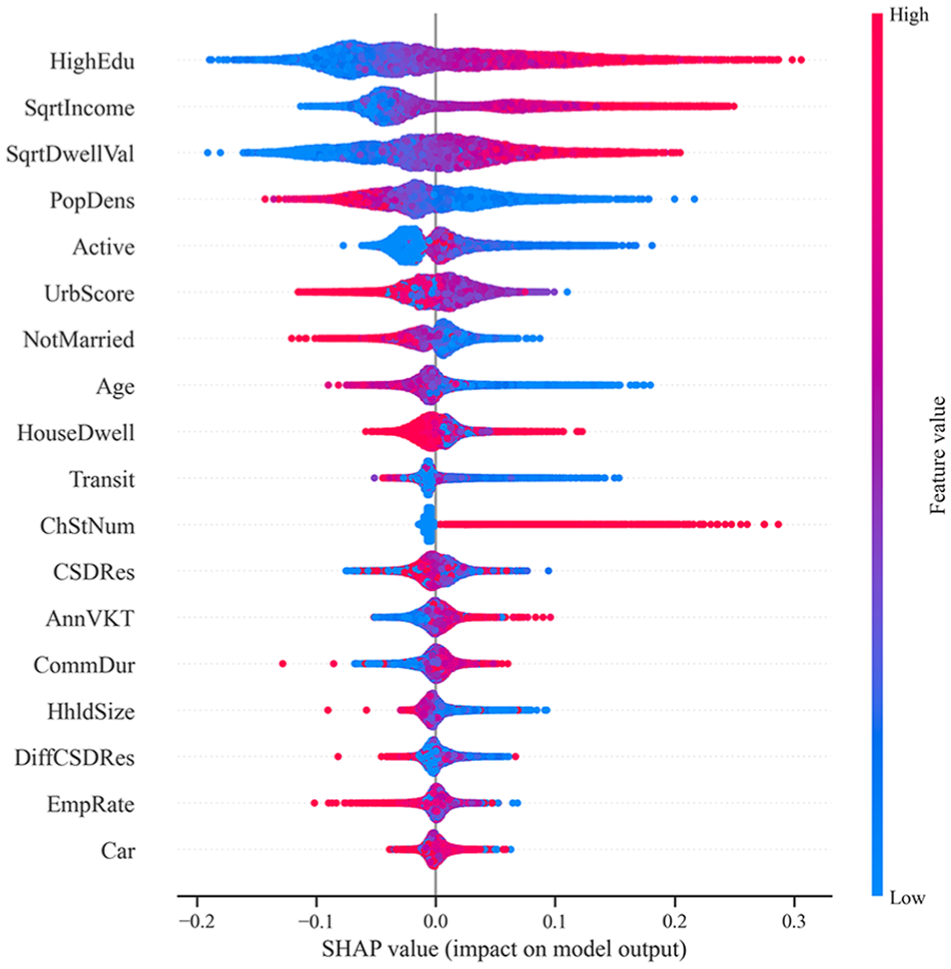
Impact of each feature on the model performance.
The analysis highlights that higher education levels, income, and dwelling values positively correlate with EV adoption, suggesting that wealthy areas with well-educated individuals tend to have higher rates of EV adoption. Similarly, urban areas and better access to active transportation options (e.g., walking or cycling) are positively associated with EV adoption, highlighting the role of urban infrastructure and sustainable transport preferences. In addition, more EV charging stations significantly promote EV adoption by providing the necessary infrastructure and reducing range anxiety.
However, some features show mixed or negative impacts on EV adoption. Higher population density is generally associated with lower EV adoption rates, possibly because of the limited access to public charging infrastructure in densely populated areas (Figure 13). Longer annual VKT and commuting durations have a slightly negative impact on EV adoption, probably because of concerns about EV range limitations.
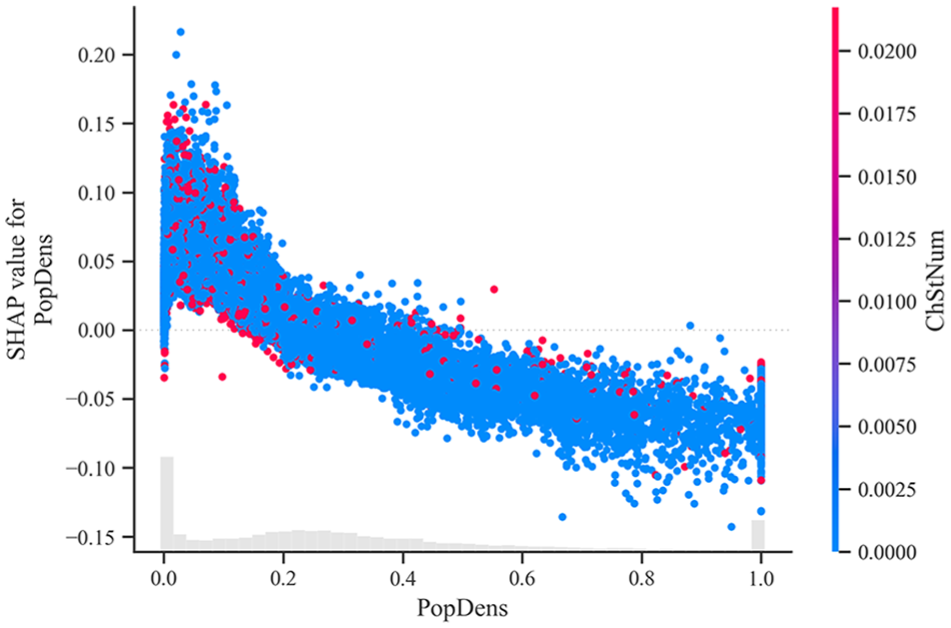
Shapley Additive exPlanations dependence plot—population density and existing charging infrastructure.
Other significant factors include demographics and commuting patterns. Younger populations are more inclined toward EV adoption, possibly because of their willingness to try new technologies (Figure 14). Meanwhile, areas with higher public transit usage or complex commuting patterns are less likely to adopt EVs. In addition, areas with lower percentages of single or non-traditionally married individuals show higher EV adoption rates (Figure 15).
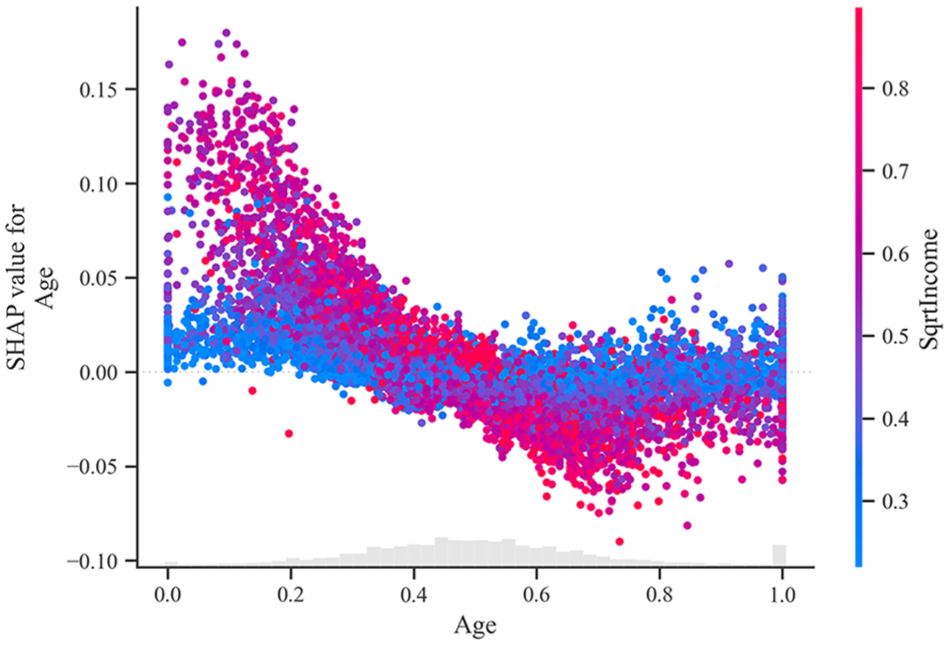
Shapley Additive exPlanations dependence plot—age and average income.
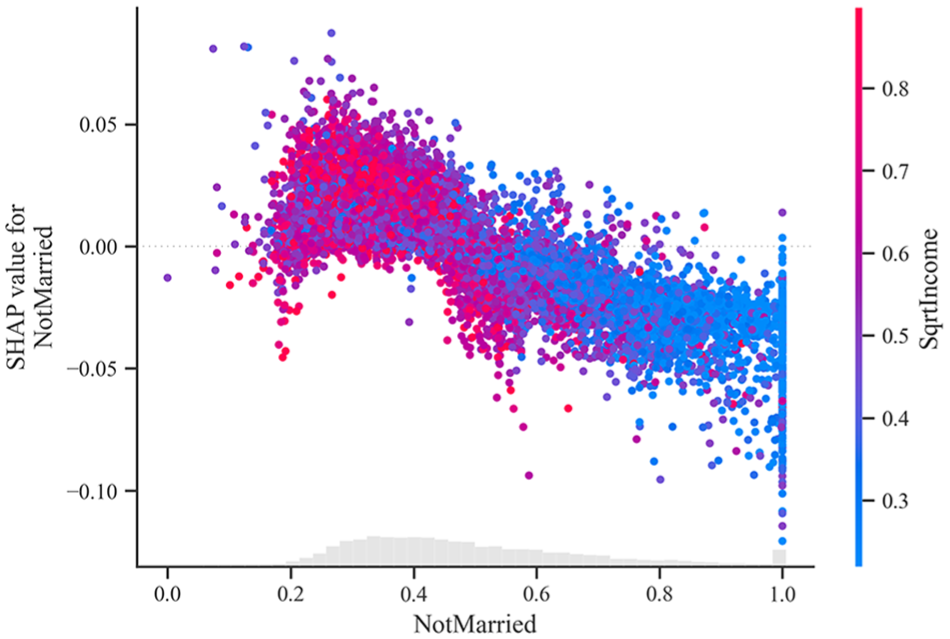
Shapley Additive exPlanations dependence plot—marital status and average income.
The SHAP plots highlight the importance of a multifaceted approach using various SED factors to understand EV adoption. Higher education, income, urbanization, and charging infrastructure availability are vital parameters; other demographic and commuting factors also play crucial roles. The interconnected relationships between these measures highlight the need for targeted policies and infrastructure development to encourage widespread EV adoption, addressing financial and logistical considerations to accommodate diverse populations.
Discussion and Practical Relevance
This study develops a comprehensive framework that leverages ML techniques and publicly available census data to predict EV adoption with high accuracy (95% on training and 89% on testing data sets using XGBoost). Despite relying on open-source data rather than resource-intensive surveys, the results align closely with the findings from previous research. As summarized in Table 1, previous studies consistently identify SED factors, such as income, education levels, and infrastructure availability, as critical determinants of EV adoption ( 5 , 6 , 15 , 17 ). The findings corroborate these insights, demonstrating that higher income, education, and dwelling values positively correlate with EV adoption. These findings are consistent with survey-based studies conducted in regions such as the EU, the US, Norway, and Canada ( 3 , 5 , 20 ). Similarly, the results highlight the importance of charging infrastructure, emphasizing its well-documented role in reducing range anxiety and increasing adoption ( 9 , 11 , 16 , 20 , 28 ).
In addition, this study highlights nuanced adoption patterns consistent with previous research. For instance, the negative correlation between high population density and EV adoption reflects challenges in urban areas with limited access to charging options ( 3 ). Similarly, the higher adoption rates among younger populations align with survey findings highlighting their openness to new technologies ( 15 , 18 ). Urbanization and access to active transportation options further support established links between sustainable mobility and EV uptake ( 9 , 10 ). Other factors, such as longer VKT and extended commuting durations, negatively impacting adoption because of range limitations, are also consistent with vehicle-specific constraints identified in primary data research ( 7 , 11 ).
Unlike traditional studies that rely on costly surveys to assess attitudinal factors (e.g., pro-EV attitudes or environmental concerns) ( 24 , 25 ), this framework achieves comparable predictive performance using open-source data, reducing the reliance on such inputs. This approach does not capture psychological drivers, a limitation of this study; however, it effectively accounts for the core SED and infrastructural determinants highlighted in the literature. Furthermore, using SHAP to quantify feature importance enhances interpretability, linking the findings to survey-based studies by demonstrating how factors, such as education and infrastructure, influence adoption, similar to regression analyses in prior research ( 6 , 15 ). This study validates existing knowledge while demonstrating that publicly available data, combined with advanced ML techniques, can replicate and extend the explanatory power of survey-based research cost-effectively and in a scalable manner.
The proposed framework stands out for its simplicity and practicality. It offers policymakers an accessible and reproducible tool to predict and promote EV adoption without the costs and complexities associated with traditional survey-based approaches. By utilizing open-source census data and a streamlined ML pipeline, this framework enables stakeholders to make data-driven decisions with minimal technical or financial barriers. The high geographical resolution (DA level) and robust predictive accuracy associated with the developed framework make it particularly valuable for urban planners, transportation authorities, and industry leaders seeking to align policies and infrastructure investments with regional needs.
Implementing this framework involves intuitive steps that policymakers can adopt with essential support from data analysts or existing governmental statistical resources. These steps can be summarized as follows.
Data collection: Obtain publicly available census data containing SED variables (Table 2). These data sets are widely accessible, regularly updated, and do not require customized surveys.
Data preparation: Clean the data by addressing missing values and outliers, then normalize variables (e.g., using Min-Max scaler) to ensure comparability. This process can be automated using standard analytical tools, such as Python or R.
Model training: Split the data into training (70%) and testing (30%) sets, then apply an ensemble ML model such as XGBoost, which has demonstrated effectiveness in this study. Prebuilt libraries (e.g., scikit-learn and XGBoost) simplify this process, and hyperparameter tuning can be guided by default settings or minimal optimization.
Feature selection and interpretation: Use forward SFS to identify key predictors and SHAP analysis to assess their association. These methods generate actionable insights, such as prioritizing charging stations in high-income urban areas without the need for deep statistical expertise.
Prediction and mapping: Generate spatial predictions of EV adoption and visualize them (e.g., Figure 8) to identify target areas for intervention. These outputs can be easily integrated with geographic information system tools.
These steps require no proprietary data or costly fieldwork; instead, they leverage publicly available resources accessible to most governments. For instance, policymakers aiming to expand EV infrastructure could use the developed framework to identify high-income, highly educated areas with low charging station density, ensuring that investments align with predicted adoption hotspots. In addition, the reliance on standardized census data enhances the adaptability of the developed framework across different regions and countries with similar datasets.
The developed framework provides a simplified approach to EV adoption forecasting by transforming complex ML processes into a streamlined workflow. This approach eliminates the need for specialized survey teams or extensive data collection phases while delivering results comparable with those of more resource-intensive studies (Table 1). Policymakers can confidently use the developed framework to advance targeted strategies, whether incentivizing EV adoption in affluent urban areas or addressing infrastructural gaps in underserved communities, accelerating the transition to sustainable mobility efficiently and precisely.
An important observation from this model is the role of existing charging stations in EV adoption. This model utilizes existing charging stations as input for predictions; however, the relationship between EV adoption and charging infrastructure density is interdependent. Therefore, there is a chicken-and-egg relationship: more charging stations promote EV adoption, and more EVs necessitate increased access to charging. Therefore, this limitation necessitates future research that develops a well-coordinated strategy to simultaneously expand charging infrastructure in areas where EV adoption is likely to emerge.
Conclusion
In conclusion, this study contributes to the ongoing EV adoption research by leveraging ML models and publicly available data, offering a robust and cost-effective alternative to survey-based approaches. Previous studies identify vital determinants such as education, income, infrastructure, and environmental concerns through primary data; this developed framework achieves comparable predictive accuracy, with up to 95% on the training and 89% on the testing data sets using the XGBoost model, using open-source census data. This approach validates existing findings by analyzing SED characteristics, urbanization scores, annual VKT, and charging infrastructure availability, while offering a scalable, reproducible tool for spatially predicting EV adoption across various regions and countries.
The findings highlight the effectiveness of ensemble ML models, with XGBoost emerging as the optimal choice. Forward SFS identified 18 critical predictors, and SHAP analysis indicates that higher education levels, income, and dwelling values strongly drive EV adoption, aligning with survey-based research ( 5 , 6 , 17 ). Urbanization and access to active transportation options support EV uptake, and increased charging infrastructure mitigates range anxiety, reinforcing the findings from previous studies ( 9 , 11 , 28 ). Conversely, higher population density, longer VKT, and extended commuting durations impact adoption, reflecting the logistical challenges noted in urban areas and range-sensitivity contexts ( 3 , 7 ). In addition, demographic factors, including younger populations and lower percentages of single or non-traditionally married individuals, play pivotal roles, consistent with behavioral trends in the literature ( 15 , 18 ).
Beyond its analytical contributions, the developed framework offers practical value because of its simplicity and accessibility for policymakers. By leveraging open-source data and a streamlined ML pipeline, including data collection, preparation, model training, feature selection, and spatial prediction, this framework eliminates the need for expensive surveys while delivering high-resolution insights at the DA level. This easy-to-implement tool enables stakeholders to identify adoption hotspots, prioritize infrastructure investments, and develop targeted policies, such as expanding charging infrastructure in affluent urban areas or addressing adoption barriers in dense regions. In addition, the reproducibility of the developed framework across different regions amplifies its adaptability to diverse geographical and governmental contexts.
The developed framework does not account for attitudinal and psychological factors, which are significant drivers in survey-based research ( 24 , 25 ); however, its high accuracy and focus on tangible socioeconomic and infrastructural determinants compensate for this limitation. This study bridges the gap between resource-intensive research and actionable policymaking, demonstrating that publicly available data, combined with advanced ML techniques, can extend traditional findings. Furthermore, this study offers a scalable and cost-effective practical solution to support the transition to sustainable transportation by addressing financial, logistical, and demographic considerations that facilitate widespread EV adoption. Moreover, despite the proposed approach highlighting a strong association between charging station availability and EV adoption, it is unclear whether charger availability encourages adoption or if higher adoption prompts increased deployment of charging stations. Therefore, future longitudinal studies or randomized interventions could clarify whether the adoption of charging stations drives EV adoption or vice versa.
Footnotes
Author Contributions
The authors confirm contributions to the paper as follows: study conception and design: Shehabeldeen A., Mohamed M.; data collection: Shehabeldeen A.; analysis and interpretation of results: Shehabeldeen A.; draft manuscript preparation: Shehabeldeen A., Mohamed M. All authors reviewed the results and approved the final version of the manuscript.
Declaration of Conflicting Interests
The authors declared no potential conflicts of interest with respect to the research, authorship, and/or publication of this article.
Funding
The authors disclosed receipt of the following financial support for the research, authorship, and/or publication of this article: The authors would like to acknowledge support from the Natural Sciences and Engineering Research Council of Canada, Grant No: RGPIN-2025-05957.
Code Availability
The developed code will be made available on request.