
Abstract
At present, 3D printed continuous carbon fiber reinforced composites (CCFRCs) are widely used in aviation and automotive fields. Most of the existing research on 3D printed CCFRCs focuses on fiber volume content and rarely explores the specific fiber ply location. However, the latter is one of the most important factors affecting the strength and stiffness properties of materials. In this paper, the constitutive model and progressive damage model of 3D printed CCFRCs are established, concentrating on the fundamental aspects of fiber volume content and fiber ply location. The mechanical properties of 3D printed CCFRCs with different fiber volume content and fiber ply location were studied by tensile tests. The mapping relationship between mechanical properties and fiber volume content and fiber ply location was obtained based on experimental data. In addition, the failure morphology and microstructure of the sample at the fracture section were analyzed, and the failure process under different fiber angles was studied to reveal the failure mechanism. The progressive damage model was used to predict and analyze the performance of 3D printed CCFRCs with different fiber volume content and fiber ply location. The results show that the feasibility and effectiveness of the present model are verified through the comparison between experiment and simulation.
Keywords
Introduction
The momentum of 3D printing technology in the composite materials industry is increasing. 1 Due to the advantages of excellent mechanical properties and strong designability, 3D printed composite materials are widely used in industries such as aerospace, defense, sports, and automobiles.2–4 Continuous wire fabrication is one of the 3D printing technologies,5,6 which is used through the desktop 3D printer MarkTwo by controlling the extrusion trajectory of the continuous carbon fibers in the part as well as the layup sequence. 7 It provides a new idea for the preparation of CCFRCs whose mechanical properties change with changing fiber volume content and fiber ply location. 8
At present, there is extensive research on the mechanical analysis of 3D printed CCFRCs. At the fiber level, some researches.9–12 studied the tensile and bending properties of composite materials by changing the fiber volume content and filling method. Chaco N et al.13,14 believe that the fiber ply location has a certain impact on the tensile mechanical properties of composite materials. Zhengming Huang et al. 15 systematically studied the constitutive equation, deformation, failure and strength of continuous fiber, and short fiber and particle reinforced composites.
In terms of printing technology, Kentaro Sugiyama et al. 16 conducted optimization research on continuous fiber trajectories to obtain composite materials with variable fiber volume fraction and stiffness. Seyed HR Sanei et al. 17 studied the effect of stress concentration during 3D printing on the tensile properties of carbon fiber nylon composites. Arda Özen et al.18–21 prepared samples with different printing process parameters through using FDM technology, studied the effects of layer thickness and fiber overlap rate on the mechanical properties of the specimens, and conducted tensile analysis of the printed samples prepared under different standards. Mahmoud Moradi et al. 22 systematically investigated the effect of the filling mode (IPs) on the specific mechanical response of parts manufactured by melt deposition modeling (FDM), revealing the correlation between the mechanical properties of the material and the print filling mode. Nathalie Ramos et al. 23 analyzed the effect of different filling characteristics on the heat transfer of the material, and accurately predicted the stress.
In terms of the structural characteristics of 3D printed CCFRCs, some researches.24–26 evaluated the elastic properties of fiber reinforced composite materials and predicted the elastic properties using the average stiffness (VAS) method, and a new method is proposed to study the failure of engineering structures through comparative analysis of different 3D printing topologies. GOH et al. 27 compared the damage and failure mechanisms of carbon fiber reinforced and glass fiber reinforced composite materials. Khalid Saeed et al. 28 used the average stiffness (VAS) method to evaluate the elastic properties of fiber reinforced 3D printing composites with different fiber volume content.
The above studies have investigated the mechanical properties, stress concentration, damage and failure mechanisms, and interlayer adhesion of 3D printed CCFRCs from different perspectives. However, the arrangement of fiber ply location has not been integrated into the material constitutive model to study the effects of different fiber volume contents and fiber layer positions on the mechanical properties of 3D printed CCFRCs. In addition, the constitutive model of 3D printed composite materials with variable fiber volume content and location has not been established. 29
Therefore, in this paper, a constitutive model of 3D printed CCFRCs with different fiber volume contents and different fiber ply location was established through extensive performance tests on the stiffness and strength. The tensile damage process of the specimens under different fiber orientations was investigated, and the interface morphology and failure mechanism were analyzed by observing the fracture interface and microscopic morphology of the tensile specimens. A progressive damage model with two-dimensional Hashin damage model was established to predict the damage evolution of materials, which provided support for the design and mechanical analysis of controllable 3D printing composites.
Experimental procedure
Materials and equipment
The MarkTwo 3D printer was used in this study, as shown in Figure 1. The working process of the extrusion head is shown in Figure 2.
30
There are two print heads for short fiber reinforced nylon onyx (matrix material) and fiber reinforcements (carbon fiber, Kevlar, and glass fiber). In this paper, continuous carbon fiber is chosen as the reinforcing material with a density of 1.4 g/cm3 and a diameter of 0.35 mm. The matrix material is a mixture of nylon and microcarbon fiber with a diameter of 1.75 mm.31–33 Mechanical loads and shocks can be applied as its high Young’s modulus and tensile strength. In addition, the onyx can withstand high temperature environments (300°C). Onyx combines the toughness and durability of nylon with the dimensional stability and high strength of composite materials and is considered one of the most powerful 3D printing plastics.34,35 MarkTwo 3D desktop printer. 3D printer working principle.
33


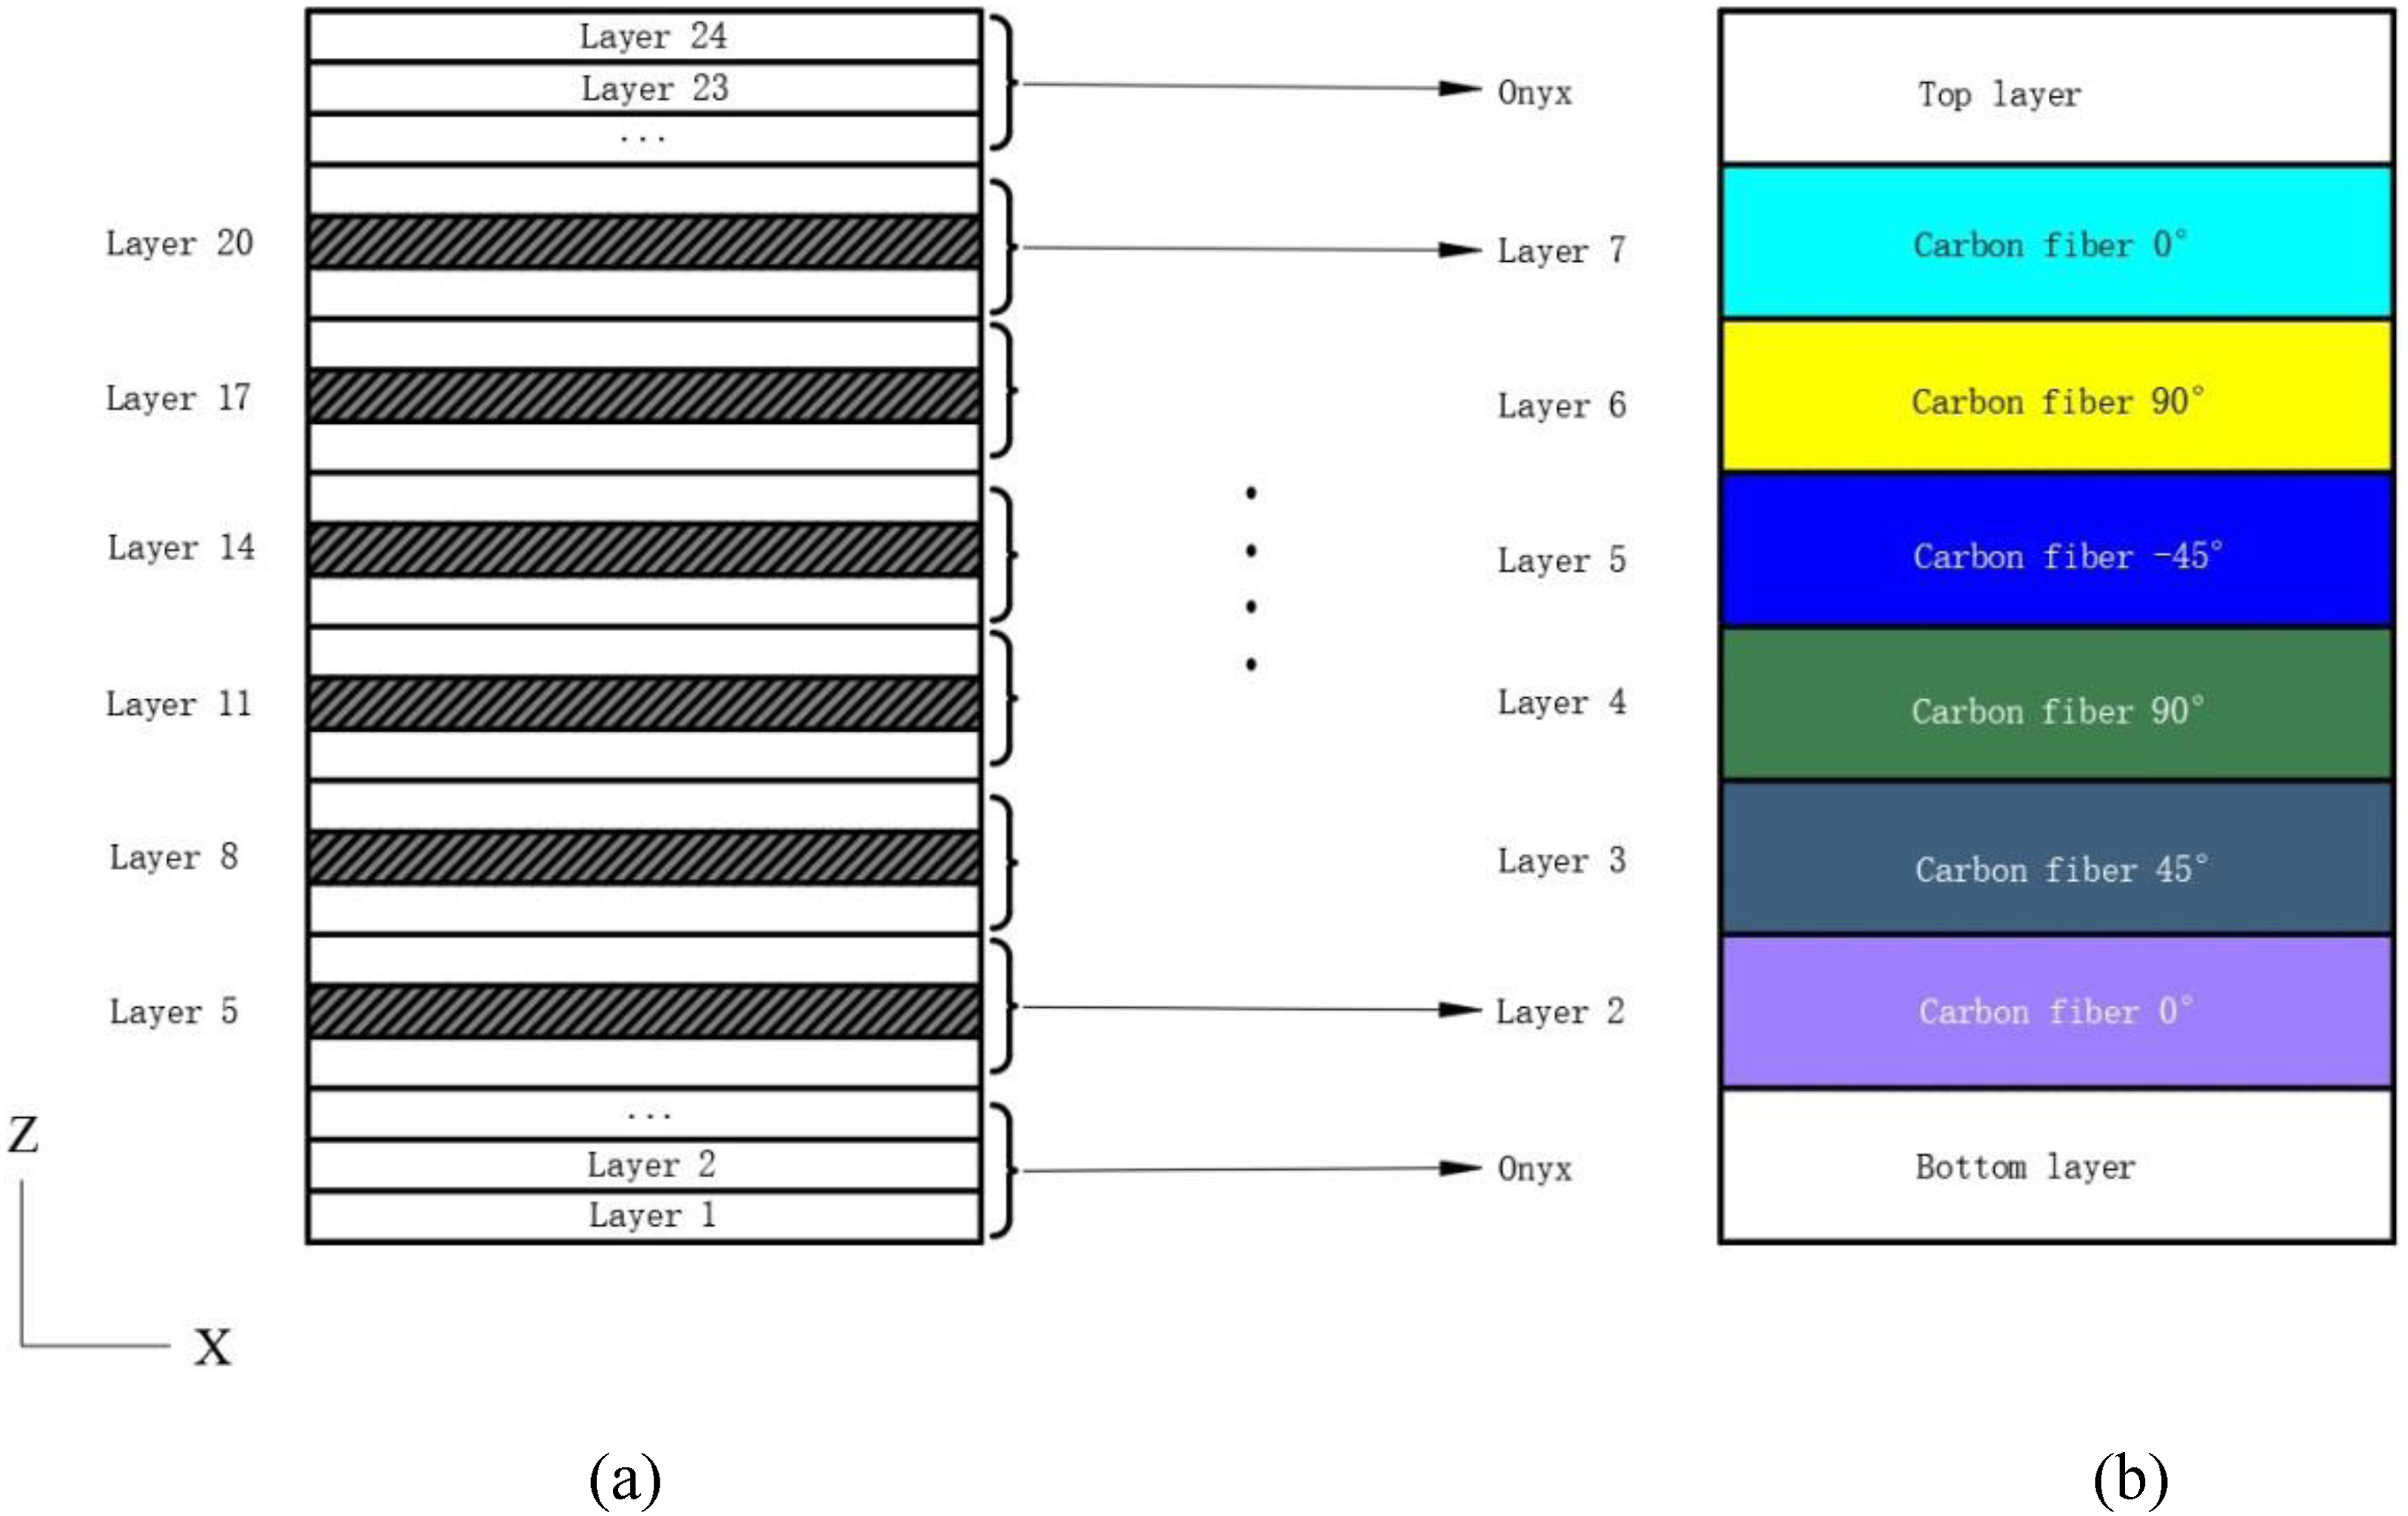
Internal layer structure of two materials is shown in Figure 3. Onyx and carbon fiber layups were printed at hot end temperatures of 252°C and 278°C, respectively, and each layer of the entire specimen was printed with a layer thickness of 0.125 mm. Internal layer structure.
Specimen parameters.


Fiber laying position.
Sample preparation and characterization
Specimen size.


Tensile specimen size.
According to the recommendation of GB/T 3354-2014, 12.5*50*1.5 tabs were bonded at both ends of the specimen using DP460 epoxy structural adhesive, as shown in Figure 6(a). The test specimen was obtained with electric blast drying oven for 1.5 h, as shown in Figure 6(b) and (c). There are three printing directions of carbon fibers in the specimen, which are 0°, 90° and ±45°, as shown in Figure 7. Longitudinal tensile strength and tensile modulus of elasticity were obtained with defining 0° fiber direction, transverse tensile strength and tensile modulus of elasticity were obtained with defining 90° fiber direction, and in-plane shear strength and shear modulus were obtained with defining ±45° fiber direction in the tensile test. Specimen preparation. (a) Reinforced tablets, (b) specimens, and (c) electric blast dryer. Specimen fiber direction.

Mechanical test setup
For the mechanical analysis of 3D printed CCFRCs, a significant number of uniaxial tensile tests are needed to characterize the mechanical properties of the material such as strength and elastic modulus. The tests are performed using a 100 kN electronic universal tensile machine of Labsans Material Testing (Labsans), as shown in Figure 8. In addition, the tensile test standard of unidirectional fiber reinforced composite material was used in the experiment, the gauge length is 50 mm, and the loading rate is 1 mm/min. Electronic universal testing machine.
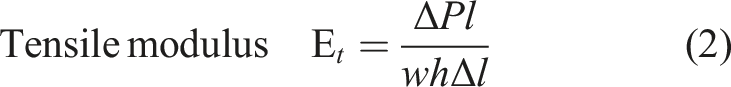
In addition, the model of the electronic universal testing machine is LD26.105, and the strength and stiffness parameters of the specimen are tested according to the GB/T 3354-2014 standard. The calculation formula is as follows: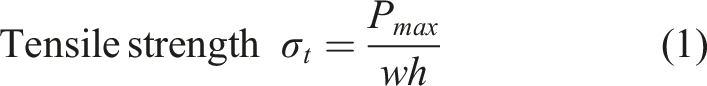
Experimental results and discussion
Experimental results
Effect of fiber volume content and ply location on strength properties
In order to establish the mechanical analysis model of 3D printed CCFRCs, it is necessary to characterize the tensile strength and modulus characteristics of composite materials with different fiber volume content and fiber ply location.
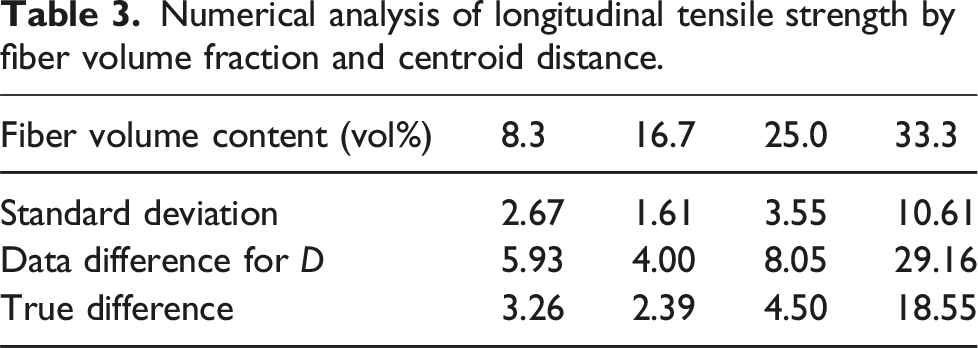
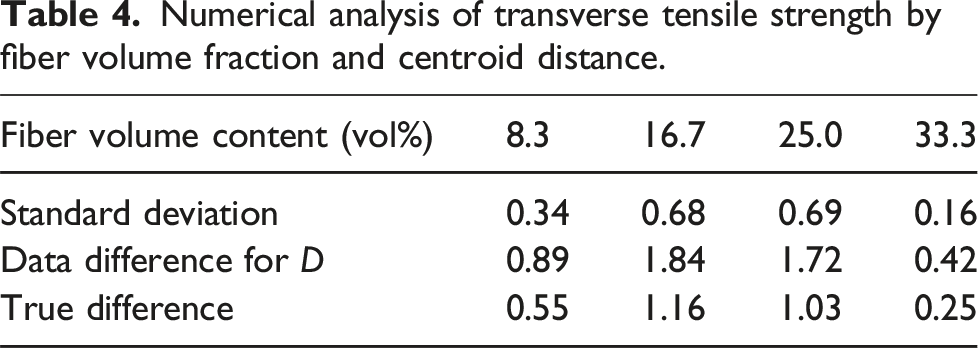
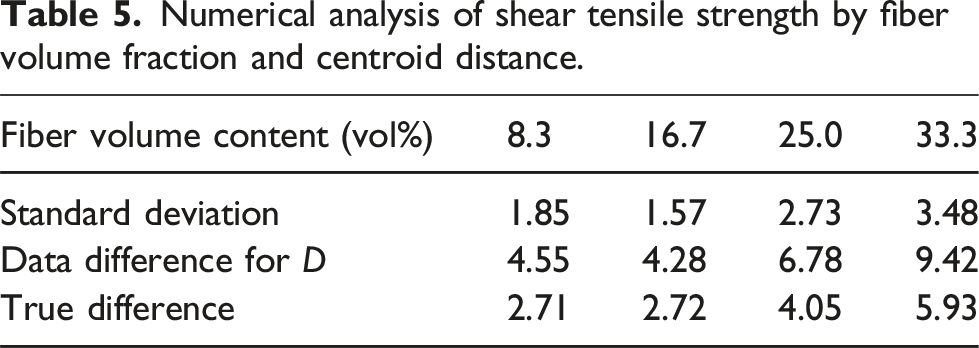
The mapping relationship between tensile strength, fiber volume content, and fiber ply location was obtained through the test data, as shown in Figures 9–11. Longitudinal tensile strength has an advantage in the mechanical properties of CFRCS and is often used as the main load-bearing performance in design. Under the experimental conditions in Table 2, the average longitudinal tensile strength of 3D printed CCFRCs increases from 54.81 MPa to 264.37 MPa when the fiber volume content increases from 8.3% to 33.3% and the fiber centroid distance D increases from 0 to 3 (reference Figure 4), basically showing a linear increase, as shown in Figure 9(a). The centroid distance D has little effect on the longitudinal tensile strength when the fiber volume content increases from 8.3% to 25%. However, the maximum difference of longitudinal tensile strength is about 15 MPa with the change of D, as shown in Figure 9(b). Data of longitudinal tensile strength difference analysis for D is shown in Table 3. Longitudinal tensile strength properties of 3D printed CCFRCs. (a) The three-dimensional relationship diagram between longitudinal tensile strength, fiber volume content, and fiber ply location. (b) The relationship between longitudinal tensile strength and fiber volume content at different centroid distances. Transverse tensile strength properties of 3D printed CCFRCs. (a) The three-dimensional relationship between transverse tensile strength, fiber volume content, and fiber ply location. (b) The relationship between transverse tensile strength and fiber volume content at different centroid distances. Shear strength properties of 3D printed CCFRCs. (a) The three-dimensional relationship between shear strength, fiber volume content, and fiber ply location. (b) The relationship between shear strength and fiber volume content at different centroid distances. Numerical analysis of longitudinal tensile strength by fiber volume fraction and centroid distance.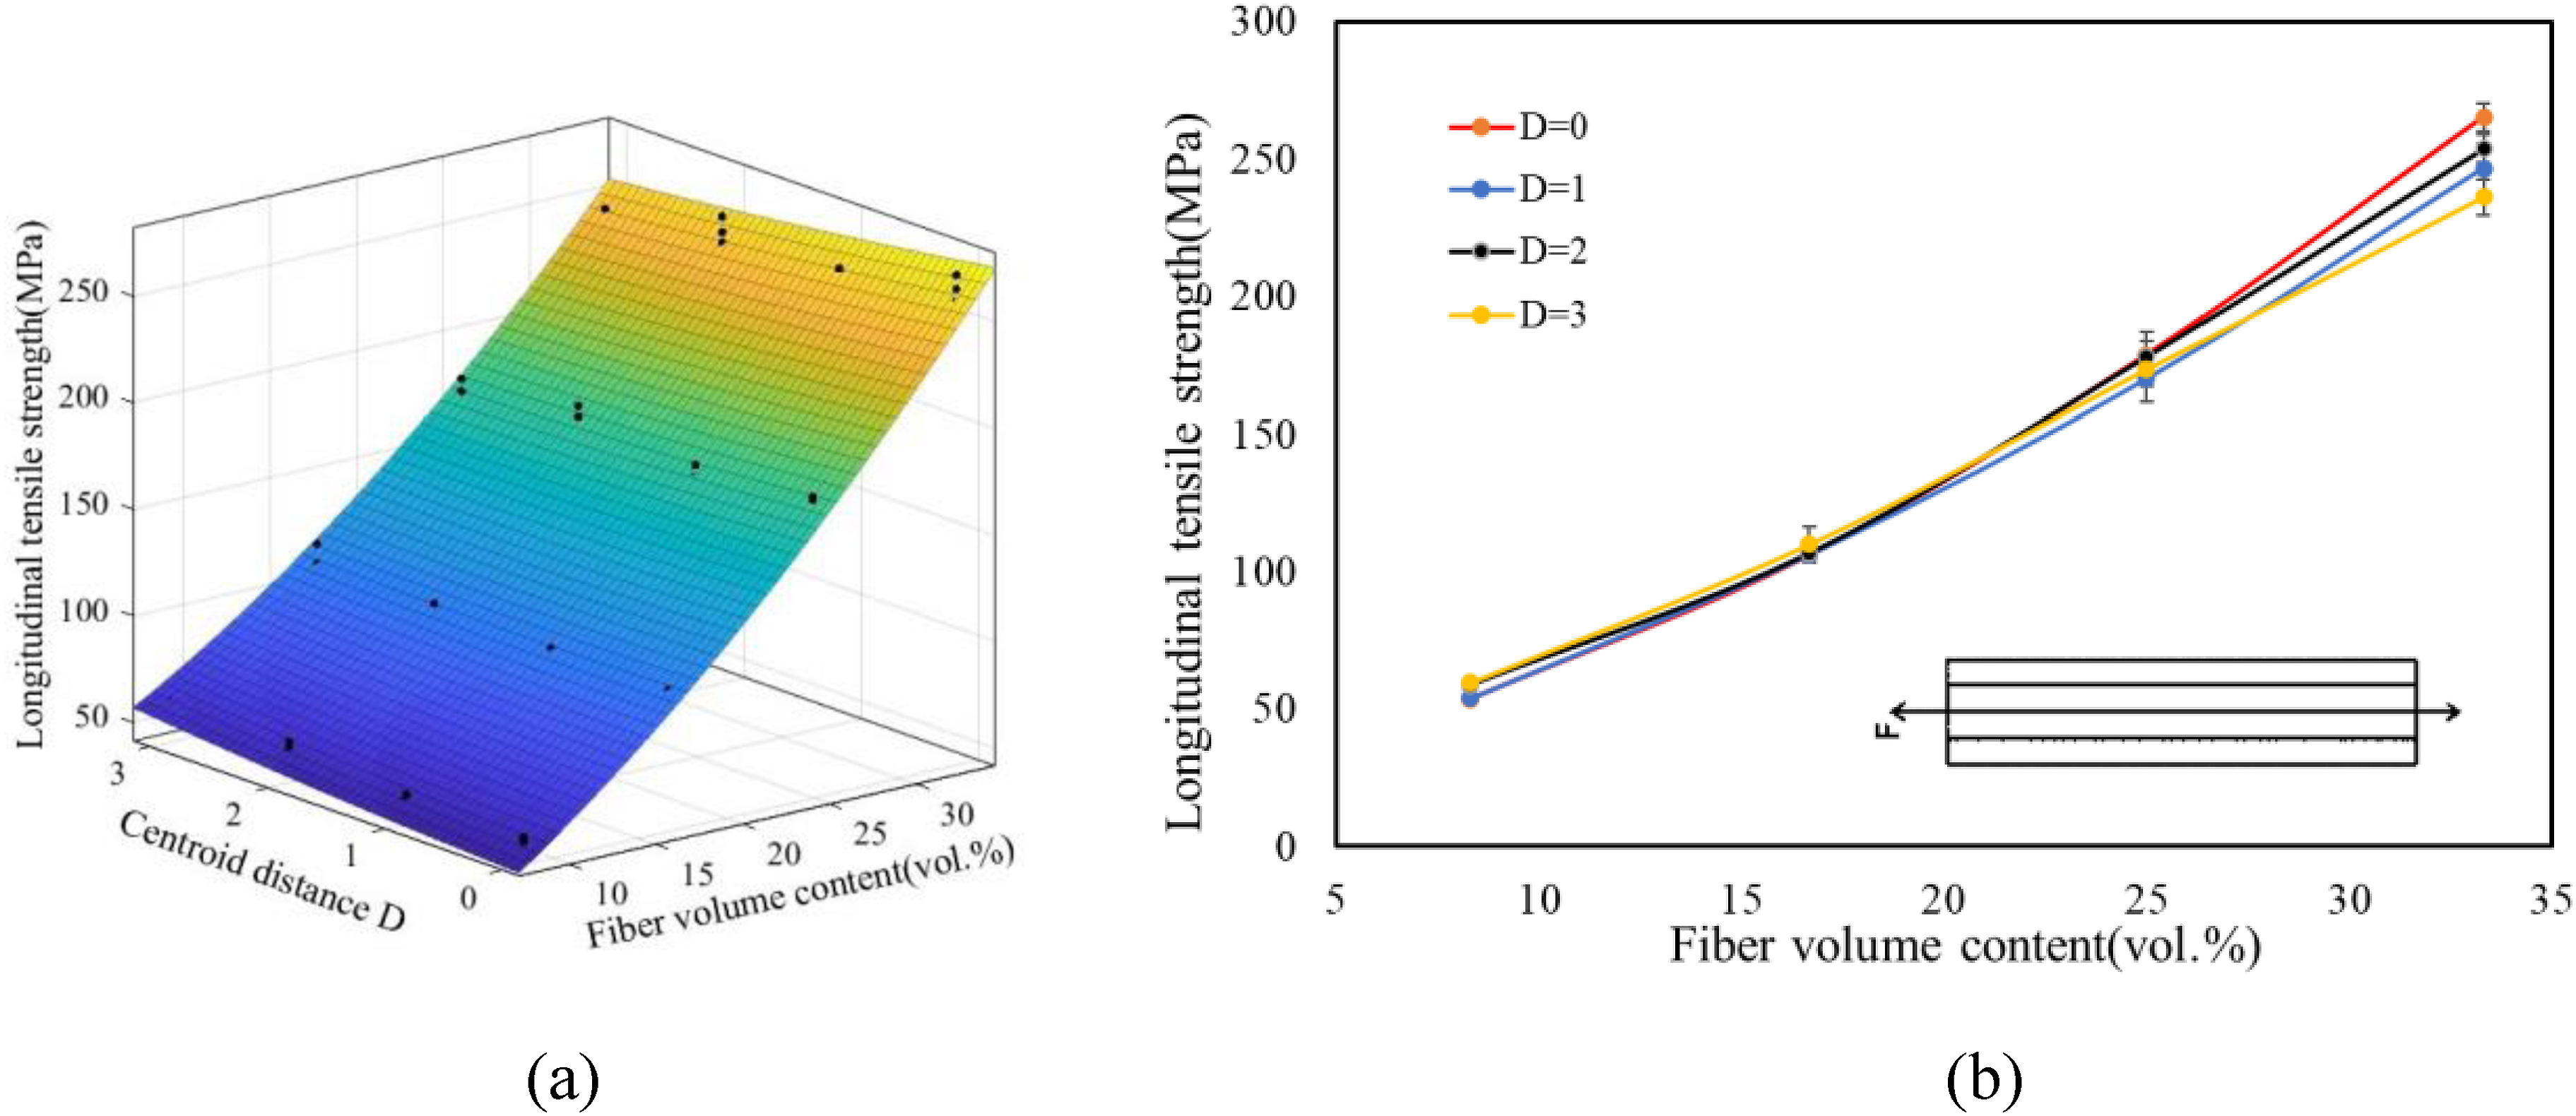


Numerical analysis of transverse tensile strength by fiber volume fraction and centroid distance.
Numerical analysis of shear tensile strength by fiber volume fraction and centroid distance.
Effect of fiber volume content and ply location on stiffness properties
Elastic modulus is an important performance parameter in engineering materials that measures the ability of objects to resist elastic deformation. Figures 12–14 show the relationship between the elastic modulus, the fiber volume content, and fiber ply location under different loads. The results show that the average longitudinal tensile modulus increases from 1766.47 MPa to 4454.01 MPa when the fiber volume content is from 8.3% to 33.3%, and the centroid distance D is from 0 to 3, as shown in Figure 12(a). The longitudinal tensile modulus is negatively correlated with the centroid distance when the fiber volume content is 8.3%–20% and is positively correlated with the centroid distance when the fiber volume content is 20%–33.3%, as shown in Figure 12(b). The centroid distance has a great influence on the longitudinal tensile modulus, which ranges from 130.38 MPa to 230.96 MPa, as shown in Table 6. Longitudinal tensile modulus properties of 3D printed CCFRCs. (a) The three-dimensional relationship diagram between longitudinal tensile modulus, fiber volume content, and fiber ply location. (b) The relationship between longitudinal tensile modulus and fiber volume content at different centroid distances. Transverse modulus properties of 3D printed CCFRCs. (a) The three-dimensional relationship between transverse modulus, fiber volume content, and fiber ply location. (b) The relationship between transverse tensile modulus and fiber volume content at different centroid distances. Shear modulus properties of 3D printed CCFRCs. (a) The three-dimensional relationship between shear modulus, fiber volume content, and fiber ply location. (b) The relationship between shear modulus and fiber volume content at different centroid distances. Numerical analysis of longitudinal tensile modulus by fiber volume fraction and centroid distance.


Numerical analysis of transverse tensile modulus by fiber volume fraction and centroid distance.

Numerical analysis of shear tensile modulus by fiber volume fraction and centroid distance.

Failure morphology of 3D printed CCFRCs
Figure 15 shows the damage modes of 3D printed CCFRCs specimens from macro to micro. Figure 15(a) shows the fracture morphology of specimen with the fibers printed in the 0° direction under the tensile loading. The surface flakes off with the pulling out of the lamination between the fiber and the matrix. This is due to the process characteristics of 3D printed Fused Filament Fabrication (FFF), which leads the possibility of defects when stacking layers and the inability to obtain a tight interface between neighboring layers. Fracture failure diagram of the specimen. (a) Tensile failure in the 0° direction, (b) tensile failure in the 90° direction, and (c) shear failure in the ±45° direction.
In contrast with Figure 15(b), the specimen with fiber printed in 90° direction is neatly disconnected from along the boundary between the matrix (onyx) and the carbon fiber under tensile load. There are no separated bare fiber bundles in the cross section, which also indicates that the impregnation between the fiber and the matrix is excellent, and the failure mode is brittle failure. 3D printed CCFRCs under longitudinal tensile loading undergo fiber damage with fiber printed in ±45° direction and fiber peels from the matrix with the transverse cracking of the matrix, indicating that the fibers are the main bearers of material failure, as shown in Figure 15(c).
Discussion
Constitutive model of 3D printed CCFRCs

Material properties of 3D printed continuous fiber reinforced composites.

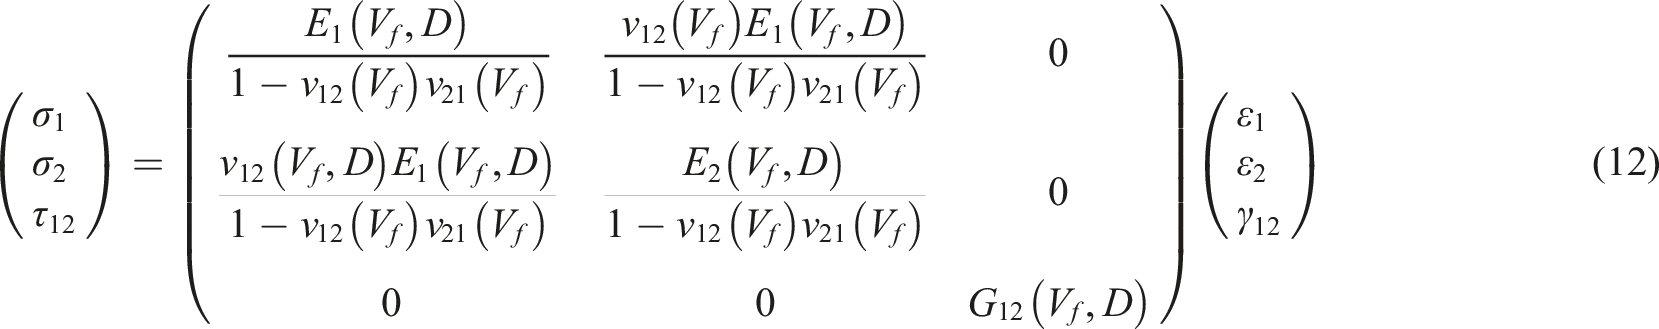
The composite material studied in this paper is an anisotropic material, and the research is limited to the linear elastic stage. Therefore, the stress-strain relationship of the material is shown as formula (4). Since the thickness of 3D printed CCFRCs specimen in the Z-axis direction is extremely thin (the thickness size is much smaller than the length and width size), the stress in the z-direction changes little during the tensile testing. Assuming that z = 0, then the constitutive equation of composite under plane stress condition is equation (5).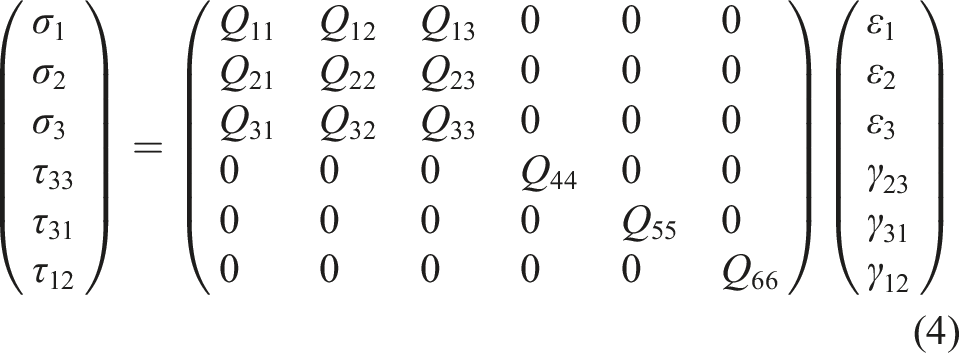


Demonstration
Printing parameters.

Material properties.

Figure 16(a) shows the simulated stress cloud map, where the maximum stress is 58.83 MPa, which is also the breaking limit stress. Figure 16(b) shows the displacement-load curve of the test specimen. The simulation results are basically consistent with the experimental results. In the simulation, the sample is basically linear before failure, that is, the tensile modulus remains unchanged because of the elastic phase in the materials. In the test, it was observed that when the load was increased to 1762.71 N, a small amount of matrix and interface of the sample began to crack. The specimen suddenly fractured when the load was added to 1886.15 N. In comparison, the failure load of the finite element simulation is 1847.18 N, which is 2.1% lower than the test results. The reason is that there are some corners that are not fully covered by the fiber layer in 3D printed CCFRCs. In the finite element analysis, the carbon fiber layer is treated as a completely covered uniform plane. Simulation model and experimental analysis: (a) stress nephogram and (b) test and simulation load-displacement curves.
The relative error of the final failure load of the test and simulation is less than 10%, which is in line with the expectation. The validity and correctness of the damage model are further verified.
Progressive damage analysis
Progressive damage model
Progressive damage analysis method is a finite element method based on the assumption that the damaged material structure can continue to bear the material properties after degradation. The progressive damage analysis method consists of three parts: stress analysis solution, material failure criterion, and degradation of damaged material properties. In this paper, Abaqus built-in 2D Hashin damage degradation criterion is used to study the progressive damage of 3D printed CCFRCs.
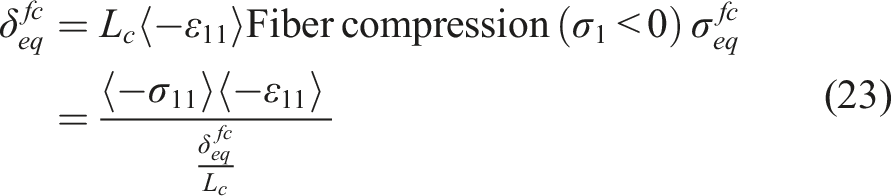
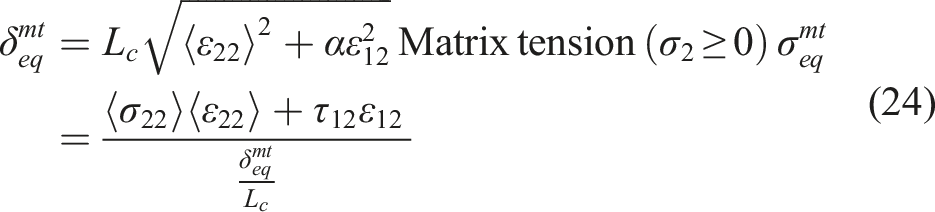
The 2D Hashin criterion can judge four types of failure, namely, fiber tensile failure, fiber compression failure, matrix tensile failure, and matrix compression failure. The expression is as follows:


If any of the conditions in equations (13)–(16) are met, the material is judged to have suffered initial damage. After the initial damage occurs, it is necessary to update the stiffness matrix to simulate the degradation behavior of composite materials. In this paper, the stiffness coefficient degradation method based on fracture toughness is adopted. The damage constitutive relation of composites can be expressed as:


The degradation relationship shown in Figure 17(a) is adopted for the evolution of each damage variable of the four failure modes, and the damage variable is calculated according to the following formula: Damage degeneration relation. (a) Relationship between equivalent displacement and equivalent stress. (b) The relationship between damage variable and equivalent displacement.


In addition, the specimen used in progressive damage has a small hole with a diameter of 1 in the middle, as shown in Figure 18. The printing parameters are shown in Table 12. In the process of establishing the finite element model, the idea of simplification is adopted, and the actual 24 layers are simplified to 8 layers. The top and bottom layers are the base material onyx, and the remaining 6 layers are carbon fiber reinforced layers (0°/45°/90°/–45°/90°/0°), as shown in Figure 19. Specimen size of progressive damage. Printing parameters. Structural diagram. (a) Specimen structure diagram and (b) finite element structure diagram.

Onyx lamina properties.

Carbon fiber lamina properties.

aValues acquired experimentally.
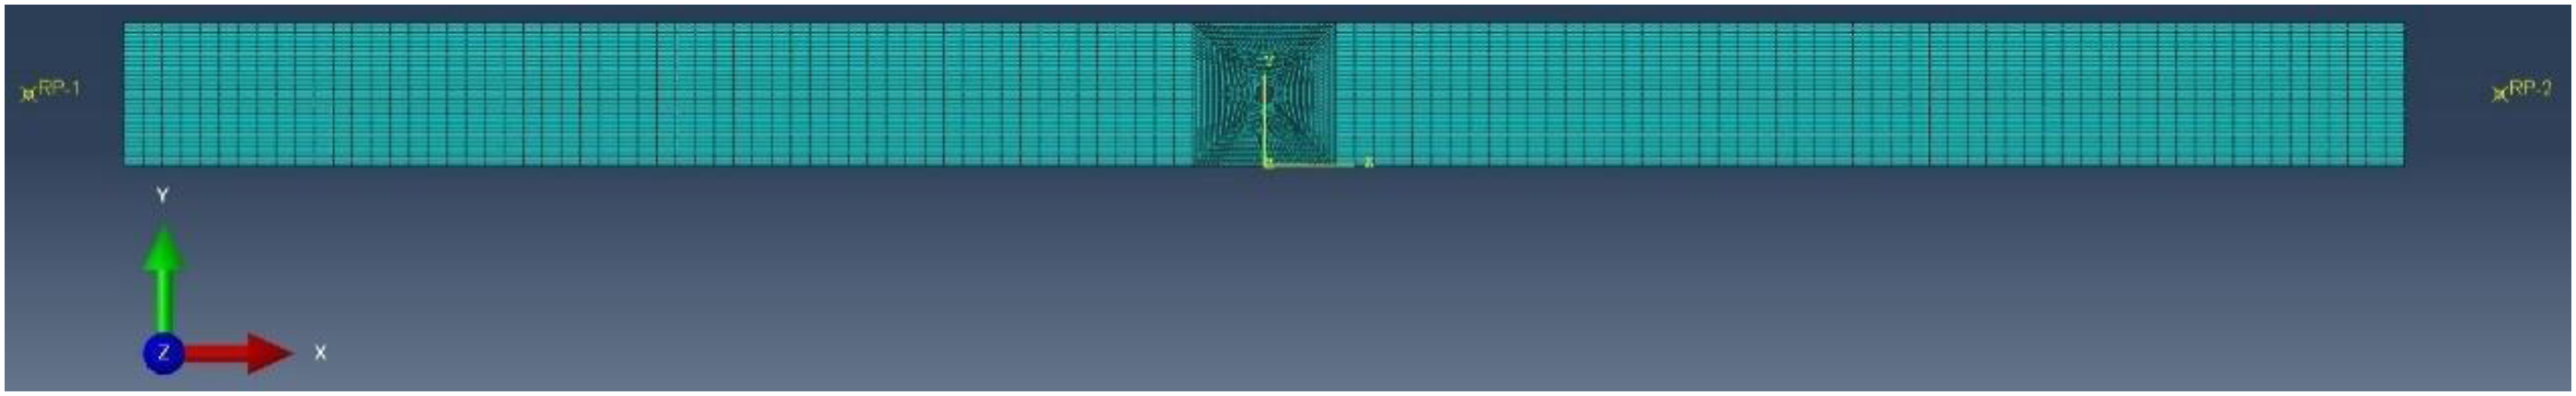
Mesh image.
Result analysis
Figures 21 and 22 show the progressive damage distribution of fiber and matrix elements during tensile failure of the whole structure. This indicates that the unit has failed when the output variables HSNFTCRT and HSNMTCRT of the damaged unit are 1. If the output variable is less than 1, the failure state has not been reached. It can be seen from the fiber damage distribution diagram in Figure 21 that the maximum number of fiber failures occurs in the 0° layup when the ultimate load is reached. The 0° fiber tensile damage extends to the boundary of the composite laminates, the fibers are completely broken, and the whole structure has been penetrated. The fiber failure units in 45° and −45° layings are similar because the fiber laying Angle is rotated by 180°. Moreover, the fiber failure elements extend to the boundary of the laminate, indicating that the layer is completely broken. There are very few fiber failure units in the 90 ply, indicating that the 90° fiber does not bear a load in the X-direction stretch. Distribution of fiber failures in each layer during overall damage. Distribution of matrix failures in each layer during overall damage.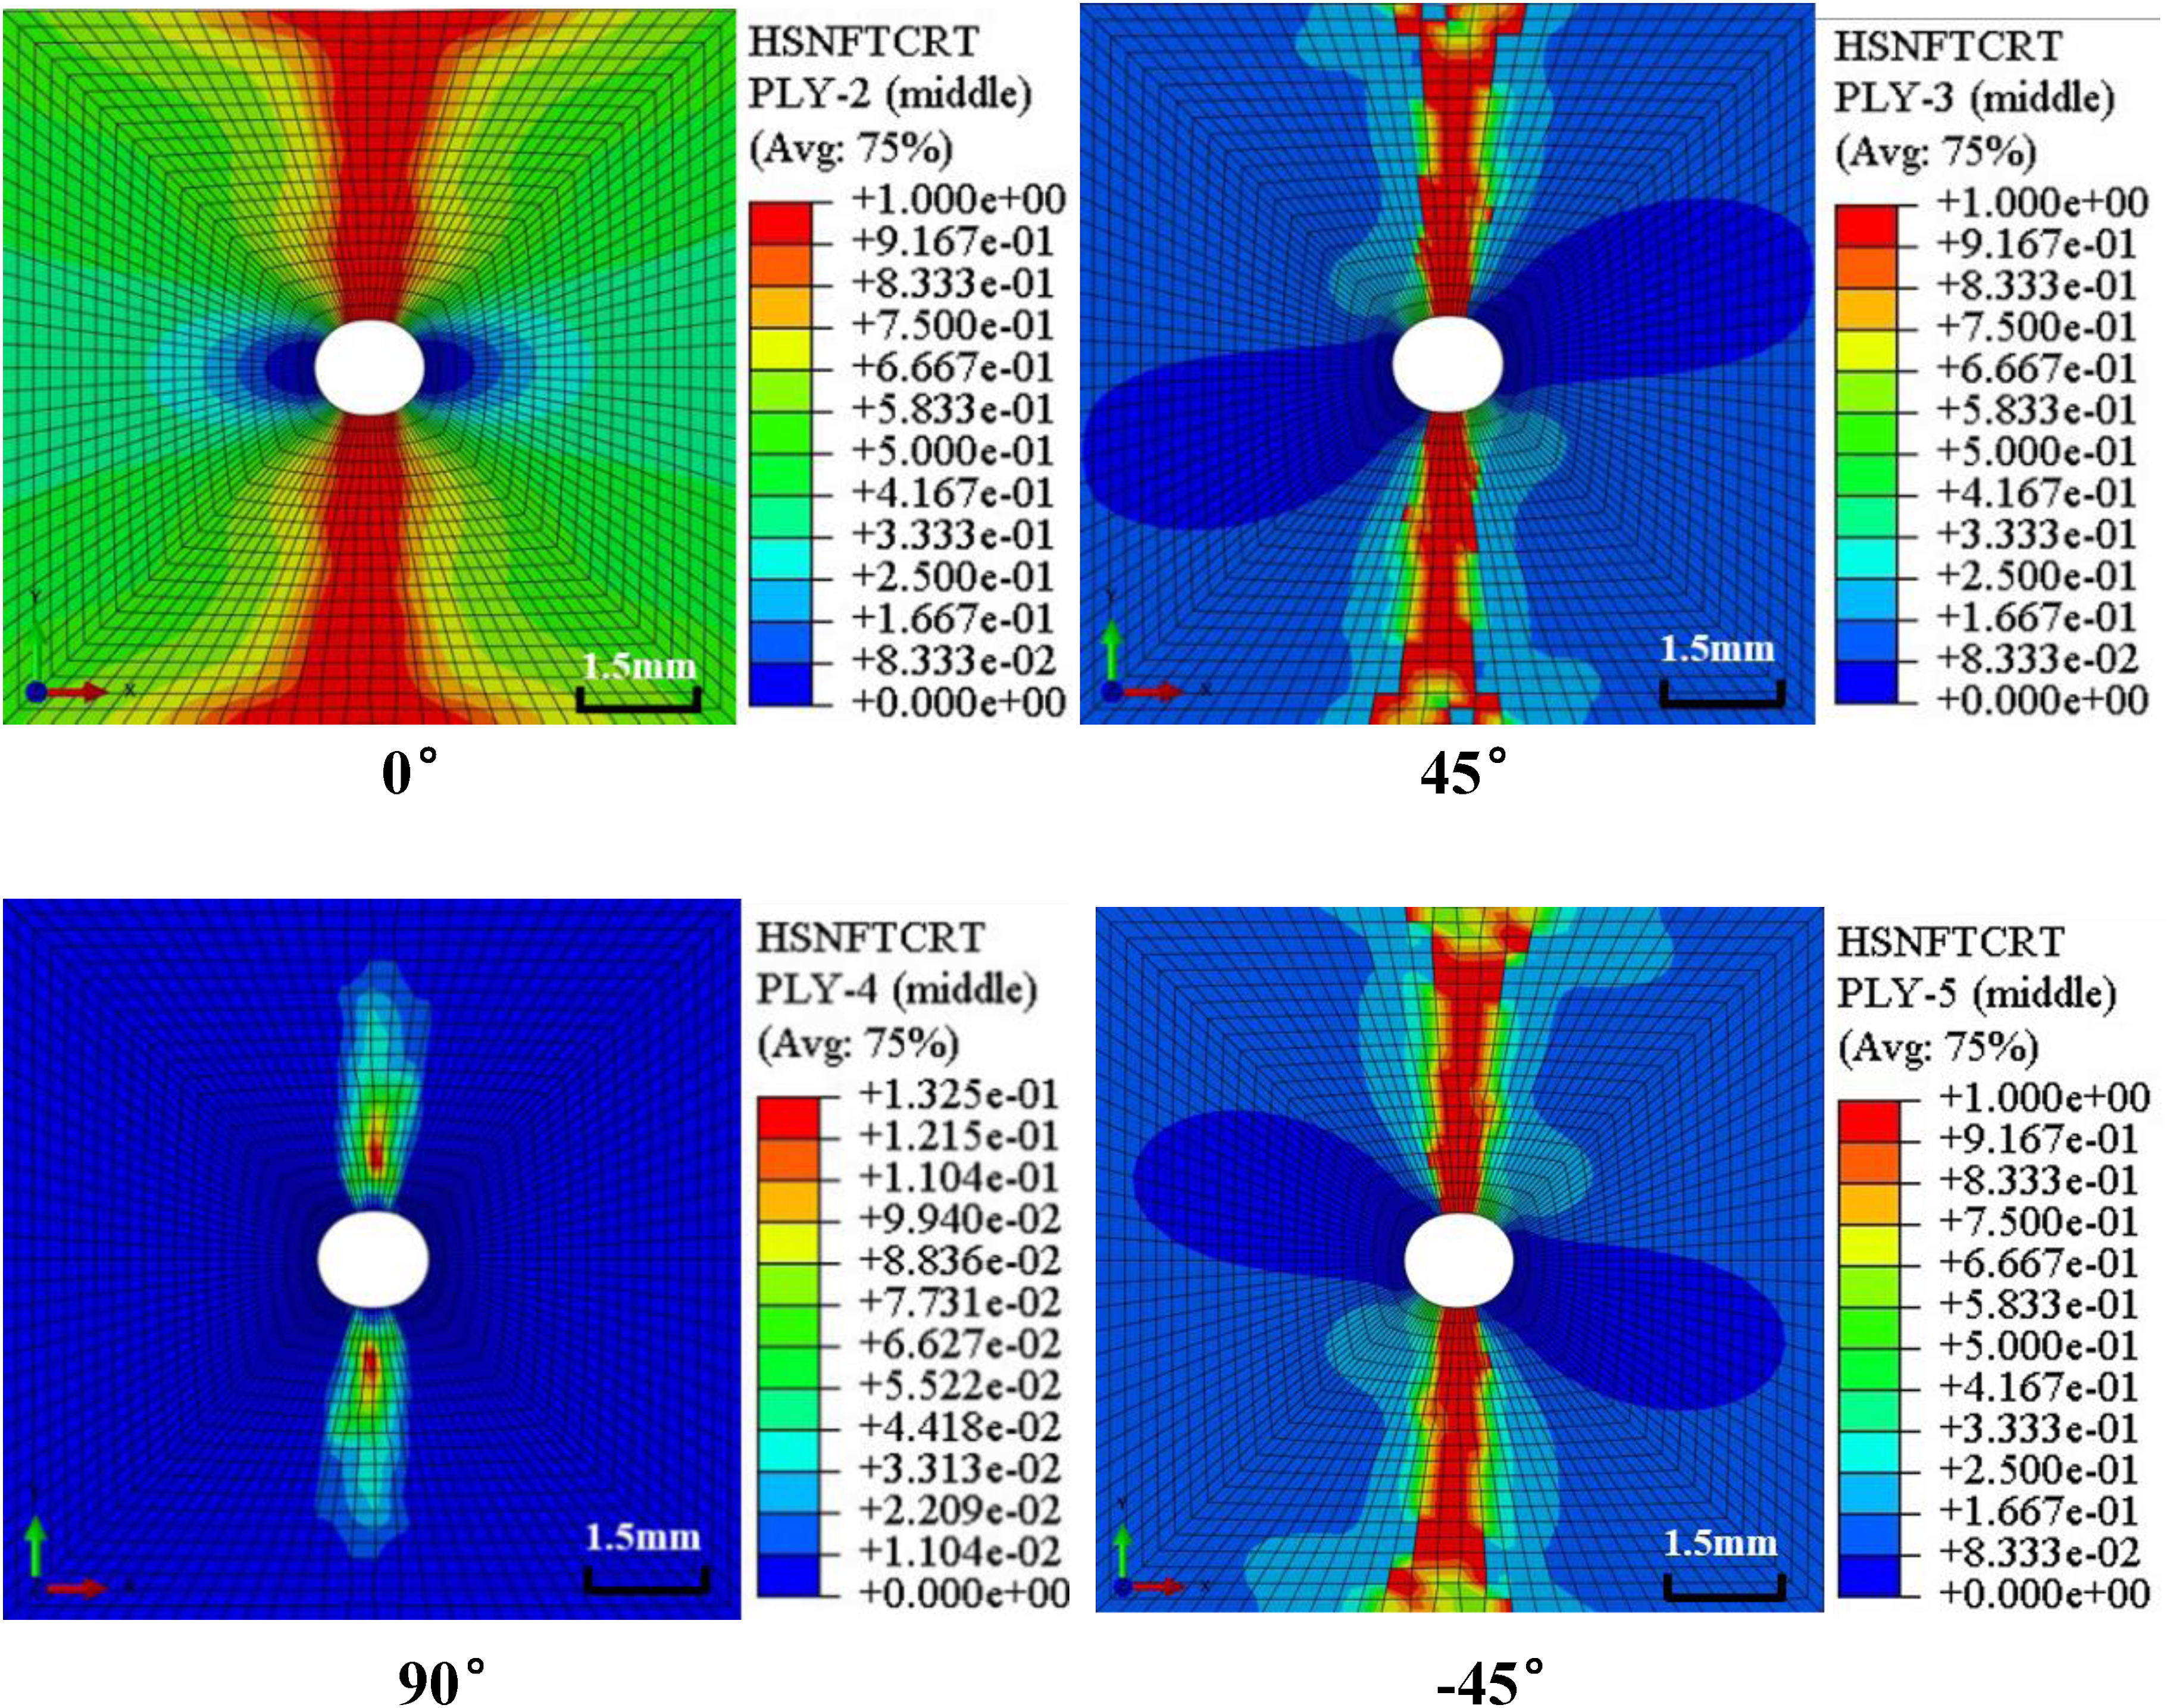

As can be seen from the damage distribution diagram of the matrix in Figure 22, a large area of the matrix fails in the ±45° paving layer, and the damage units have penetrated the whole structure, so the matrix will fail in large numbers when carrying loads. The matrix failure in 0° layering is relatively small, because the fiber is the main load-bearing material in 0° layering. As long as the fiber is not damaged in a large area, the matrix in the layering will not break. In the 90° layup, the matrix damage occurs before the fiber damage, so the failure matrix element that permeates the whole laminate appears.
Figure 23 shows the load-displacement curve of finite element calculation and test. In the test, the ultimate tensile load when the specimen was damaged was 2355.2 N, but after the ultimate load, the specimen suddenly broke and the load decreased instantaneously. The progressive damage method was used in the finite element calculation, and the damage degradation began when the load was 2246.29 N. However, the structure can still bear a little load after the failure, and the load-displacement curve changes greatly after the complete failure. The error of the finite element calculation and test results is 4.6%, and the error is less than 10%, which is in line with the expectation. Figure 24 shows the fracture diagram of the test piece. The main failure position is on both sides of the hole, and the failure mode is tensile failure. In addition, in the test, normal layered damage appeared at other positions of the hole, and the damage was not in a single form, and various damages affected each other. This is also the next step to improve the research content. Load-displacement curves for testing and simulation. Fracture diagram of test piece.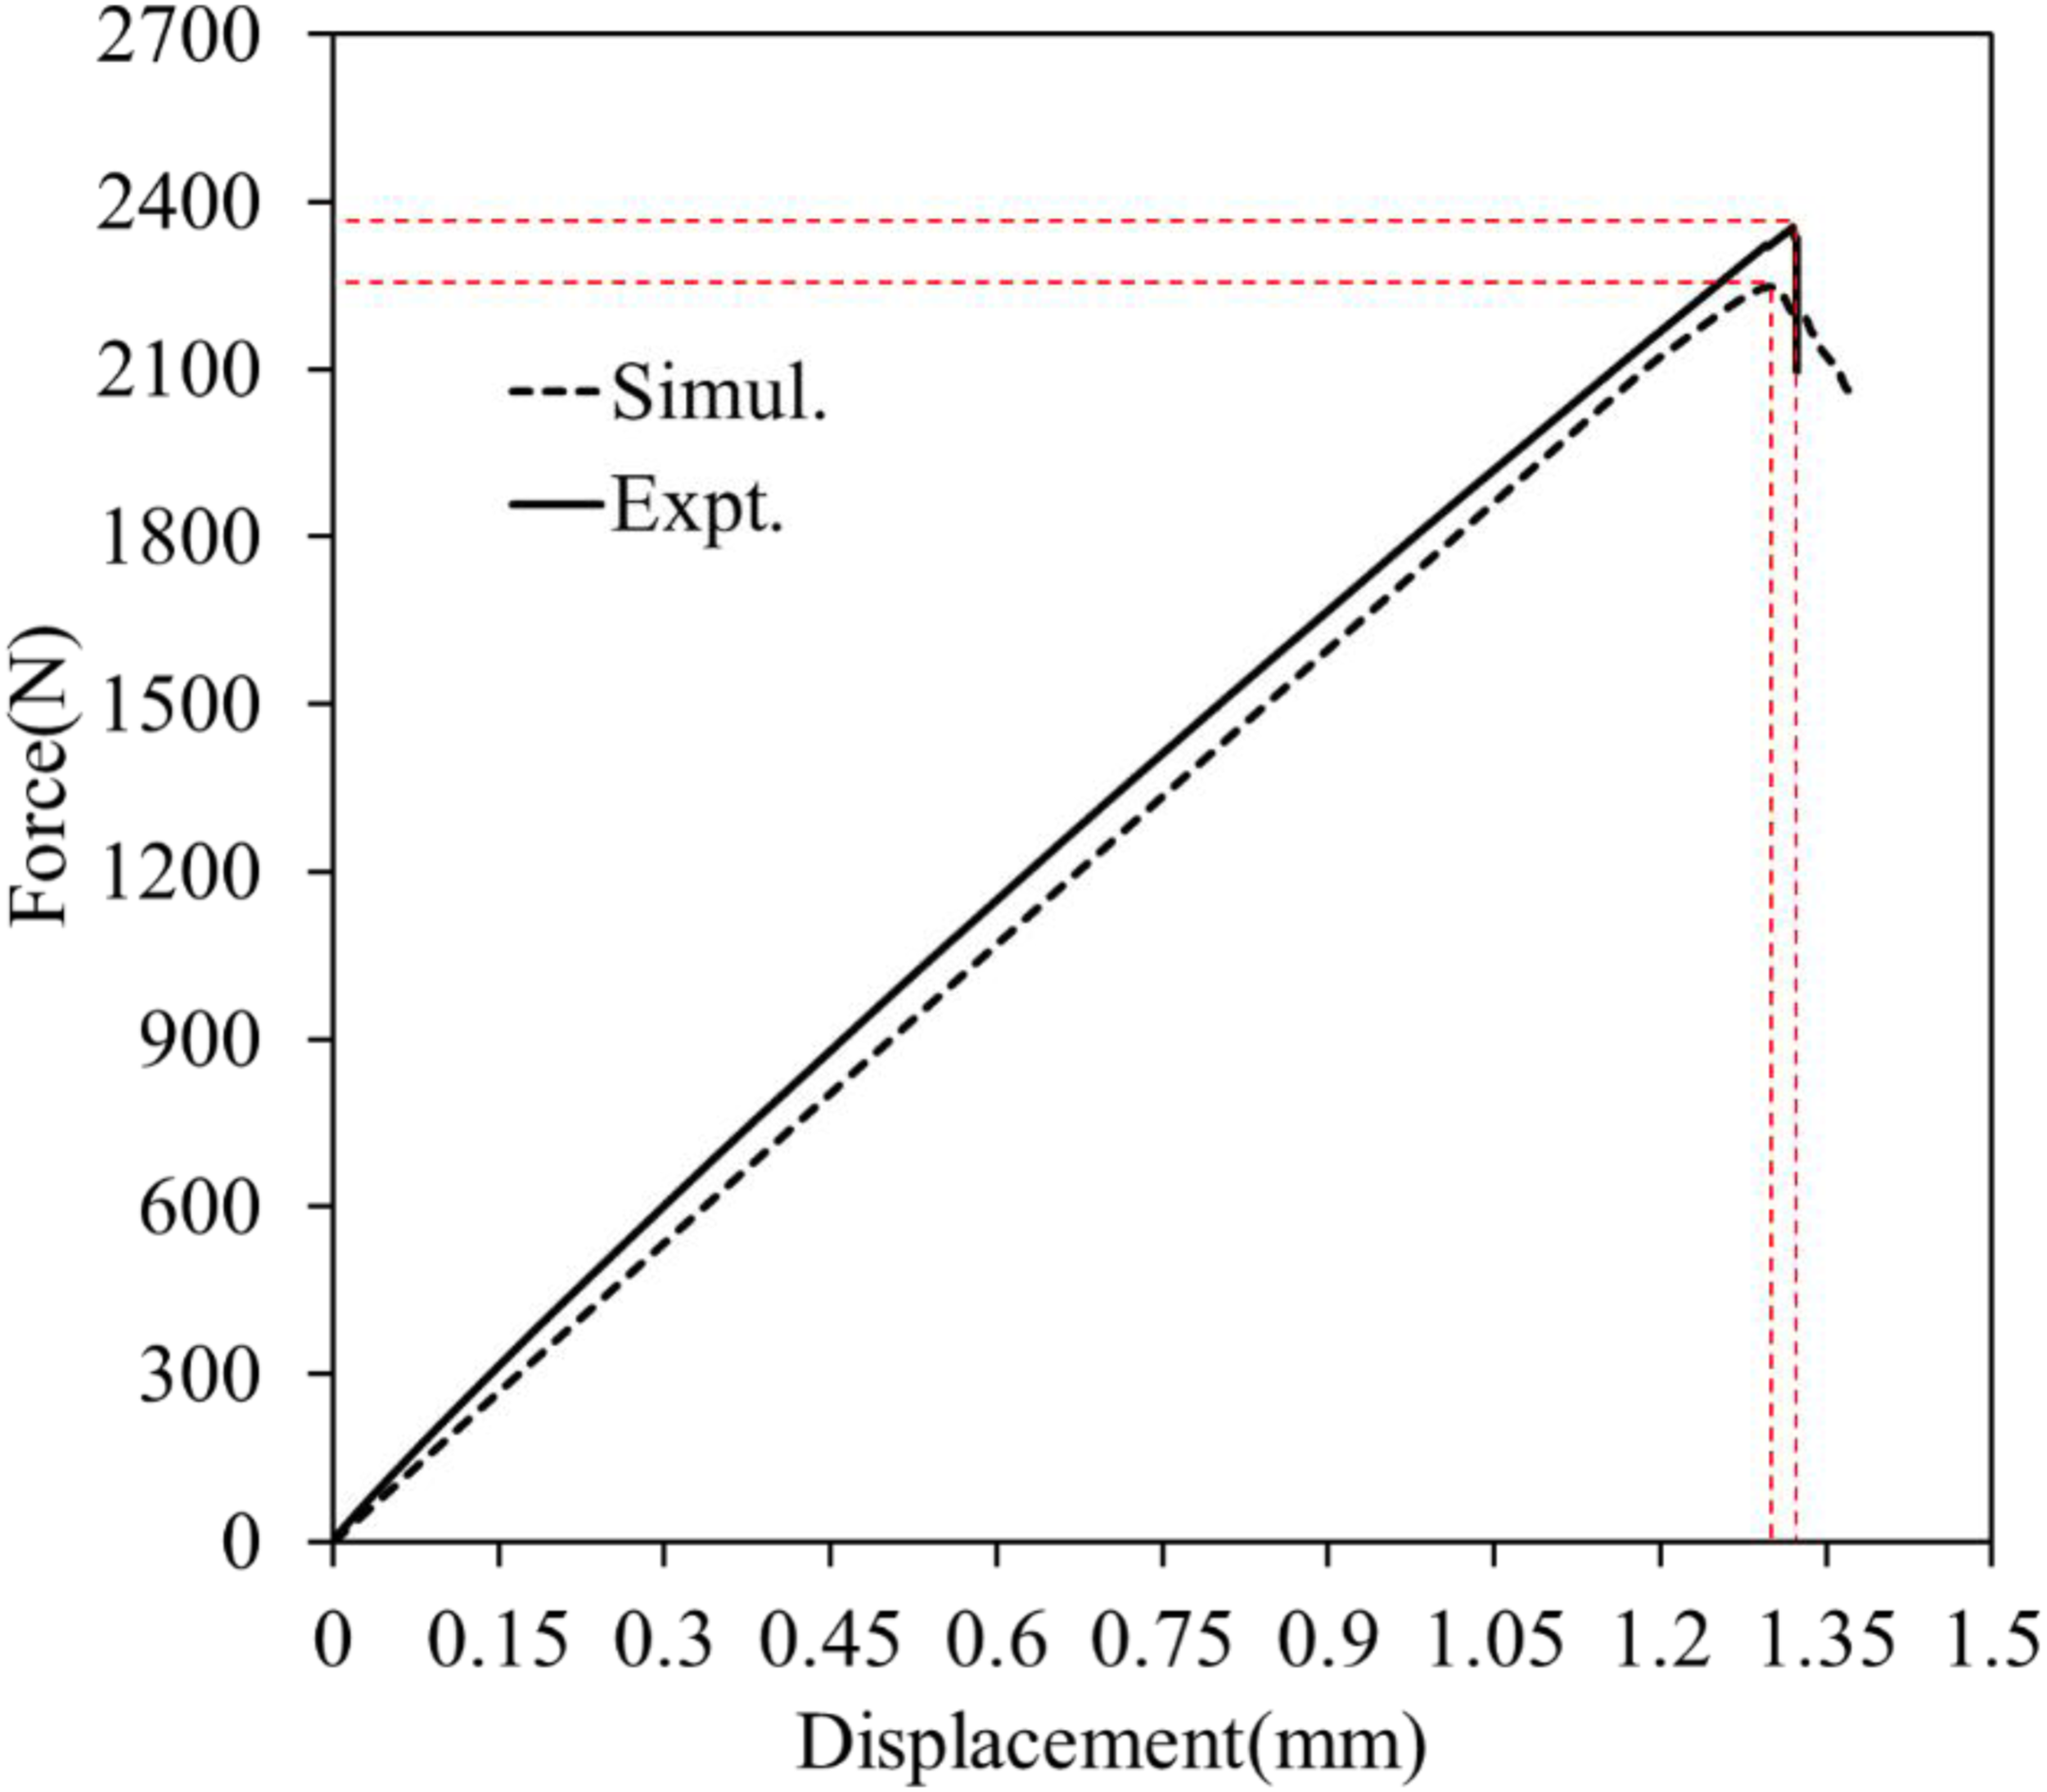

The comparison of the whole results shows that the analysis method is accurate and the analysis results are reliable. The rationality and accuracy of the progressive damage model established in this paper are verified.
Comparative study of relevant literatures.
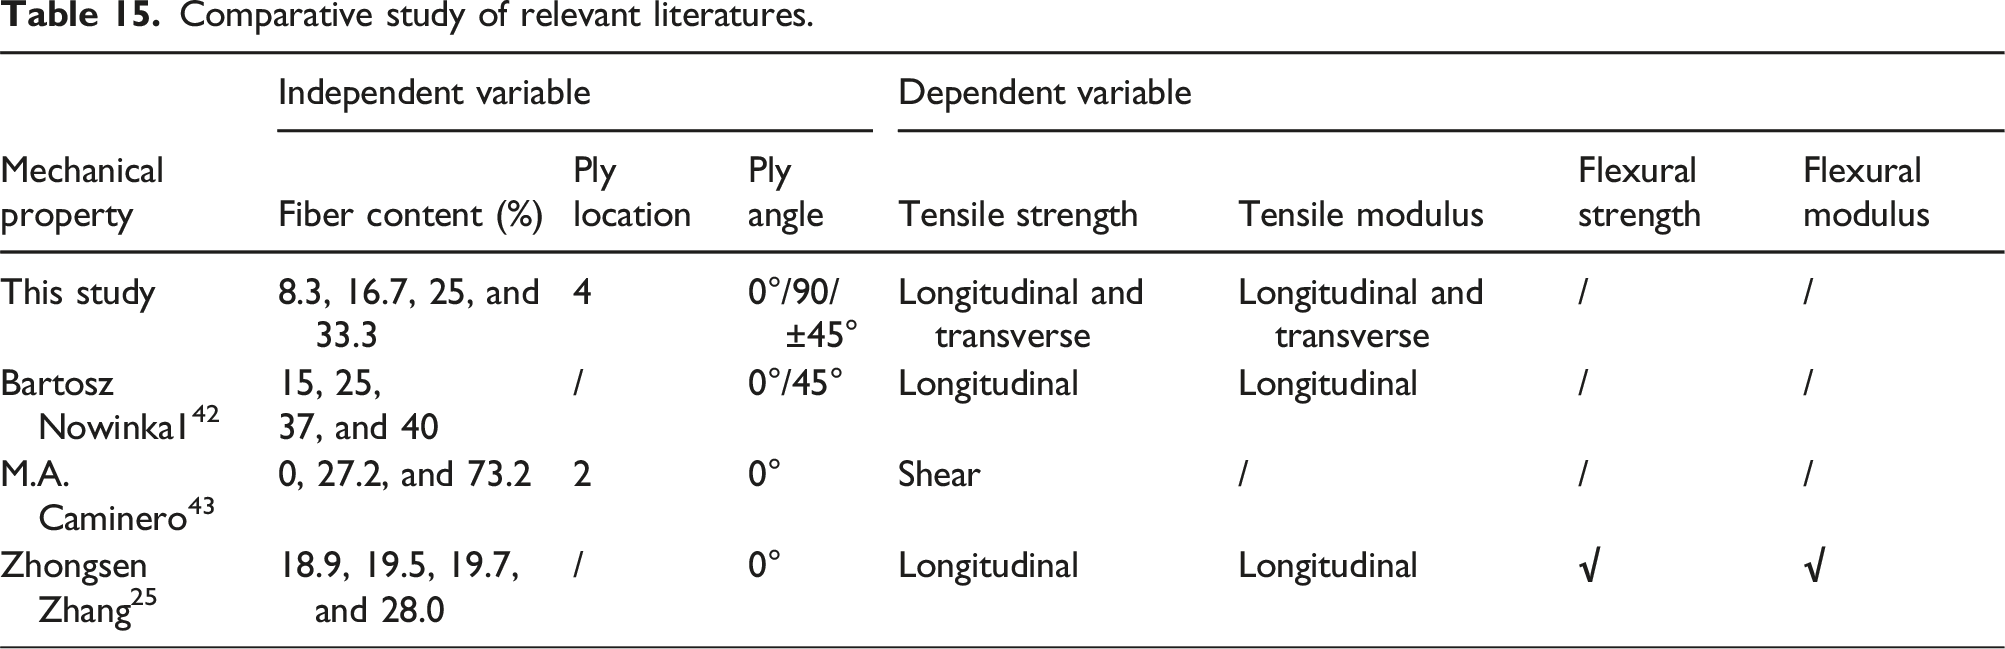
Comparative study of relevant literatures.

In addition, the constitutive equations including fiber volume fraction (8.3%–33.3%) and fiber ply location (0–3) are established, which provide rich data support for 3D printing composites with variable stiffness and strength. In the study of progressive damage of 3D printed CCFRCs, the damage evolution process of specimens with fiber volume fraction of 25% and centroid distance of 0 was analyzed. Although only one fiber configuration was selected for damage analysis, it is highly representative and reveals the damage change law of the fiber and matrix units of each layer of the 3D printed composite.
Conclusions
In this paper, the mechanical properties of 3D printed CCFRCs with different fiber volume content and fiber ply location were experimentally studied. The specific findings and conclusions are as follows: (1) In the longitudinal tensile test, the strength and stiffness of the material gradually increase with the increase of fiber volume content, but the change of centroid distance D has little effect on its properties. In the transverse tensile test, the strength of the material decreases with the increase of fiber volume content and centroid distance D. (2) In the transverse tensile test, the strength of the material decreases with the increase of fiber volume content and centroid distance D. The stiffness increases first and then decreases with the increase of fiber volume content, and peaks when the fiber volume content is 23%. In addition, the stiffness is negatively correlated with the centroid distance D when the fiber volume content is constant. (3) In the shear test, the strength decreases significantly with the increase of the centroid distance, and the strength reaches the maximum when the centroid distance is 0. (4) Establishing the constitutive relationship between different fiber volume contents, ply locations, and the mechanical properties of composite materials allows for more precise design to meet specific performance requirements, enabling the optimization of material design. Researchers and engineers can predict the mechanical properties of new materials under specific conditions, reducing the number of experimental iterations and saving time and costs. For varying application demands, such as aerospace, automotive, and sports equipment, it’s possible to customize the performance of composite materials by adjusting the fiber content and ply location strategy to suit different loads and environmental conditions.
Footnotes
Author contributions
Declaration of conflicting interests
The author(s) declared no potential conflicts of interest with respect to the research, authorship, and/or publication of this article.
Funding
The author(s) disclosed receipt of the following financial support for the research, authorship, and/or publication of this article: This work was supported by the Shanghai Pujiang Program (22PJ1404400); “Shuguang Program” supported by the Shanghai Education Development Foundation and Shanghai Municipal Education Commission (19SG51).