
Abstract
Additive manufacturing is a development of fabricating 3D parts layer by layer with complex geometries and utilized in numerous engineering structural applications. Fused deposition modeling technology provides higher design flexibility with aim of low cost and simplicity of material conversion to generate the composite parts. Previous studies have mainly focused on the manufacturing and characterization of continuous carbon fiber reinforced polymer composites (CCFRPCs) structure for fully dense and solid part structures and no study has been reported for porous CCFRPC parts. In this study, CCFRPCs porous structures were manufactured using FDM technology. The porous structures were fabricated with one perimeter shell by using two different types of infill patterns (grid and triangular) at three different infill densities levels (20%, 40%, and 60%). The reasons for developing such lightweight porous composite structures with continuous carbon fiber are the reduction of mass, efficient material utilization, energy consumption, and less waste generation. This study investigated the effects on tensile and flexural properties of composite specimens under uniaxial tensile loading and flexural loading, respectively. Fracture interface of the printed porous composites were examined and explored using optical microscope after performing mechanical tests. The experimental results demonstrated that infill pattern and density levels greatly affect the mechanical properties. The specimen printed using grid infill pattern with 60% infill density exhibited highest strength level in term of mechanical test and showed maximum tensile and flexural strength of 162.9 MPa and 127.24 MPa, respectively. While triangular infill pattern with 60% infill density level revealed the maximum tensile and flexural strength of 152.62 MPa and 117.53 MPa, respectively. Hence, from the results achieved in this study showed great potential and ability to replace fully dense and solid structure by the porous structure.
Keywords
Introduction
Additive manufacturing
Additive manufacturing (AM), is a process of depositing the material layer by layer to manufacture the 3D shape from the deigned CAD model in sequential layers, compared to traditional subtractive manufacturing technologies.1,2 Compared to traditional manufacturing approaches, AM technologies has the capability to shorten the design-manufacturing cycle, thus reducing production cost and increasing efficiency.3,4 These techniques provide a variety of benefits that include (i) AM enables the product designs flexibility that are often challenging to create using traditional manufacturing processes; (ii) AM technology has the capability to manufacture multiple parts as a single element; (iii) Reducing the energy consumption and material wastage. 5 Due to the progresses of AM developments and improvements of the design, AM technologies have been widely involved in various engineering applications in the areas of automobile industry, 6 biomedical industry,7–9 food processing, 10 construction and architectural fields, 11 electronics, 12 military, 13 robots, 14 and fashion. 15 Modern industries, such as in aerospace and military fields, have adopted AM technologies as a swift and cost-effective solution for manufacturing various industrial components parts due to the usage of expensive material such as titanium that takes an effort to reduce or recycle scrap formed during the machining of different parts. 5
Polymers occupy a significant place in the AM technologies due to their accessibility, simple printing process, and appealing characteristics. The initial established AM techniques were usually applied to fabricate the pure polymer parts.16,17 AM techniques used to print polymers include laminated object manufacturing (LOM) from plastic laminations, 18 stereolithography (SLA) from photopolymer liquid, 19 fused deposition modeling (FDM) from plastic filaments, 16 and selective laser sintering (SLS) using plastic powders. 20 Polylactic acid (PLA), a bio-based polymer derived from renewable resource widely used as biodegrading and environmental-friendly polymer, which have the possibility for renewable resources, is one of the most broadly utilized thermoplastics to create object using FDM 3D printer.17,21,22 PLA has been widely utilized in biomedical, green packaging and textile engineering applications, and now it is becoming an exceptional polymer used in 3D printing productions due to its low cost, simple processing, and adequate mechanical performance.23–25 But, the pure polymer parts fabricated by these methods attain poor mechanical performance due to less strength and stiffness.5,26,27
Numerous efforts have been made to overcome the issue of poor mechanical properties of 3D printing of pure polymers. These limitations can be solve by introducing the reinforcements to polymers in the form of particles, fibers, or nanomaterials. By the addition of such reinforcement a fiber-reinforced polymer composites (FRPCs) are formed that are reflected as high-performance composite parts due to their remarkable functionality.28,29 The demand of polymer reinforced composite materials with the improving 3D printing technologies is also increasing that offer completely a new prospects for the production of composite structures. 30
FDM is one of the most extensively and commonly used technique among all AM technologies for producing polymer products with least wastage, low cost, and simplicity of material adjustment4,31,32 FDM has ability to print only thermoplastic filaments, including PLA, acrylonitrile butadiene styrene (ABS), polycarbonate (PC), polyamide (PA), or the combination of any two types of materials due to their low melting temperatures.33,34 FDM technology has the capability to print FRPC structures with both short and continuous fibers.30,35
FDM 3D printers perform by the controlled extrusion of thermoplastic filaments. In FDM processes, the filament is fed into the liquefier printing head to melt into a semi-liquid state and are extruded at a constant temperature through the printing nozzle and polymer parts can be built layer by layer onto the assemble platform where the printed layers are bonded together through depositing the thermoplastic filament. Each layer will be frequently deposited onto each other until the part is completed, and can be easily removed the support and final material part after it solidifies. 16 Several essential printing parameters can control the quality of parts by changing their parameters in FDM, such as layer thickness, printing orientation, raster angle, air gap, bead width, model build temperature, and infill.2,29,34,36
Since the pure thermoplastic parts built by FDM process usually have lack of strength, they cannot be used as load-bearing and functional applications. However, there is a way need to improve the strength and to overcome the limitations of FDM-fabricated pure thermoplastic parts. One of the possible methods to enhance their properties is adding reinforced material such as continuous carbon fiber (CCF) into the plastic materials to form continuous carbon fiber reinforced thermoplastic polymer composite (CCFRPC) structure.16,30,37
CCFRPC’s 3D printing solves these problems by combining the retention and protective fiber matrix and reinforcement material to create a more useful and functional combination of features that can only be achieved by one component.
AM of CCFRPC have solved these problems by combining the matrix and the reinforcements to achieve a combination with more functional combination of features that are not achievable by only one constituent.29,38CCF reinforcement offers considerable improvement in the mechanical properties compared to discontinuous fibers2,39 and mixing of carbon fibers with polymer increases the strength and stiffness of the part. 40
Porous composite structures
Lightweight composites can be manufactured by mean of incorporation of porous reinforcing fibrous structures that result in the reduction of the densities of composites, hence could remarkably decrease material usage, energy consumption, waste generation, and thus endorses sustainability of materials. 41 Moreover, despite weight reduction, the 3D fabricated porous structures could also successfully overcome the problems of poor interlayer properties. 42 Production of porous structures through AM mostly used in the field of biomedical applications. AM acts as a backbone and successively used in the production of the complex 3D bio-structures. 43
3D printing has been used extensively used to create porous scaffolds from biological materials to provide sufficient mechanical support to the cells and sufficient space for tissue regeneration. 44 Infill percentage plays a major role in the porous structures generation 45 and the mechanical properties depend on the process parameters and infill pattern. 34 Mechanical properties and porosity of ABS scaffolds and Polycaprolactone/bioactive glass composite porous structures prepared by FDM technique with different process parameters (build orientation, build layer, raster width, air gap, and build profile) were studied.46,47 The above-discussed porous structures developed through AM technology were focused on the biomedical applications, mostly in the tissue engineering applications and development and not for the structural applications.
F. Ning et al. 16 fabricated composites with ABS matrix reinforced with short carbon fibers and studied their processability, microstructure, and mechanical performance and achieved maximum tensile and flexural strengths of 42 MPa and 65 MPa, respectively, with the addition of 5 wt% carbon fiber. Effect of rater angle, infill speed and nozzle temperature have also been investigated and resulted that the specimen printed with raster angle [0, 90] has the maximum tensile strength. 48 X. Tian et al. 49 performed a systemic analysis and investigated the effect of 3D printing temperature of CCF reinforced PLA composites by achieving the maximum flexural strength of 335 MPa with a fiber content of 27%. The weak bonding between the PLA matrix and CCF significantly affect the mechanical performance of the composite. However, surface modification of carbon fiber bundle with the mixture of methylene dichloride and PLA particles resin improved the adhesion and mechanical strength. 22 M. Rimašauskas et al. 30 prepared impregnated CCF from the standard carbon fiber tow (1K and 3K) by performing surface modification using the mixture of methylene dichloride and PLA pellets in various concentration and printed CCF reinforced PLA composites and the result indicated that the fiber prepared with the 10% concentration solution has the best result by achieving the maximum tensile strength of 165 MPa. M. Heidari-Rarani et al. 26 fabricated CCF reinforced PLA thermoplastic composite parts with 1K carbon fiber roving using FDM technology and achieved maximum tensile and bending strength of 61.4 MPa and 152.1 MPa, respectively. N. Li et al. 22 also studied the mechanical properties by performing surface modification of carbon fiber and fabricated CCF reinforced PLA composite using FDM 3D printer by modifying the design of extrusion nozzle and attained the tensile and flexural strength of 91 MPa and 156 MPa, respectively.
The above reported research results of CCF reinforced PLA thermoplastic composites have mainly focused on fabricating and characterizing for entirely solid part and compact structure. Mechanical strength of solid structure printed with 100% infill with optimum printing parameters is comparable to the parts that are manufactured using conventional methods.
Fused filament fabrication (FFF) was used to manufacture cellular structures using various polymeric materials. 50 Various pure PLA parts have been built through AM to study the impact absorption, 51 print quality, and compressive mechanical performance. 52 The influence of the wall thickness on the bond strength between the layers 53 and fracture toughness. 54 C. Lubombo and M.A. Huneault 34 developed cellular PLA parts using 5 dissimilar types of infill patterns printed at 3 different infill densities level and the result showed that for the stiffness and strength with the same number of perimeter shells using various types of infill patterns were increased up to 82%. Previous research have been mostly focused on developing the porous cellular structure for the pure polymer materials and no study has been reported to fabricate the porous structure using CCFRPC. Therefore, the influence of infill patterns that form a porous structure is of significant interest in studying the mechanical properties of CCFRPC parts.
This research aims to study the mechanical performance of lightweight CCFRPC porous structure using FDM technology with one perimeter shell using two dissimilar forms of infill patterns printed at three different infill densities. Uniaxial tensile loading and 3-point bend flexural loading were carried out to study the mechanical performance. Moreover, the fracture interfaces were observed after performing the mechanical testing to study the failure modes. Porous composite parts were 3D printed using optimized parameters to validate the possibility of proposed porous structure for high-performance composites.
Materials, experimental set-up, and testing procedures
Raw materials for 3D printing
In this study, commercially available PolyLite PLA thermoplastic (Polymaker, China) printing filament of diameter of 1.75 mm was used as a matrix material having tensile strength and Young’s modulus of 46.6 MPa and 2636 MPa, respectively, as provided by the supplier’s data sheet. For the reinforcement material, CCF tow T300B-3000, 3000 fibers in a bundle (Toray, France) was used. The diameter of each fiber equals to 7 micrometers. T300B is a high-performance carbon fiber made of polyacrylonitrile having tensile strength, Young’s modulus and density of 3530 MPa, 230 GPa, and of 1.76g/cm3, respectively. 55 The standard carbon fiber tow was subjected to surface modification and impregnated CCF was prepared by following the same method described previously 30 by the author. The impregnated carbon fiber tow enables better printing ability and quality.
Printing and process parameters
Pro-engineer wildfire 5.0 CAD software was used to model the specimen geometries for the tensile and flexural test, which was further exported as an STL file and imported to the 3D printing “Simplify 3D” software for specimens fabrication. MeCreator 2 (Geeetech, China) 3D printer was selected due of its simplicity and ease of use for the production of CCFRPC structure. The extrusion printing head was modified with two input (one for the polymer filament and other for the CCF tow) and one output that enables polymer to fused with the CCF for the printing. A schematic view of the designed FDM 3D printer’s extrusion device to print CCFRPC is presented in Figure 1(a). Schematic view of the 3D printing of FDM process; Infill patterns of full-length 3D printed specimens fabricated with 1 perimeter shell with grid infill pattern at (b) 20%, (c) 40%, (d) 60% infill densities level and triangular infill pattern at (e) 20%, (f) 40%, (g) 60% infill densities level.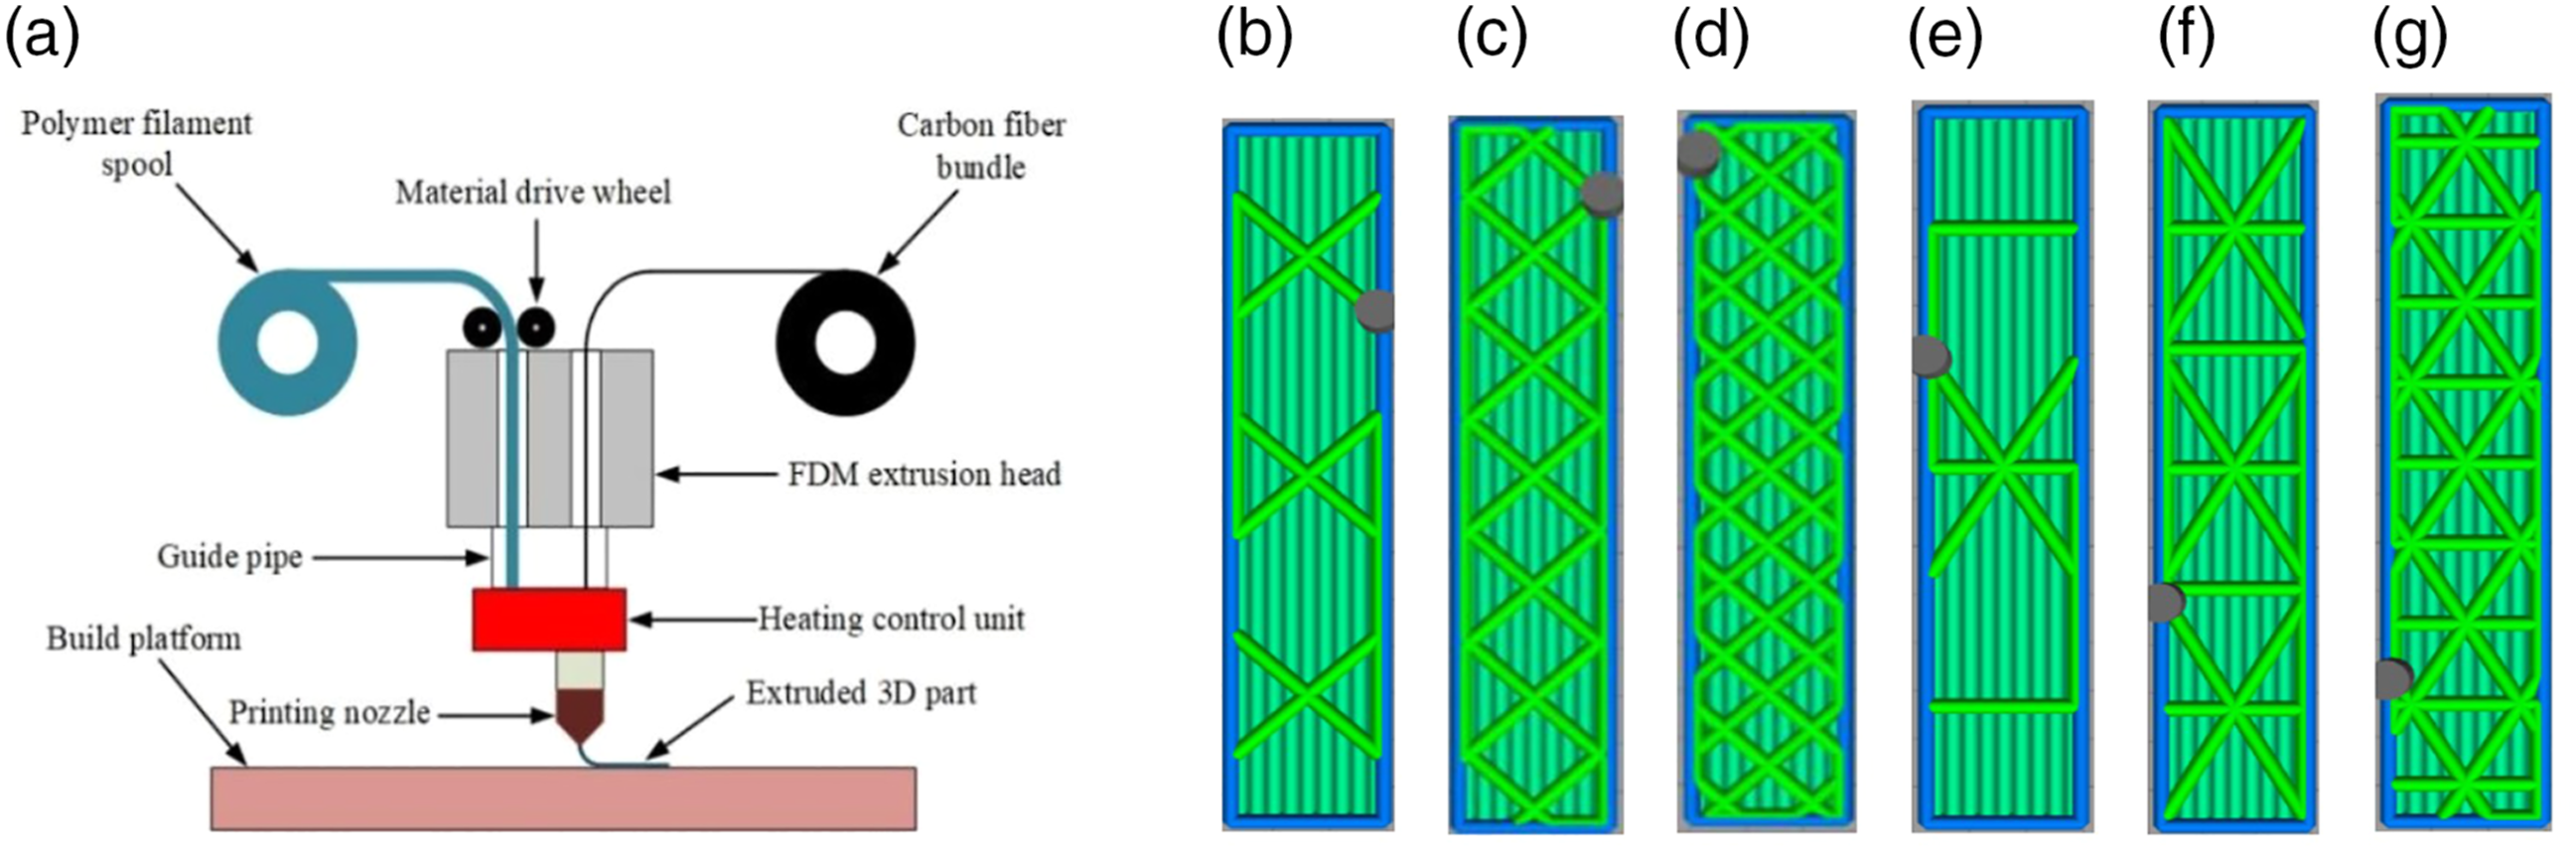
Impregnated carbon fiber tow was passed directly to the printing nozzle through printing head. While the polymer liquefies in the mixing zone of heating control unit, where liquefied PLA makes bond with impregnated CCF and constantly pushed through the printing nozzle. Finally, PLA reinforced with CCF thermoplastic composite extruded through the printing nozzle printed on borosilicate glass that is mounted on the aluminum plate bed surface maintained at temperature of 90°C.
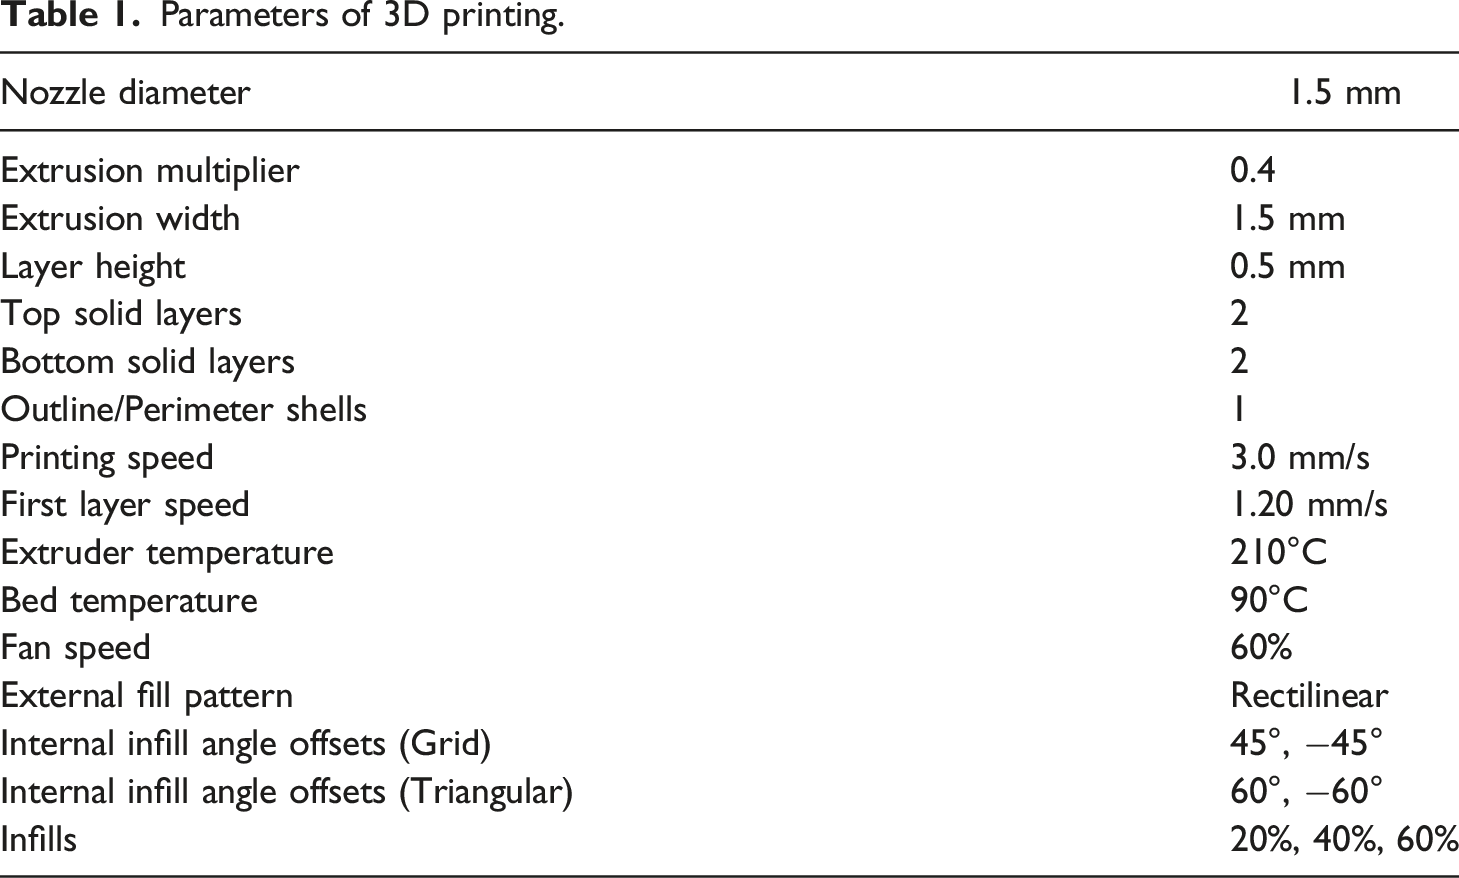
In this study, two different types of infill patterns (grid and triangular) at three different infill densities (20%, 40%, and 60%) specimens were selected with one perimeter shell to print for the experiment. The inner part is filled with two different types of infill patterns. The infill patterns were covered with two top and two bottoms unidirectional 0° layers. The internal infill angle offsets for grid pattern was printed with 45°, −45°, while internal infill angle offsets for triangular pattern was printed with 60°, −60°. Printing nozzle made of bronze having diameter of 1.5 mm was used. The reasons for choosing 45°, −45° for grid pattern, while 60°, −60° for triangular pattern were the complexity of the printing layers, path define by the Simplify 3D, experiencing different offset angles response to the mechanical properties and printer compatibility to print parts with such structures.
Figure 1 (b)–(g) represents the structures of two different infill patterns, that is, grid and triangular fabricated at 3 infill densities levels (20%, 40%, and 60%) with 1 perimeter shell having two top and two bottoms unidirectional 0° layers that covers the inner porous structure. By the increasing the infill percentage, the length of cell-wall of the specimen geometries shrinked by adding additional unit cells to the porous structure while the wall thickness remains the same. Uneven distributions of the overlap layers of the material between the infill structures were observed. This was caused due to the infill printing pathways generated by Simplify 3D and also an important aspect of anisotropy of the porous structures. 56 The triangular structure, which has a nodal connectivity equals to 3 is known to be isotropic in the plane, while the grid structure, has nodal connectivity equals to 4 is known to be anisotropic.34,57
Parameters of 3D printing.
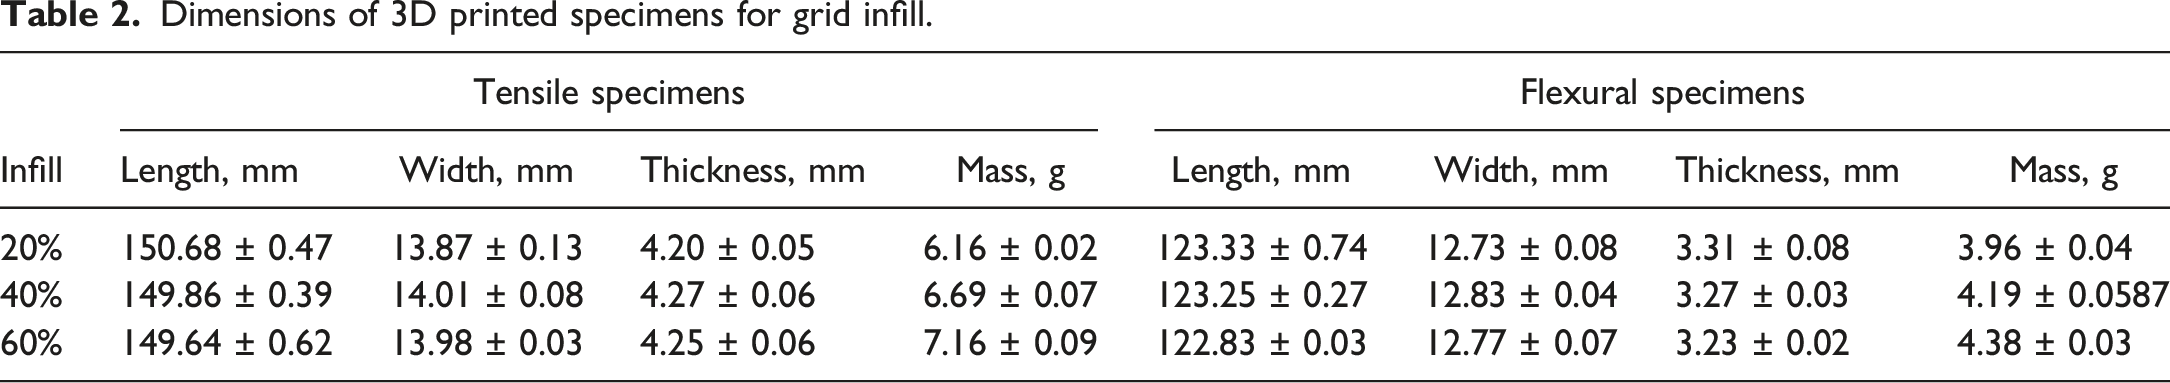
Dimensions of 3D printed specimens for grid infill.
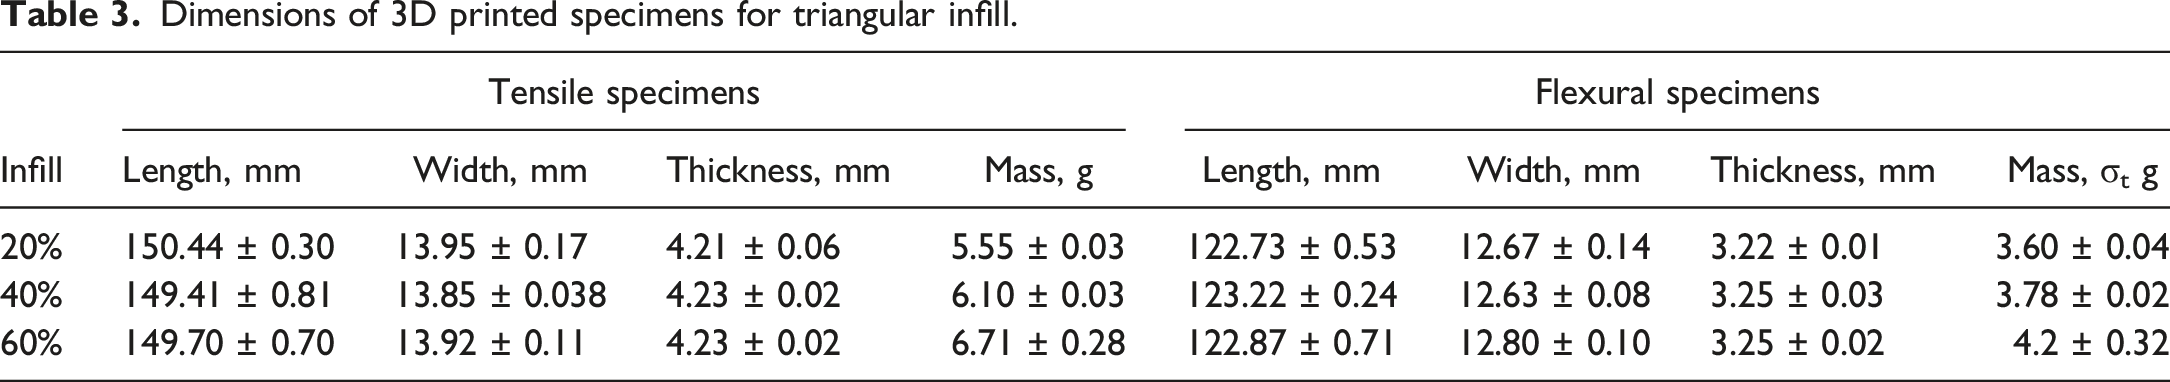
Dimensions of 3D printed specimens for triangular infill.
Tensile and flexural testing measurement procedures
Tensile and flexural tests were conducted to examine and determine the properties of composite specimens. Effects on the tensile properties (tensile strength, Young’s modulus, and ductility) and flexural properties (flexural strength and flexural modulus) of specimens were experimentally investigated. ASTM D3039 standard 58 was followed for the tensile test and ASTM D790 standard 59 for the flexural test at room temperature. According to the above-mentioned standards, to indicate repeatability, at least five samples for each property were printed to analyze the mechanical performance and total 60 specimens were prepared for the testing.
For the tensile test, specimens of rectangular cross-section shape having dimensions of 150×14×4.2 mm were fabricated. 3D printed PLA tabs were applied for the grip having dimensions of 50×14×2 mm with the bevel angle of 30°. In order to measure the elastic strain, four points were marked 16 mm from the center on the specimens. Dual column universal testing machine H25KT (Tinius Olsen, UK) having capacity of 25kN was used to conduct the tensile test. The test was employed between two grips (one fixed and the other movable) to hold the specimens with the standard head displacement rate of 2 mm/min. The tensile strength of specimen was calculated using the relationship
Here, σt is the tensile strength (MPa), F is the maximum tensile load before failure (N), b is the width (mm) and d is the thickness of the specimen (mm).
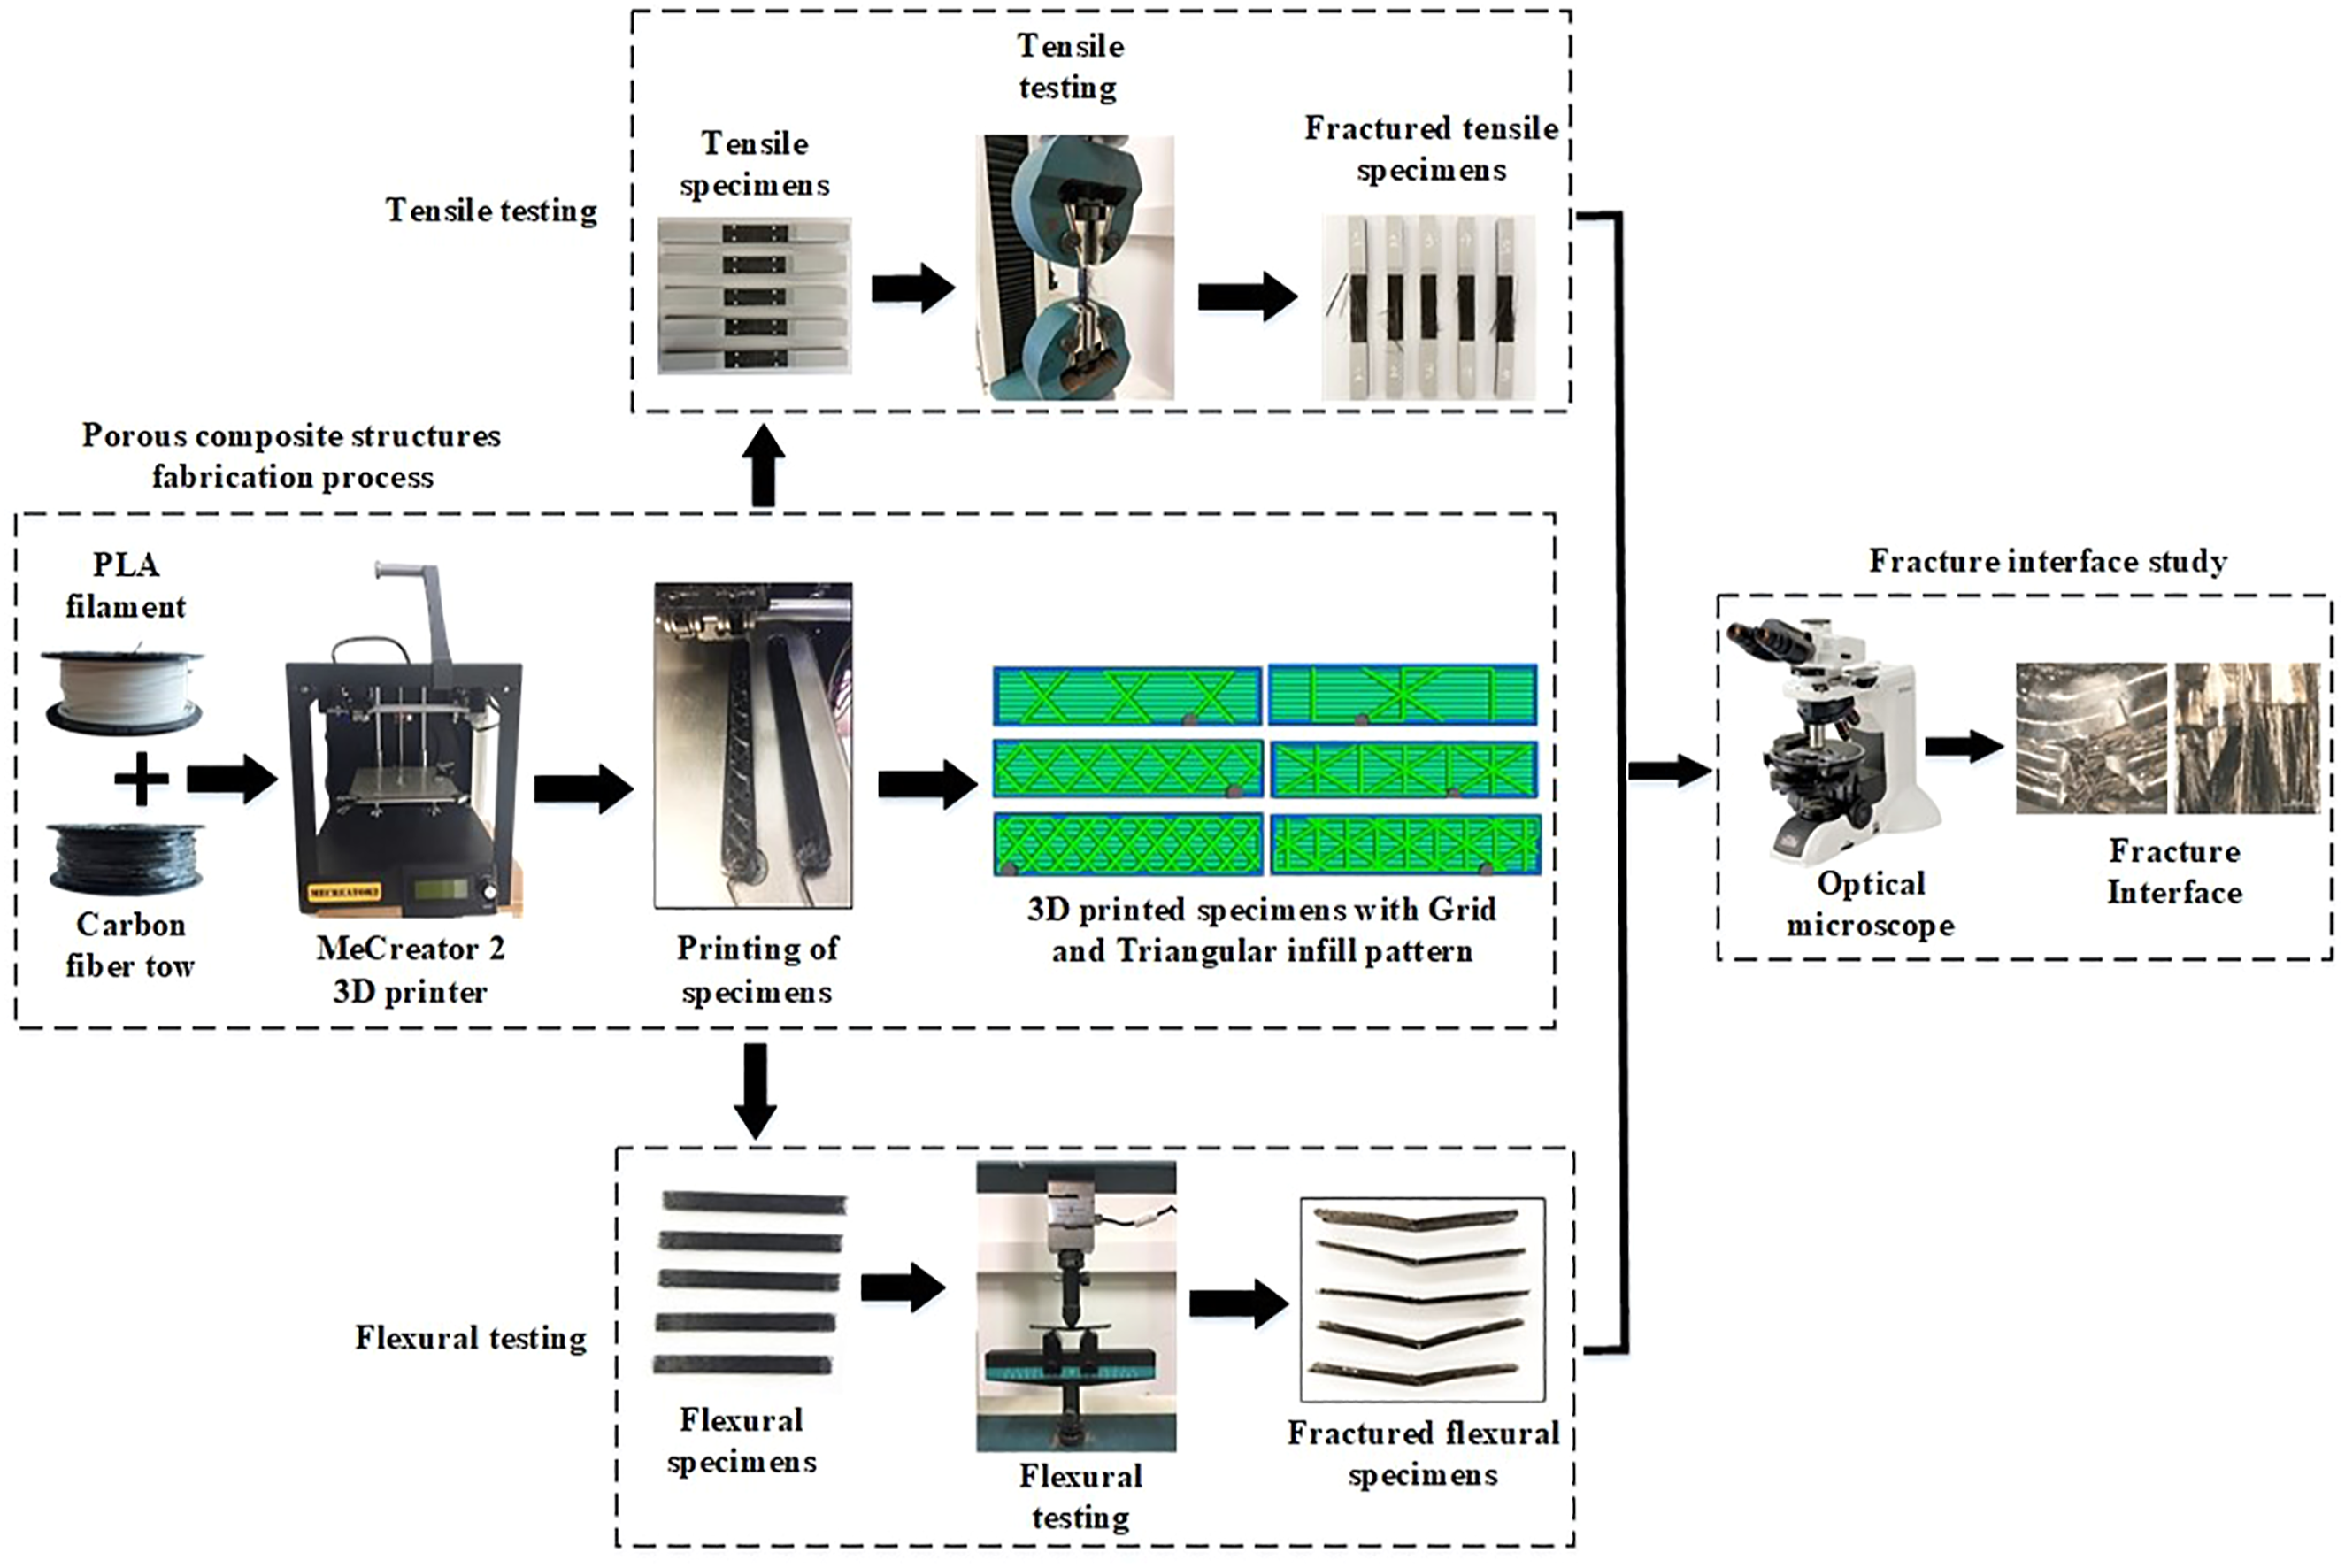
For the flexural test, rectangular shape specimens having dimensions of 123×12.7×3.2 mm were fabricated. A three-point bending set-up (two supports and one midway load nose each of 10mm diameter) was organized using Tinius Olsen H25KT universal testing machine. The test was performed using the crosshead speed of 1.35 mm/min with the span support length of 51.2 mm. The flexural strength was calculated using the equation Fabrication, testing process and fracture analysis of the specimens for the experiment.
Fracture interface study of the specimens
Fracture interface of the 3D printed porous CCFRPC specimens were observed using optical microscope Eclipse LV100ND (Nikon, Japan) equipped with high definition color camera (Nikon DS-Ri2) after performing the tensile and flexural test. The imaging software (NIS Elements 4.5.1.00) was used to prepare and process the data at 5x magnification at the fractured region of the tested composite samples to study the interface bond between the polymer matrix and separated and fractured printed layers and carbon fiber. One specimen which best represent or characterize material behavior during mechanical testing was chosen among the five tested samples to study the fracture interface.
Experimental results and discussion
Part geometries
Figure 3(a) and (b) shows mass as a function of infill percentage for grid and triangular infill pattern of the produced specimens prepared for tensile and flexural test. The masses of each specimen increase with the increase in the infill density. The increase in the mass is caused due to increase in the infill layers more compactly and covers most of the portion inside the shell of the structure, while in the perimeter shell, the bottom and top solid layers remain the same throughout the experiment for each specimen. By relating both the infill patterns, grid structure occupies most of the area within the perimeter shell for each infill densities compared to triangular infill pattern, presenting more compact and dense structure, therefore exhibits more mass for both tensile and flexural test specimens. Different infill pattern shows dissimilar masses, despite having same infill densities, due to change in the structure of the geometry. The internal structure within the 3D printed specimen plays an important role in defining the mechanical properties of the composite part. The unit cells of both the infill patterns and density levels and the distribution of orientation of the lines were designed and selected by the Simplify 3D. The void content calculated within the composite specimens was approximately 22%.
36
3D printed specimens with grid and triangular infill pattern mass as a function of infill percentage for (a) tensile and (b) flexural.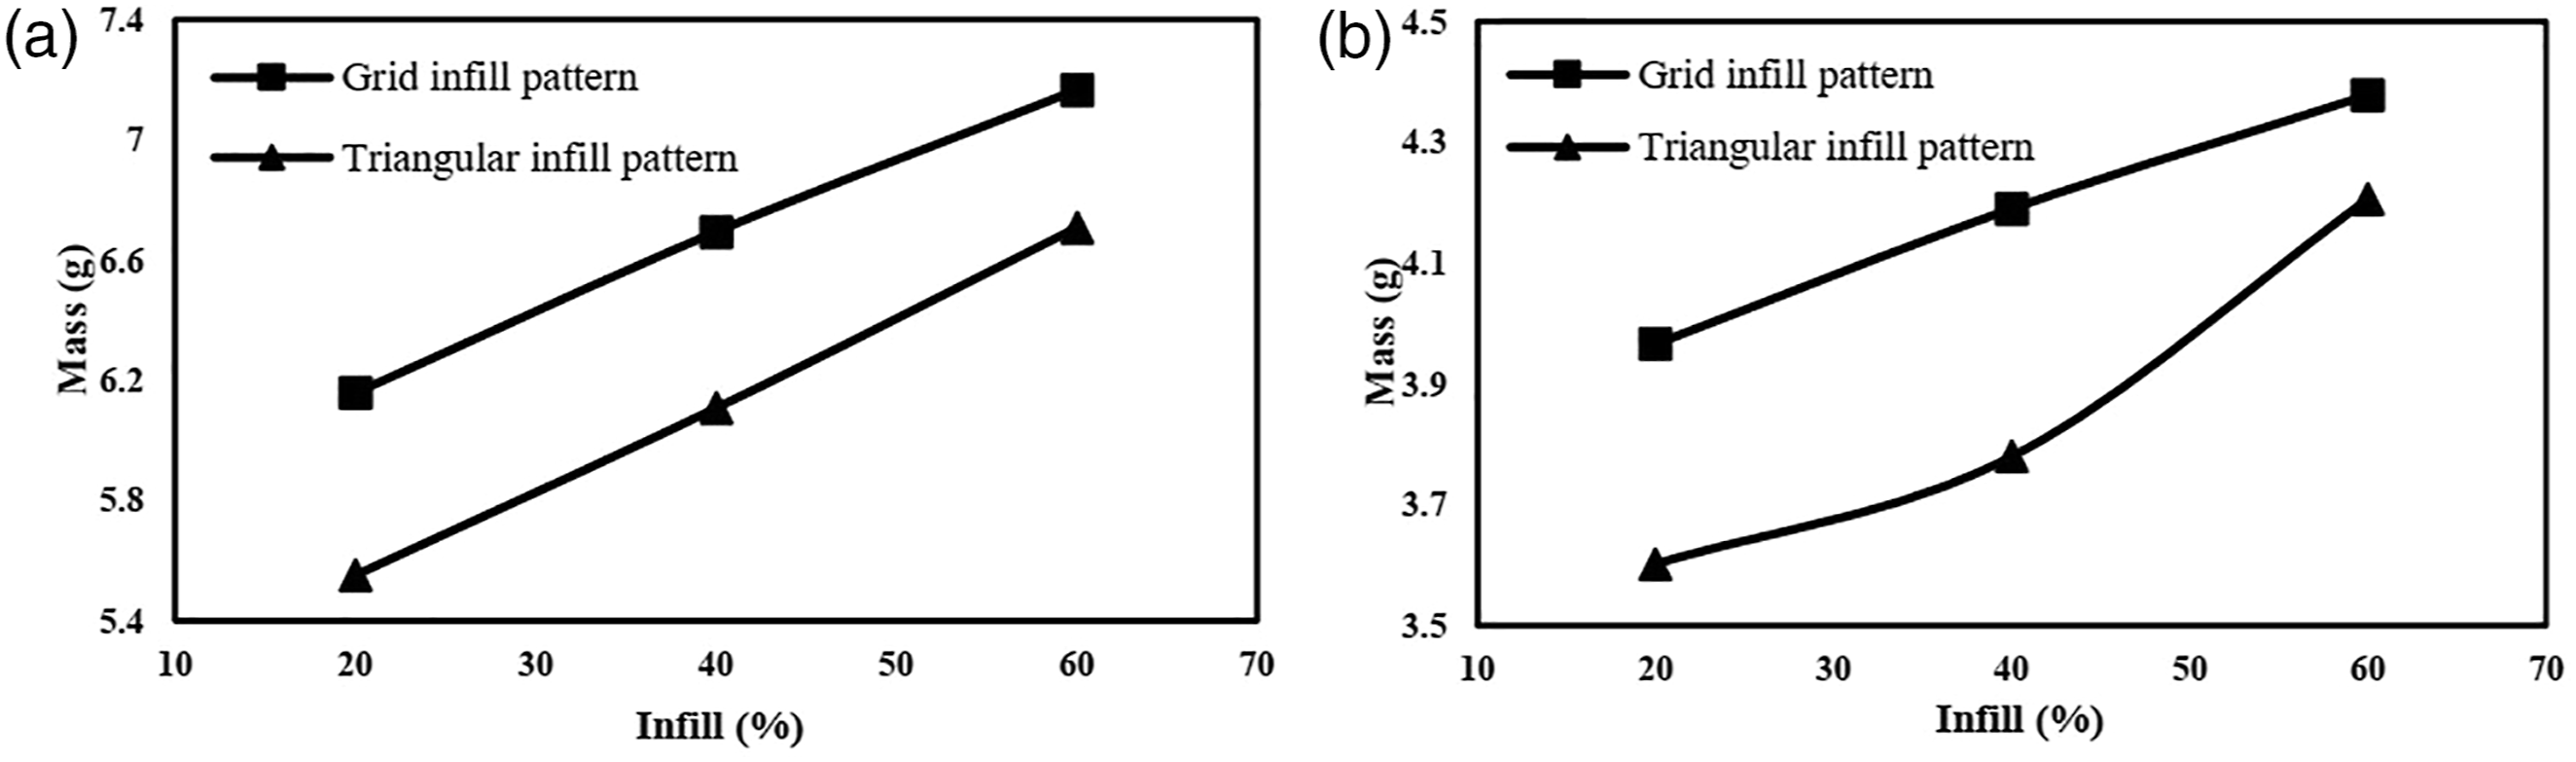
Grid infill pattern
Uniaxial tensile loading
The tensile test was conducted to compare the tensile properties of the specimens printed at different infill densities. Typical tensile stress–strain curves are presented in Figure 4(a) for each infill density. From the stress–strain curves, it can be seen that the specimen printed with 60% grid infill density attains the highest stress level followed by the 40% and 20% infill densities, respectively, that show almost similar stresses points. Results of tensile properties of 3D printed grid infill pattern samples.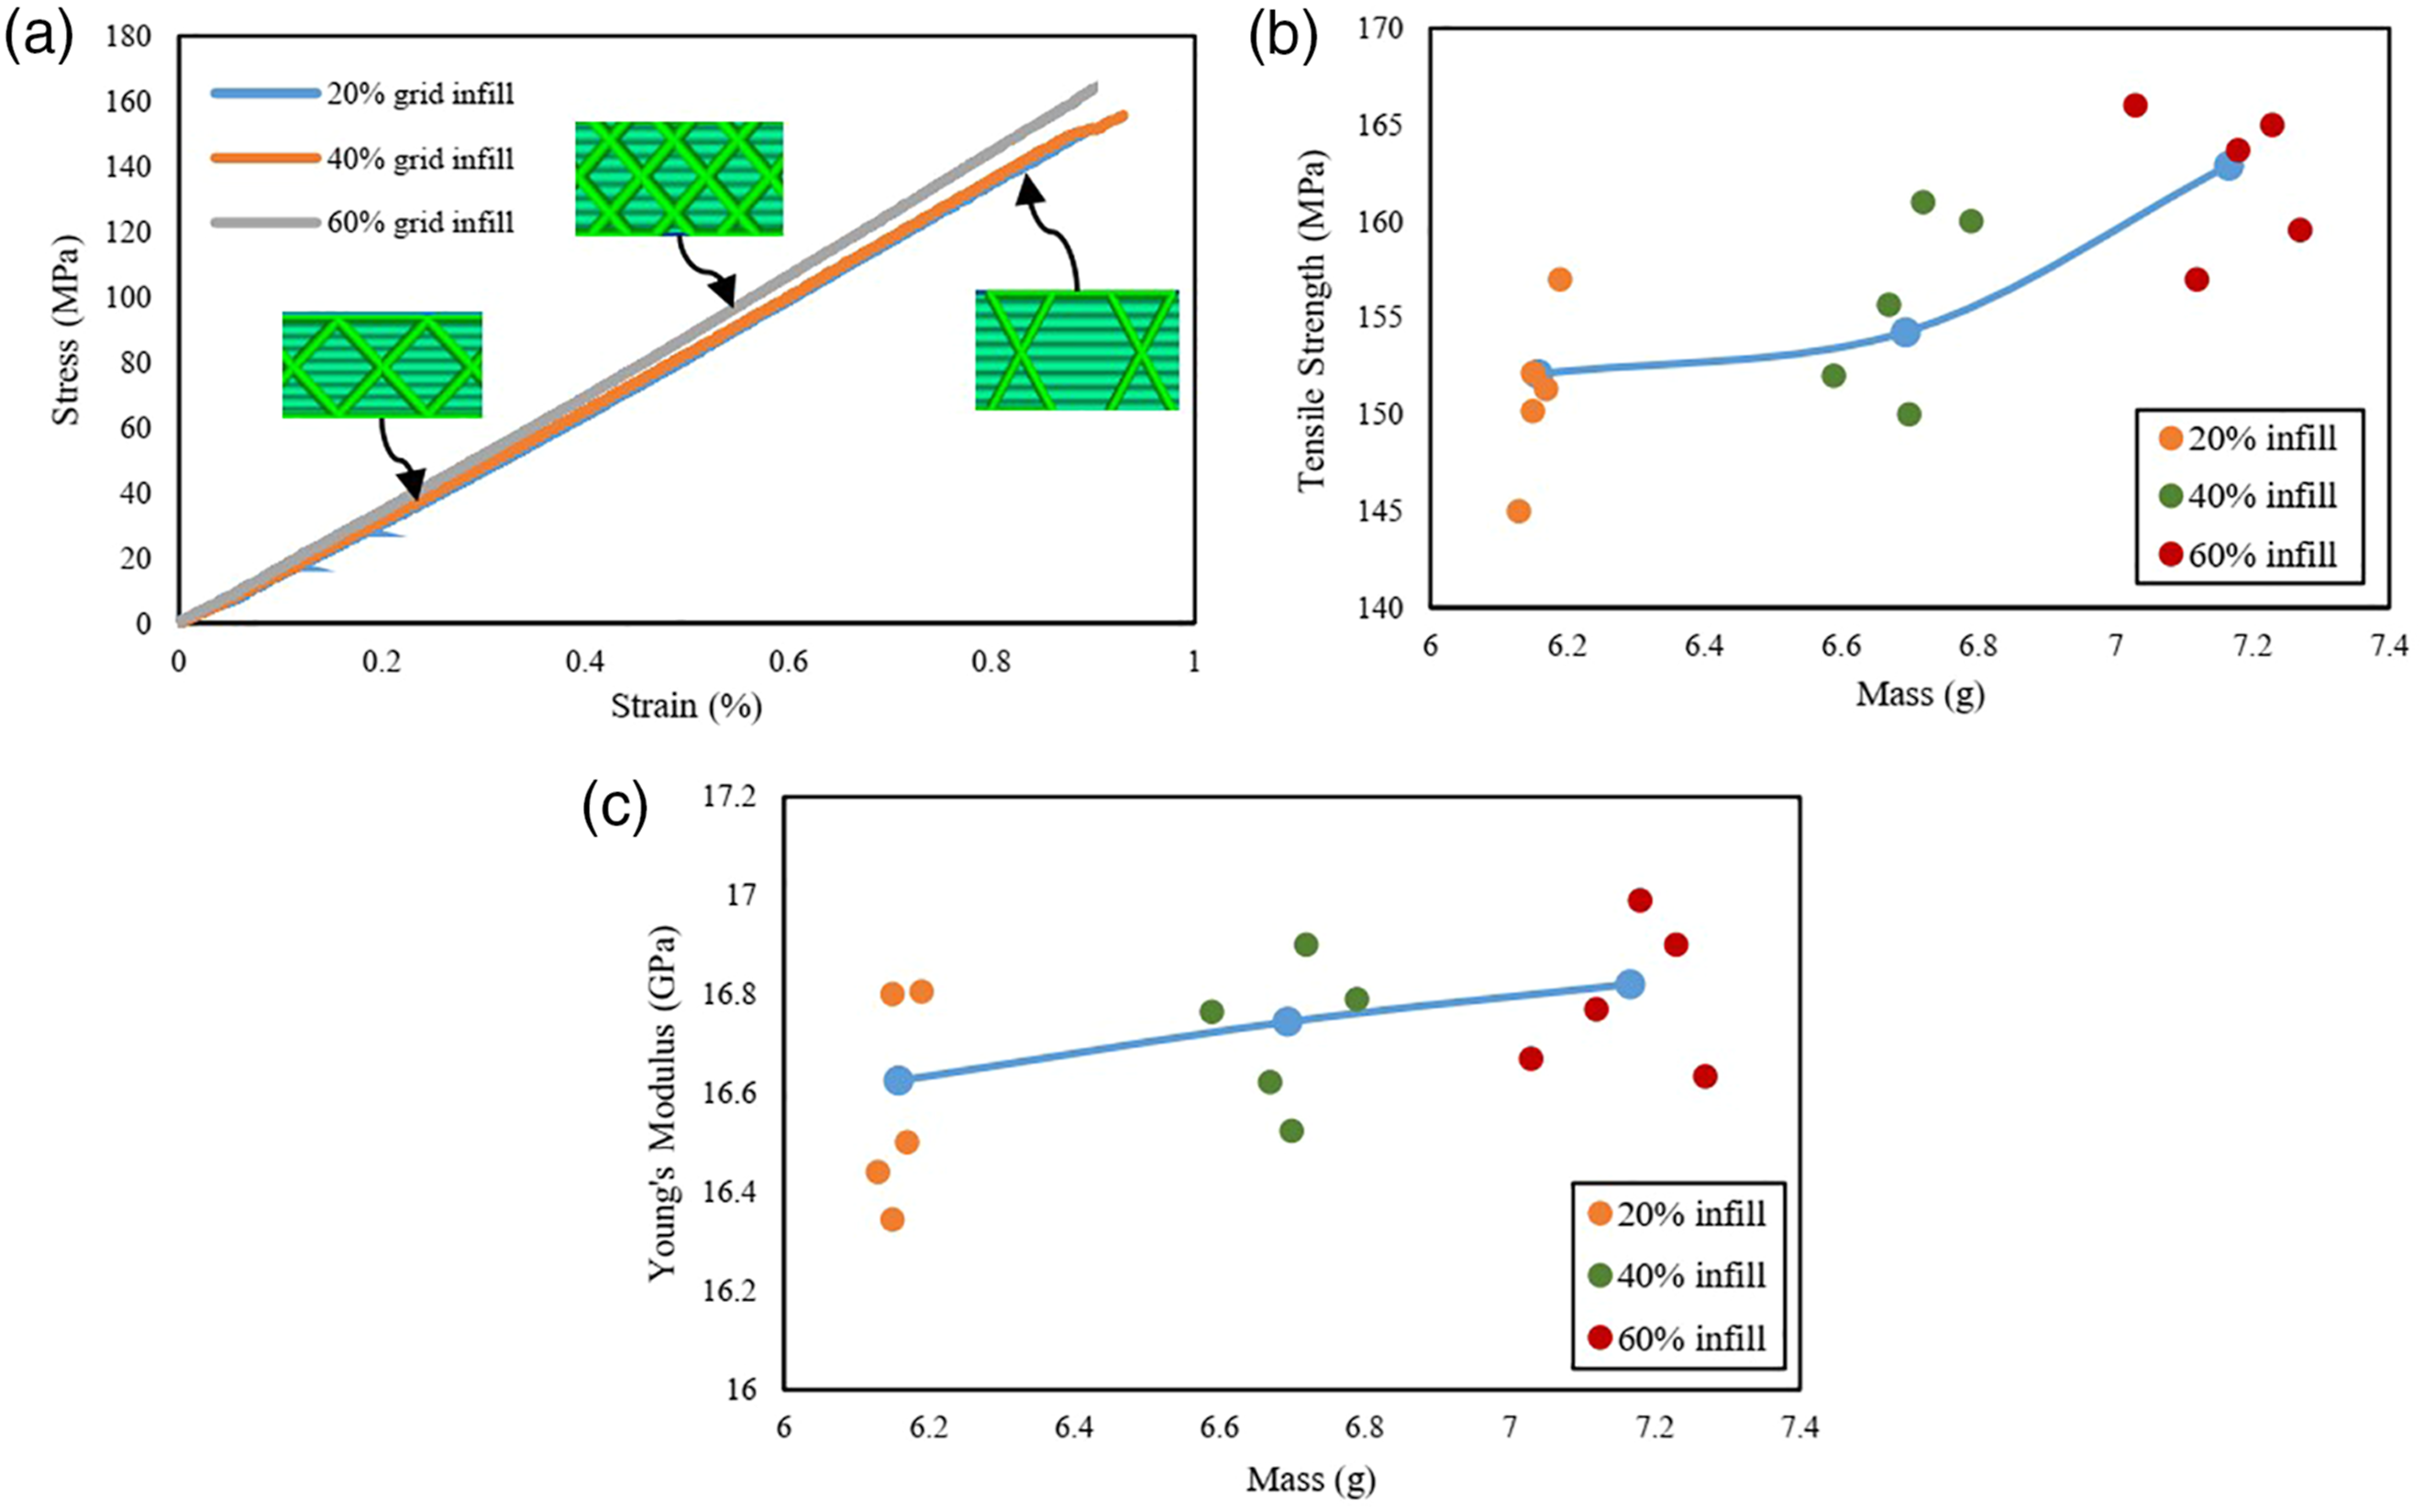
According to ASTM D3039,
58
specimens when undergo tensile test during the pulling up to the rupture, showed edge delamination-gage-middle (DGM) and grip-at tab-top (GAT) failure modes. The different failure modes are caused due to the gripping pressure, specimen geometry, tab material that affects the tensile strength of the specimens under the same test conditions.
60
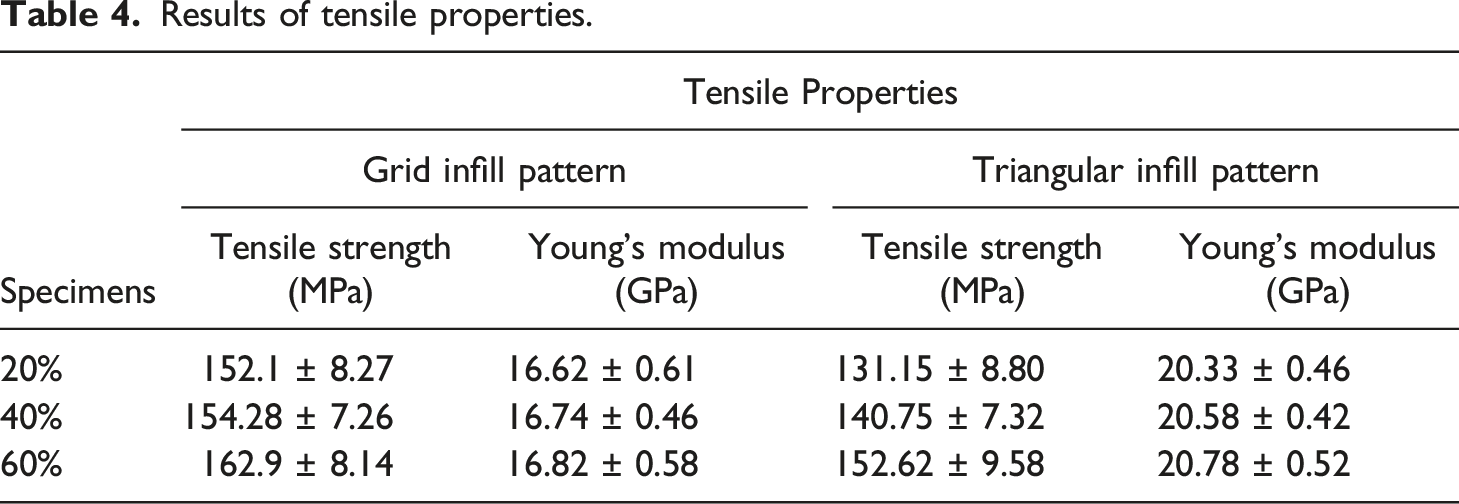
Figure 5(b) and (c) present average tensile strength and young’s modulus as a function of mass with each individual specimen levels, the result showed increase in the strength and modulus value with the increase in mass and infill percentage. The differences in the mass and strength of individual specimen for the same infill may cause due to non-uniform printing process, although the same printing and testing parameters were applied for each specimen. Tensile strength as a function of mass showed almost similar behavior for the 20% and 40% infill density level, but significantly increased when the infill density level increased to 60%. In case of young’s modulus, it showed slightly changed and increased in the value with the high differences in the individual specimen level when the infill density increased from 20% to 60%. Table 4 shows the results of tensile properties measured from tensile test. Data of the 3D printed specimens with grid infill pattern for the tensile (a) stress–strain curves (b) strength as a function of mass and (c) Young’s modulus as a function of mass. Results of tensile properties.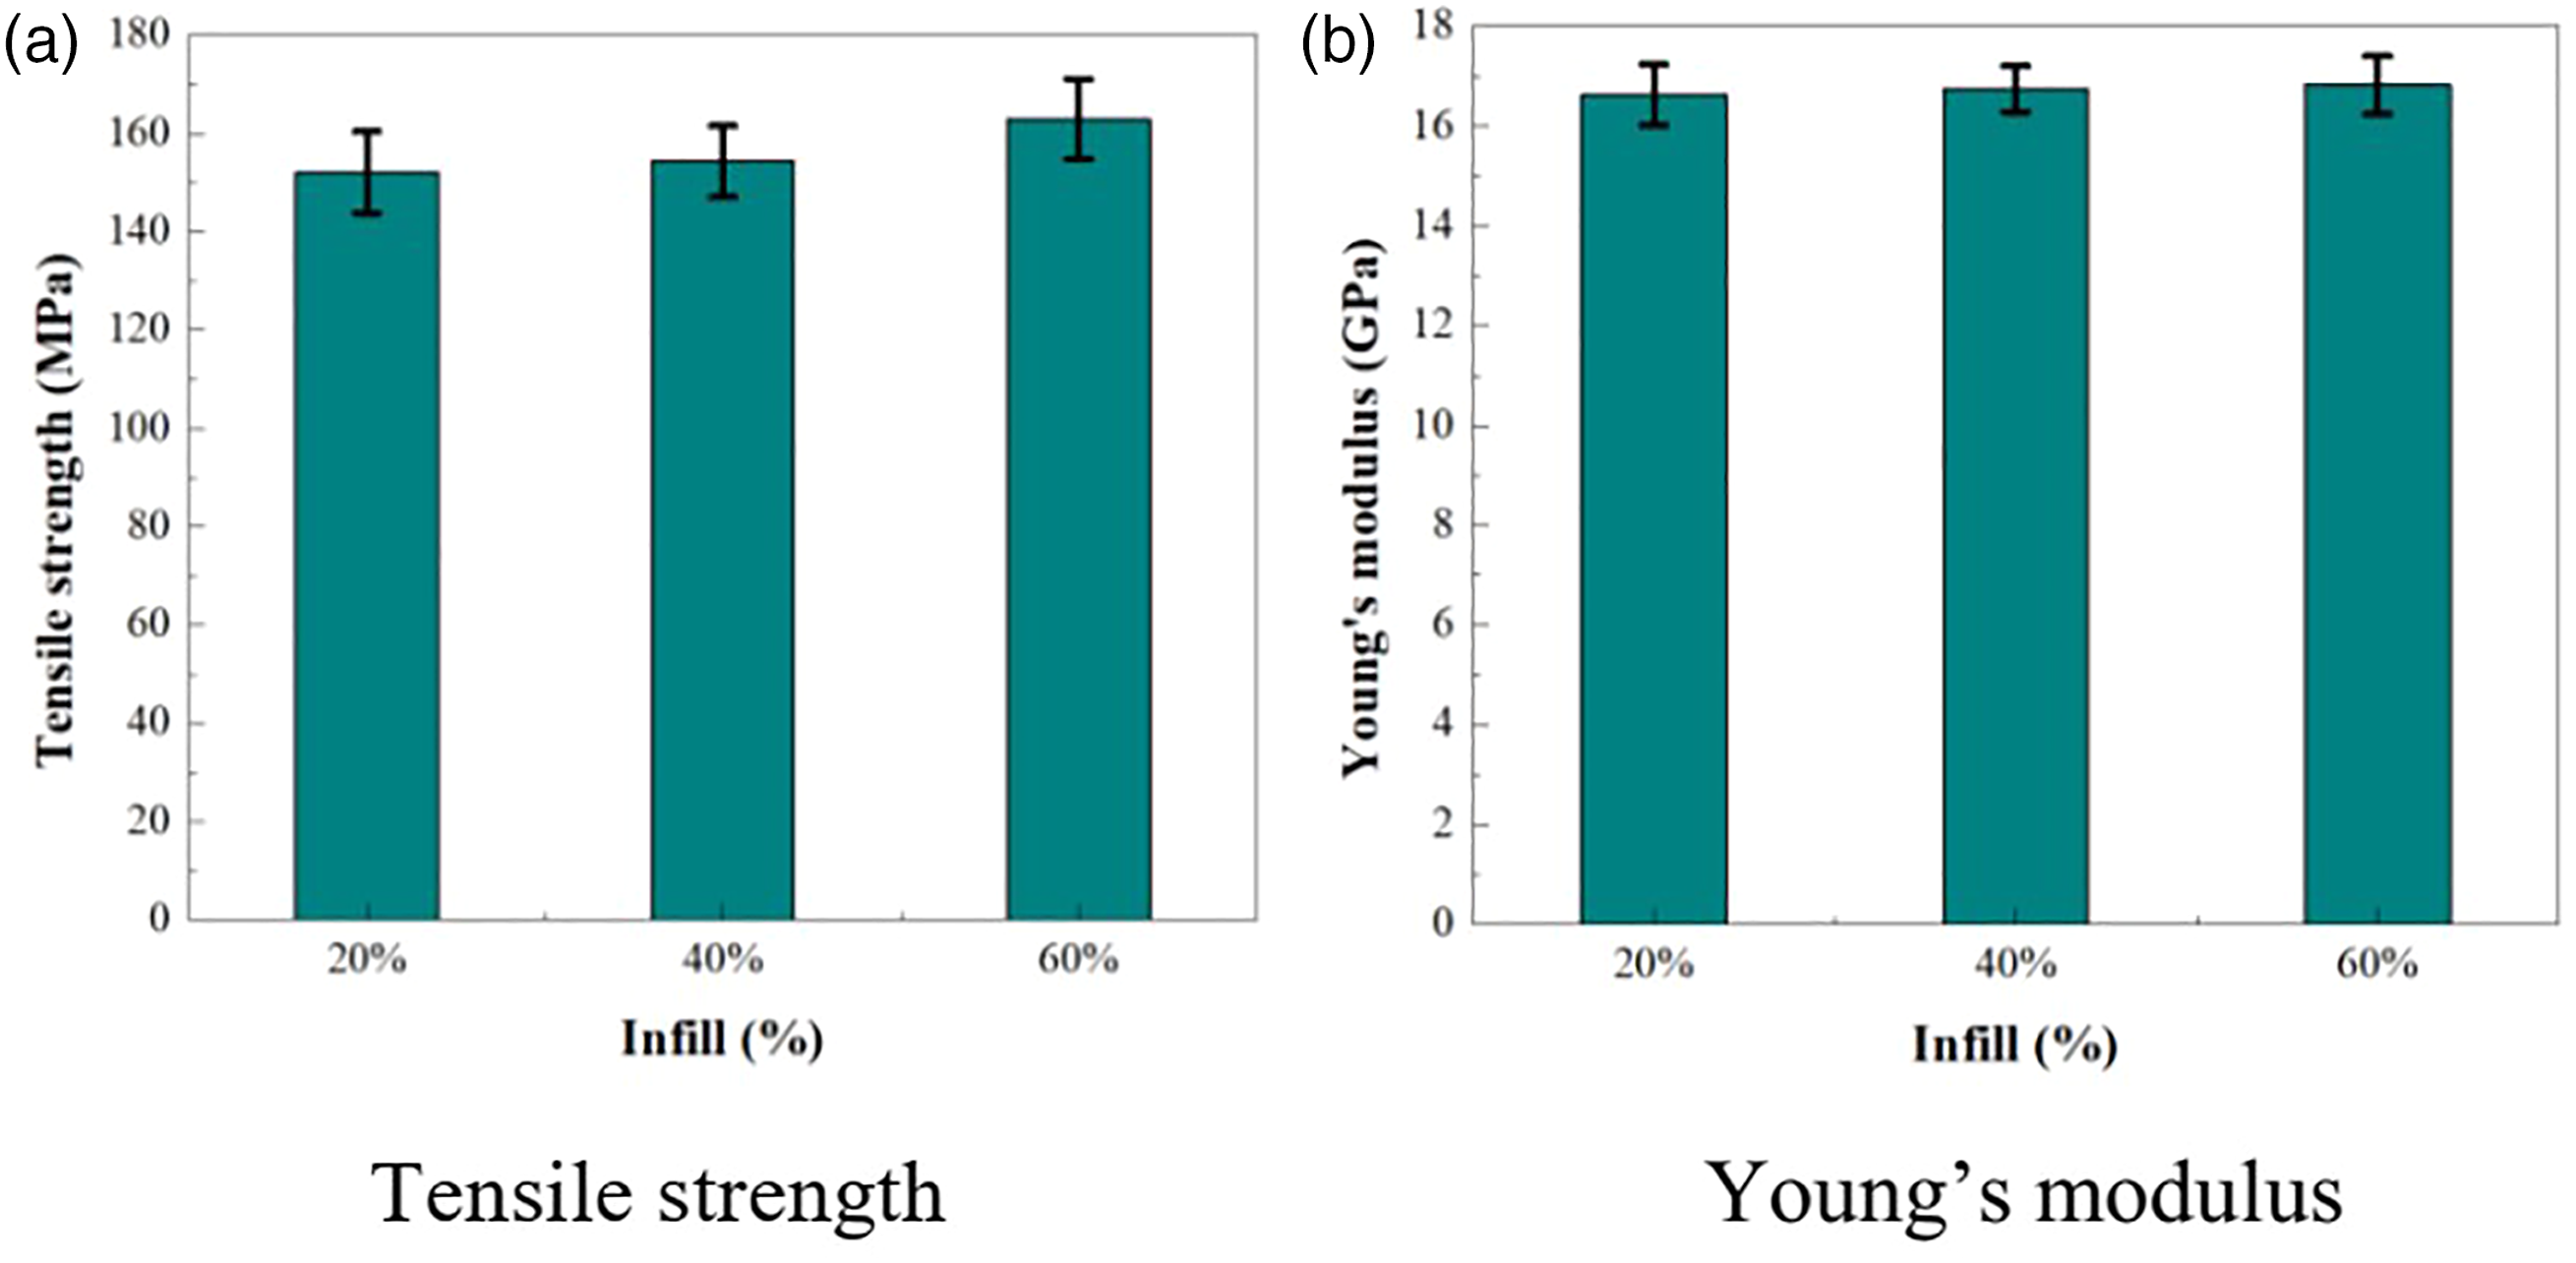
The tensile properties (including tensile strength and Young’s Modulus) for each infill densities are shown in Figure 4. Bar graph plots were used to express the data of tensile properties. From the bar graph plot Figure 4(a), it can be seen that specimen with infill density of 60% attains the largest mean tensile strength value of 162.9 MPa while 40% and 20% percent grid infill have mean strength values of 154.28 MPa and 152.1 MPa, respectively, and showed increase in the strength value with the increase in infill density. The tensile strength for grid infill pattern with 60% infill density increased up to 7% and 5.6% compared to 20% and 40% infill densities, respectively.
Effects of infill densities on Young’s modulus is shown in Figure 4(b). The Young’s modulus slightly increases with the increase in infill density of the specimen. 20% infill density shows an average Young’s modulus value of 16.62 GPa. Continuing increasing in the infill density level to 40% resulted in Young’s modulus increased to 16.74 GPa and the largest value of 16.82 GPa was found in 60% infill density. The results indicated that by increasing the infill density of the specimen will increase the value of Young’s Modulus.
Flexural loading
Flexural test was performed to analyze the flexural properties of the specimens printed at different infill densities. According to the ASTM D790 standard,
59
flexural test would be only valid, if the maximum deformation in the outer region of the specimen occurred within the 5% strain limit. In this study, all specimens fractured within 5% elongation. Typical flexural stress–strain curve for grid infill pattern specimens printed at three different infill densities level is demonstrated in Figure 6(a). From the stress–strain curve, it can be seen that specimen printed with 60% infill achieves the highest level of flexural stress, while the lowest flexural stress level can be observed in the specimen printed with 20% infill density level. Data of the 3D printed specimens with grid infill pattern for the flexural (a) stress–strain curves (b) strength as a function of mass and (c) modulus as a function of mass.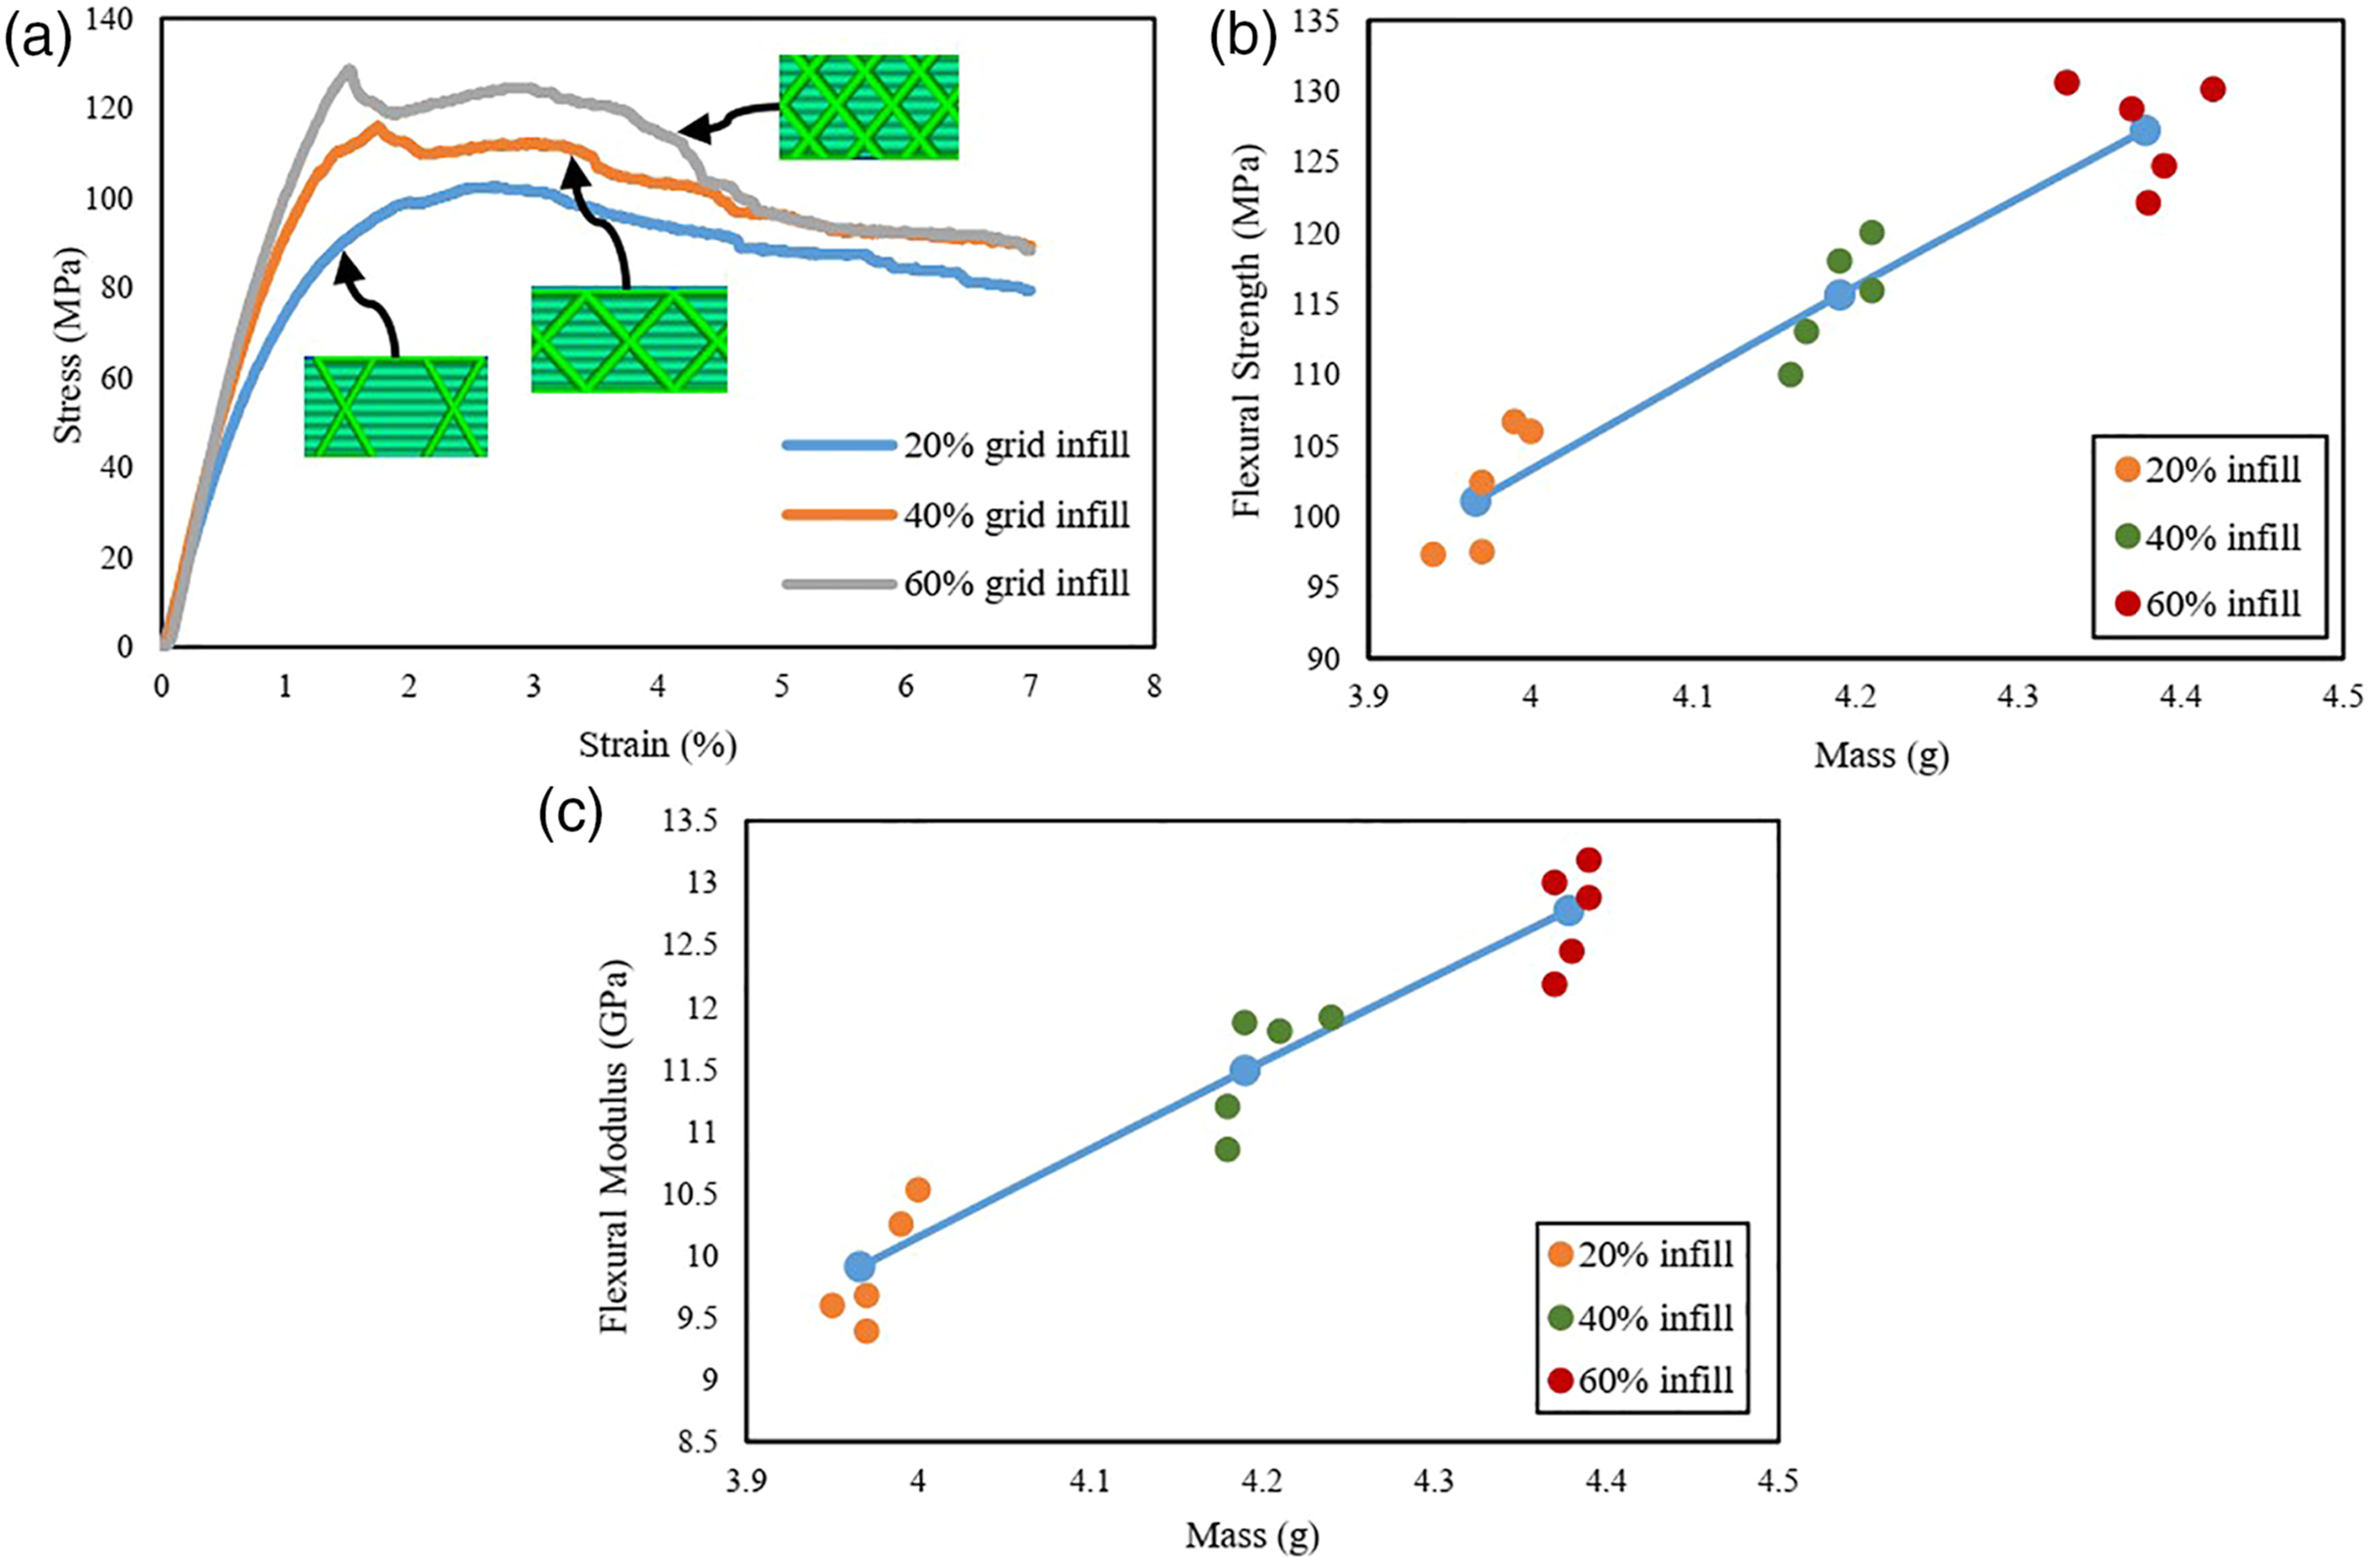
Figure 6(b) and (c) present average flexural stress and flexural modulus as a function of mass for each specimen levels printed at three different infill percentages, respectively. The result showed the increase in strength and modulus values with the increase in mass. The significant increase in the flexural stress and flexural modulus can be observed with the increase in the infill density level and masses of the specimens. The figures showed the average curves with each individual 3D printed specimen infill level.
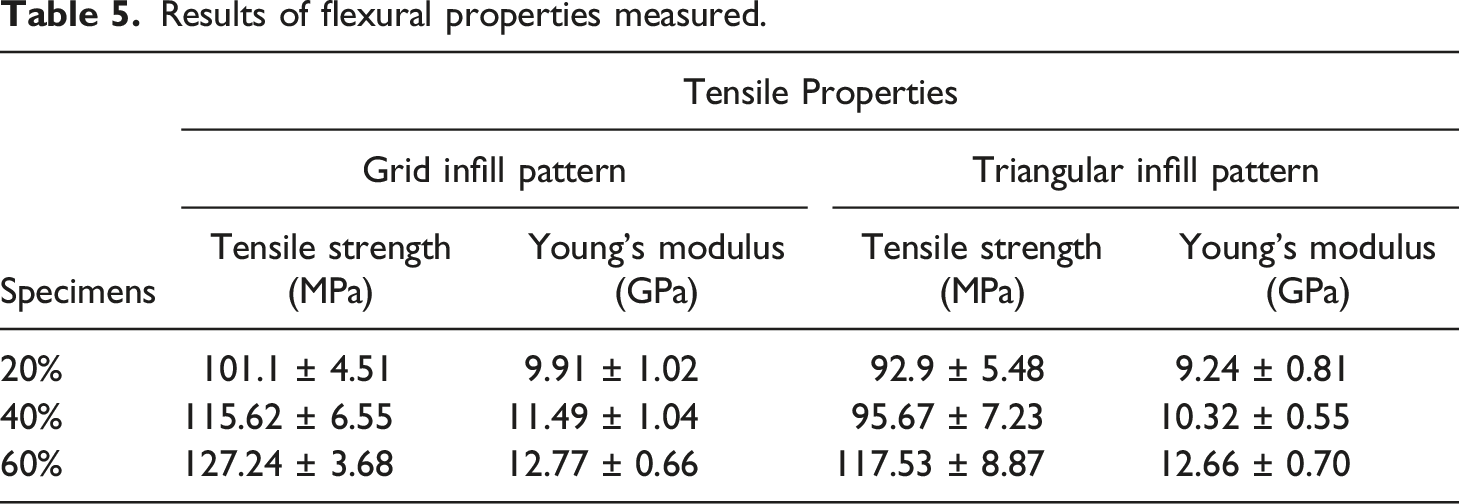
Results of flexural properties measured.
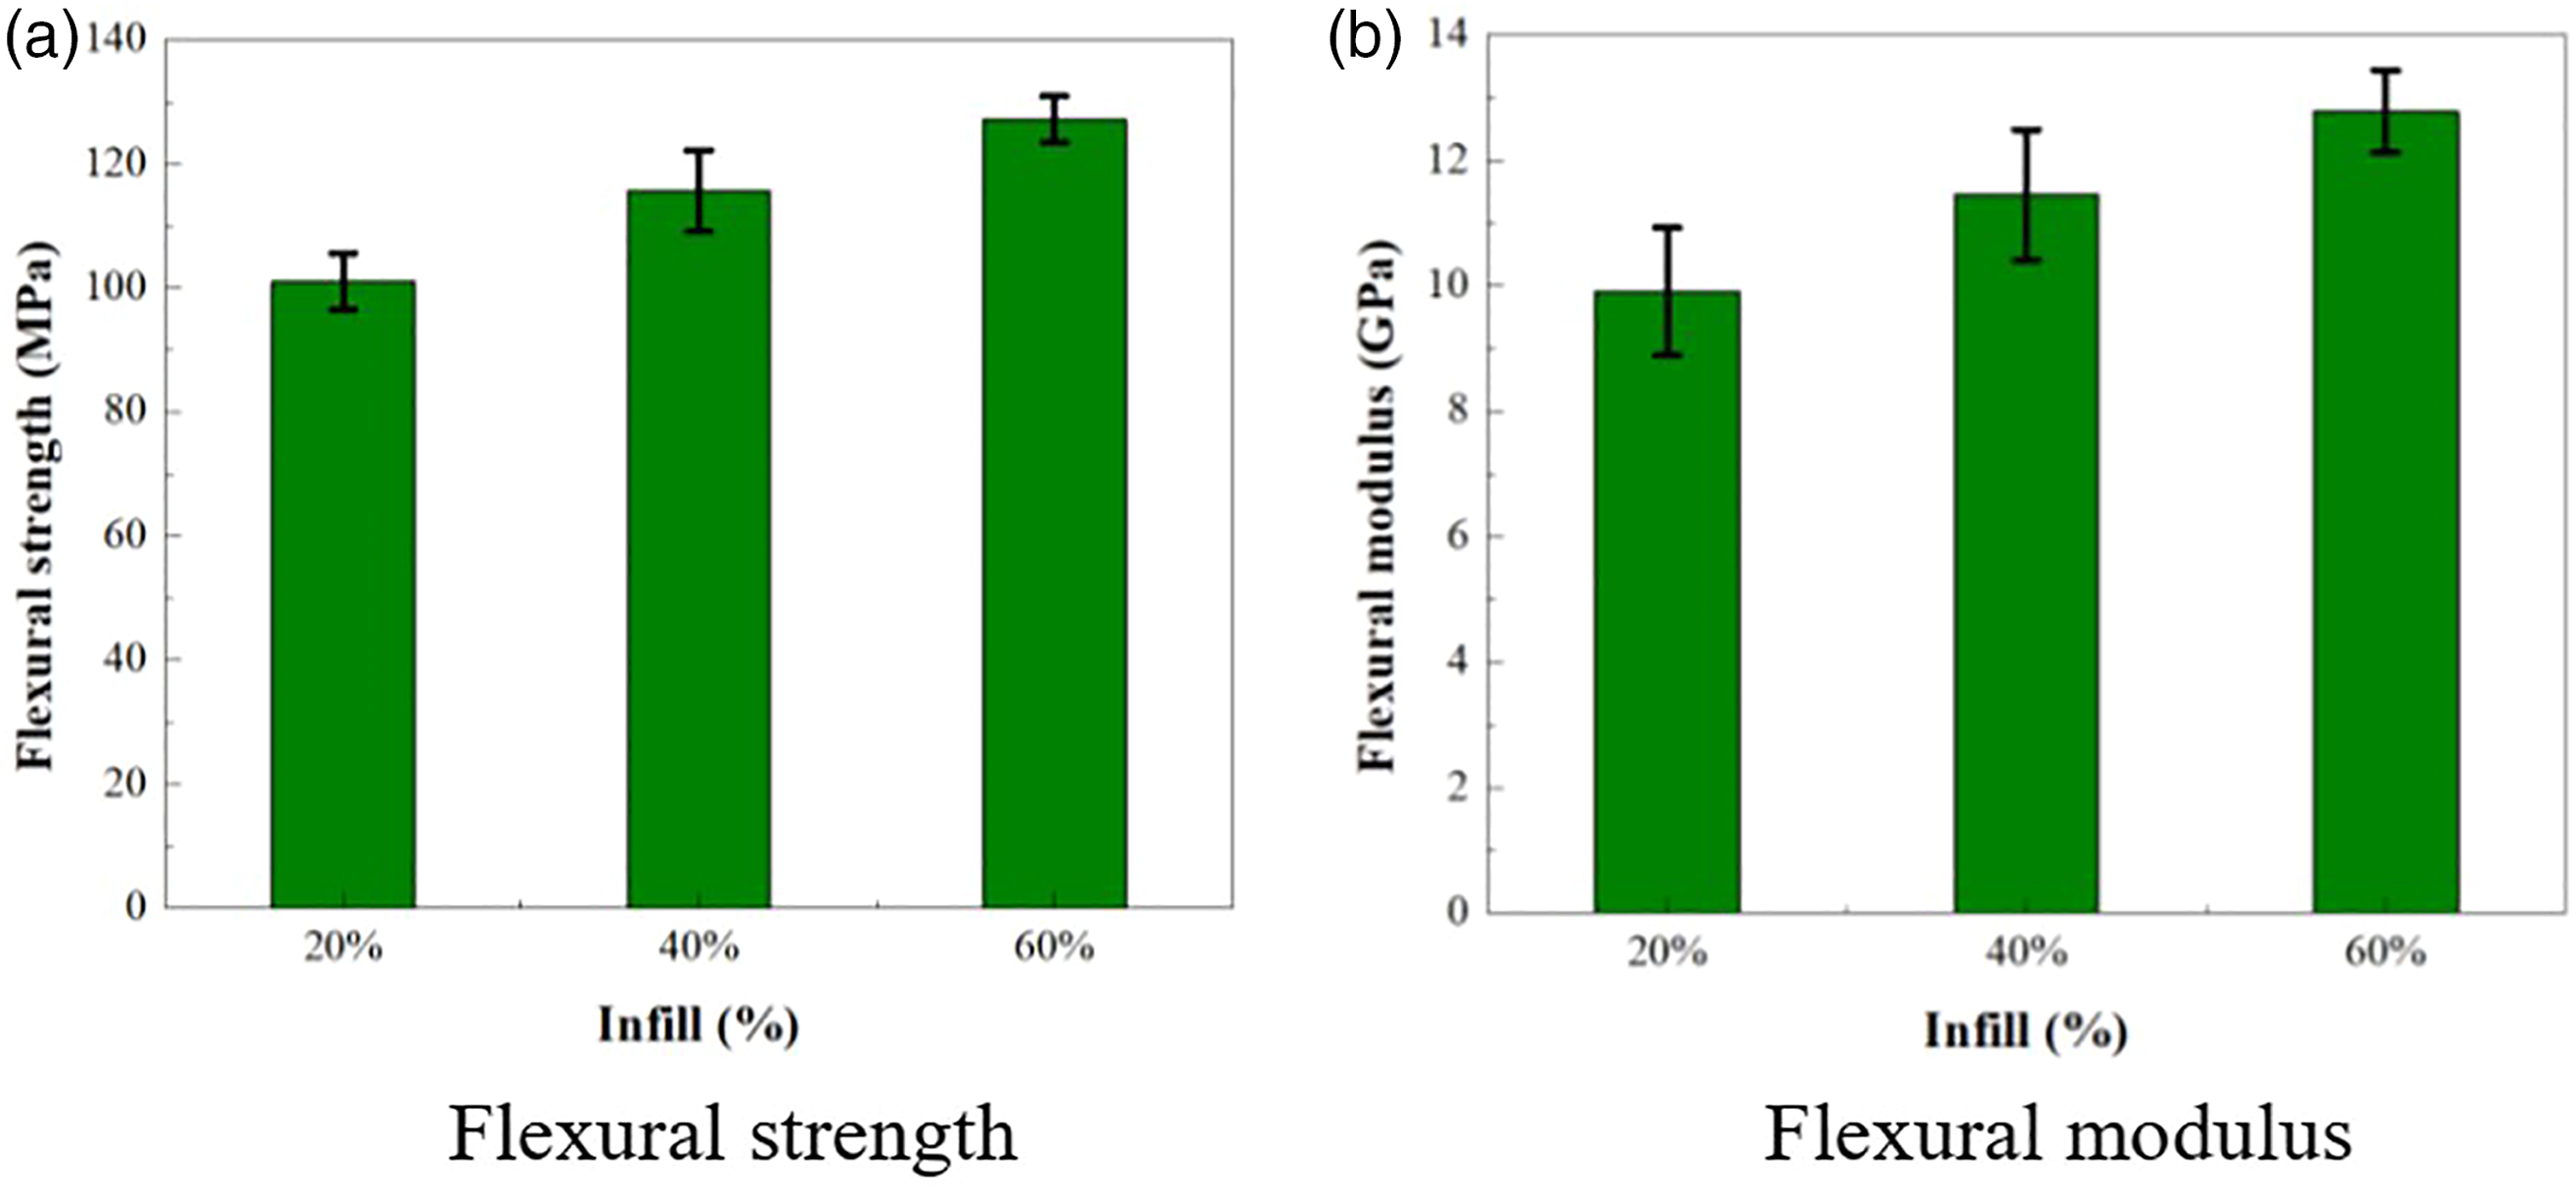
Results of flexural properties of 3D printed grid infill pattern samples.
From the bar graph plot (Figure 7(a)), it can be seen that the flexural stress value increases with the increase in the infill density level. The specimen printed with 60% infill density showed the largest mean flexural stress value of 127.82 MPa. While the specimens printed with 40% and 20% infill densities showed the average flexural stress values of 115.6 MPa and 101.1 MPa, respectively. The flexural strength of grid infill pattern with 60% infill increased up to 10% and 25% compared to 40% and 20% infill, respectively. Figure 7(b) showed the result of flexural modulus and the highest mean flexural modulus value of 12.77 GPa can be found in specimen printed with 60% infill, while the specimens printed with 40% and 20% infills showed the average flexural modulus values of 11.49 GPa and 9.91 GPa, respectively. The flexural modulus results indicated that by increasing the infill density level, will increase the flexural modulus value of the composite printed specimen.
Triangular infill pattern
Uniaxial tensile loading
The tensile properties of the specimens printed at different infill densities were investigated through tensile test. The trend of the typical tensile stress–strain curves of specimens with triangular infill pattern printed at 20%, 40%, and 60% infill densities are presented in Figure 8(a). From the stress–strain curves, it can be seen that the specimen printed with 60% infill density reaches the highest stress level, while the 20% infill density specimens showed the lowest stress level. The specimens showed similar failure modes of DGM and GAT when undergo tensile test. Data of the 3D printed specimens with triangular infill pattern for the tensile (a) stress–strain curves (b) strength as a function of mass and (c) Young’s modulus as a function of mass.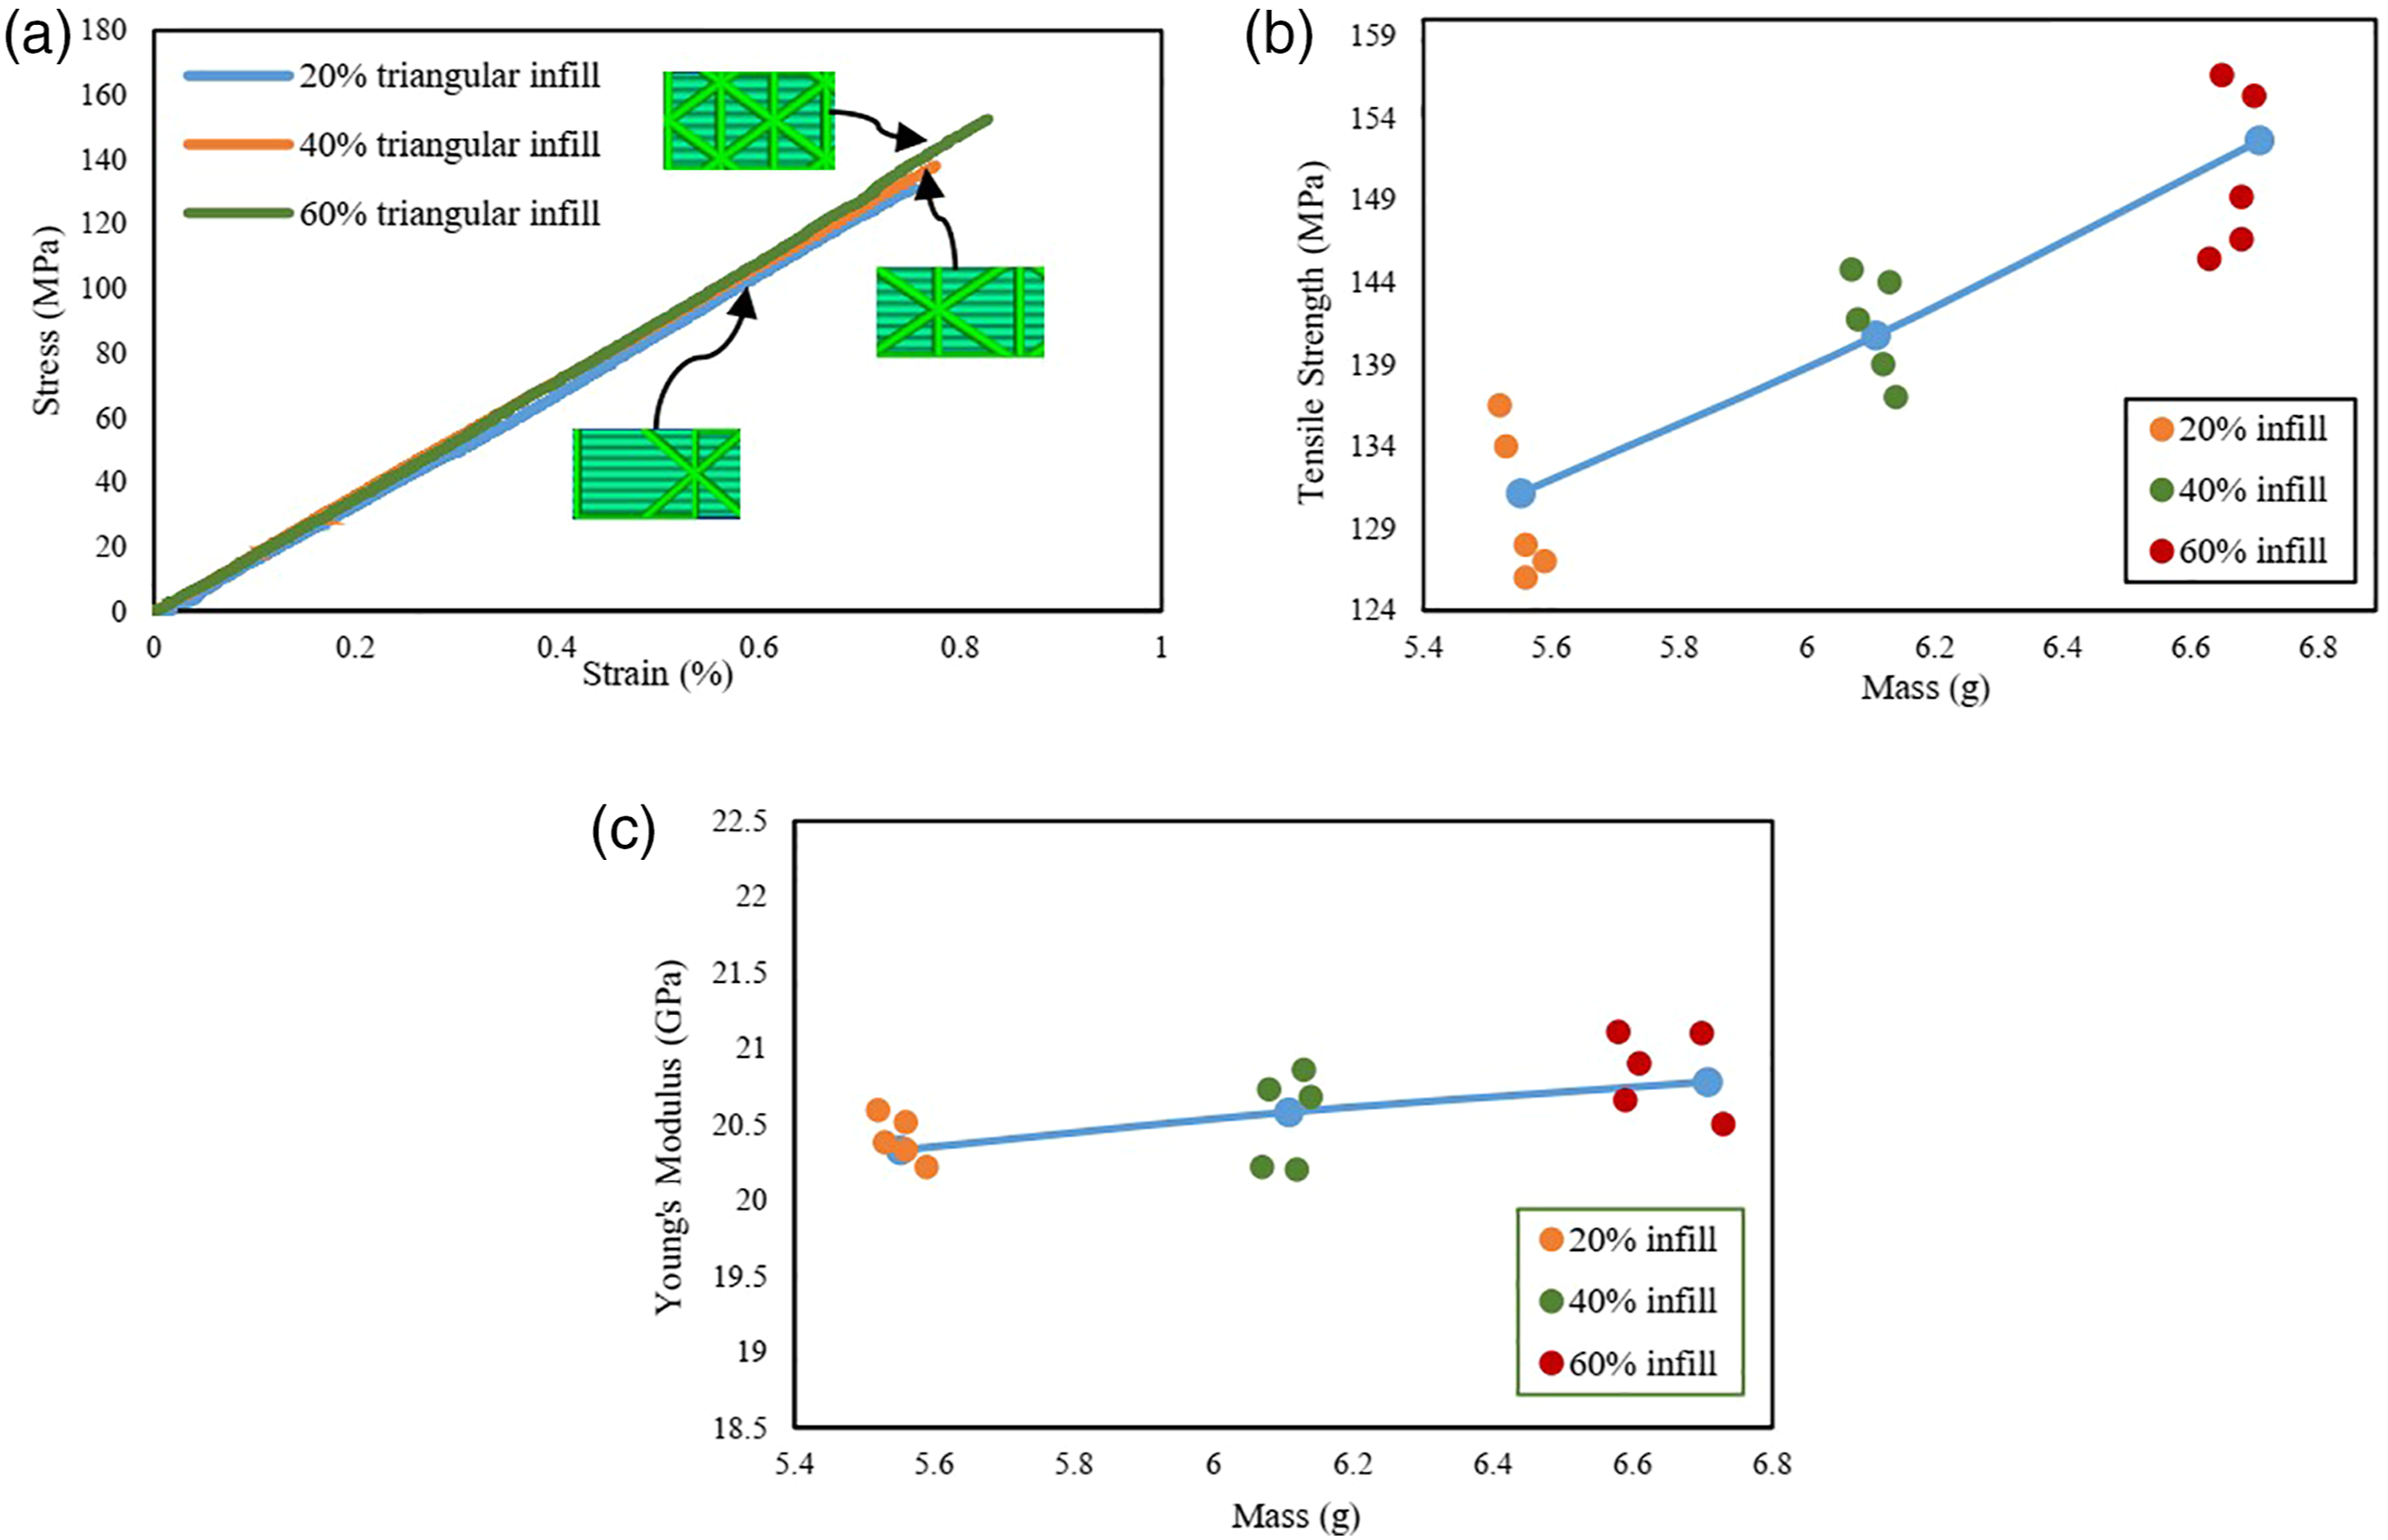
Average tensile strength and Young’s modulus as a function of mass with each individual specimen levels are presented in Figure 8(b) and (c). The results showed similar behavior compared to grid infill pattern. The tensile strength as a function of mass result showed the maximum level when the infill density reaches to 60% and decreases with the decrease in infill density. The significant increase in the strength level can be perceived with the increase in infill density. While the Young’s modulus as a function of mass result showed the minimum level at 20% infill density and slightly increases when the infill density increases from 40% to 60% infill density that showed almost similar level. More uniform printing of individual specimen levels can be observed in this case. The results for the uniaxial tensile properties are summarized in Table 4.
The mean values in bar plots (Figure 9) were used to illustrate the trend of each printed group specimens with the range of their result effects on the tensile properties. The specimen printed with 60% triangular pattern infill showed the highest mean tensile strength value of 152.62 MPa. Increasing the infill density resulted increase in the strength value as specimen printed with 40% and 20% triangular pattern infill reached the average tensile strength values of 140.75 MPa and 131.15 MPa, respectively. When the infill density increases from 20% to 40%, the tensile strength increases by 7.3%. Similarly, the differences in the tensile strength value between the infill density 40% and 60% showed increase in the strength value by 8.4% (Figure 9(a)). Results of tensile properties of 3D printed triangular infill pattern samples.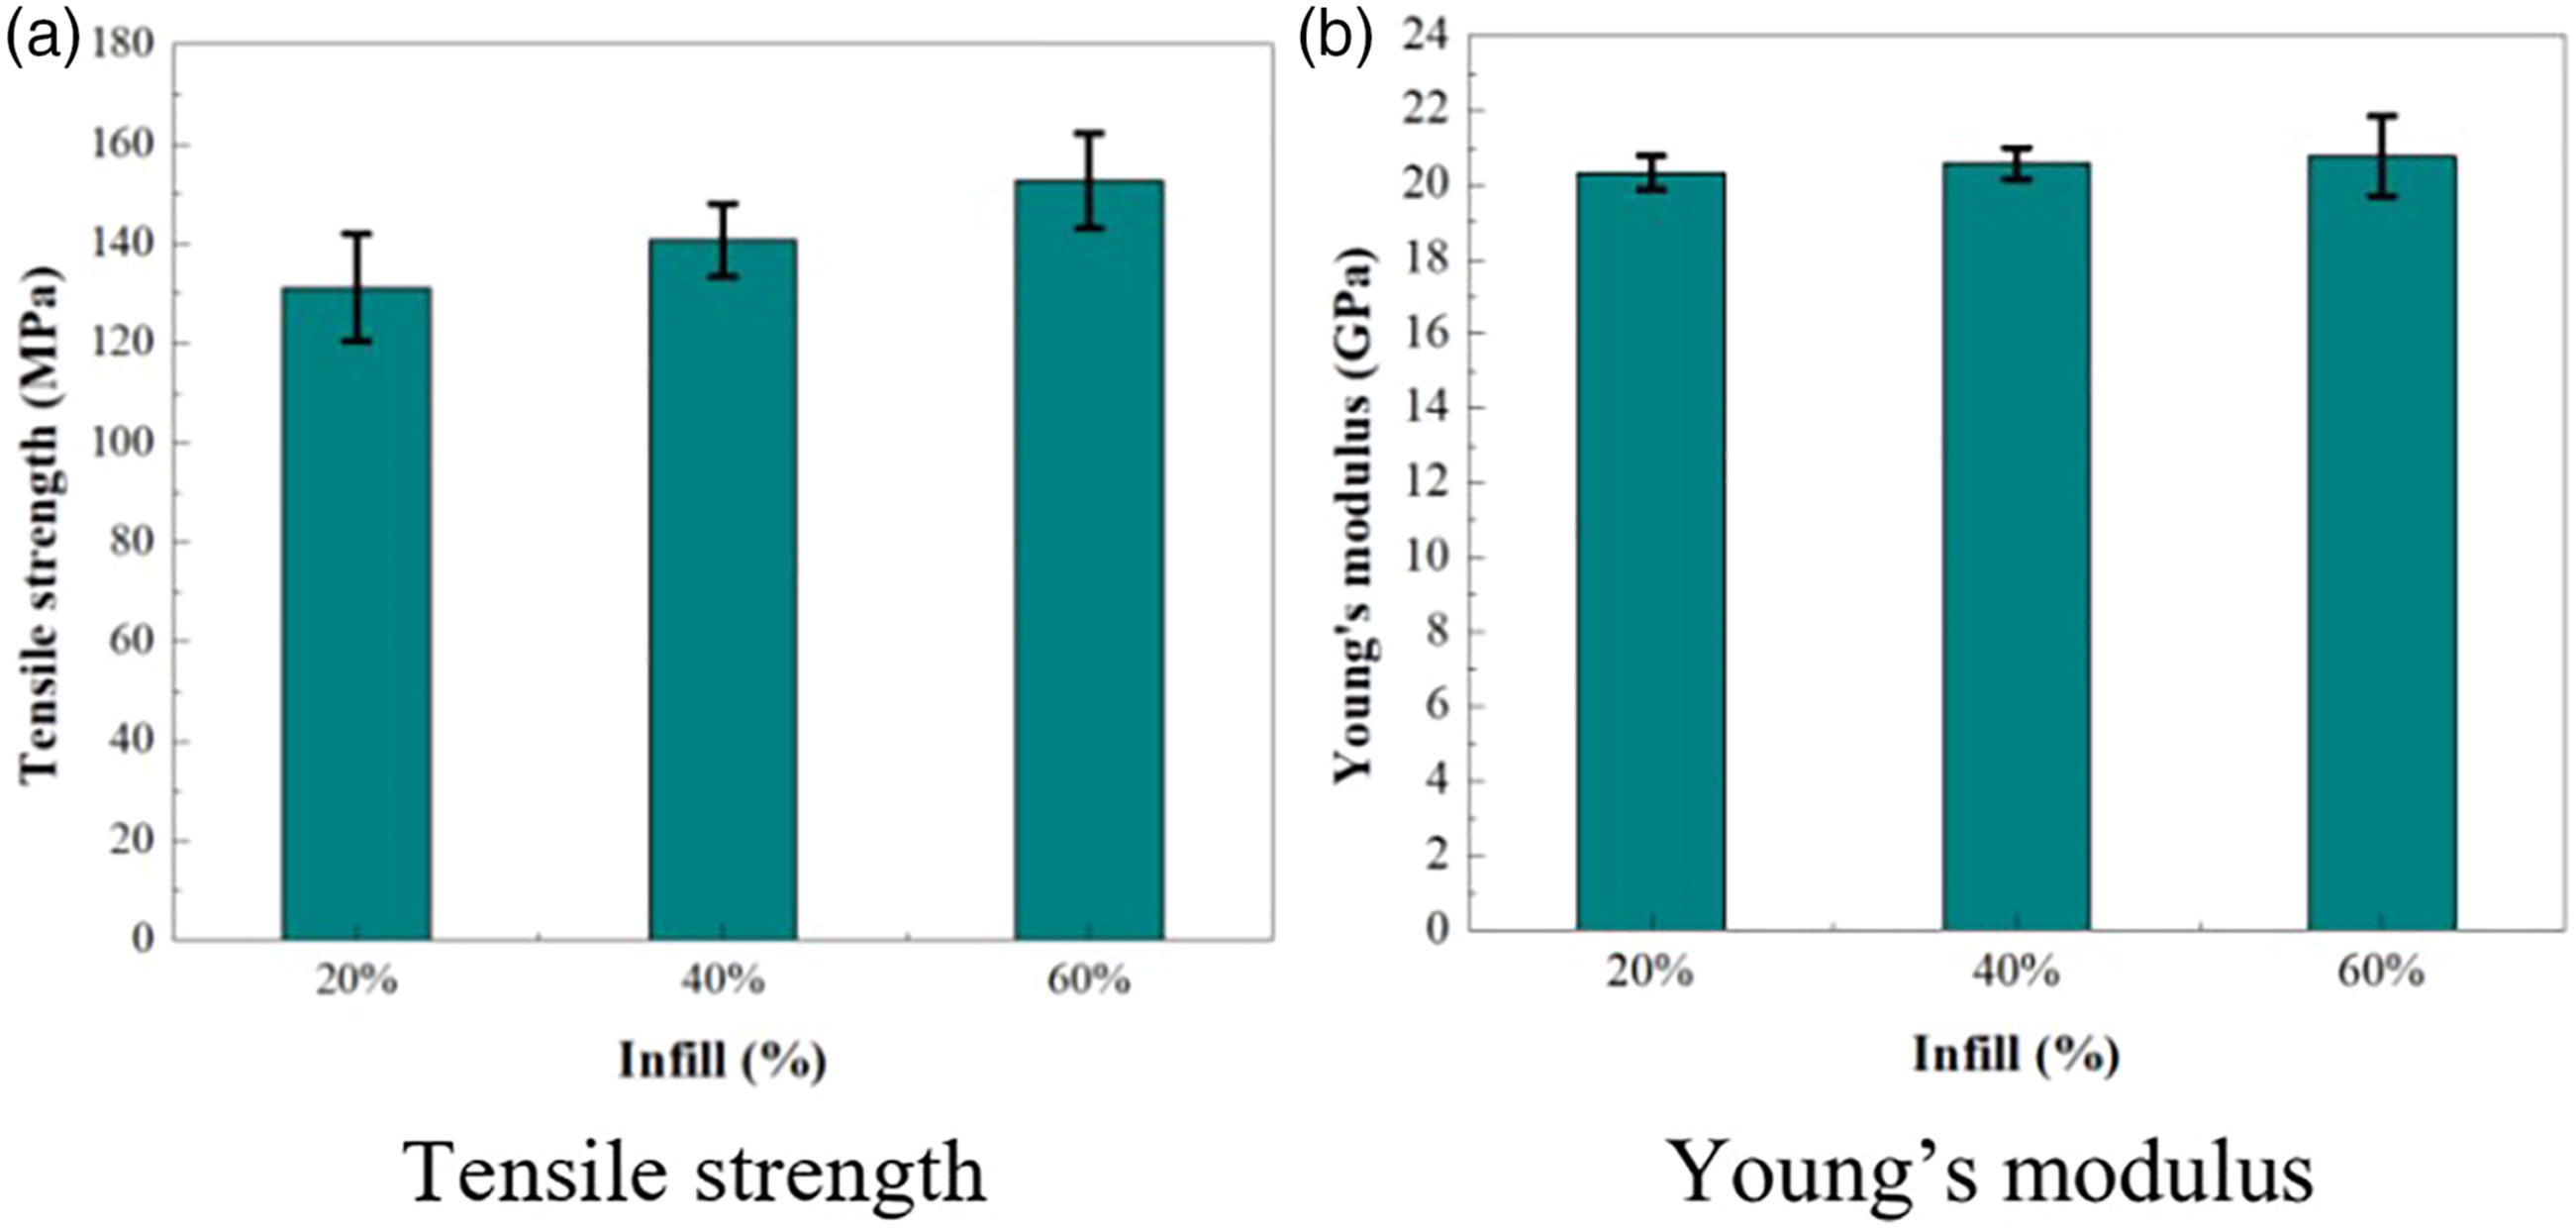
Effects of infill densities on Young’s modulus is shown in Figure 9(b). The specimen printed with 60% triangular pattern infill density showed the largest mean value of 20.78 GPa. While the 20% and 40% infill density CCFRPC specimens had an average Young’s modulus values of 20.33 GPa and 20.58 GPa, respectively. Slightly increase in the Young’s modulus values with the increase in infill density can be observed in each case (Figure 9(b)).
Flexural loading
Flexural properties of 3D printed porous CCFRPC specimens with triangular infill pattern at three different infill densities were obtained through flexural test. In this case, the specimens breakage in the outer region did not exceed the 5% strain limit. Typical flexural stress–strain curve for triangular infill pattern specimens printed at three different densities level is demonstrated in Figure 10(a). The result showed similar behavior compared to grid infill pattern. From the stress–strain curve, it can be seen that specimen printed with 60% triangular infill density attains the highest level of flexural stress, while the lowest flexural stress level can be observed in the specimen printed with 20% infill density. No substantial differences can be seen between 20% and 40% infill density level. Data of the 3D printed specimens with triangular infill pattern for the flexural (a) stress–strain curves (b) strength as a function of mass and (c) modulus as a function of mass.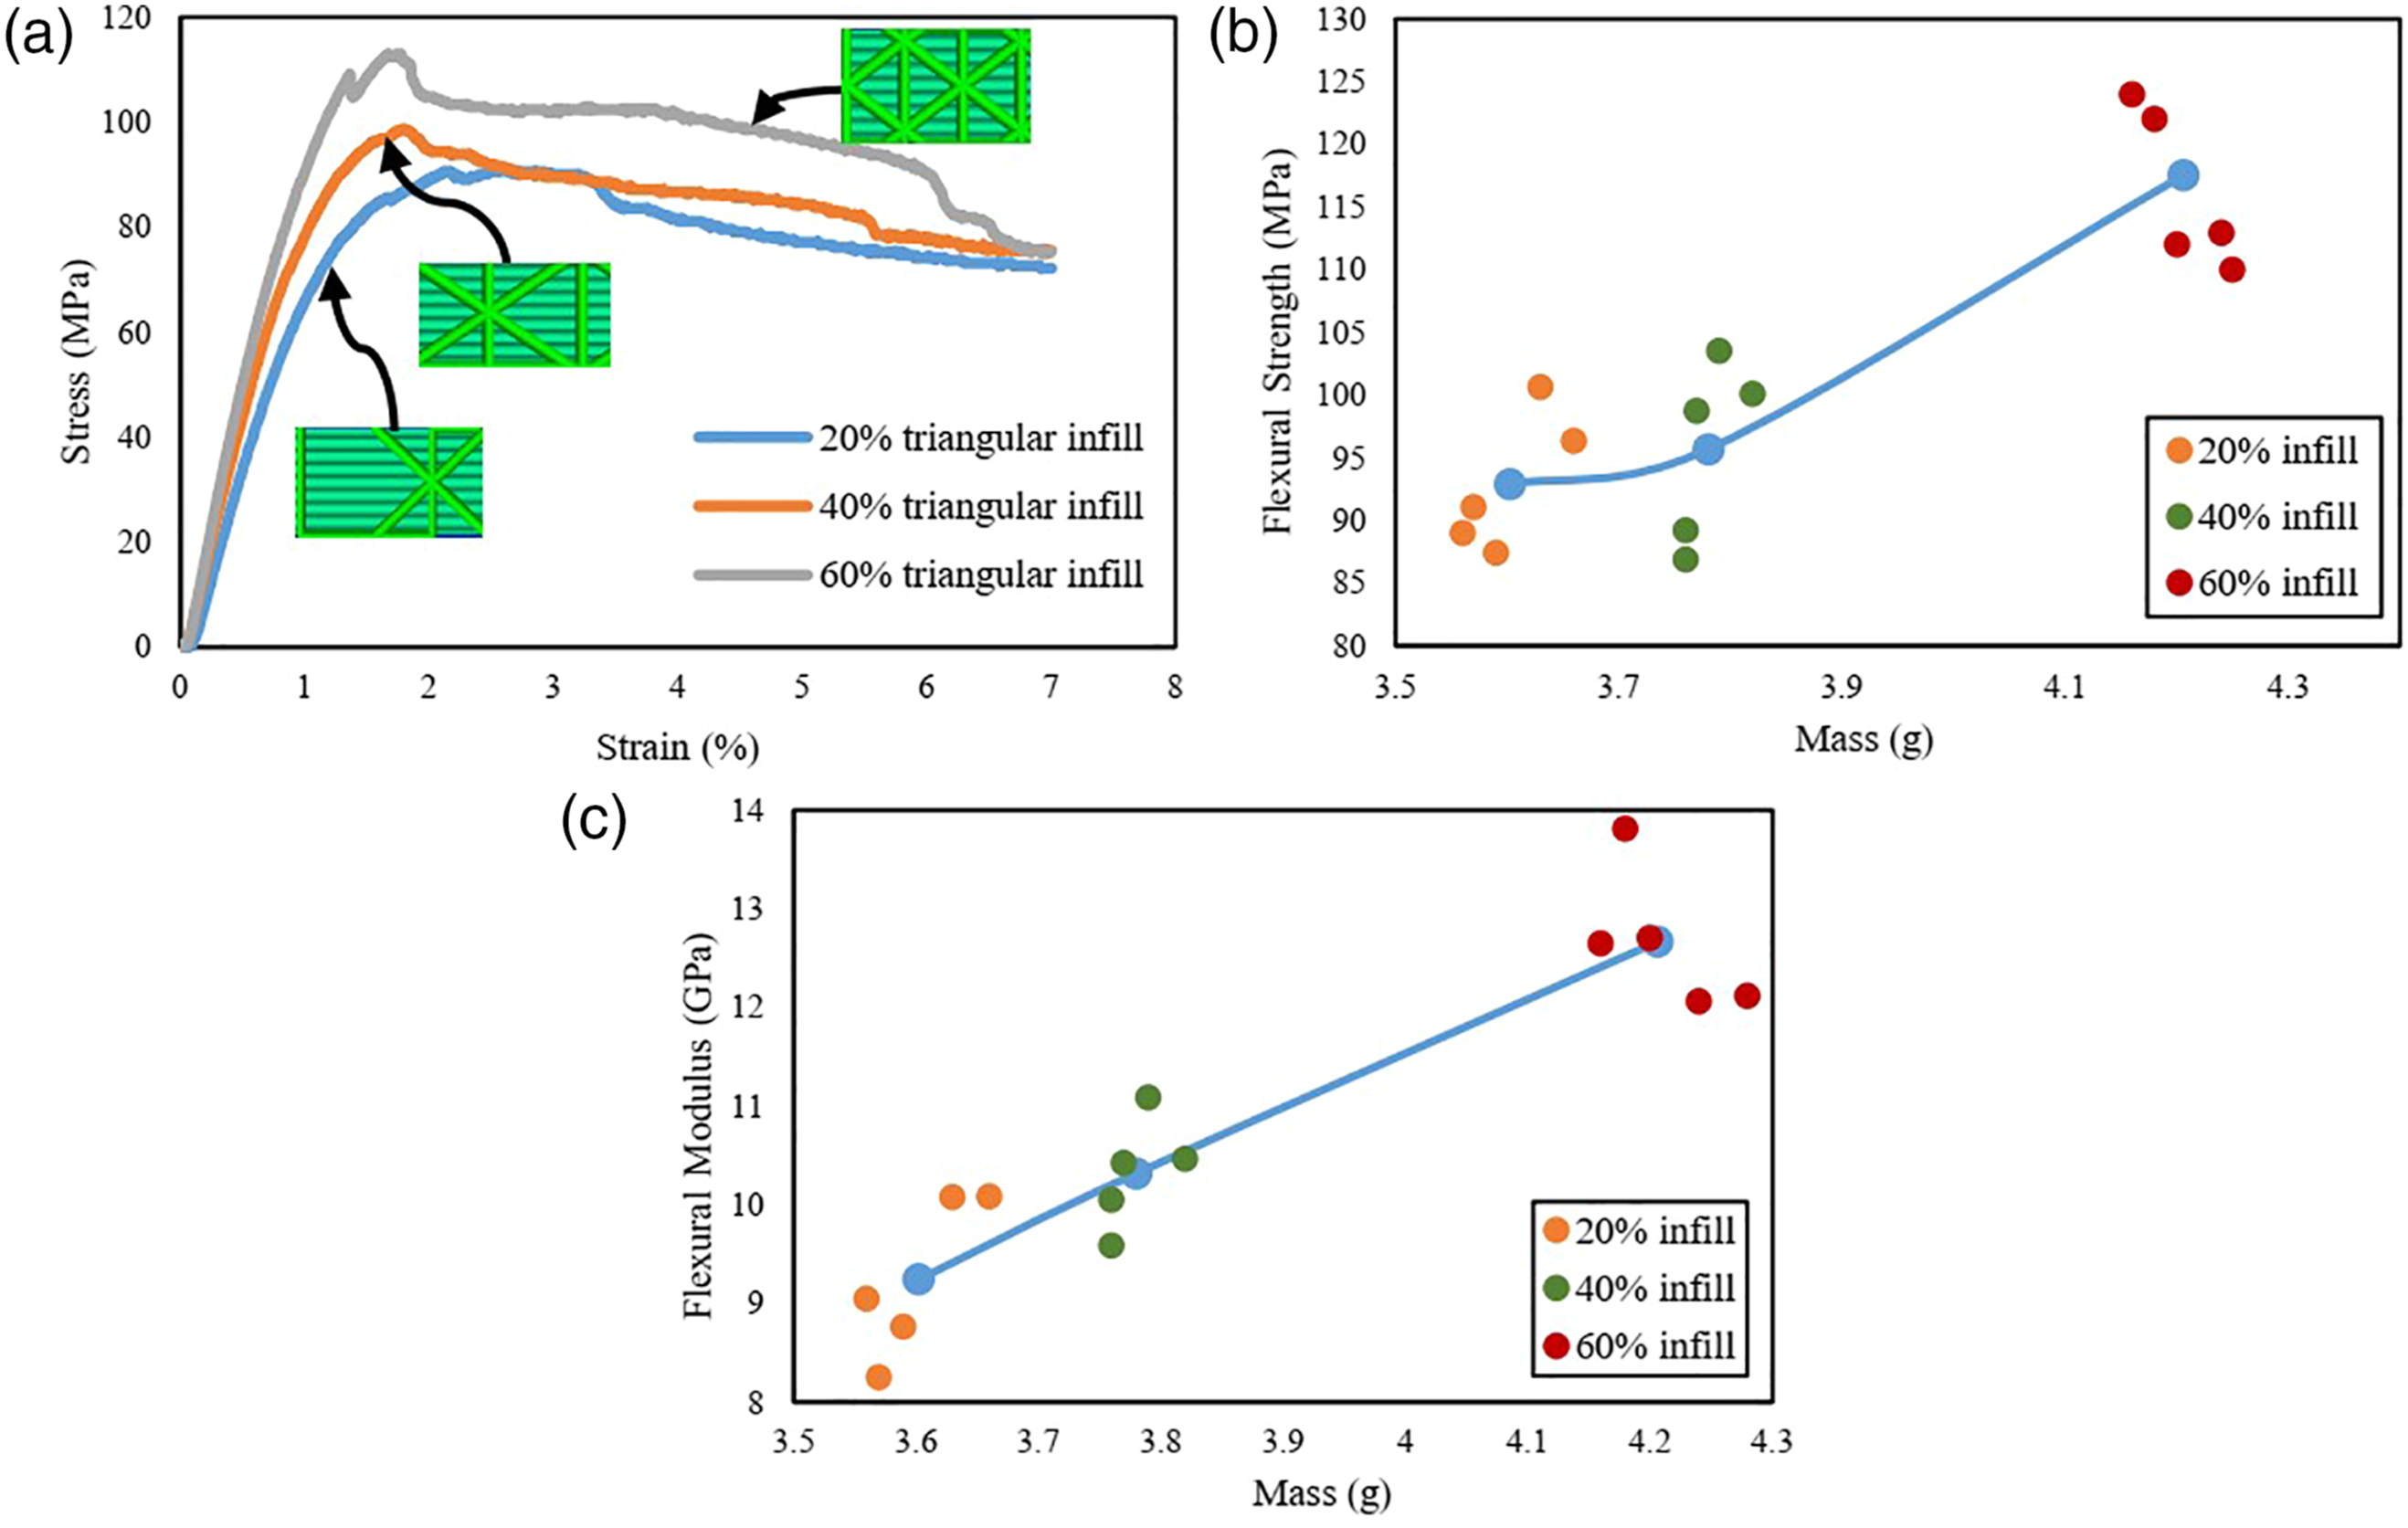
Figure 10(b) and (c) present average flexural strength and modulus as a function of mass for each specimen level printed at three different infill density, respectively, with each individual specimen infill level. The result showed increase in the stress and modulus values with the increase in mass. No significant difference can be seen in both the cases when the infill density rises from 20% to 40%. However, when the infill density increases from 40% to 60%, the stress and modulus values increase dramatically. This significant increase in the strength and modulus may cause due to sudden increase in mass of the specimen. Individual specimen levels presented more uniform 3D printing result in this case compared to grid infill pattern.
Table 5 shows the results of flexural properties values measured from flexural test. Figure 11 shows the comparison of flexural properties (flexural stress and flexural modulus) among each CCFRPC specimens with triangular infill pattern printed at three different infill density levels. From the bar graph plot (Figure 11(a)), the specimen printed with 20% infill density showed the smallest mean flexural stress value of 92.9 MPa. Continuing to increase in infill density, flexural stress also increases. The specimens printed with 40% infill density showed the average flexural stress value of 95.67 MPa, while 60% infill density showed largest stress of 117.53 MPa. Slightly increase in the strength by 3% can be observed when the infill density rises from 20% to 40%, whereas significant increase by 22.8% was achieved when the infill density increases from 40% to 60%. Hence, the results indicated that the flexural strength increases with the increase in the infill density level. Results of flexural properties of 3D printed triangular infill pattern samples.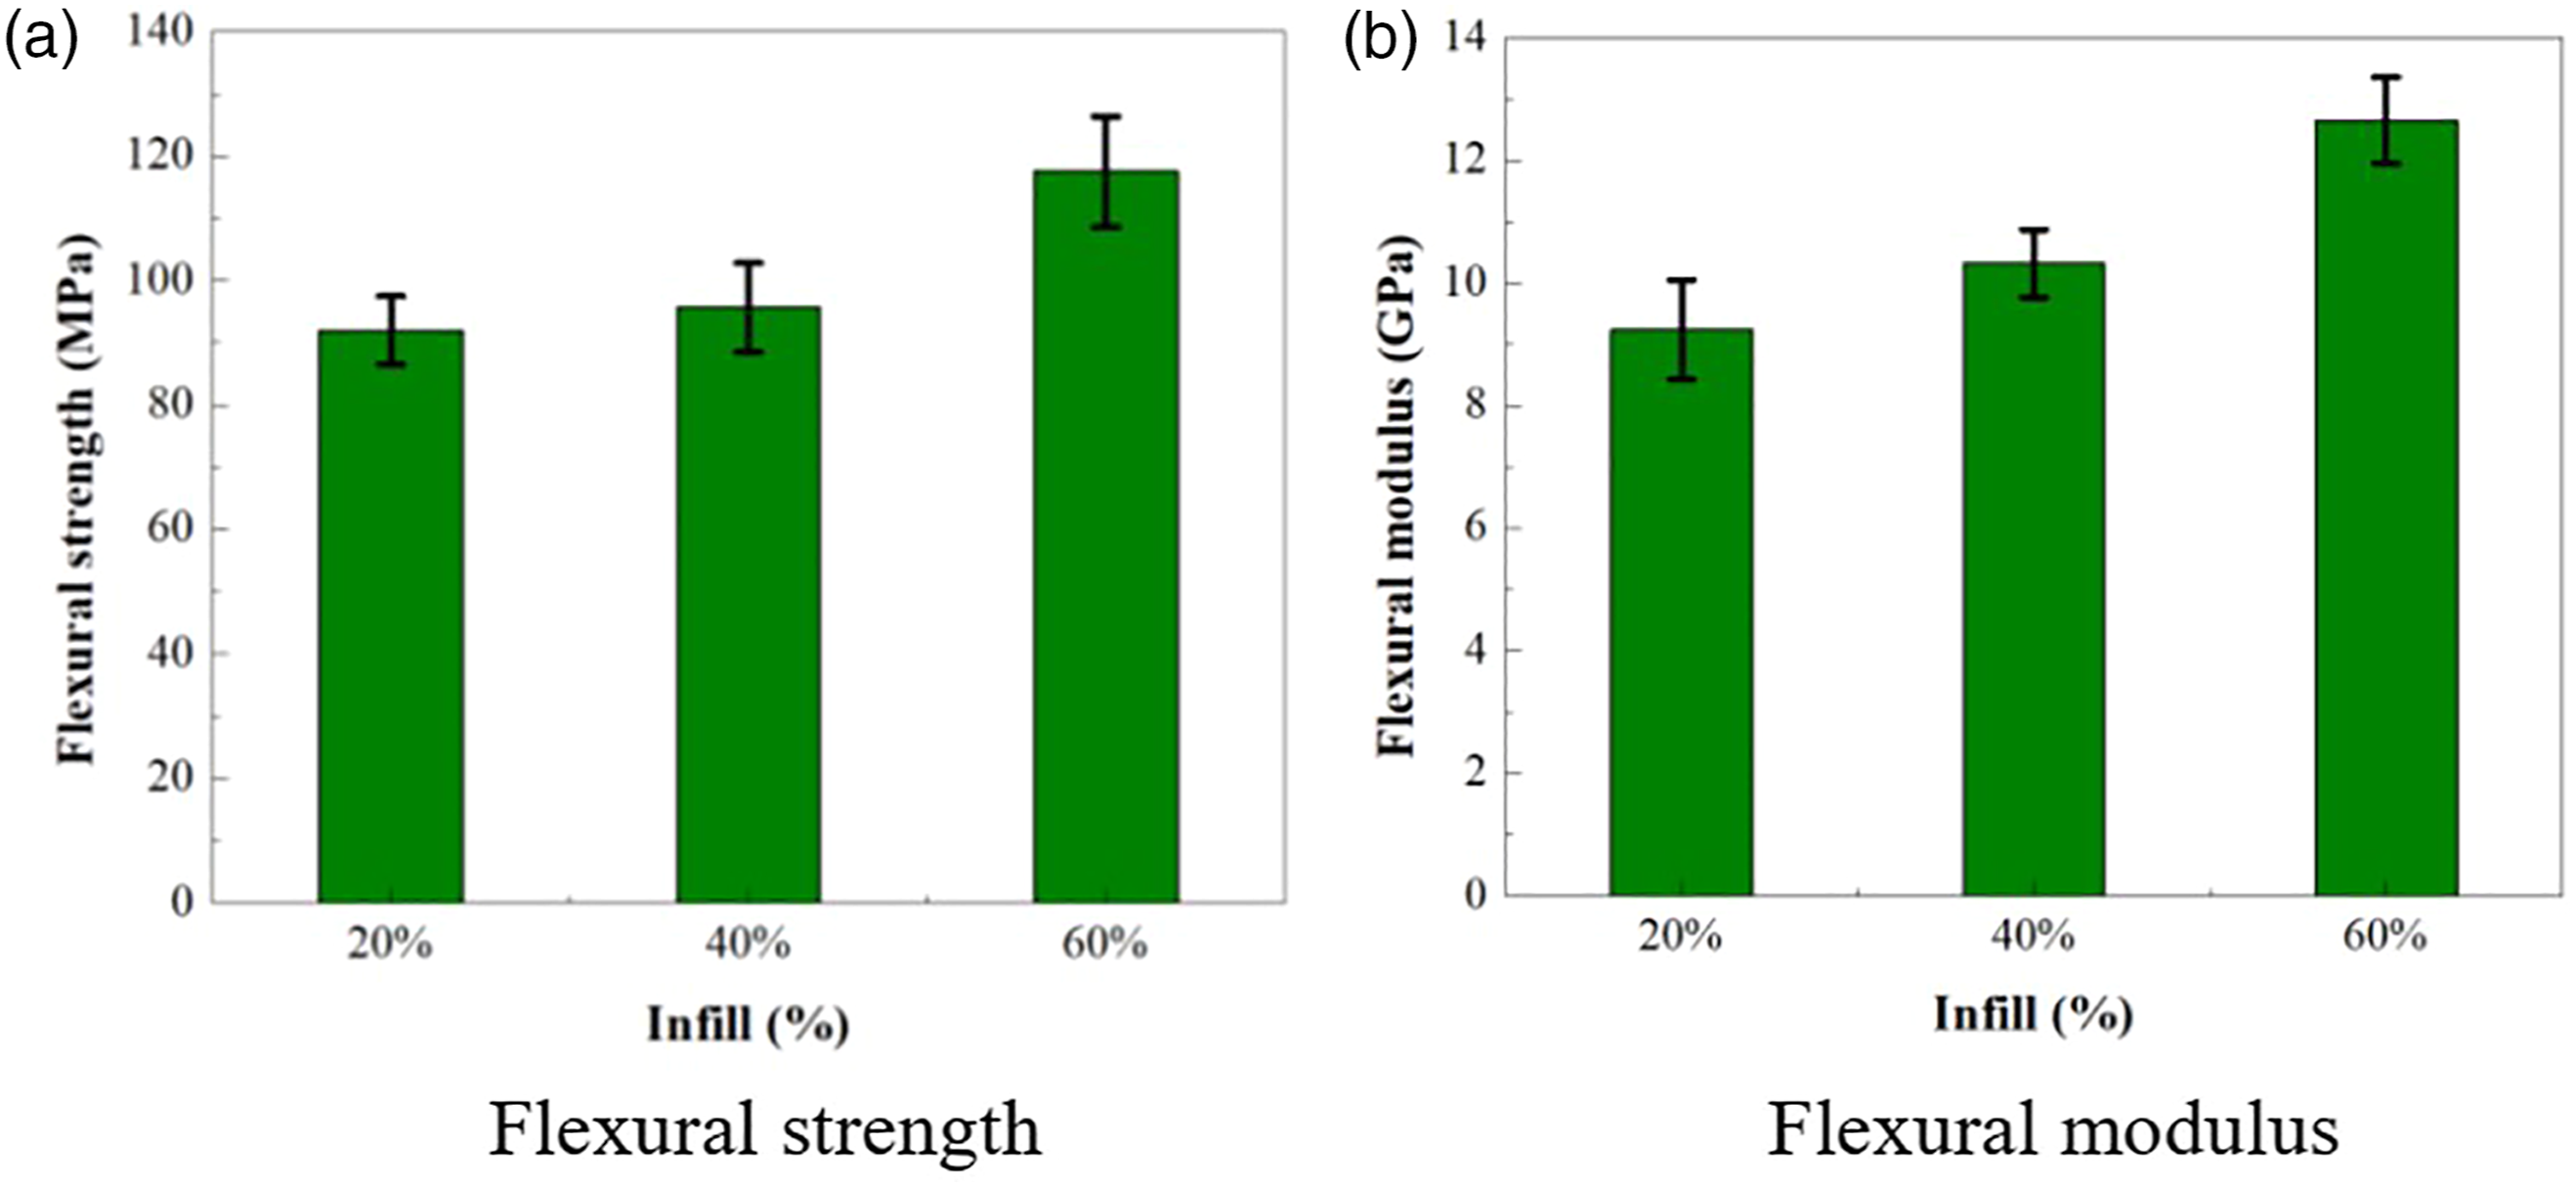
The highest mean flexural modulus value of 12.66 GPa can be seen in specimen with 60% infill (Figure 11(b)), while the specimens printed with 20% and 40% infills showed the average flexural modulus values of 9.24 GPa and 10.32 GPa, respectively. The flexural modulus result also indicated that increasing in the infill density level, will increase the flexural modulus value of the CCFRPC specimen.
Fracture interface study of the 3D printed porous CCFRPC structure
Based on experimental results of tensile and flexural tests of the specimens printed with grid and triangular infill patterns, the fractured mode study showed almost similar behavior for each group. Thus, it was decided to explore the fracture interface study of the 3D printed porous composite with such structure by considering one specimen from both the infill patterns, best reflecting the failure mode was selected to observe the fracture performance result and how the deformation occurred during the test. To examine such existence, fracture interface of CCPRPC specimens were observed using optical microscope. Micrographs obtained through optical microscope were used to observe the composite structure interfacial adhesion between reinforcement and matrix.
Optical micrographs of specimen printed with grid and triangular infill patterns after performing tensile test are shown in Figure 12(a) and (b). Separated CCF from the thermoplastic matrix can be clearly observed from the fractured region, where the carbon fibers detached from the PLA matrix leaving the vacant spaces during the tensile test. The spaces or gaps represents the internal structure of the porous composite part that have some empty spaces showing the infills of the 3D fabricated parts. The upper and bottom layers of the specimen geometry that covers the infill structure, were separated when undergoes tension. The spaces created inside specimen depends on the infill density. Increasing the infill density level, will decrease the gaps formed after the test. Bonding between CCF and PLA matrix can also be seen after performing the test and showed, despite creating the gaps between the matrix and the carbon fiber, it still holds the fiber together within it at various portions, which indicate the adhesion between them. The result indicated that composite parts can be used to support load during tension, as the ruptured fibers in the fracture interface showed that the load was effectively transferred from the matrix to the fiber reinforcement for better properties.
61
The optical micrographs of the 3D printed porous composite specimen’s fracture interface after performing; tensile test with (a) grid infill pattern (b) triangular infill pattern; and flexural test with (c) grid infill pattern (d) triangular infill pattern.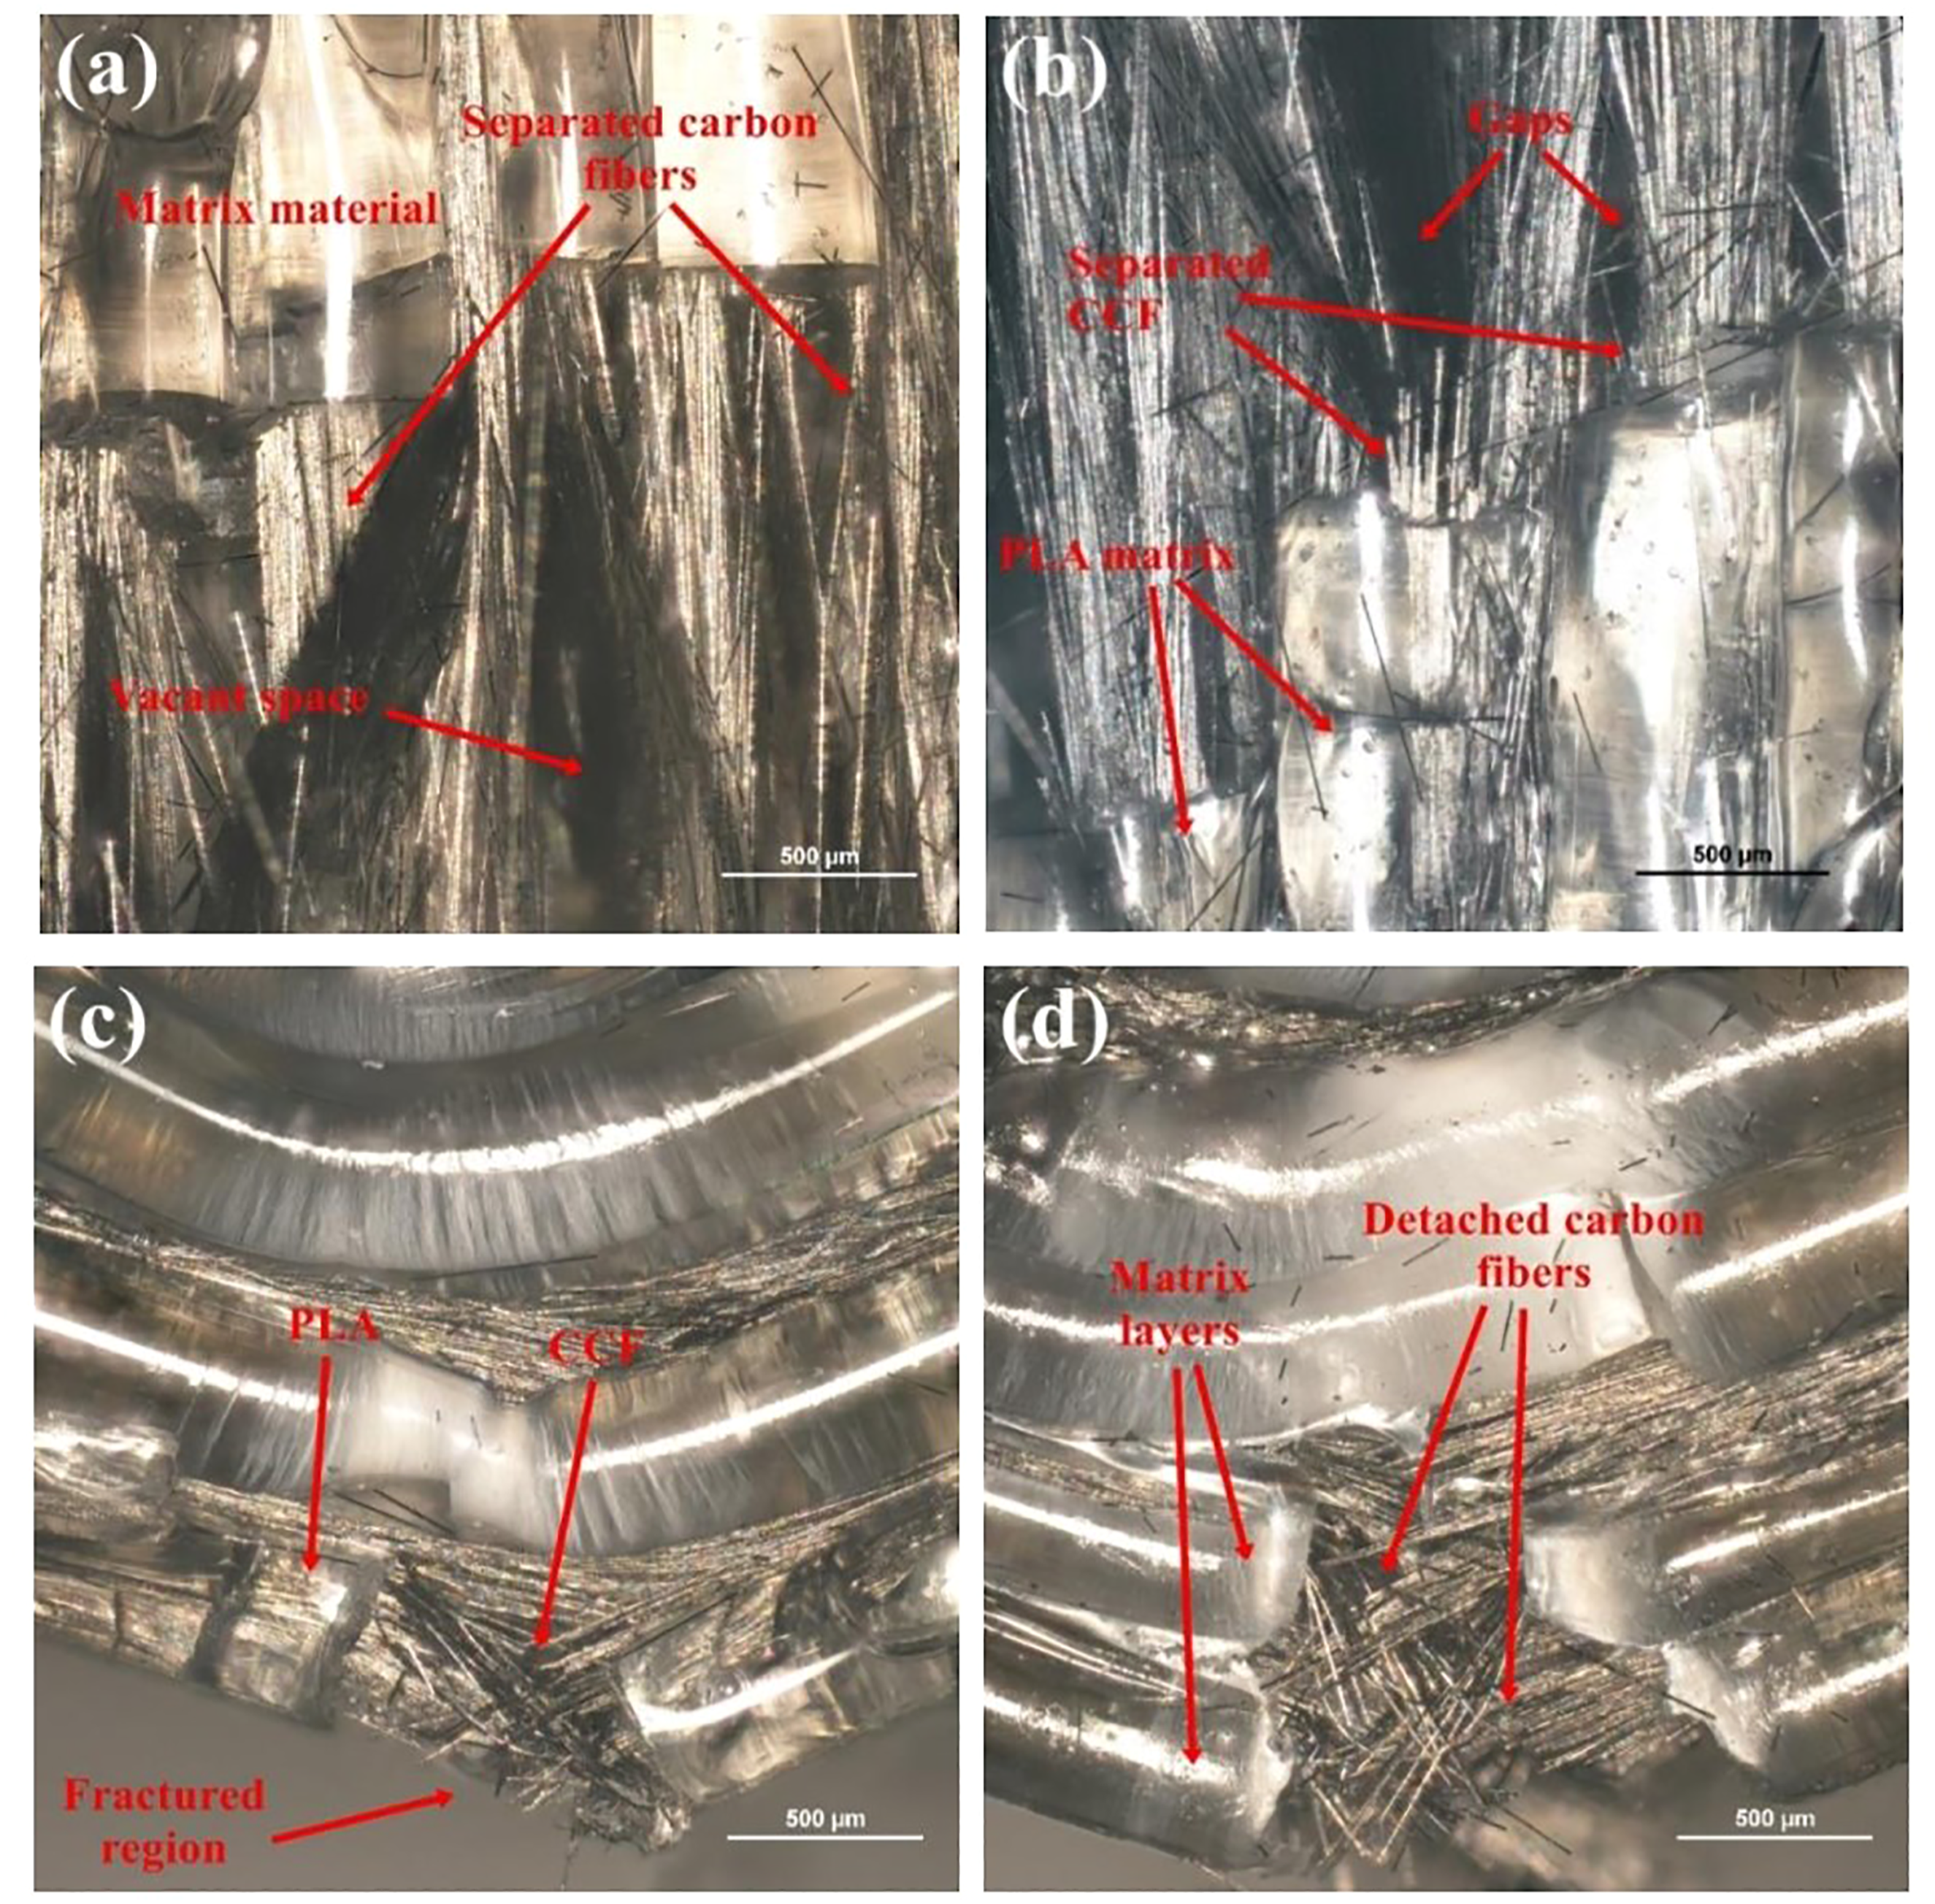
Figure 12(c) and (d) show the optical micrographs of specimens with grid and triangular infill patterns after performing flexural test. A ruptured region can be observed, where the maximum bending force was applied, and the layers were fractured. It can be clearly seen that the separated carbon fiber were pulled out from the matrix material after the test, but the fibers are still held together at various instant. This shows that the structure of the composite part can be used to support the load during bending, as the fracture interface indicates that the load was efficiently transferred from the thermoplastic PLA matrix to the carbon fiber reinforcement. In both the cases, the foremost failure mode of the CCFRPC was the broken fibers. The similar fiber pull out from the 3D printed CCF composite parts were observed, which is the most fatal shortcoming of the 3D printed CCFRPC.22,49,62
Comparison discussion
The porous CCFRPC specimens fabricated by FDM technology with grid and triangular infill patterns using three infill densities showed dissimilar structure, mass and strength levels. Grid infill pattern had more compact and dense structure, hence showed better mechanical properties compared to triangular infill pattern in both the cases (tensile and flexural test). The tensile and flexural test both resulted increase in the strength levels with the increase in infill density that attributes to an obvious condition of the mechanical response in case of grid and triangular infill pattern. Grid infill pattern showed better result in case of tensile and flexural response. This may result due to the design internal structure of the infill pattern, anisotropic behavior of the structure, and bonding of the layers among each other that exhibited such tensile loading response, as triangular infill pattern is isotropic in plane. This also validates that the triangular infill pattern had no significant effect on the tensile response compared to grid infill pattern. The specimen with 60% triangular infill pattern showed similar tensile strength level that a specimen with 20% grid infill pattern exhibit. In case of flexural stress, the specimen with 60% triangular infill pattern showed almost similar strength to a specimen with 40% grid infill pattern. In comparison to the infill structures, grid infill pattern is more substantial and considerable in term of mechanical tests outcome. The tensile strength and flexural stress of the specimen with grid infill pattern increases by 6.74% and 8.26%, respectively, when considering the same infill density (60%) compared to triangular infill pattern. The square infill structure (highly anisotropic) also presented as the best mechanical performance in terms of specific tensile strength and modulus.34,63
The reasons for developing and fabricating such porous CCFRPC structures are the reduction of mass, material utilization, energy consumption, and waste generation that helps to create a lightweight composite structure with an approximately same mechanical properties compared to fully dense structure. In comparison to previously fabricated CCF reinforced PLA composite with 100% infill 30 that achieved the maximum tensile strength of 165 MPa is almost the same as for the grid infill pattern with 60% infill density (163 MPa). 20% infill density with both patterns even showed better tensile strength compared to previously fabricated fully dense CCF reinforced PLA thermoplastic composite parts that achieved the strength levels up to 61.4 MPa 26 and 91 MPa. 22 The maximum flexural strength achieved of the printed composite part (60% grid infill) was 127.24 MPa, and that of fiber-reinforced PLA composites from the literature was 156 MPa.22,49,64 These results suggest that the mechanical properties of the 3D printed porous CCFRPCs were not of much significance difference in term of flexural loading but even better mechanical performance, particularly in the case of tensile strength and elastic modulus. Perimeter shells play an important role and greatly affect the mechanical properties. The perimeter shells represent the number of layers that have been applied to the outer surface of the specimen prior to filling the inner part. The higher number of perimeter shells improved the strength and stiffness of the printed part under tensile and flexural loading, 34 but also increases the complexity of the printing process.
Hence, from the results achieved in this study and comparison with the literature showed great potential and ability to replace fully dense and solid structure by the porous structure that will utilize less material consumption and reduce the mass and wastage with the almost same mechanical performance and has the capability to use in the structural applications.
Conclusions
In this study, CCFRPC porous specimens using two different infill patterns (grid and triangular) at three different infill densities levels (20%, 40%, and 60%) were fabricated using FDM 3D printing technology. Effects on tensile and flexural properties of composite parts were examined. Fracture breakage interface of the printed composites were observed and analyzed using optical microscope after performing mechanical tests. Following conclusions were drawn from this study: 1. The CCFRPCs specimen with grid infill structure showed better mechanical properties and the strength level increases with the increase in infill density and attained the maximum tensile strength, Young’s modulus, flexural stress and flexural modulus of 162.9 MPa, 16.82 GPa, 127.24 MPa, and 12.77 GPa, respectively, with 60% infill structure. 2. The uniaxial tensile strength of composite specimen printed with triangular infill pattern increases with the increase in infill pattern and maximum tensile strength and Young’s modulus value of 152.62 MPa 20.78 GPa, respectively, could be found in the specimen with 60% infill density. 3. Flexural loading of triangular infill pattern specimen also increases with the increase in infill density and reached maximum stress and modulus up to 117.53 MPa and 12.66 GPa, respectively, printed with 60% infill density. 4. The micrographs of fractured composite specimens showed the fiber pull out was the major and dominant failure mode indicating the interfacial bonding and adhesion between the matrix and reinforcement, but still holds the fibers together within matrix at various regions resulted that the composite parts can be used to support loads. 5. Mechanical performance of the printed porous CCFRPCs have the capability to replace fully dense and solid composite part and ensured the future possible applications for the lightweight structures.
Footnotes
Declaration of conflicting interests
The author(s) declared no potential conflicts of interest with respect to the research, authorship, and/or publication of this article.
Funding
The author(s) disclosed receipt of the following financial support for the research, authorship, and/or publication of this article: This research was funded by a grant (No. S-M-ERA.NET-20-1) (project: “Additive Manufactured Composite Smart Structures with Embedded Fibre Bragg Grating Sensors”, acronym: “AMCSS”) from the Research Council of Lithuania.