
Abstract
This study presents a method for 3D printing very high stiffness pitch-based carbon fiber (CF) reinforced polylactic acid (PLA) composites using a modified open-source 3D printer. The fused filament fabrication (FFF) technique was used to fabricate the samples with alternating layers of PLA and PLA-coated pitch CF. The tensile Young’s modulus of the 3D-printed composite samples was measured to characterize the effect of different grades and volume fractions of pitch CF on the behaviour of the printed composites. Three grades of pitch CF which have different Young’s modulus were used with volume fractions ranging from 2.4 to 8.4%. Tensile tests showed that the K1392U CF reinforced composite with a 7.3% volume fraction demonstrated the highest improvement in Young’s modulus of 850% compared to neat 3D-printed PLA. This improvement is notably higher than any previous 3D-printed carbon-based composites at a relatively low volume fraction of CF. Statistical analysis showed increased Young’s modulus in all of 3D-printed composite samples tested. The experimental values were compared to the Halpin-Tsai model and suggest that some degree of fibre breakage occurred during the 3D printing process owing to the relative stiffness of the pitch-based fibers. Future directions and suggestions for process improvements are discussed.
Keywords
Introduction
Continuous fiber reinforced polymer composites (CFRPCs) are of great practical interest because of their high specific modulus and strength, excellent fatigue resistance, high dimensional stability, and wear and corrosion resistance.1,2 Applications for CFRPCs are widespread in industries such as automotive, aerospace, and sporting equipment.1,2 Recently, continuous fiber thermoplastic composites have become more appealing compared to continuous fiber thermoset composites due to their shorter processing cycle, higher impact toughness, and excellent recyclability.1,2
Additive manufacturing (AM) of thermoplastic polymers is well-developed at this stage and used in a number of industries because of its flexibility in manufacturing complex geometries. 3 However, AM parts can have shortcomings in their mechanical properties due to the low compaction pressure during the manufacturing process compared to the other conventional techniques such as compression molded thermoplastics.3–8 To enhance the mechanical properties of the 3D printed composites, it is important to have a compaction pressure applied by the nozzle to the material. This can be achieved by reducing the layer thickness and decreasing the printing speed. As a result, the inter-raster voids are decreased and thus improving the bonding strength between the layers in the AM process. 9 The mechanical performance of AM components can be also improved through the introduction of short fibers within AM thermoplastics; however, this improvement is only slightly better than pure polymers due to the lower interfacial bond between the short fibers and the matrix and hence less load transfer from the matrix to the fiber when compared to longer fibers. To increase the fiber reinforcement effect and the load bearing capacity within polymer composites, CFRPC is recommended. 10 Additionally, the existence of poor bonding between short fibers and the polymer and the higher specific surface area of short fiber than that of continuous fiber increase the probability of pore formation.5,6 Thus, to improve the mechanical properties, it is advantageous to combine thermoplastic polymers with continuous fiber reinforcing materials.5,11
Among different AM techniques, stereolithography (SLA) and fused filament fabrication (FFF) are used to process continuous fiber polymer composites. 12 The FFF process has several advantages compared to SLA including lower material and hardware costs, low input energy, minimum solid waste, no need of complex tools to produce intricate parts, and consistent product accuracy.2–7,13
According to Prüß et al., 14 there are several techniques to integrate fibers into the polymer matrix during the FFF process. These include (1) Fiber incorporation prior to printing process. This is the easiest approach that does not need major modifications to the machine. Here the filament itself is a composite material (mixture of thermoplastic material and fibers or pre-impregnated rovings). The prefabricated composite filament maintains a consistent fiber volume ratio by providing both fiber and matrix simultaneously. The way to alter this ratio is by manually switching filament materials. 15 (2) Continuous fiber incorporation in the print head. In this case, both fiber and matrix are co-extruded simultaneously and combined as they pass through a common extruder nozzle. The fibers are provided in the form of dry roving, and the thermoplastic matrix is introduced independently as a conventional thermoplastic filament. This provides the opportunity to modify the fiber volume fraction using machine controls while printing and allows the same print head to apply unreinforced plastic as well. 16 (3) Dual extrusion FFF manufacturing. In this method, two independent extruders are used with independent nozzles to feed both materials separately with separate/different mechanisms. This setup significantly increases machine complexity. Ensuring proper adhesion during fiber deposition becomes crucial, making this configuration prone to defects in fiber impregnation. Additionally, because the material is applied through two distinct mechanisms, this configuration necessitates more machine axes to adjust fiber orientation. 17
In the FFF method, the selection of printing parameters directly influences the characteristics of the final product as detailed by Krajangsawasdi et al. 9 For instance, layer thickness is directly linked to the presence of voids between layers, which can be minimized by using thinner layers to increase pressure between them. Printing temperature affects polymer fusion: too low temperatures will not sufficiently soften the polymer for extrusion, leading to poor fusion between deposited rasters, while excessively high temperatures can degrade materials or alter previous deposition geometry. Optimal printing temperature ensures strong inter-raster bonding and enhances thermoplastic crystallinity, resulting in improved performance. Printing speed impacts polymer extrusion: low speeds may lead to inadequate material extrusion and low pressure, while high speeds can cause handling issues. Slower speeds allow for better fusion between rasters, improving bonding and surface quality, but increase manufacturing time. Nozzle diameter affects printing quality: larger diameters enhance material printing strength by reducing voids between rasters. Specialized nozzles, such as flat or filleted end nozzles, are designed to optimize continuous fiber printing for improved flow and compression. 9
Several researchers studied AM CFRPCs18–21 using different continuous fibers: Matsuzaki et al. used a customized in-nozzle impregnation printer to fabricate jute and CF polylactic acid (PLA) composites. 18 They found that the tensile strength of the CF PLA composite was increased fourfold compared to pure PLA. Melenka et al. used the commercially available MarkForged printer to fabricate Kevlar fiber nylon composites 21 and found that the mechanical properties were dramatically improved with increased Kevlar content compared to pure 3D-printed nylon. Ibrahim et al. 19 and Saleh et al. 20 customized an open source 3D printer to fabricate continuous metal wire reinforced PLA composites and also showed that mechanical properties were improved with the addition of the wire.
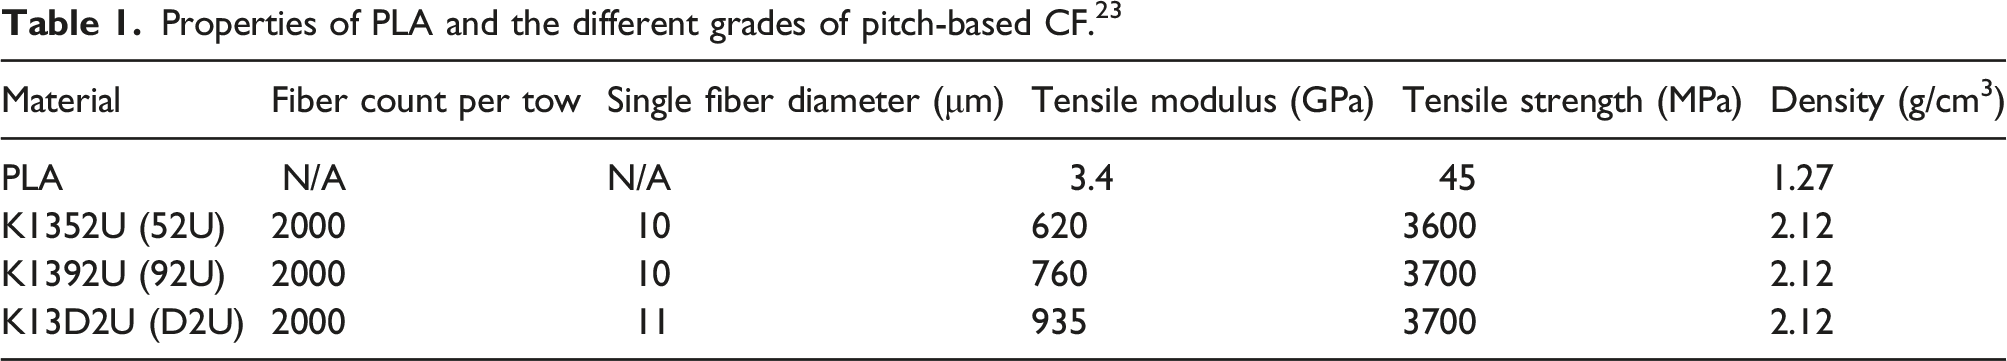
Of the different continuous materials used in 3D-printed CFRPCs, CF has attracted significant interest because of its outstanding mechanical properties and lightweight characteristics. 5 Two types of CF are commonly used to reinforce polymer composite materials distinguished by their precursor material: polyacrylonitrile (PAN) CF and pitch-based CF. 22 PAN CF is more widely used for 3D-printed CFRPCs due to its better flexibility and relative ease of printing. However, continuous pitch CF has superior tensile modulus (up to 900 GPa) compared to continuous PAN CF (≈400 GPa).23,24 For these reasons, the tensile characteristics of 3D-printed pitch-based CF CFRPCs have remained unexplored.
Here we present a method for 3D printing continuous pitch-based CF PLA composites and use it to fabricate unidirectional samples for tensile characterization. Three grades of pitch CF were printed at several volume fractions to characterize the effects of pitch CF properties and fiber content on the mechanical behaviour of the 3D-printed composites.
The characteristics of the 3D printing process affect the material meso-structure that will affect the mechanical behaviour at the end. For instance, the meso-structure is influenced by filament path deposition and various process parameters. Key factors include filament thickness and width, filament-to-filament overlap, filament orientation, and extrusion temperature. 25 Additionally, since the structure of CFRPCs has different properties in different directions, it is vital to understand the micromechanical behavior of this composite under external loads and to develop deep understanding of the full field strain of the samples under the mechanical testing. This was achieved by applying a digital image correlation (DIC) system. 26 DIC further validated strain measurements by accurately measuring longitudinal and transverse strain27,28. This optical technique has a number of advantages such as cost effectiveness, accurate, simple experimental setup, time resolved, full-field, non-contact and non-destructive. 29 In this study, the tensile strain used to calculate the tensile modulus was obtained using a 2D DIC technique by measuring the displacement parallel to the surface. Analytical models for mechanical properties were proposed to compare the theoretical obtained values with the experimental data.
Experimental methods
Materials
Properties of PLA and the different grades of pitch-based CF. 23
Sample preparation
The samples were fabricated using a modified Prusa i3 mk2 3D printer which used a bespoke dual extruder to 3D print PLA filament and PLA-coated pitch CF. The extruder assembly was modified according to
17
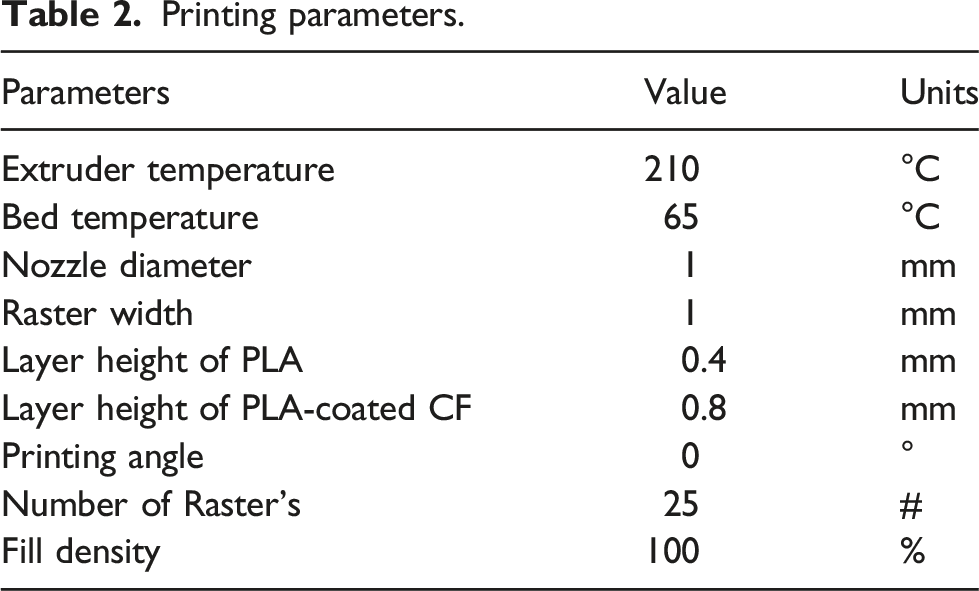
and is shown in Figure 1. The nozzle for the PLA is oriented at the convectional 90-degrees from the bed while the nozzle for the pitch CF filament is oriented at a 45-degree angle from the printing bed to help mitigate fiber breakage during extrusion. The printing parameters are summarized in Table 2. The temperatures for both the extruder and bed were chosen based on recommendations from the material manufacturers. The extruder temperature should be between glass transition temperature and degradation temperature of the thermoplastic material. Using a higher extruder temperature might lead to excessive heating of PLA, while a lower temperature could cause issues with polymer extrusion. The nozzle diameter was selected to suit the PLA-coated pitch CF filament. Other geometrical parameters were chosen to print the sample according to the ASTM D3039-17 standard.
30
For instance, raster parameters (raster width and the number of rasters) were adjusted to create the sample’s two-dimensional surface area in a single layer based on nozzle movement. Subsequently, the nozzle moved upward in the z-direction by the layer thickness, as defined by layer height parameters in Table 2, to form subsequent layers until reaching the desired sample thickness. The printing angle was set to 0° to facilitate continuous longitudinal fiber reinforcement in the composite sample. Fill density was selected to be 100% to minimize the inter-raster voids. Cross-sectional view of dual extruder for pitch carbon fiber printing. Printing parameters.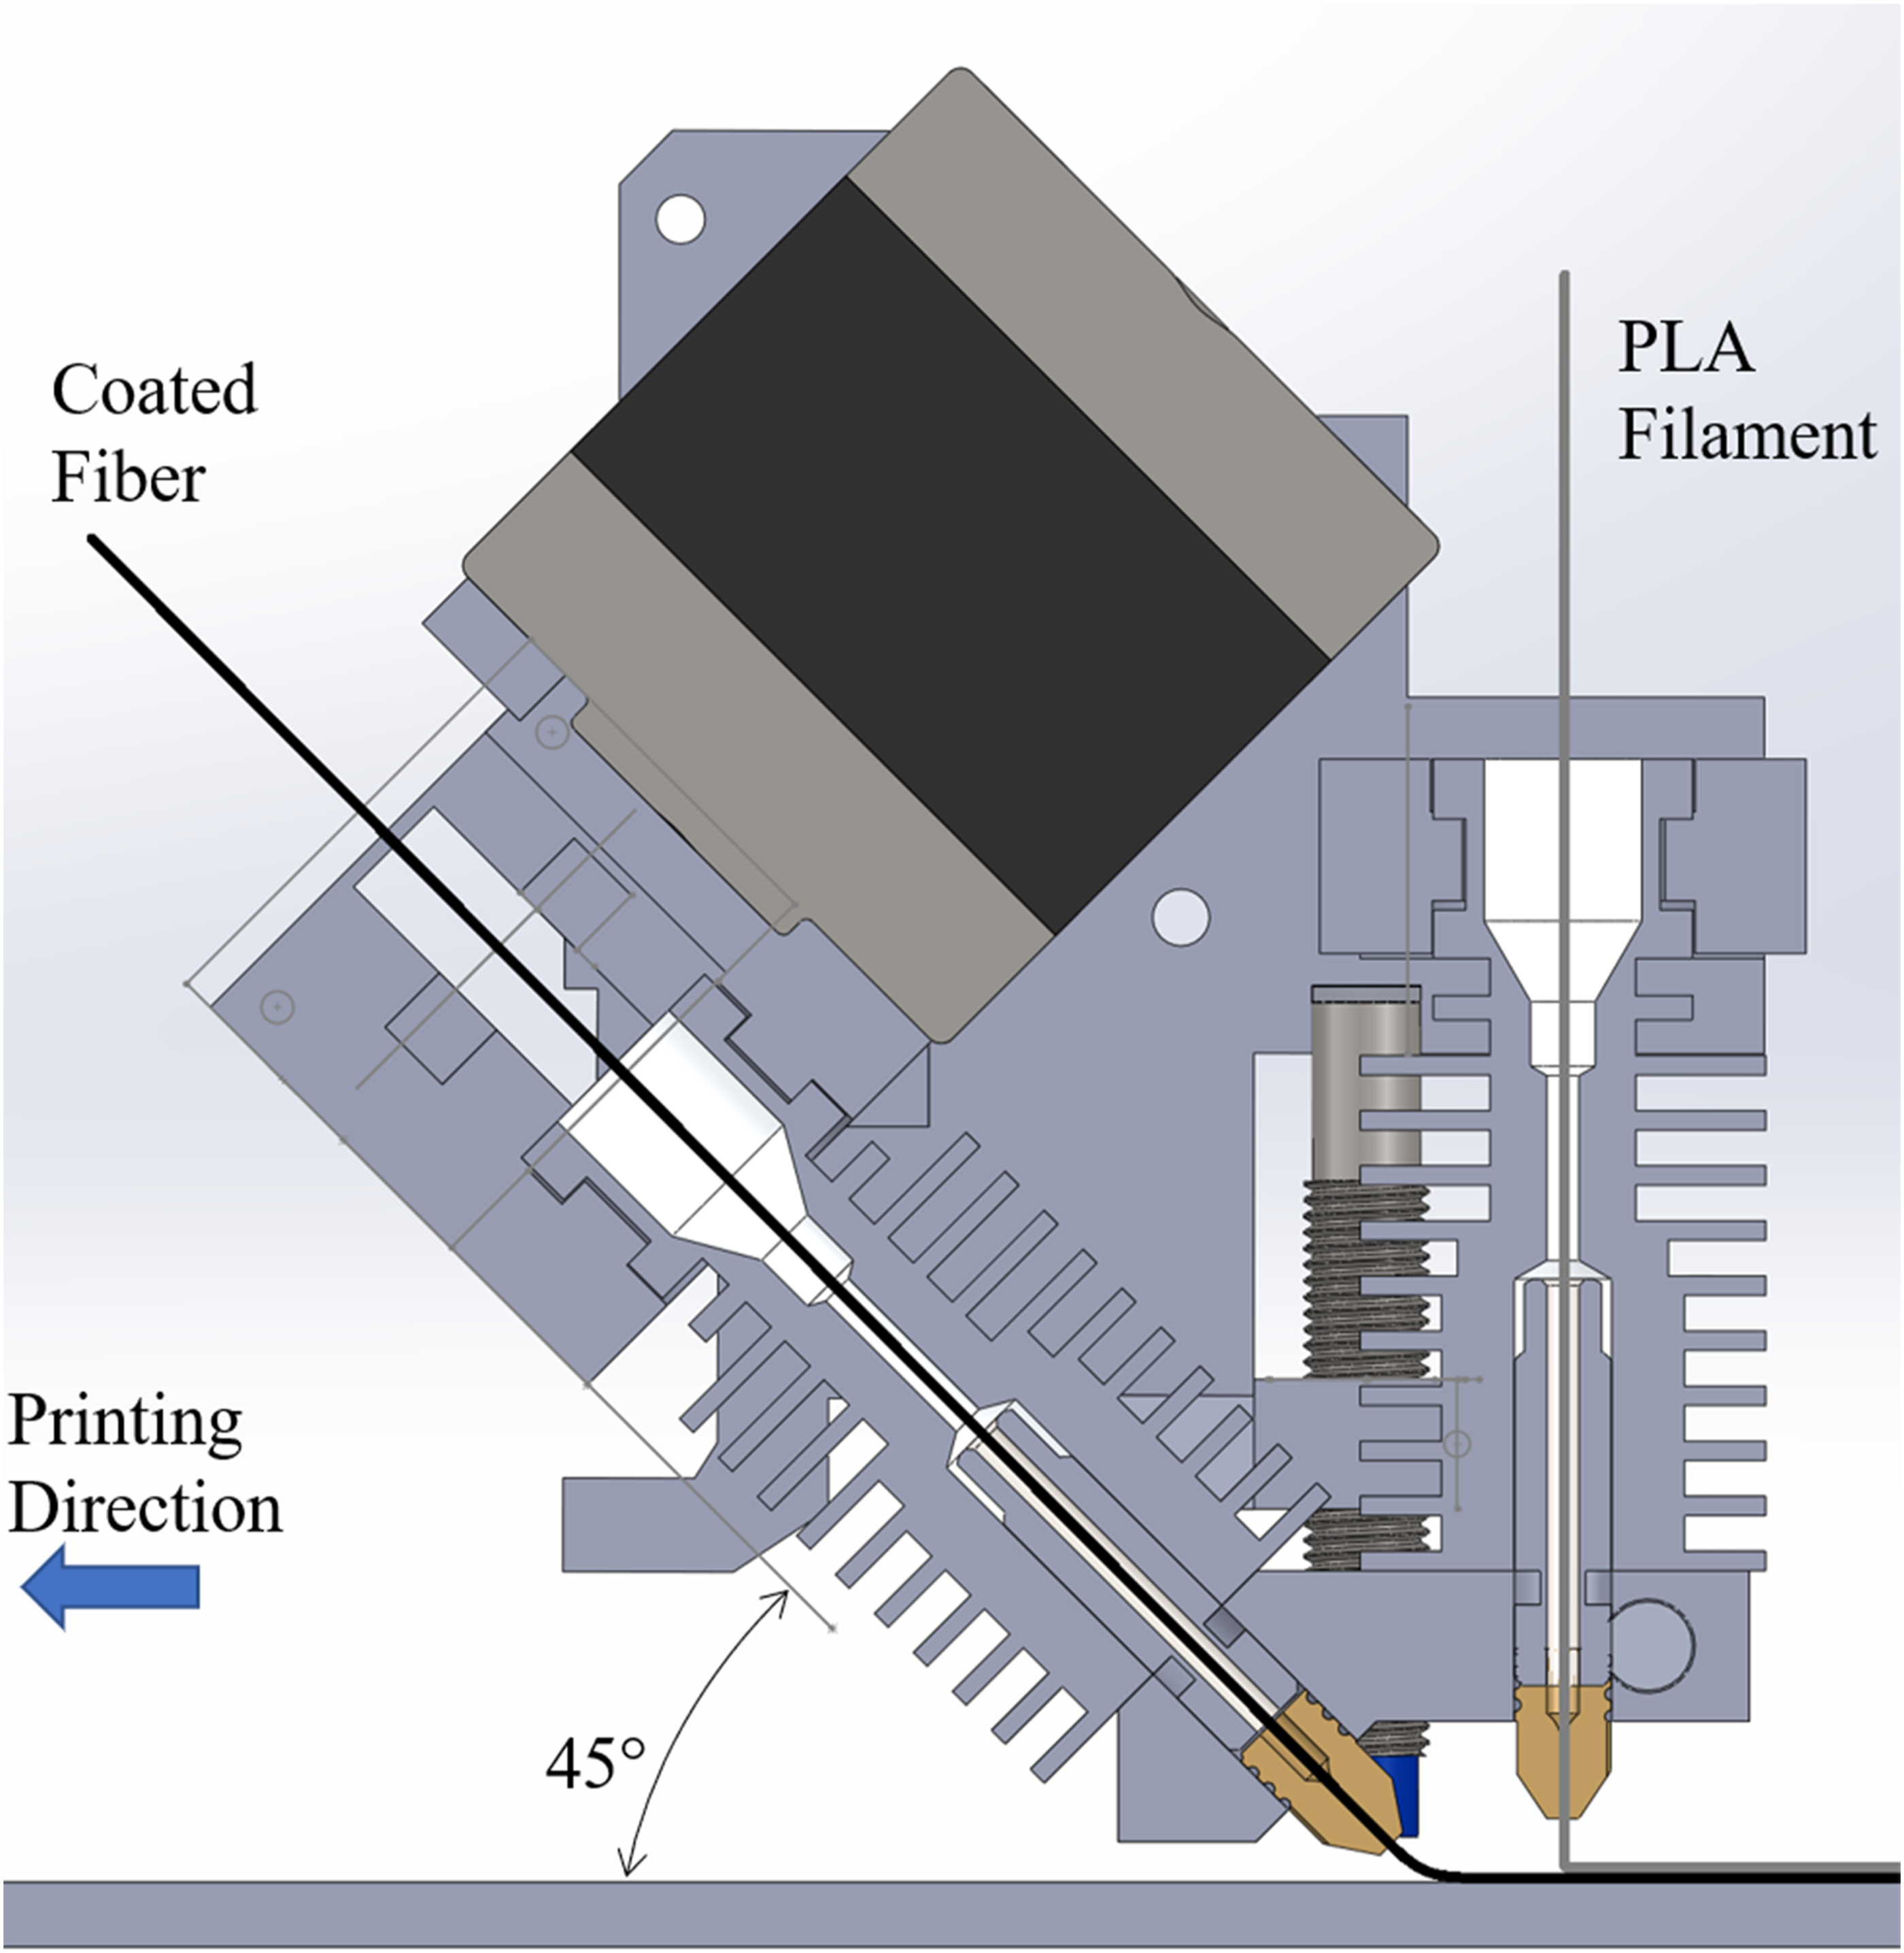
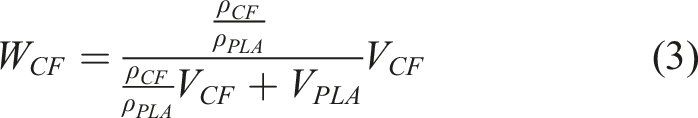
Prior to 3D printing, the pitch CF tows listed in Table 1 were treated by coating them in PLA using the pultrusion setup shown in Figure 2. Here the pitch CF was fed through a molten PLA bath and pulled through a 0.8 mm diameter nozzle. Upon exiting the nozzle, the PLA cooled and solidified to create a relatively rigid pitch CF filament amenable to being fed through the extruder of the 3D printer. The PLA matrix around the CF also serves to adhere to the pure PLA printed from the other nozzle. Pultrusion process for pitch carbon fiber coating.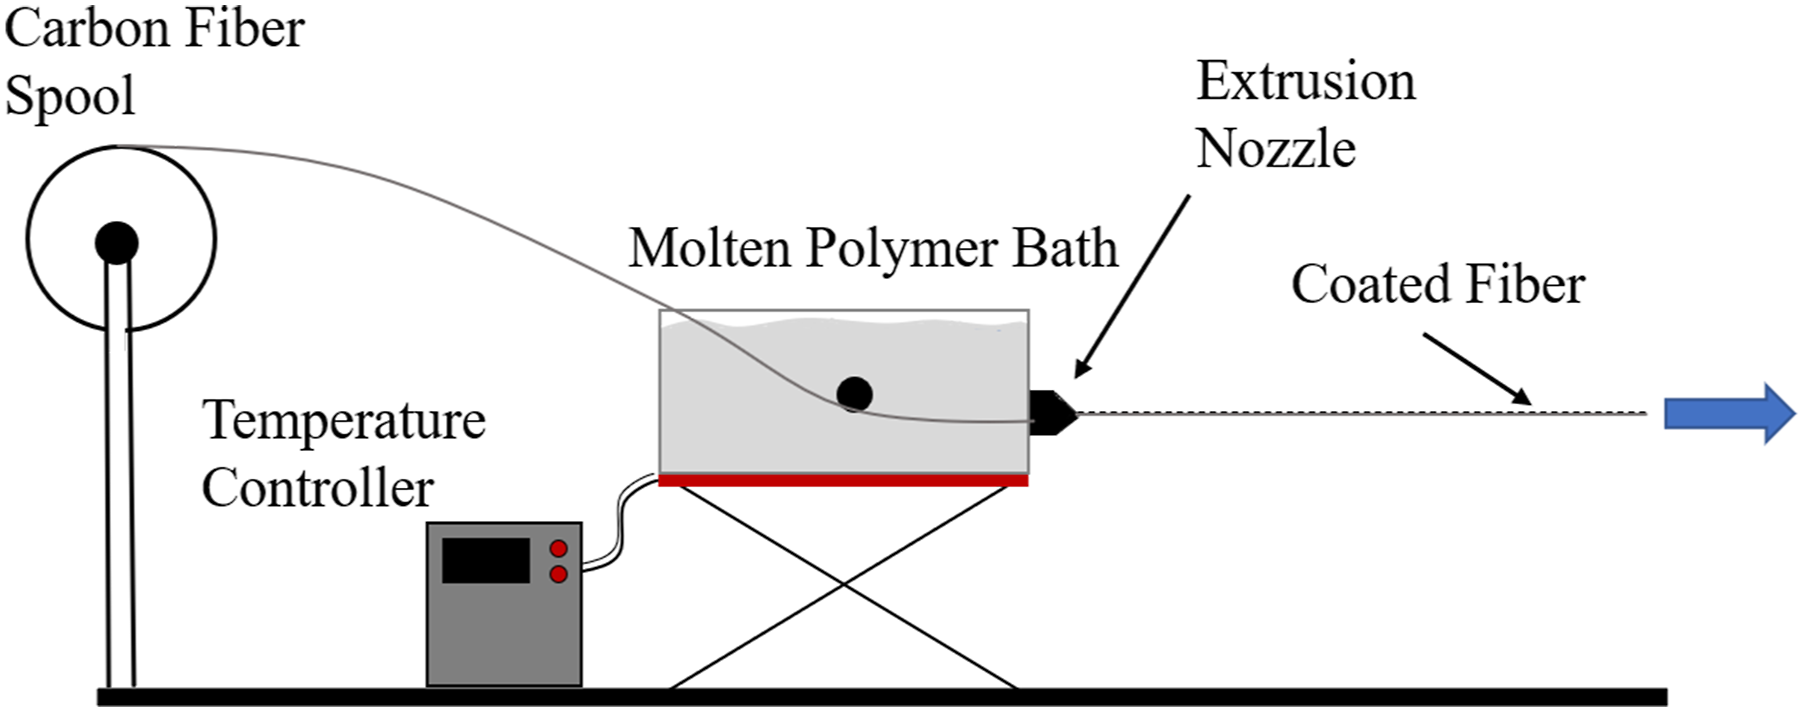
A custom g-code was used to control the 3D printer to fabricate unidirectional samples for tensile testing according to ASTM D3039-17 standard.
30
Samples were 200 mm long, 25 mm wide, and 5.6 mm thick. Samples with different CF content were fabricated as shown in Figure 3 by varying the location and number of layers of CF and PLA. Sample layer configurations; (a) 1-layer CF reinforced PLA composite, (b) 2-layer CF reinforced PLA composite, (c) 3-layers CF reinforced PLA composite.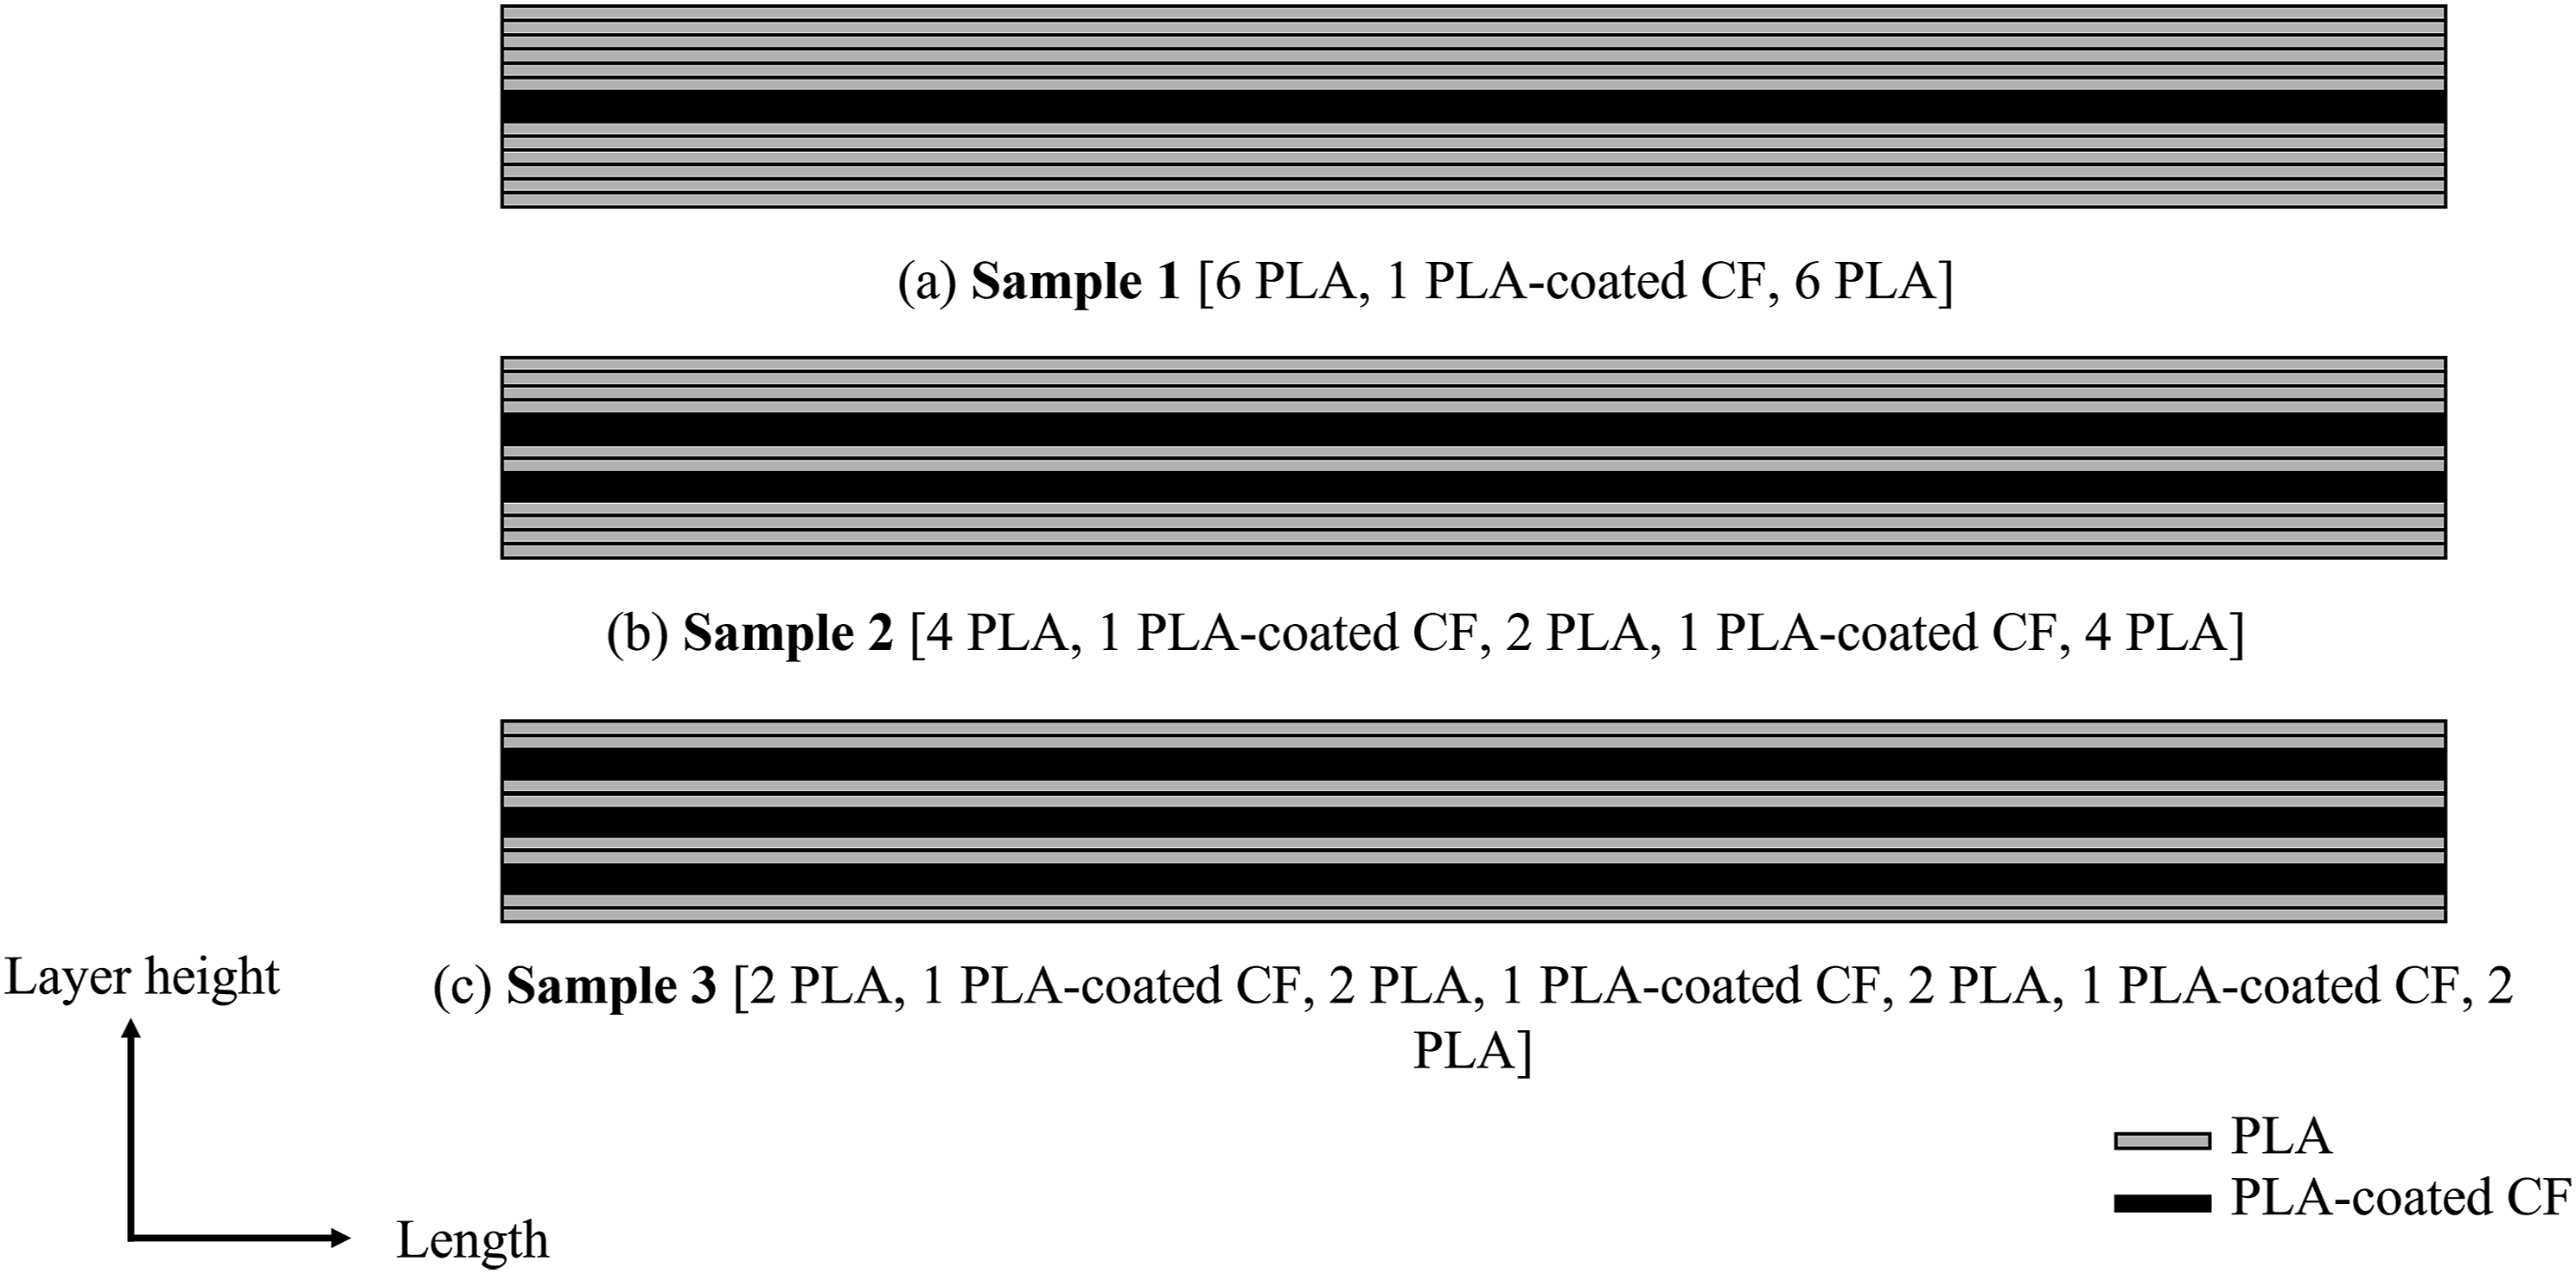
Steel end tabs were used to prevent the slippage between the 3D-prined composite samples and the grips of the tensile test frame and to assure the samples fail in the gauge section. The end tabs were waterjet cut from 1018 grade steel. The samples were bonded to the end tabs using high shear strength epoxy (LOCTITE EA E−20HP, Henkel, USA) as shown in Figure 4 and allowed to cure for 24 h before testing. This design of the end tabs was chosen to prevent the breakage of the sample in the grips region. A total of 30 specimens (3 of each composition of different CF grade at each of the three configurations shown in Figure 3 along with three pure PLA) were produced for this study. Views of CF reinforced PLA samples with end tabs.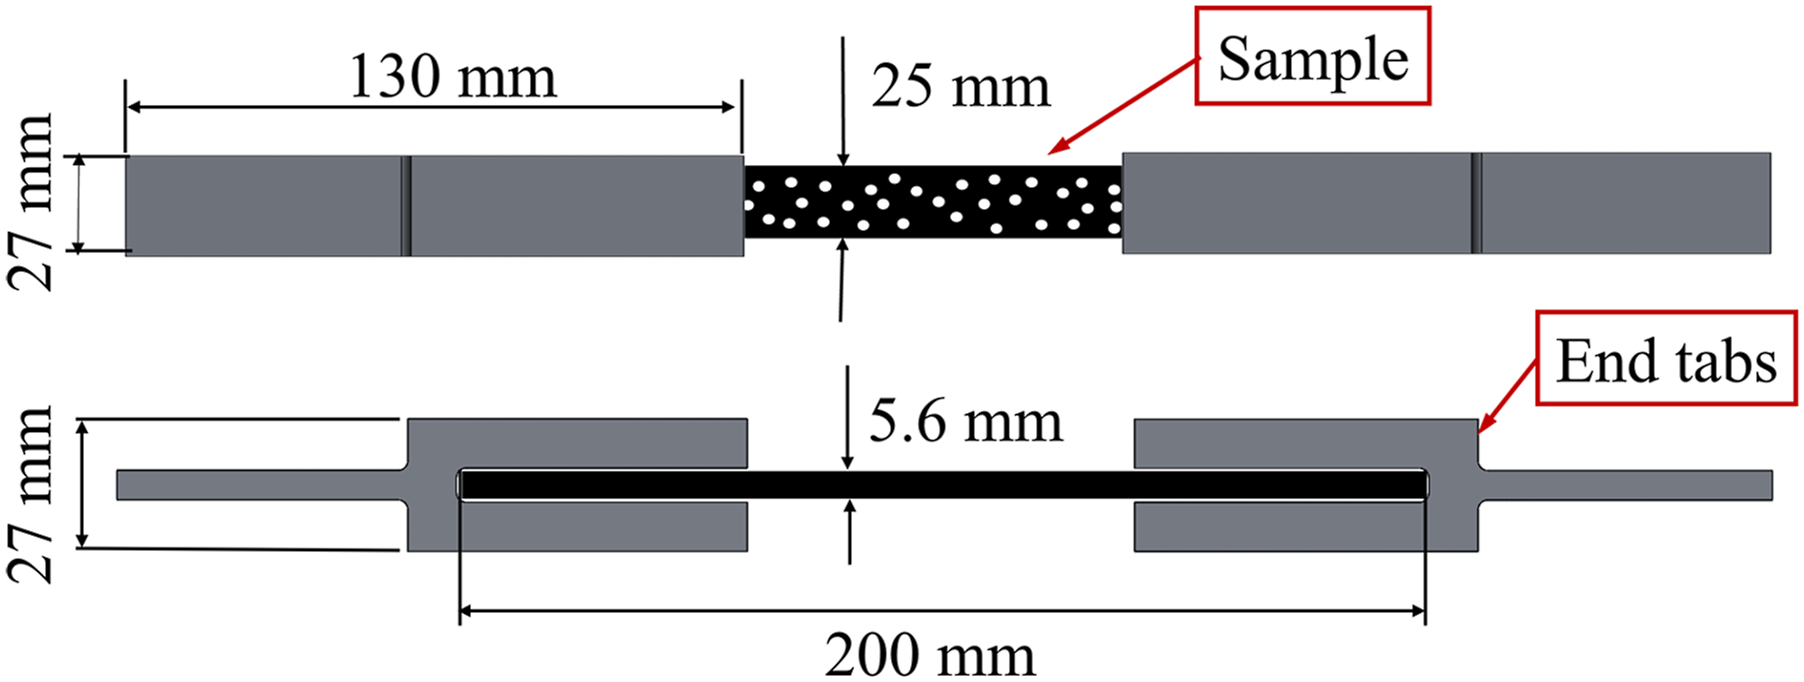
Tensile testing
A schematic diagram of the experimental setup is shown in Figure 5. The samples fabricated and the tensile tests were performed according to ASTM D3039 standard testing method.
30
Testing was performed using a mechanical test frame (Servo-hydraulic 809 System, MTS systems Co. USA), with a constant strain rate of 2 mm/min. Hydraulic grips were employed to ensure constant pressure on both ends of the specimens. Three samples of each composition were tested. Schematic diagram of experimental setup of tensile testing.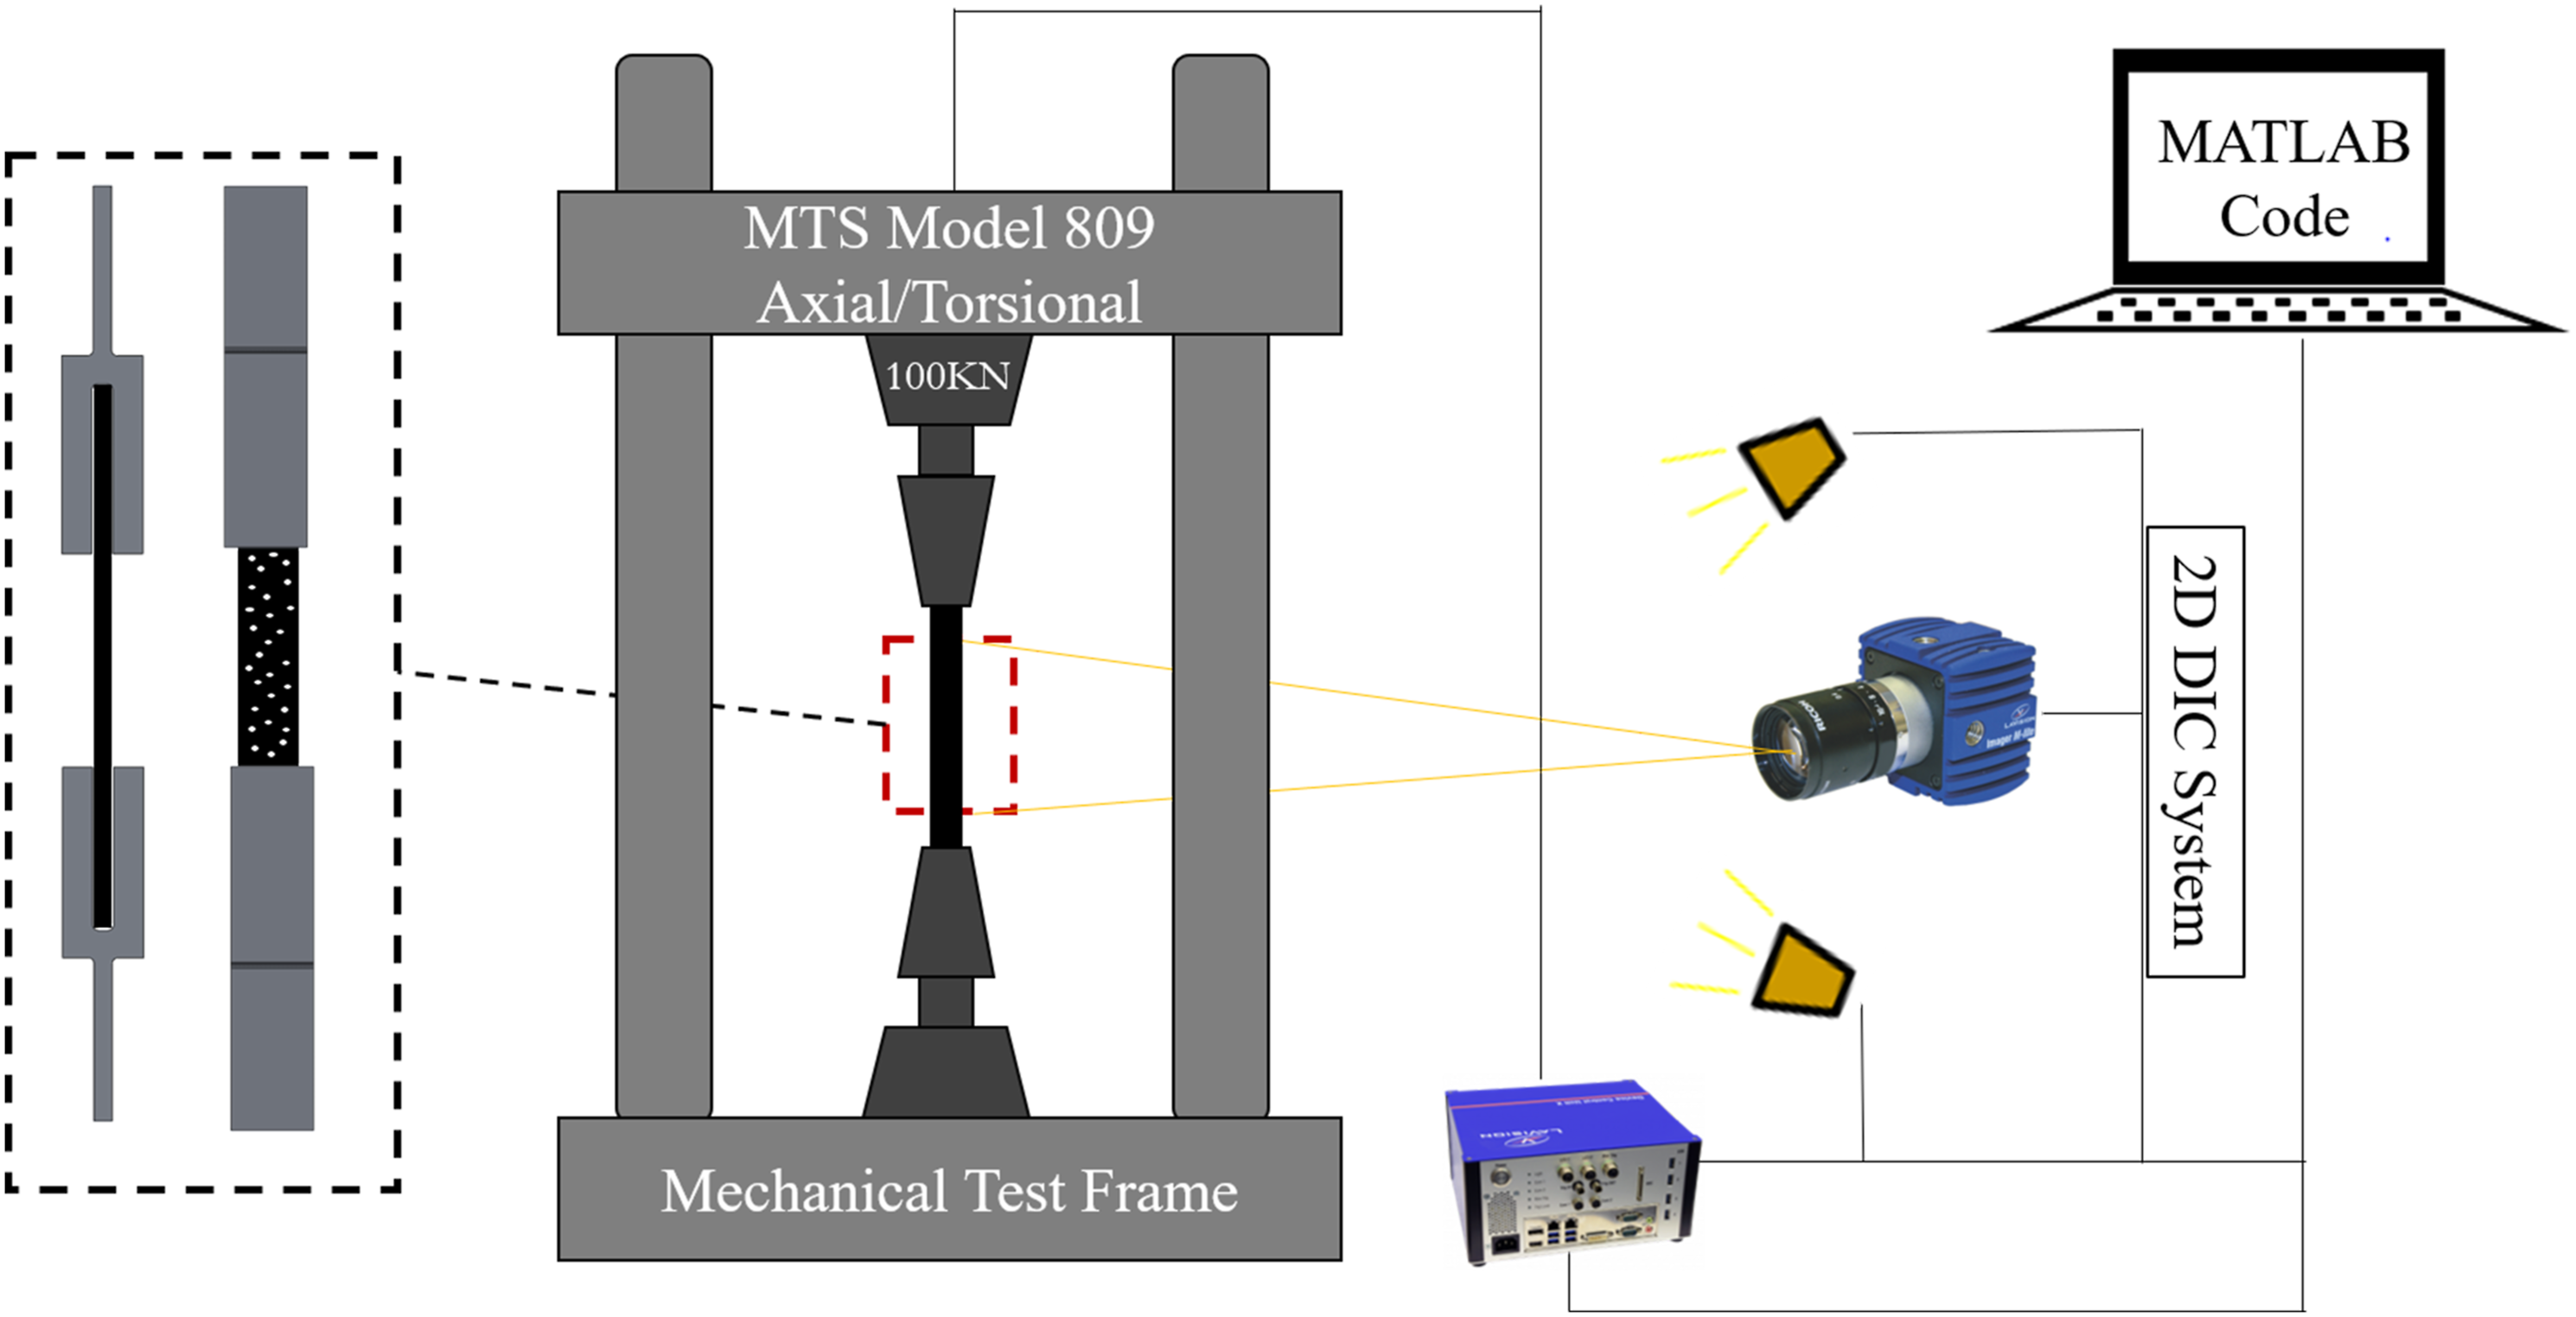
The sample deformation and strain were measured using 2D DIC system. Commercial DIC software (StrainMaster 10.0.3, LaVision GmbH, Gottingen, Germany) was used to conduct this measurement for the acquired images. First, the images were acquired using 5M Basler camera (acA2440-35um, Basler AG, Germany) equipped with CMOS sensor with resolution of 2448 × 2048 pixels. To select the required lens, first, the area of interest (AOI) on the sample is specified based on the gauge length (50 mm) and to be approximately similar to an aspect ratio of the camera sensor. The AOI was selected to be (60 mm × 70 mm) as depicted by red rectangle in Figure 5. The lens employed was 50 mm focal length (KOWA LM50JCM 2/3″ 50 MM F2.8, RMA electronics, USA). The camera was placed approximately 0.5 m away from the testing sample. The acquired images were divided into subsets of size 49 x 49 pixels with step size of 16 pixel for the deformation measurements. The camera and the tensile test frame were all synchronized together using a data acquisition unit (StrainMaster 10.0.3, LaVision GmbH, Göttingen, Germany). Strain was plotted against the corresponding stress to produce the stress-strain curve of each sample. The slope of the initial linear part of these curves was computed to obtain Young’s modulus of the 3D printed composites.
To ensure a high contrast surface of the sample for DIC measurements, first, the samples were prepared by painting them with matte black paint (2X Ultra Cover, Rust-Oleum Corp, Concord, ON). Then, the CF reinforced PLA sample’s black surface was covered by a white speckle pattern, using a mixture of white paint (5211 Opaque White, Createx Airbrush Colors, Createx Colors, East Granby, CT) and reducer (4012 High Performance Reducer, Createx). The speckle is applied to the sample using an airbrush (H-SET, Paasche Airbrush Company, Chicago, IL). Figure 6 shows part of 3D-printed sample with applied speckle pattern. Part of sample surface with black painting and white speckling.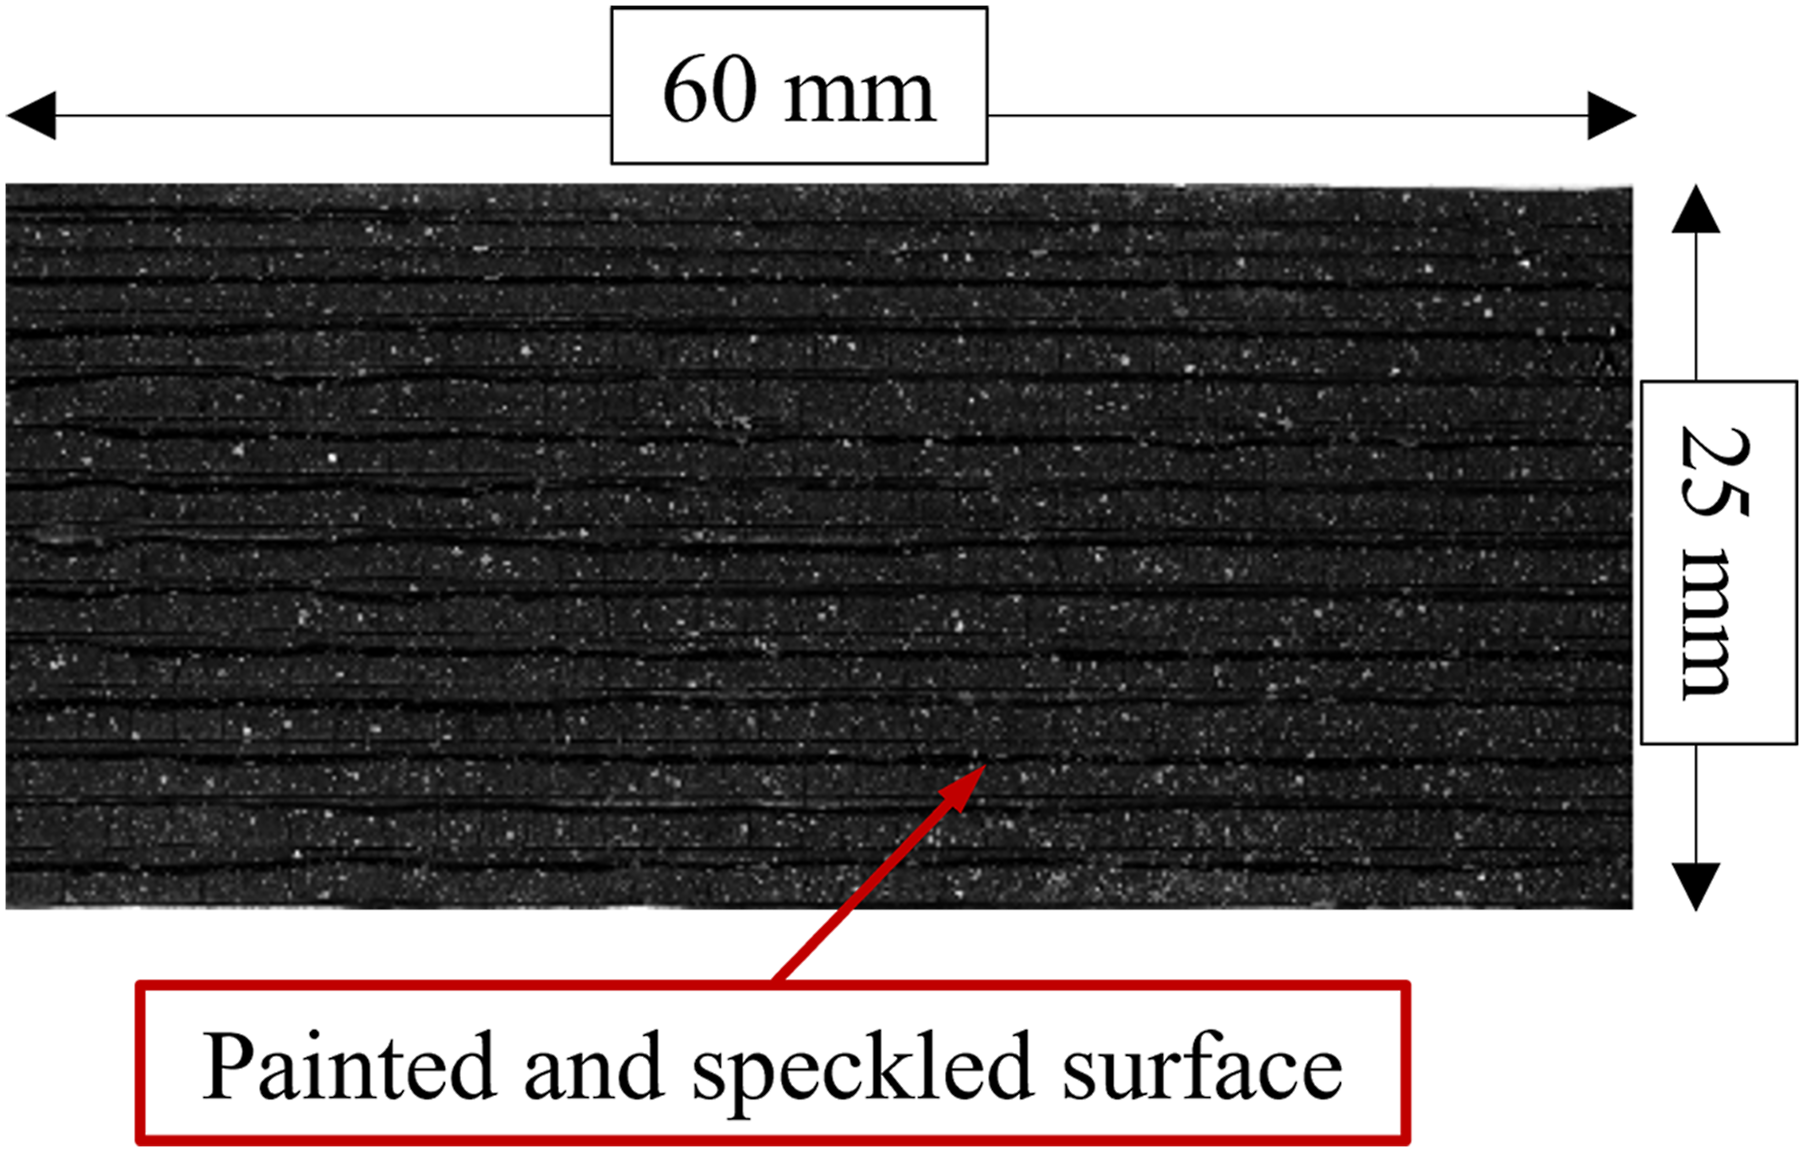
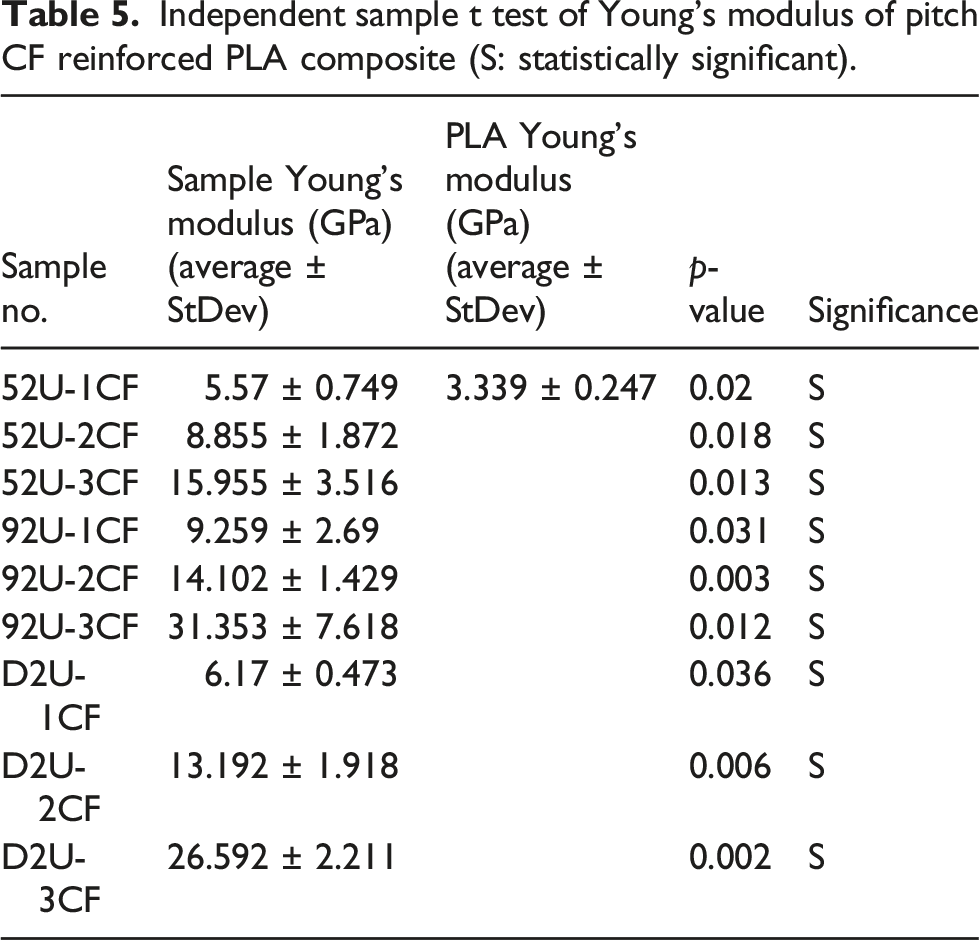
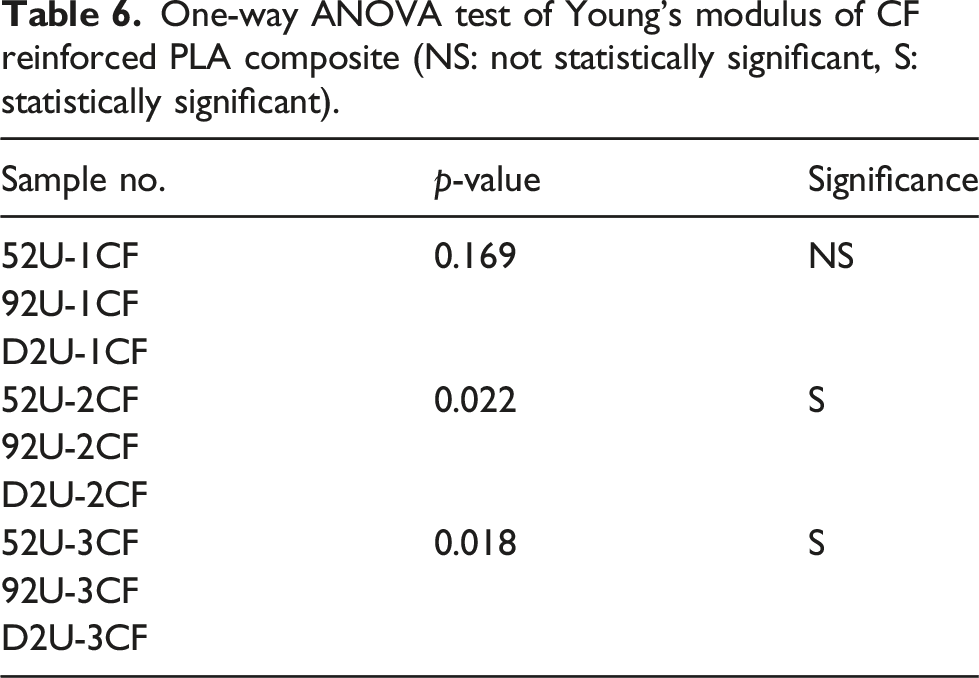
The tensile Young’s modulus data was analyzed statistically using Microsoft Excel software (Excel 2019, Microsoft, Washington, USA). First, an independent sample t test was applied to examine the significance between each composite sample compared to pure PLA one. Second, one-way ANOVA test was applied to check the effect of CF grade for each volume fraction on the Young’s modulus of CF reinforced PLA composites. For all cases, a confidence level of 95% (p-value <.05) was chosen for statistical significance.
Burnout testing
To measure the weight and volume fractions of both CF and PLA of each composition, burnout tests were performed to remove the PLA and isolate the pitch carbon fiber.31,32 A 38 mm length of each sample was placed in a lid covered crucible (GSC Go Science Crazy CLF30, Fisher Scientific, Canada) and heated to 500°C for 2 h in a furnace (BF51841 Series, Lindberg Blue M, Thermo Fisher Scientific, Canada) to burn off the PLA. Then the weight of the extracted CF with the crucible was measured using an analytical balance (PA 120 Series Analytical Balance, 120 G × 0.0001 g, Cole-Parmer Co., Canada). The weight of the empty crucible and the crucible with composite was measured before the test to calculate the weight and volume fractions using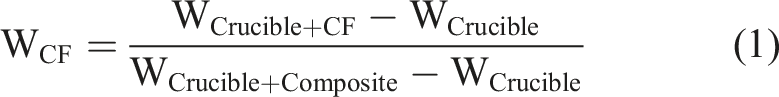

Analytical modeling
Rule of mixture model
A rule-of-mixture (ROM) model was applied to predict the tensile Young’s modulus of CF reinforced PLA composite.
33
The identified volume fraction and the Young’s modulus of each constituent were used to apply the model using equation (5). The voids are commonly existing in a 3D-printed structure, therefore, some researchers
21
take the existence of voids within the polymer into account by modifying the properties of the matrix (equation (6)).

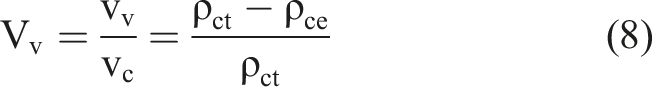
To calculate the void volume fraction (Vv) in each specimen, ROM was applied again to get the theoretical density of the composite (equation (7)) and then the Vv was calculated using equation (8).
33

Halpin-Tsai model
A previous investigation into the thermal properties of the 3D-printed pitch CF revealed a certain degree of fiber breakage during the process.
17
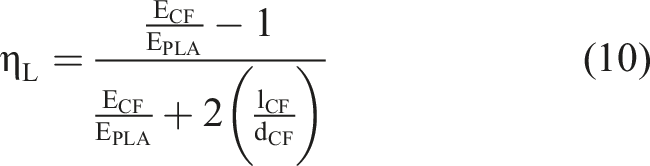
For this reason Halpin-Tsai model is applied to predict the mechanical properties of discontinuous polymer composites assuming that the broken fibers are aligned longitudinally in the specimen (equation (9)–(12)).
34
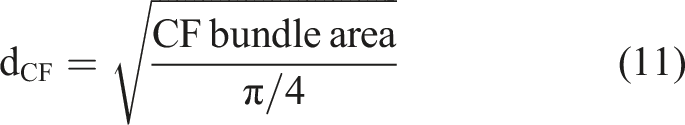
It is challenging to accurately quantify the average length of the CF fibers using burn-out samples as the CF exists in bundle and it is difficult to get individual CF fiber for length measurements. Instead, six different average lengths of CF (10, 20, 30, 40, 50 and 60) were assumed and applied to equation (9) to predict the tensile Young’s modulus with respect to each length and compare to the experimental values. The Halpin-Tsai parameters (ηL and dCF) were calculated as shown in Equations (10)–(12).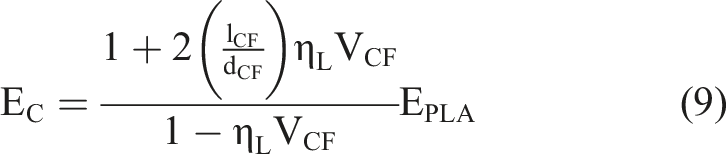

To validate the fiber length, a paired sample t test was conducted to compare the analytical model results with the experimental values for different fiber lengths. A confidence level of 95% (p-value <.05) was chosen for statistical significance.
Results and discussion
Volume fractions
Weight and volume fractions of CF PLA composite samples.
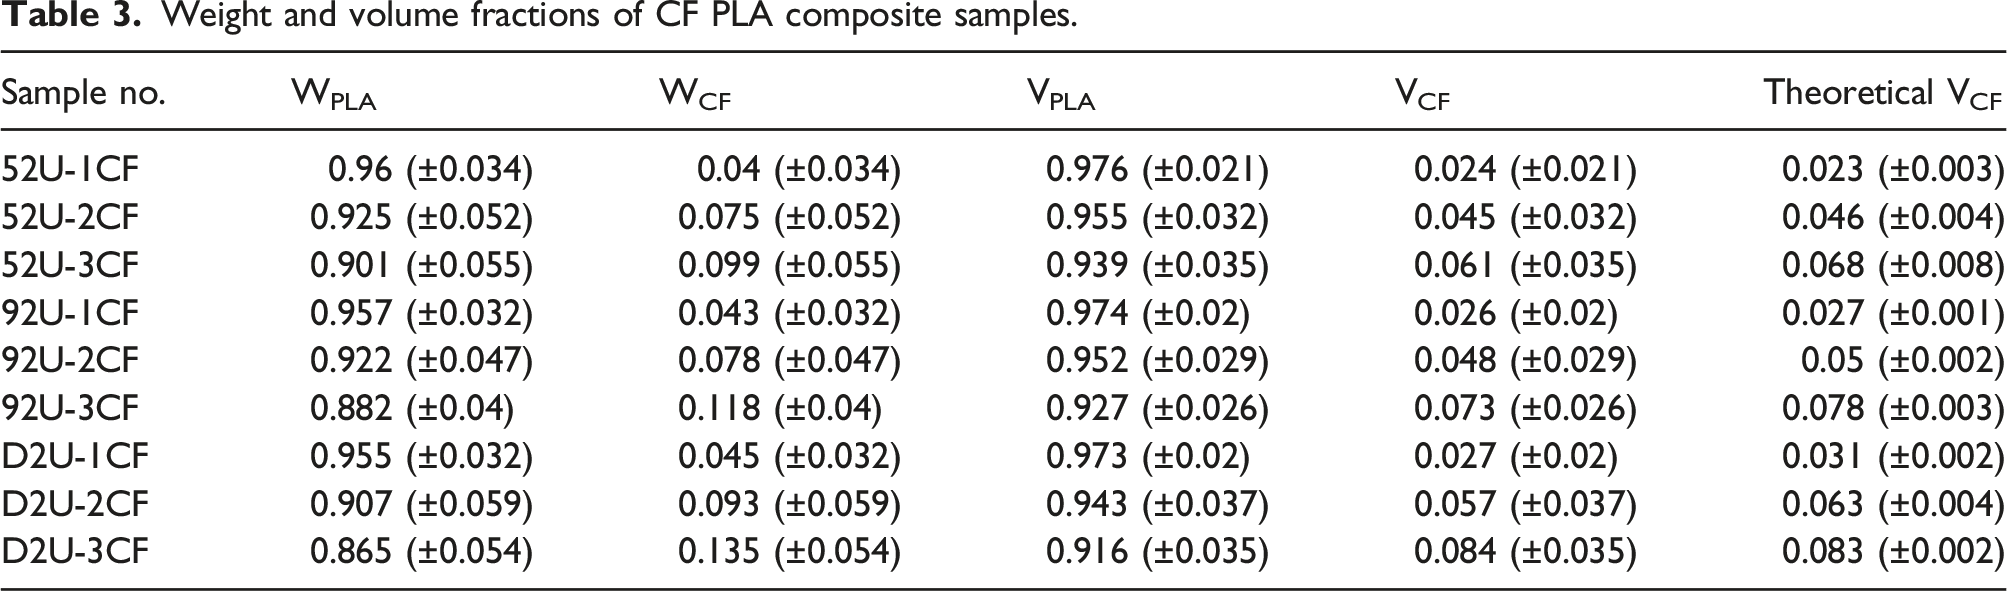
Figure 7 compares the void volume fractions (Vv) of the different sample compositions. The Vv was calculated using equation (8). It can be noted that the 92U CF grade composites have the lowest Vv with 0.17 Vv for the composite with one layer, 0.084 Vv for two layers composite, and 0.13Vv for three layers composite. 52U CF reinforced PLA composite showed the highest content of voids with 0.355 Vv for one layer composite, 0.224 Vv for two layers composite, and 0.265 Vv for three layers composite. For the 3D printing process with the same printing conditions, it is very challenging to have a consistent quality of the 3D-printed samples. This may be the reason why there is no specific trend for the void content between different fibers grades and fibers content. Generally, the D2U CF PLA composites have higher void content compared to the 92U CF PLA composites and this may be attributed to the higher number of fiber cuts within the D2U CF PLA composites during the 3D printing process compared to the 92U CF PLA composites as the former fiber grade is stiffer than the latter one. While the D2U CF PLA composites have void content less than that of 52U CF PLA composites and this may be due to the higher diameter of D2U CF compared to 52U CF as indicated in Table 1. The higher diameter with the same layer thickness during the 3D printing process may lead to more compaction during the printing process and thus better bonding between layers and less void content. As reported in previous studies,35,36 the voids frequently exist in the 3D-printed structures of carbon fiber reinforced thermoplastics due to the geometry of the extruded polymer of this technique. Additionally, it was reported in several studies19,20,37,38 of continuous reinforced 3D-printed samples that voids mostly exist around the continuous reinforcement. Vv for each 3D-printed CF reinforced PLA composite sample.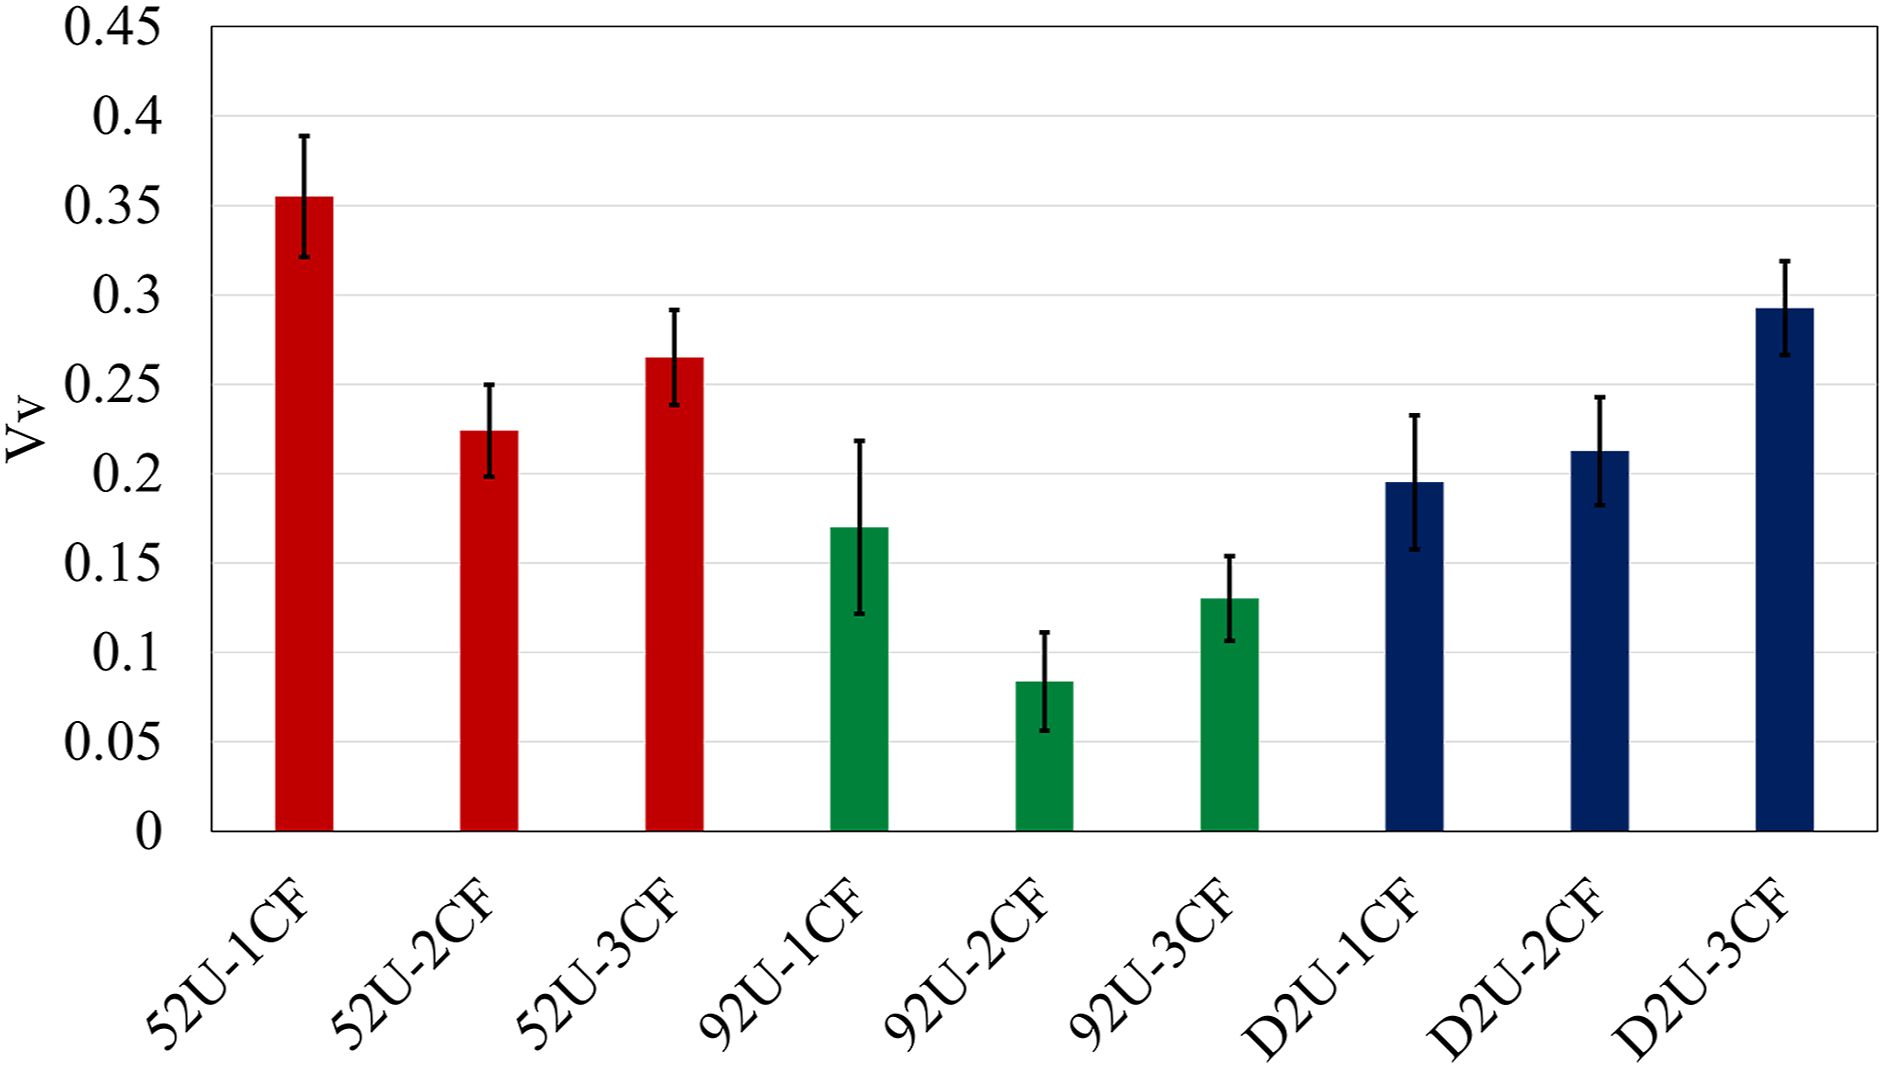
Some approaches that can be followed in the future to improve the quality of the 3D-printed samples and to reduce their void content were discussed by Krajangsawasdi et al. 39 For instance, a compaction pressure can be applied to enhance the bonding strength between rasters. A compaction pressure can be applied either during the 3D printing process itself or post-printing. The layer thickness and the nozzle geometry are the printing parameters that can be adjusted to apply a compaction pressure and to reduce the inter-raster voids during the 3D printing process. Vacuum-bagged technique can be used as a post-processing compaction. 39
Mechanical properties
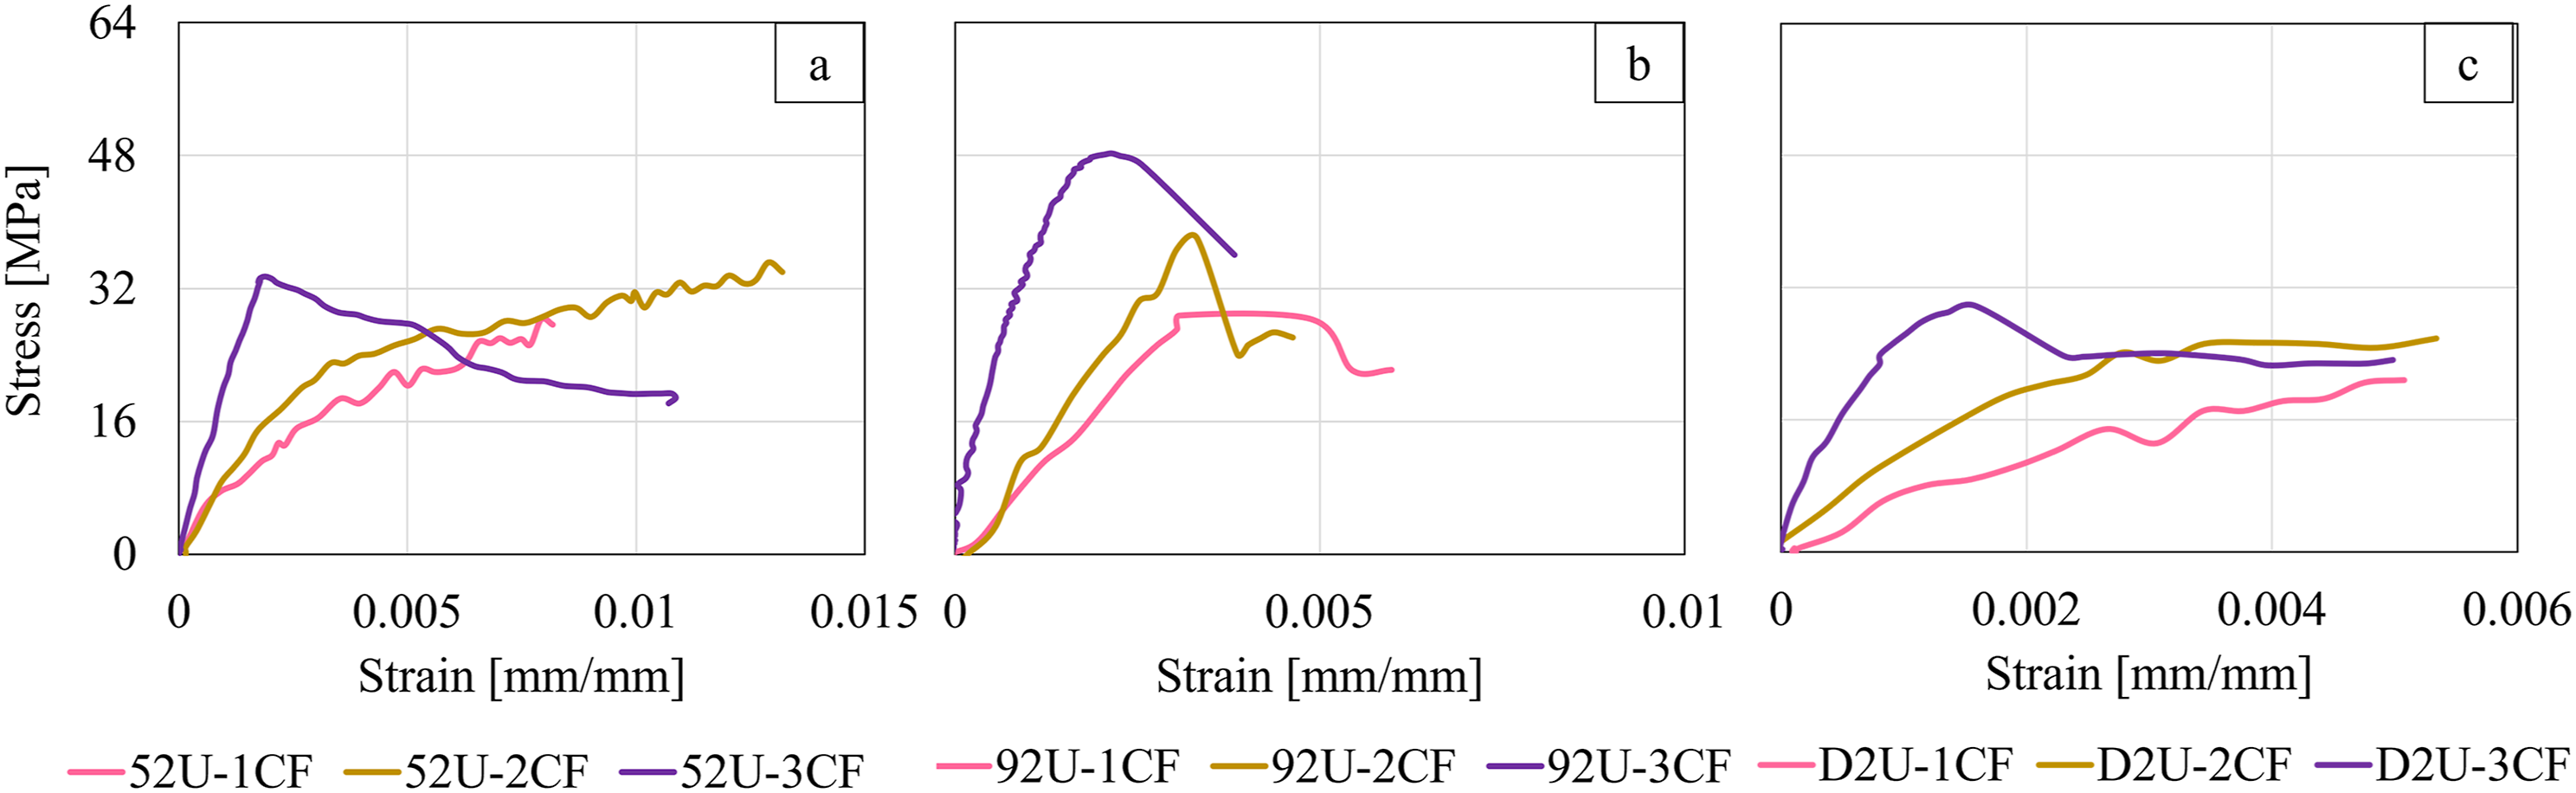
The calculated average values of strain obtained within field of view (25 mm × 50 mm) from DIC images were used to plot stress-strain curves of the 3D-printed samples as shown in Figure 8. Figure 9 shows examples of strain-stress curves for CF reinforced PLA composites and illustrates the effect of Vf on the slope of the initial part of the curves for different grades of pitch CF reinforced PLA composites. These graphs were used to calculate Young’s modulus from the slope of the initial linear part of the curve. The calculated Young’s modulus of the different samples is summarized in Figure 10. Here, the value of Young’s modulus increased with increasing fiber content for each grade of pitch CF. Stress-strain curves of CF reinforced PLA composites. (a) 52U-1CF (b) 52U-2CF (c) 52U-3CF (d) 92U-1CF (e) 92U-2CF (f) 92U-3CF (g) D2U-1CF (h) D2U-2CF (i) D2U-3CF. Stress-strain curves with different Vf of; (a) 52U CF PLA, (b) 92U CF PLA, (c) D2U CF PLA. Young’s Modulus of CF reinforced PLA composites.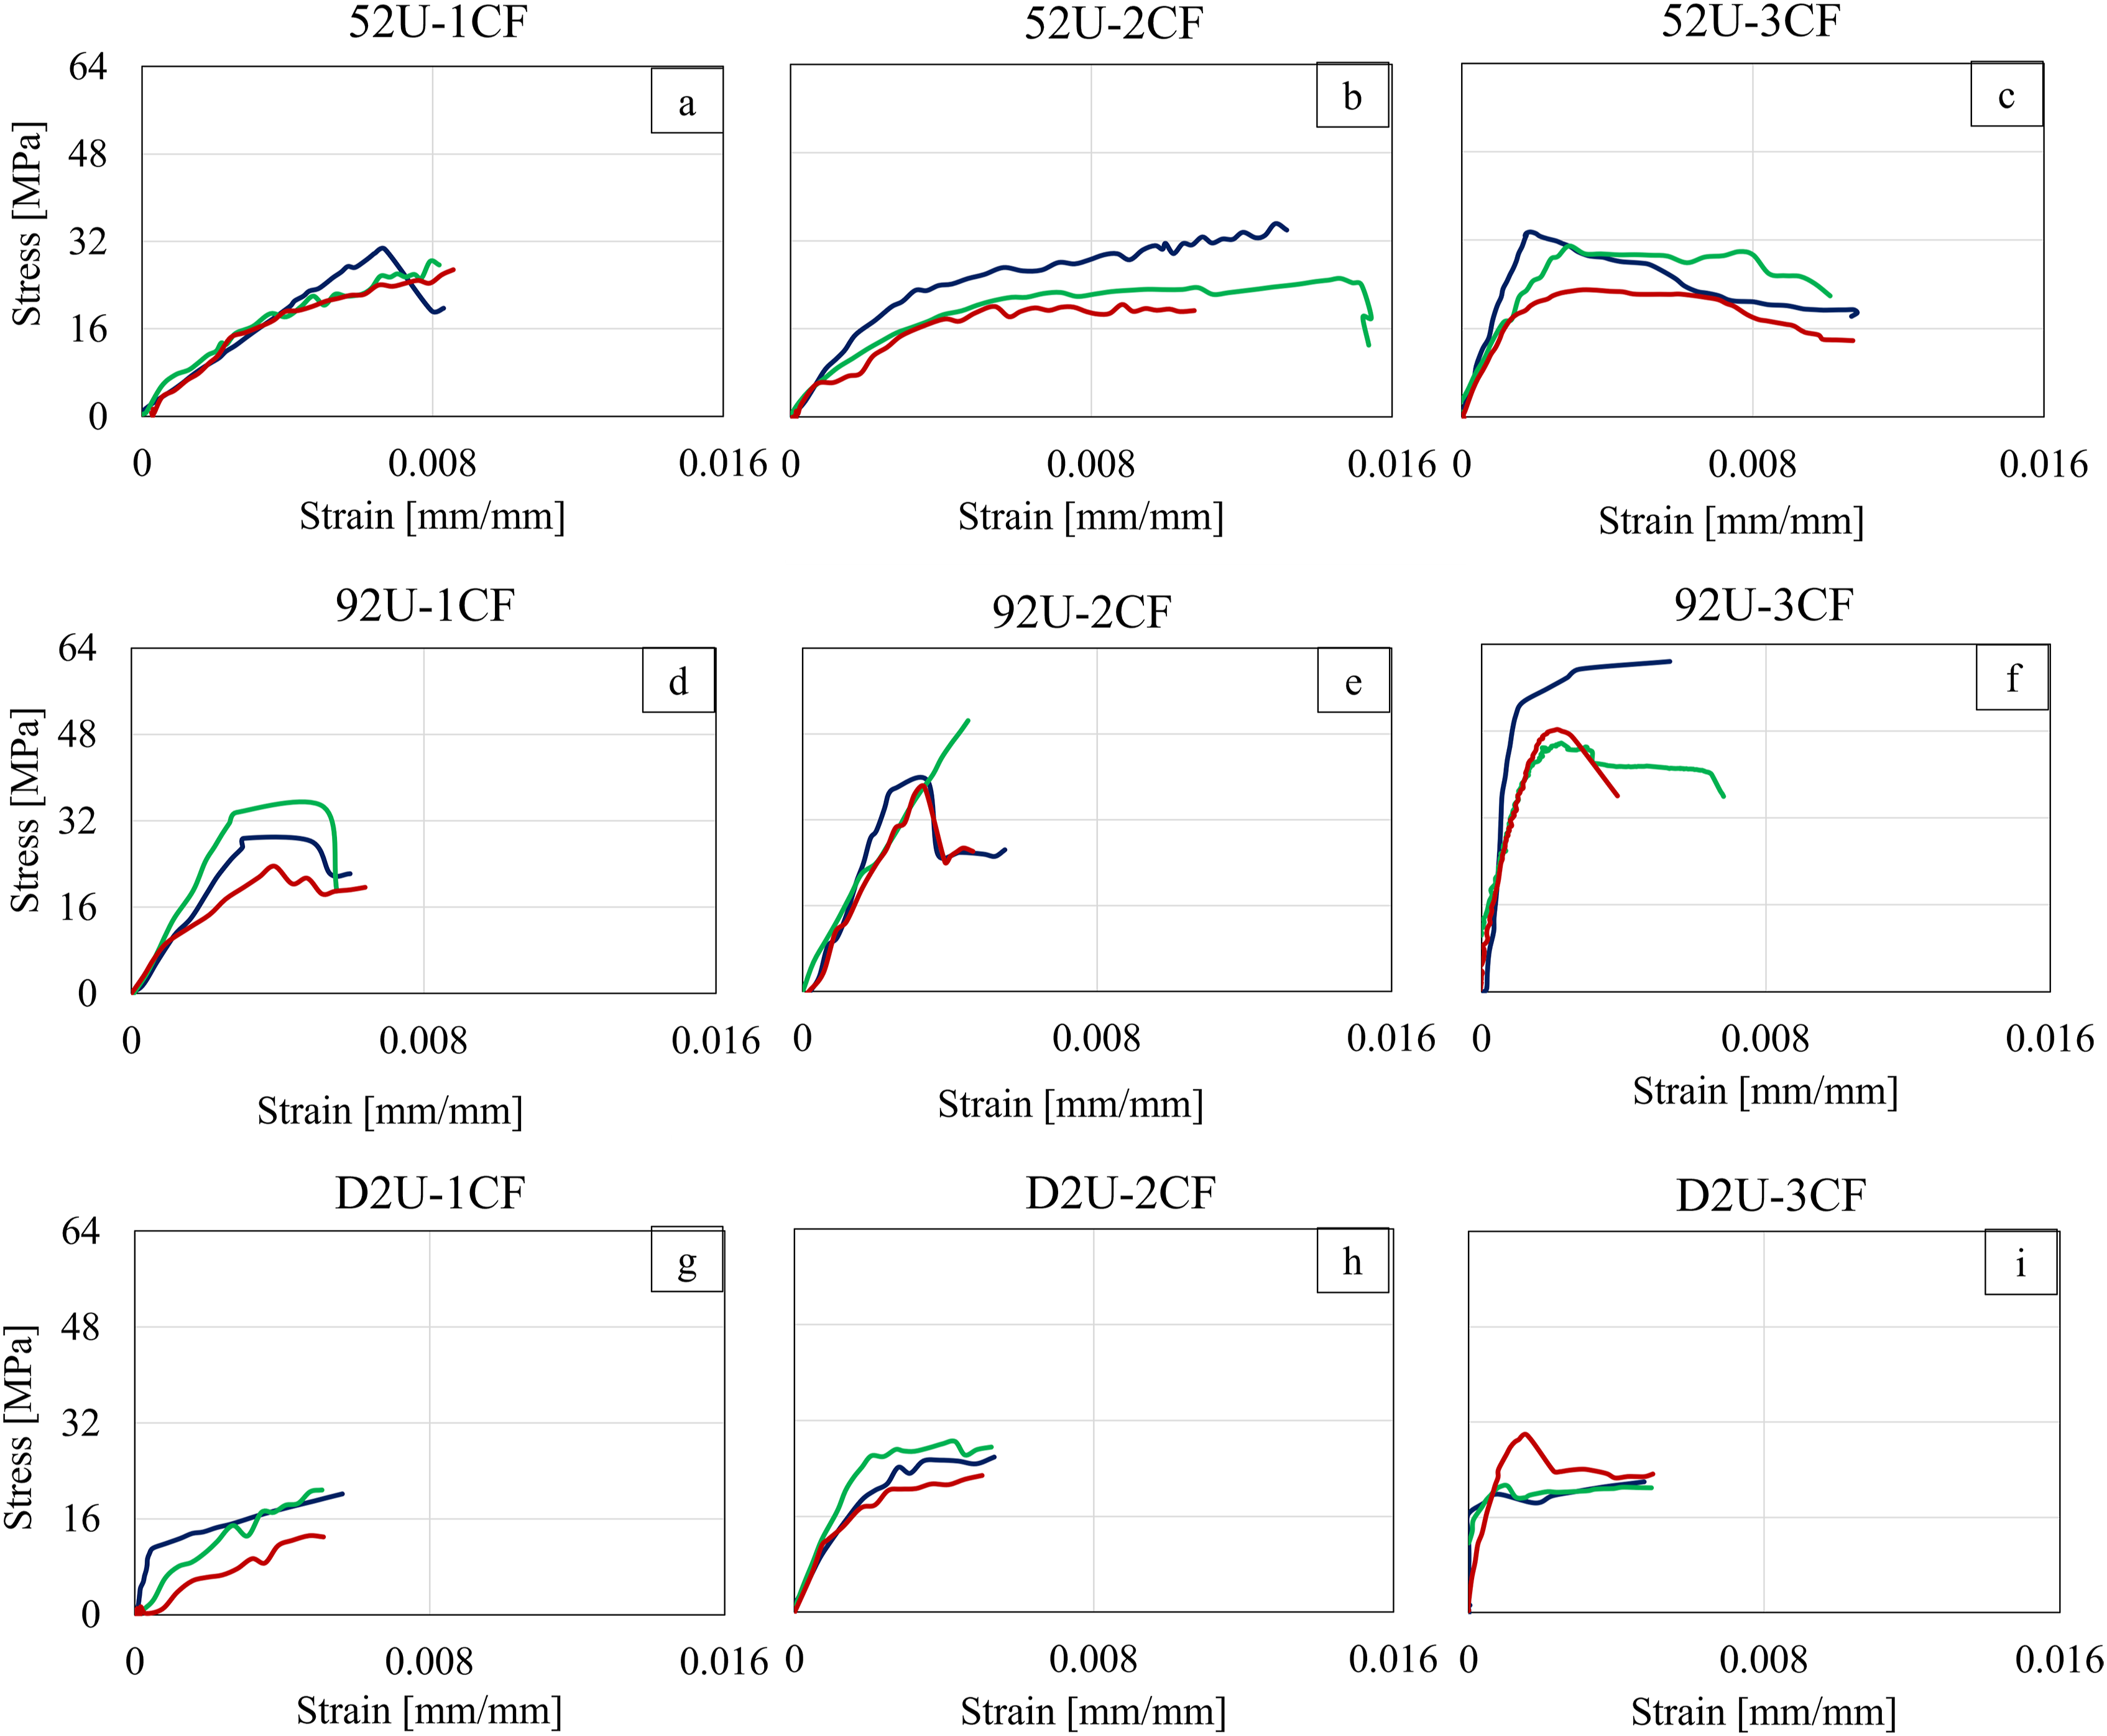
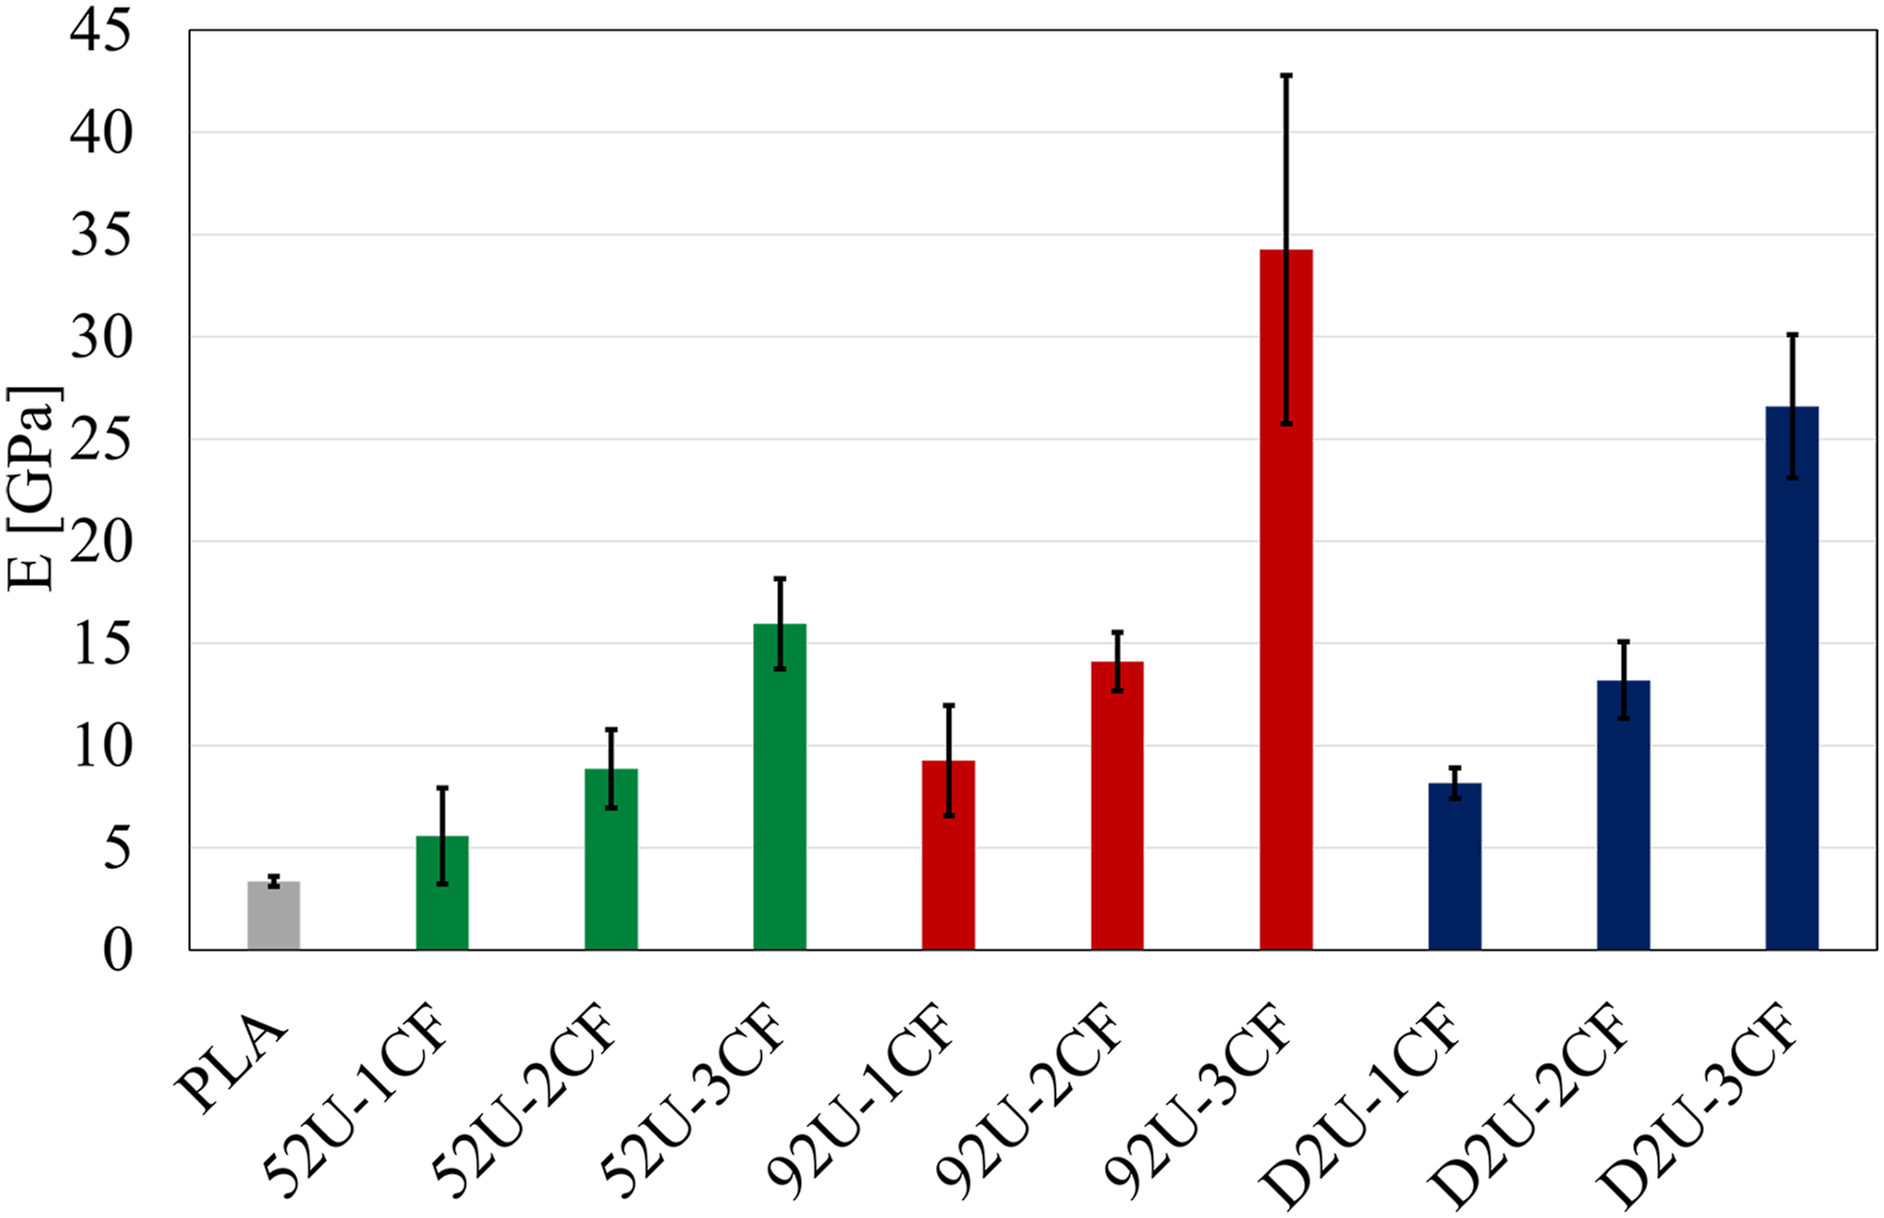
Interestingly, the stiffest pitch CF did not yield the stiffest composite: the D2U pitch CF has the highest Young’s modulus (Table 1), however the 92U 3-layer composite resulted in the sample with the highest stiffness. We attribute this to the relative brittleness of D2U CF compared to other grades (Table 1), which results in a larger degree or more frequent breakage of fibers during the printing process, hence, a reduced Young’s modulus due to greater fiber discontinuity. A similar trend in composite thermal conductivity was observed by Olcun et al. 17 wherein composites consisting of the stiffer, more brittle pitch CF grades yielded thermal conductivities further from the theoretical predictions. The Young’s modulus of the composite depends on both CF length within the structure and the Young’s modulus of the CF itself which depends on the grade of CF. That is why the 52U CF composites showed the lowest Young’s modulus as the 52U CF grade has the lowest Young’s modulus as indicated in Table 1.
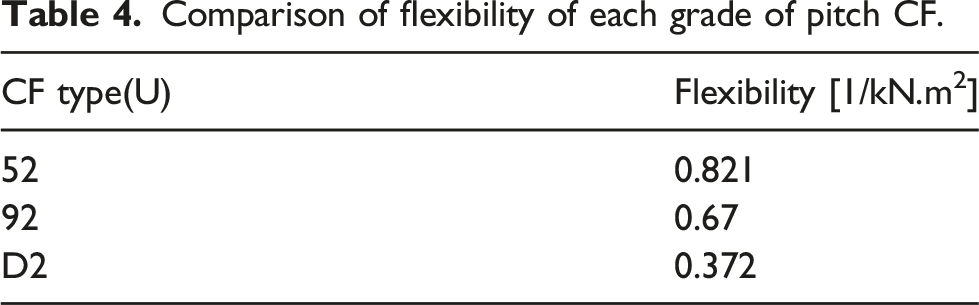
The fiber breakage conjecture can also be rationalized by estimating the fiber flexibility which depends on the fiber geometry and its elastic stiffness given by
40
as
Comparison of flexibility of each grade of pitch CF.
As shown in Figure 7, the 92U CF reinforced PLA composites have the lowest Vv which also justifies their highest mechanical performance. The Young’s modulus of 92U-3CF reinforced PLA composites (31.35 GPa) was improved by 850% compared to pure 3D printed PLA (3.3 GPa). The 52U-1CF reinforced PLA composite has the lowest Young’s modulus compared to other composites, however, it also showed an improvement of 67% compared to pure PLA sample.
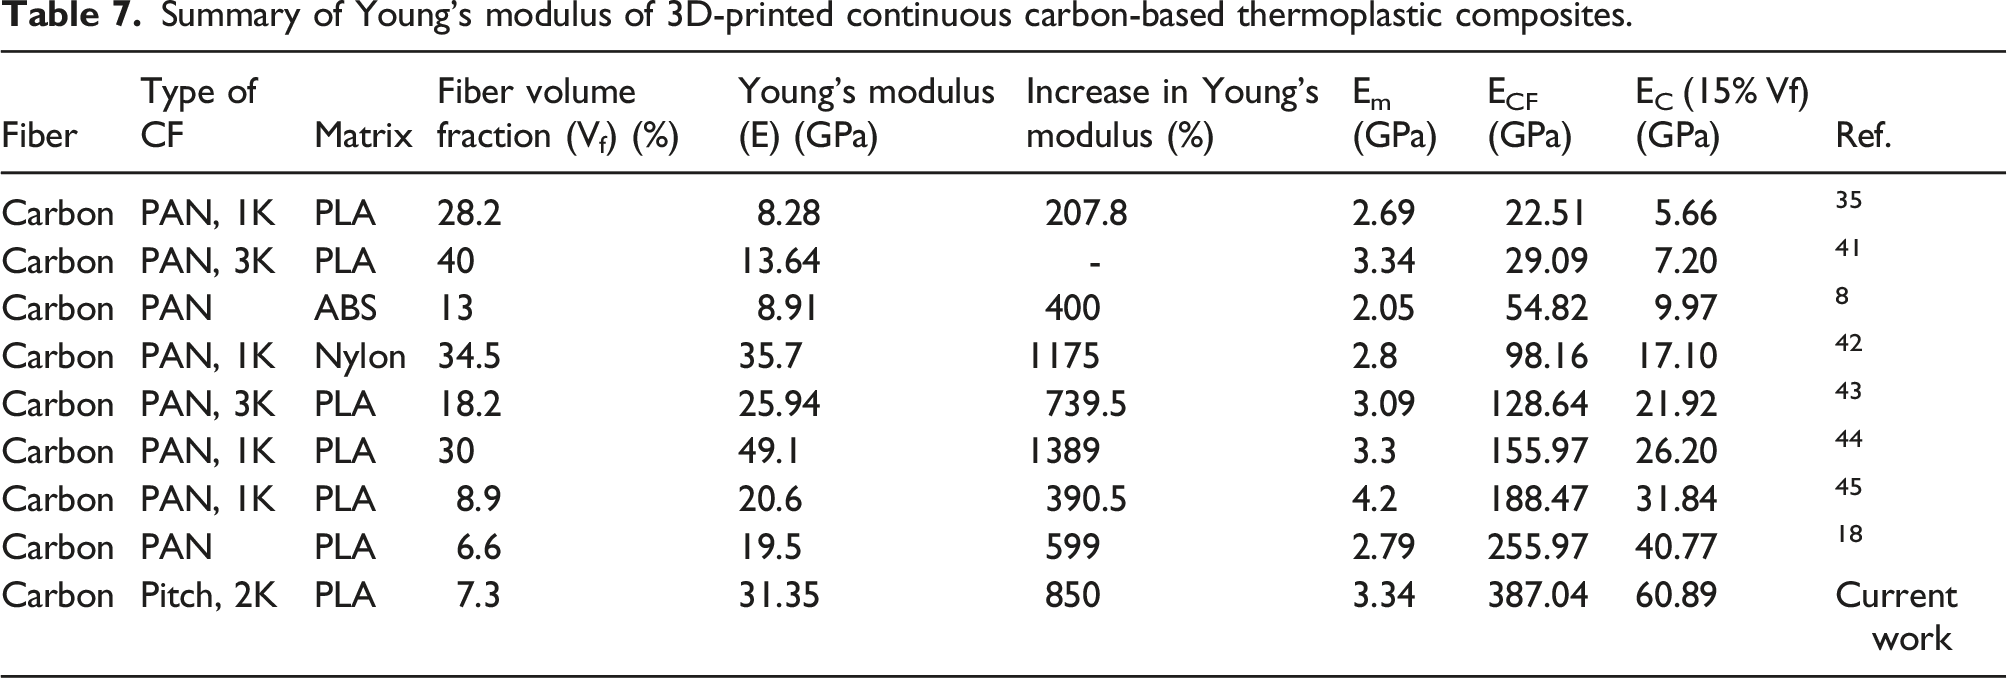
Although the high Young’s modulus of pitch CF presents technical challenges when 3D printing pitch-based CF reinforced PLA composites (especially compared to the commonly 3D-printed PAN CF), pitch CF shows great promise as a reinforcement. For example, Matsuzaki et al. found that the addition of 6.6% PAN based CF (T800S-10E, Toray) to PLA increased the Young’s modulus by 599% compared to pure PLA. 18 In addition, Love et al. reinforced ABS with 13% PAN based CF (Hexcel AS4) and found that the Young’s modulus was improved by 400%. 8 Heidari-Rarani et al. reported an increase of 207.8% of the Young’s modulus of 3D-printed continuous PAN based CF (T300, 1K, Toray) PLA composite when using 28.2% volume fraction of CF. 35 Uşun et al. 3D-printed three different volume fractions (22, 33, 40%) of continuous PAN based CF (3K, DowAksa) with PLA and the highest Young’s modulus was found to be 13.64 GPa when using 40% CF, which is lower than the Young’s modulus of 92U CF PLA composite with three CF layers (31.35 GPa). 41
Independent sample t test of Young’s modulus of pitch CF reinforced PLA composite (S: statistically significant).
One-way ANOVA test of Young’s modulus of CF reinforced PLA composite (NS: not statistically significant, S: statistically significant).
Comparison to analytical models
The experimentally obtained Young’s modulus of each 3D-printed pitch CF PLA samples is compared with the stiffness predicted by the ROM and Halpin-Tsai models in Figure 11. Across the sample set, the ROM model over-predicts the stiffness of the samples. Here the ROM model assumes fiber continuity and it follows that this difference is due a degree of breakage of the relatively brittle pitch fibers during the fabrication process. ROM model also assumes good adhesion between the reinforcement and matrix with no voids, however, the 3D-printed samples showed an existence of voids within the sample as presented in Figure 7. Additional factors contributing to deviation from the ROM include the shift of fibers from a zero angle and the deformation of fibers as they exit the nozzle along with melted polymer. Experimental and analytical model results of tensile Young’s modulus of CF reinforced PLA composites. (a) 52U-1CF (b) 52U-2CF (c) 52U-3CF (d) 92U-1CF (e) 92U-2CF (f) 92U-3CF (g) D2U-1CF (h) D2U-2CF (i) D2U-3CF.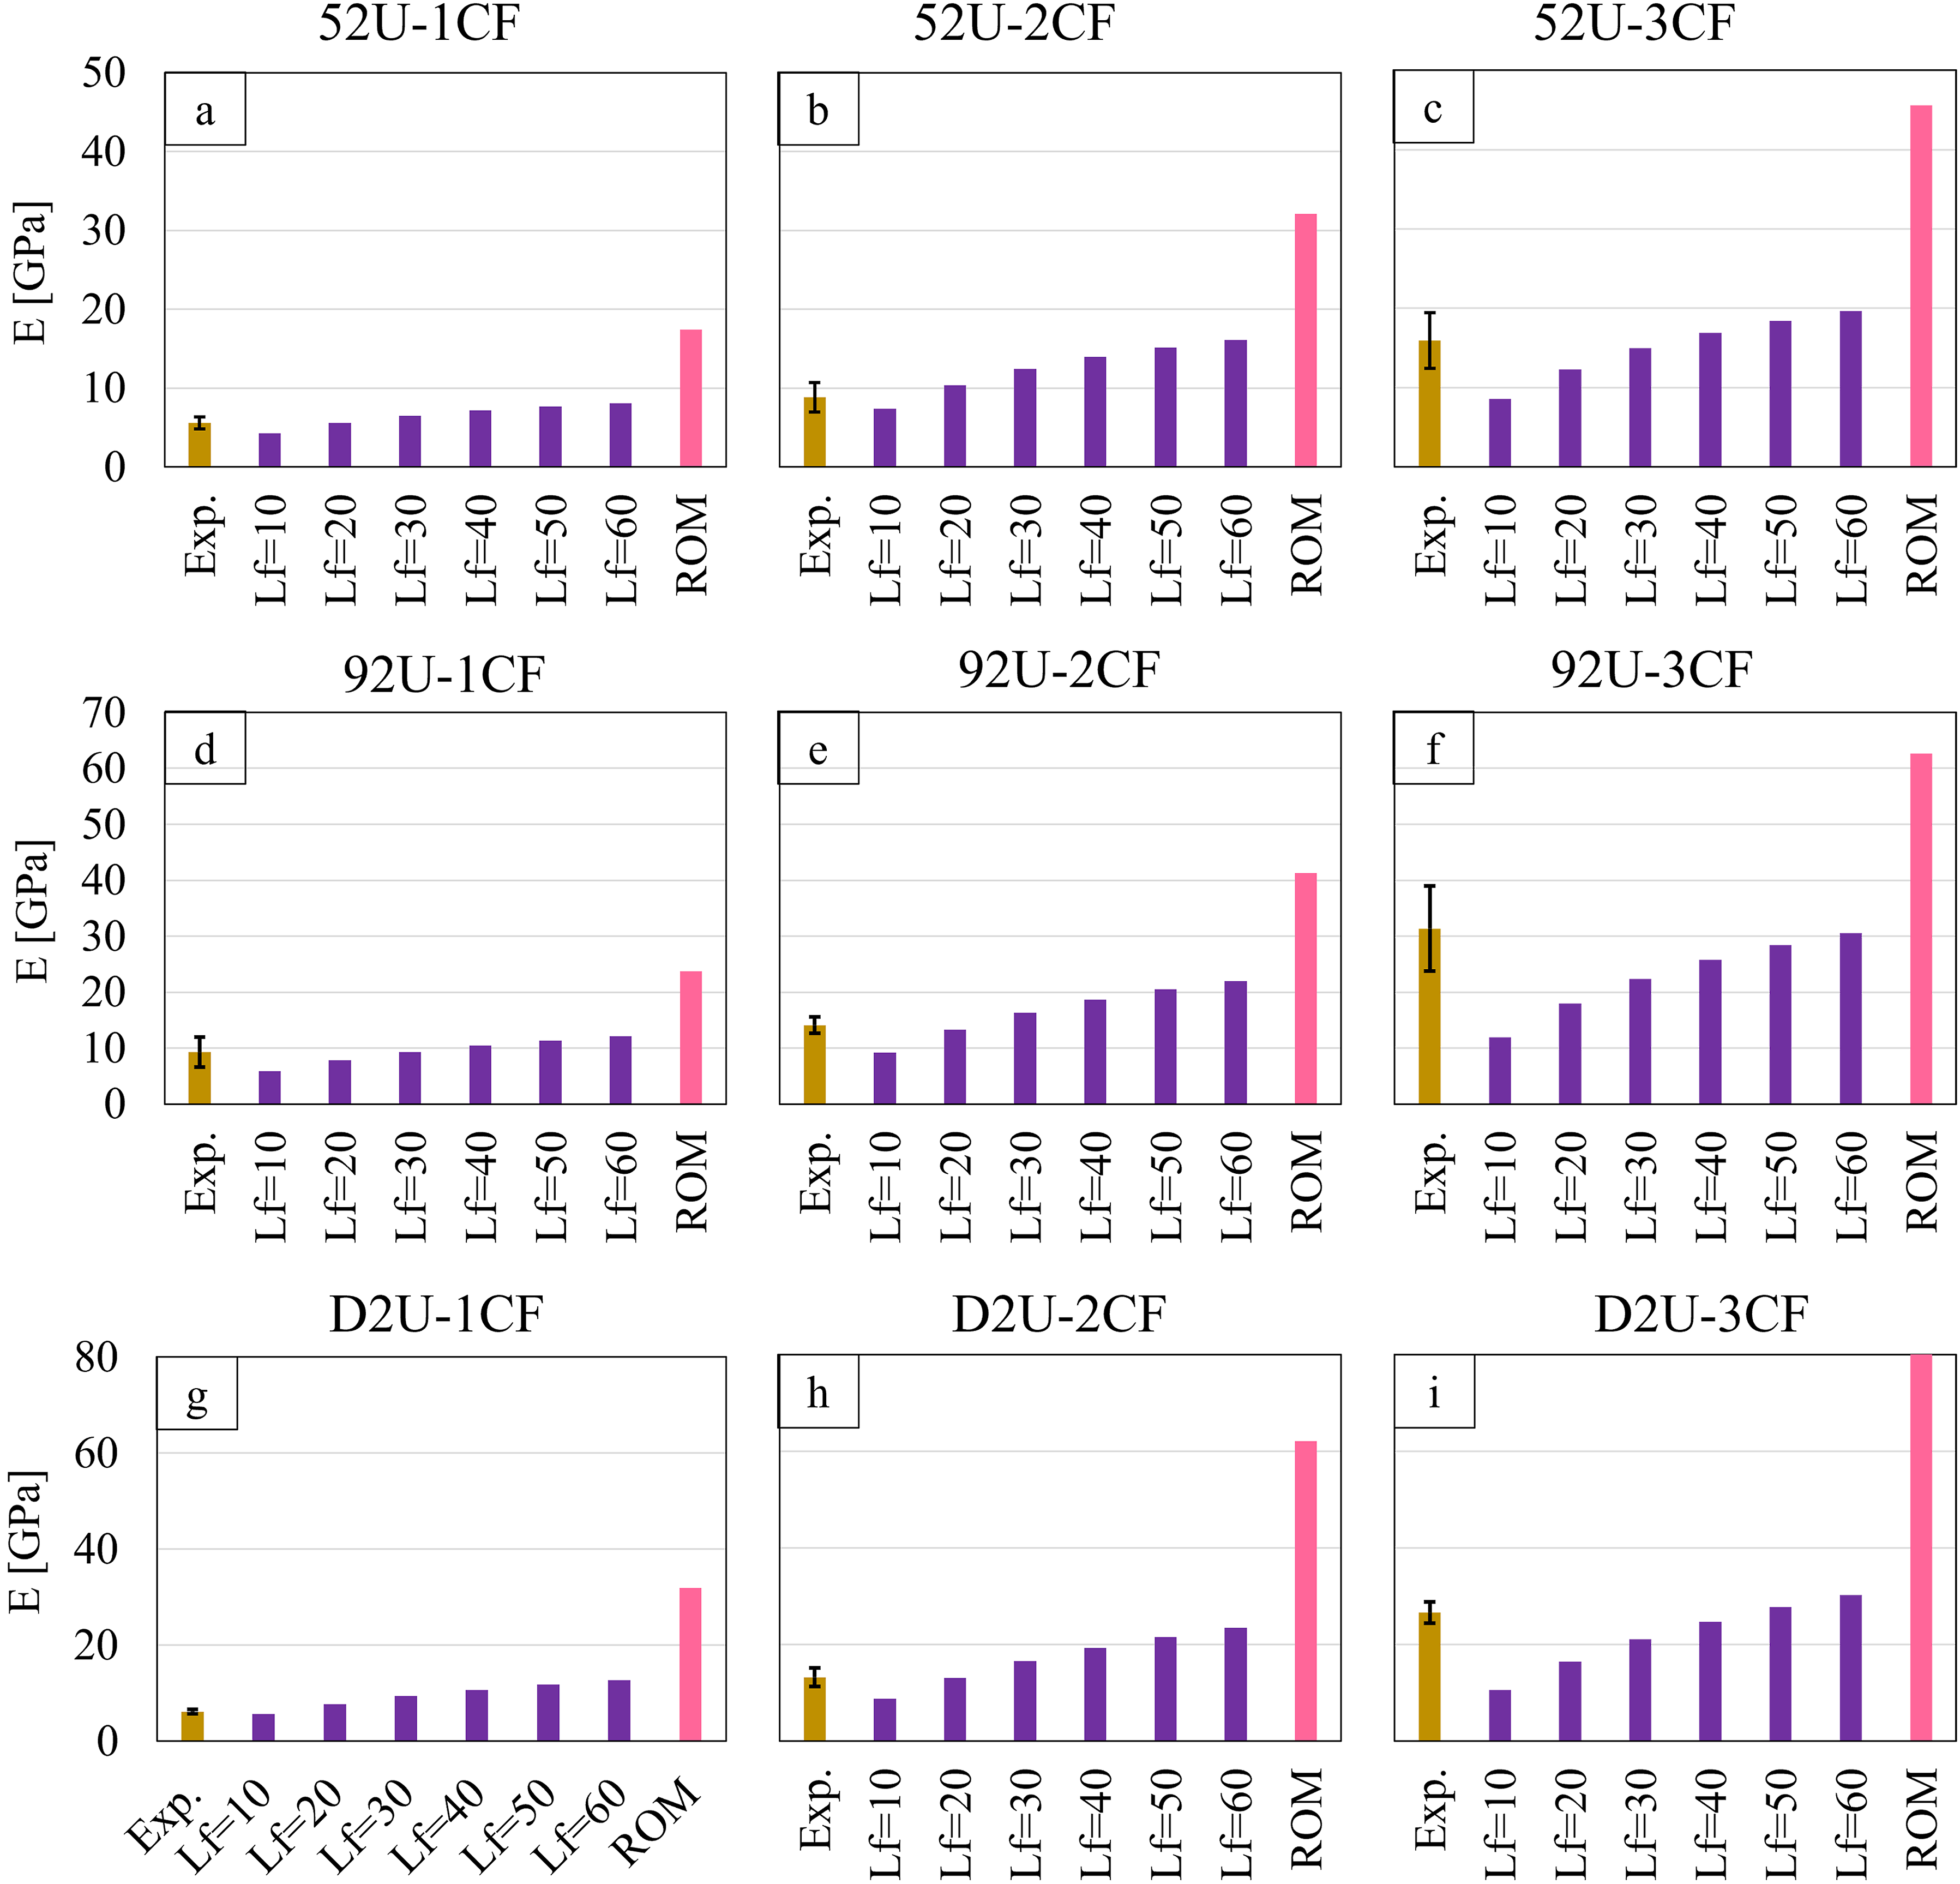
The Halpin-Tsai model for discontinuous fibers was applied following equations (9)–(12) but requires an input for average fiber length. By assuming different fiber lengths and comparing the predicted Young’s modulus with the experimental values, the approximate average fiber length for each grade of CF within the polymer composite can be estimated. For the D2U CF samples, the estimated fiber length was lower than the estimated fiber length of the other conditions (lf ≈ 30 mm gave reasonable agreement with the model). Conversely, the 52U and 92U samples had higher fibre length (lf ≈ 40 mm or more) to agree with the model prediction. This difference in approximate fiber length further supports the tendency of the D2U CF to break during the fabrication process due to its high Young’s modulus and relative inflexibility (Table 1 and Table 4). In general, the Halpin-Tsai model results confirmed the breakage of the pitch CF during the 3D printing process, however, it would be challenging to use the Halpin-Tsai model to determine the exact fiber length as there are many factors that are not taken into consideration in the calculations of analytical model such as the existence of the voids and adhesion between the layers and between the CF and the matrix.
Summary of Young’s modulus of 3D-printed continuous carbon-based thermoplastic composites.
Conclusion
A method was developed to additively manufacture pitch-based CF reinforced PLA composites. Unidirectional samples were 3D-printed and characterized to study the effect of different grades and volume fractions of pitch CF on the tensile Young’s modulus of the composites. It was found that the 92U CF reinforced PLA composite with three layers of pitch CF improved the Young’s modulus by 850% compared to pure 3D-printed PLA. Further, all composites showed statistical significance in improvement of the Young’s modulus compared to pure 3D-printed PLA.
The highest stiffness grade of D2U CF made it more likely to break during the fabrication process due to its low flexibility (0.372 [1/kN.m2]) which in turn affected the Young’s modulus of its composites for the three different volume fractions. Halpin-Tsai analytical model showed the highest grade of fiber breakage during the printing process for D2U CF samples with the shortest length of CF (lf ≈30 mm) compared to the other two conditions of 52U CF and 92U CF (lf ≈ 40 mm or more).
To further improve the stiffness of 3D-printed continuous pitch CF composites, future research should focus on two aspects; (1) the surface treatment of the pitch CF prior to the coating process and (2) modification of the printing process to facilitate better sample design freedom and motion control to better mitigate fiber breakage during the printing process (e.g., nozzle articulation using a 6-axis robotic arm).
Pitch CF shows promise as a reinforcement for 3D-printed composites; however there exist challenges of minimizing fiber breakage during the printing process due to its high stiffness compared to the more commonly used PAN CFs. Improvement of the printing process to reduce fiber breakage would improve the suitability of 3D-printed pitch-based CF composites for light-weight applications such as sporting goods, automotive, and aerospace applications. Due to its high electrical and thermal conductivity, it may also be suitable for structural health monitoring or 3D-printed heat transfer applications.
Footnotes
Declaration of conflicting interests
The author(s) declared no potential conflicts of interest with respect to the research, authorship, and/or publication of this article.
Funding
The author(s) disclosed receipt of the following financial support for the research, authorship, and/or publication of this article: This work was supported by the Natural Sciences and Engineering Research Council of Canada (NSERC), RGPIN-2018-05879 and RGPIN-2018-05899.
Data Availability Statement
All data generated or analyzed during this study are included in this published article.