
Abstract
Based on the progress and advances of additive manufacturing technologies, design and production of complex structures became cheaper and therefore rather possible in the recent past. A promising example of such complex structure is a so-called pantographic structure, which can be described as a metamaterial consisting of repeated substructure. In this substructure, two planes, which consist of two arrays of beams being orthogonally aligned to each other, are interconnected by cylinders/pivots. Different inner geometries were taken into account and additively manufactured by means of fused deposition modeling technique using polyethylene terephthalate glycol (PETG) as filament material. To further understand the effect of different manufacturing parameters on the mechanical deformation behavior, three types of specimens have been investigated by means of displacement-controlled extension tests. Different slicing approaches were implemented to eliminate process-related problems. Small and large deformations are investigated separately. Furthermore, 2D digital image correlation was used to calculate strains on the outer surface of the metamaterial. Two finite-element simulations based on linear elastic isotropic model and linear elastic transverse isotropic model have been carried out for small deformations. Standardized extension tests have been performed on 3D-printed PETG according to ISO 527-2. Results obtained from finite-element method have been validated by experimental results of small deformations. These results are in good agreement with linear elastic transverse isotropic model (up to about
Keywords
Introduction
Rapid prototyping enables the manufacturing of extraordinary materials resulting in structures with very complex geometries. Those tailor-made structures, whose special properties such as high stiffness or large deformation depend on the microscopic constituents, 1,2 are known as so-called architectured materials or metamaterials, inter alia. Hence, the mechanical deformation behavior of such a metamaterial is very sensitive to the substructure, not just to the global structure.
A pantographic structure (PS) can be treated as a metamaterial consisting of two orthogonal arrays of beams that are interconnected by pivots/cylinders. 3 –7 An example of a PS made out of polyethylene terephthalate glycol (PETG) is shown in Figure 1. To design such a metamaterial for special applications relevant in the industry sector, predictions of their structural performances are crucial. A possibility to achieve deformation predictions is to make use of the finite-element method (FEM). This involves a very detailed mesh of the whole structure, 8 which results in high computational costs. The reason for these computational costs is the high number of unknowns in a classic numerical simulation, which is based on the Cauchy–Boltzmann continuum. However, higher gradient theories are able to overcome these limits by homogenizing discrete structures toward the equivalent Cauchy continua. 2,9 –12 Thus, PS is a very auspicious example showing this property because it can be modeled by means of higher gradients (e.g. second gradient continuum model 4 ). By formulating the constitutive laws, new and unknown material parameters show up. To determine these newly appeared parameters, experiments have to be performed. 13 –16

The 3D-printed metamaterial made of PETG: Front view of a so-called pantographic structure. PETG: polyethylene terephthalate glycol.
In this research, uniaxial tensile tests were conducted on 3D-printed pantographic metamaterials made out of PETG. Three different variations of pantographics with differently sized substructures are investigated and discussed. Results of extension tests, specifically the stress–strain relations (in the linear elastic region up to about 1.5% strain), will be compared to results obtained from (homogenized) FEM calculations based on the open-source library of FEniCS. 17 Both small and large deformations are recorded and evaluated by means of two-dimensional digital image correlation (DIC). Furthermore, three different slicing procedures have been implemented into the additive manufacturing process. The effect of each slicing approach on the deformation behavior is investigated. Notice that the motivation of this work is not only to perform experimental characterizations but also to enable the evaluation of higher gradient simulation models for the determination of new higher gradient parameters in future investigations.
Materials and methods
Metamaterials with pantographic substructures were 3D printed using fused deposition modeling (FDM) technique at Technische Universität Berlin, Institute of Mechanics, Chair of Stability and Failure of Functionally Optimized Structures. Details of additive manufacturing are introduced in “Manufacturing” section. To determine linear elastic material parameters of PETG, which are used as input for the numerical simulations, uniaxial, standardized extension tests of five tensile specimens have been performed at Technische Universität Berlin, Institute of Material Science and Technology, Department of Polymer Materials Science and Technologies. Furthermore, quasi-static extension tests and 2D DIC measurements applied to six PSs have been performed at Technische Universität Berlin, Institute of Mechanics, Department of Continuum Mechanics and Materials Theories. The schematic of experimental setup including PS is shown in Figure 2. Standardized extension tests performed on standardized tensile specimens and experiments performed on PSs are described in “Experimental setup” section. Linear elastic numerical simulation models are introduced and explained in “Finite-element method” section.

Schematic of displacement-controlled extension test (u = displacement) performed on PS (L = width, l = height, and t = depth) including details of the unit cell (
Manufacturing
PSs, composed out of rectangular beams (with a quadratic cross-section
FDM process parameters and PETG material parameters (given by Material 4 Print GmbH & Co. KG).

Due to different solidification characteristics, temperature profile, and lack of molecular diffusion, the mechanical resistance of interfiber bonding regions against deformation is not as good as the inner one.
18
In samples printed with layer orientations of

Slicing configurations (Cura): Orange fibers represent infill layers, blue fibers represent support-material layers. All samples are printed upright, not crosswise. (a) Slicing strategy A: Layer direction of
Furthermore, due to the significant influence of the microscopic substructure onto the macroscopic deformation behavior, 20 –27 different kinds of PSs with varied inner geometries (to be more precise with different pivot heights h) and differently sized outer dimensions (to be more precise with different sample heights l) but equal material densities were investigated additionally. An overview of sample configurations is given in Table 2.
Overview of dimensions and layer orientations of all six investigated specimens.a

Experimental setup—standardized extension test
To determine mechanical deformation parameters (Young’s modulus and Poisson’s ratio), which will be used for FEM calculations, tensile specimens with 100% infill were manufactured (without support structure) and parameters listed in Table 1. Their geometries were prepared according to ISO-527-2 (see Figure 4 and Table 3).
Specifications of standardized tensile specimens.


Top: Geometry of standardized tensile specimens according to ISO 527-2. All values are given in mm. Bottom: 3D print of a standardized tensile specimen.
Layer orientation is one of the most important process parameters in FDM. The highest tensile properties are generally assumed to be achieved with an orientation of
Five uniaxial, displacement-controlled extension tests were performed on the standardized tensile specimens with a quasi-static velocity of

Initial state of a standardized tensile specimen which is clamped into the Zwick 1446 testing device with an extensometer (left) and a loading cell (top). One mounting side is fixed (bottom) while displacement was imposed vertically through the upper mounting side.
Experimental setup—extension tests applied to pantographic structures
Displacement-controlled quasi-static extension tests have been applied to PSs. Schematic setup and front view of the experimental setup of specimen B1 are shown in Figures 2 and 6, respectively: sample B1 is mounted in the testing device MTS Tytron 250 (MTS Systems Corporation, Eden Prairie, USA). Device-own software Stationsmanager V 3.14 controls and monitors the device-own loading cell (

Setup of displacement-controlled extension test performed on speckled specimen B1. Device-own loading cell is fixed in the left clamping jaw while displacement u is imposed horizontally in the right clamping jaw.
Because of the hydraulic air-film-bearing system, almost friction-less displacement could be achieved. Furthermore, displacement was also measured and evaluated in real time by means of the noninvasive measurement method DIC. This technique is able to calculate displacements and therefore strains on a deformed surface based on recorded pictures taken by a commercial Canon EOS 600D camera (

Picture-sequence taken during deformation of sample B1, validated by 2D DIC (vertical displacement
Finite-element method
Two different material models have been taken into account for the numerical investigations on PSs—an isotropic linear-elastic material model and a transverse-isotropic, linear-elastic material model. Inverse analysis has been carried out to determine the engineering constants of homogenized transverse elastic stiffness matrix as well as to determine the Young’s modulus and Poisson’s ratio for FEM input.
All preprocessing steps, that is, computer-aided design (CAD) preparation, boundary conditions, and triangulation were performed using open-source software Salome 9.3. 29 For a proper CAD preparation of standardized tensile specimens, FDM-printed polymers have been examined by means of a commercial Olympus BX-51 microscope (Olympus Europa SE & Co. KG, Hamburg, Germany), see Figure 8. Based on dimensions of contact lines between fibers and layers, the process parameters in Table 1 have been employed. CAD models of standardized tensile specimens mainly consist of fibers and voids 30 while areas of the interface are assumed to have perfect bonding though.

CAD model of standardized tensile specimen used for inverse analysis of transverse-isotropic, linear-elastic material model. Detail-view shows the cross-section of microstructure of an FDM-printed tensile specimen with a layer height of 0.2 mm. CAD: computer-aided design; FDM: fused deposition modeling.
CAD models of PSs have been prepared without any fiber and void features. CAD model of specimen B1 is shown in Figure 9. However, the effect of microstructural dependencies is applied by material models, which are going to be described in the following.

CAD model of sample B1 by means of open-source software Salome 9.3. 29 Red detail area in the left upper corner shows the transition from mounting toward the inner substructure. CAD: computer-aided design.
All FEM calculations are performed by means of the open-source codes developed by FEniCS project. 17 Suitable meshes are obtained after h-convergence analysis and their results are shown in Figure 10. Horizontal plateau begins at about 750,000 degrees-of-freedom (DoF) for PS (blue line, Figure 10) and 1,750,000 DoF for standardized tensile specimens (red line, Figure 10), respectively. As the CAD data of a standardized tensile specimen contains very fine and detailed microstructural features, a more discretized mesh is needed for the standardized tensile specimen in contrast to the PSs. Black circles in Figure 10 indicate convergence and show the selected DoF used in the simulations. The h-convergence of strain energy 31 is chosen because all computational homogenizations, and thereby, Young’s moduli are obtained from energy calculations.

Convergence tests (exemplary) are shown for the standardized tensile specimen and the pantographic structure A1/A2. Strain energy is plotted over the number of degrees of freedom.
Numerical models are simulated by means of uniaxial tensile tests while Dirichlet boundary conditions are applied to the fixed mounting side and displacement is imposed along the lateral axis in the other mounting side. The gravitational forces have been neglected since the displacement is mainly influenced by surface loading conditions.
Transverse isotropic material model and inverse analysis
Transverse isotropic compliance matrix is given in Voigt’s notation as follows

Six engineering constants, namely, Young’s moduli E
1 and E
2, shear moduli To determine Young’s modulus, E
1, CAD models with To calculate Young’s modulus, E
2, CAD models with To determine the shear modulus,
Determinations of the entire engineering constants result in the setup of the homogenized, transverse-isotropic compliance-matrix in Voigt’s notation (see “Results and discussion” section). Hence, this matrix can be used as input for the FEM simulations applied to PSs. Results of numerical calculations will be discussed and compared with results obtained from real experiments in “Results and discussion” section.
Isotropic material model
Young’s moduli, E
1 and E
2, are determined by means of the aforementioned inverse analysis and computational homogenization procedure, which are described in detail in “Transverse isotropic material model and inverse analysis” section. Therefore, Young’s moduli can also be interpreted as
PETG’s material parameters Young’s modulus E and Poisson’s ratio

To compare results of isotropic, linear-elastic numerical simulation with experimental results gained by means of an inverse analysis, parameters, Eg
(Young’s modulus) and

where the Young’s modulus, E, which serves as a linear proportional factor between stress

with

Results and discussion
Results of extension tests performed on standardized tensile specimens and PSs are discussed separately. Furthermore, large and small deformations of PSs are debated. Finally, FEM simulations and small deformation results are compared.
Standardized extension test
Uniaxial, standardized extension tests were carried out to determine material parameters and to validate results obtained from the aforementioned computational homogenization. Engineering stress–strain relations of 3D-printed standardized tensile specimen are shown in Figure 11. Young’s moduli obtained from experiments and FEM are listed in Table 5.

Comparison of Young’s moduli of standardized tensile specimen obtained from real experiments and numerical simulations.

The values of Young’s modulus obtained from experiments and FEM differ less than 2.33%. These results present a proper accuracy and allow to trust the validated results of the inverse analysis based on FEM.
Extension tests applied to pantographic structures
Quasi-static, displacement-controlled extension tests were performed on all metamaterial samples. Displacement recorded by the device-own machine-code unit differs less than
Large deformations
Deformation behavior of all samples gained in axial extension tests is shown in Figure 12. All specimens show nonlinear deformation behavior. They are able to deform at least

Stress–strain diagram of all six tested pantographs.
Samples C1 and C2 show the highest elongation up to ultimate rupture (

Microstructure of specimen C1 (top) printed with slicing strategy C (

Schematics of deposited layers generated by means of different slicing strategies and possible manufacturing failures.
Samples A1 and A2 show much stiffer/brittle deformation behavior than samples B1, B2, C1, and C2. Because of smaller cylinder height (
These observations indicate that samples A1 and A2 are able to carry higher loads before breakage. From mechanical point of view, the resistance against torsion and bending of cylinders as well as the resistance against shear stresses in axial pivot/cylinder-layer direction result in a overall stiffer deformation behavior. In contrast, shearing stresses in the pivots of samples B1 and B2 with layer orientation of
Small deformations
Figure 15 shows small deformation behavior of all six samples by means of stress–strain diagram. Interestingly, specimens B1 and B2 as well as specimens C1 and C2 show the same (almost linear) elastic deformation behavior with respect to each other. Samples A1 and A2 differ a lot from each other and show nonlinearity, especially, sample A2 follows a nonlinear inelastic regime. Due to the larger pivot heights (
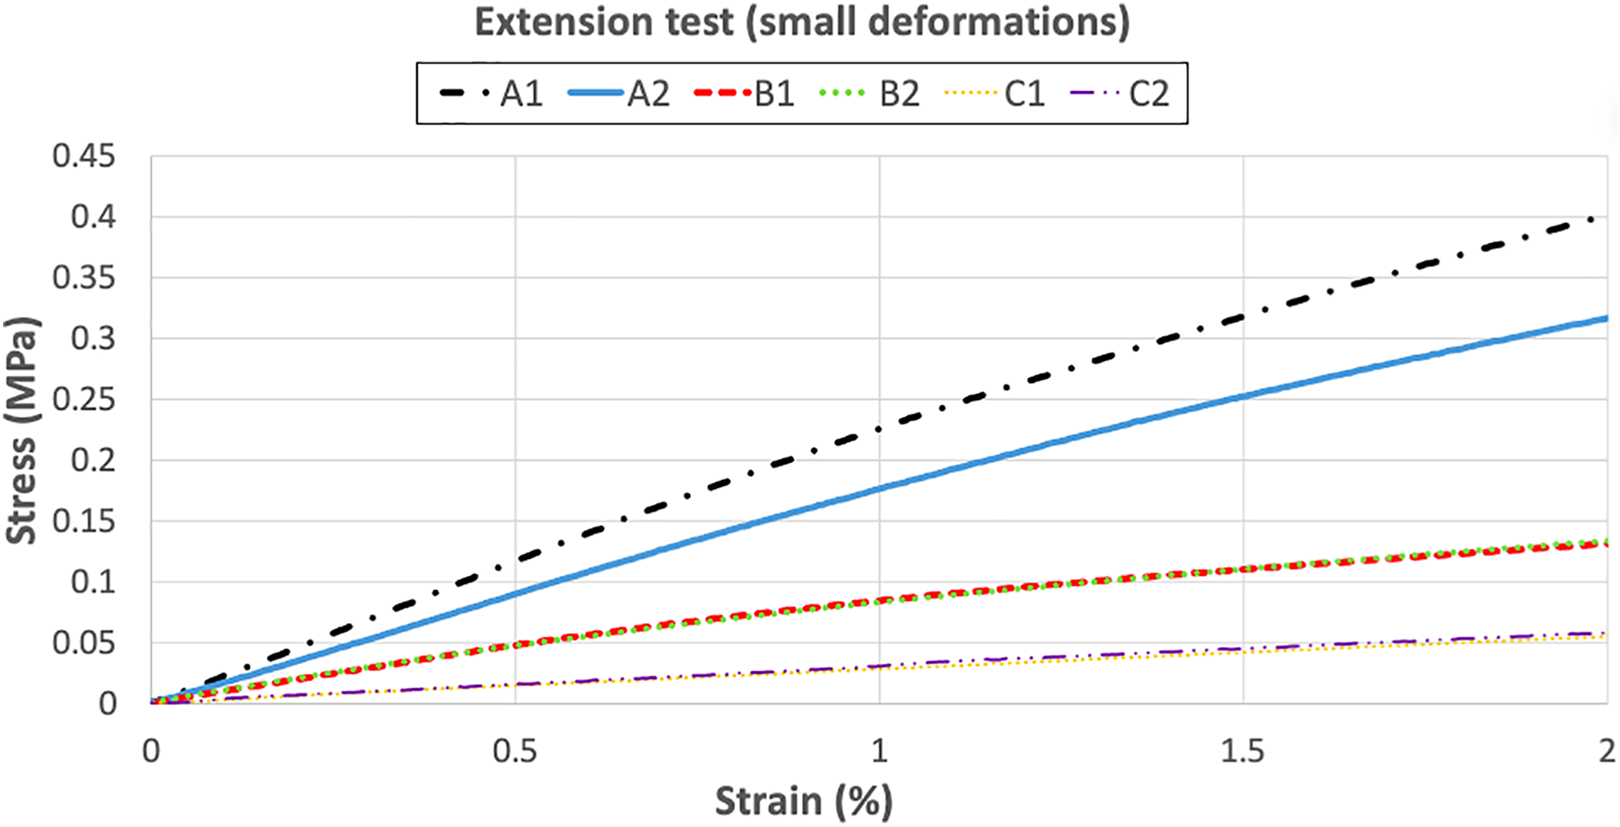
Stress–strain diagram of all investigated specimens A1, A2, B1, B2, C1, and C2 for small deformations.
Experiments versus finite-element method
The engineering constants are determined by an inverse analysis while tensile CAD models were prepared by means of microscope images, giving us important knowledge about the arrangements of microstructural features such as fibers and voids (e.g. see detail-view in Figure 8). Hence, material models include important microstructural characteristics of FDM polymers and have been prepared in accordance to recommendations of the literature. 18,30 For the configuration listed in Table 1, the transverse isotropic stiffness matrix in Voigt’s notation reads

This stiffness matrix is used as input for the linear-elastic, transverse isotropic numerical simulation of PS. Young’s moduli, E 1 and E 2, calculated by inverse analysis are also used as input parameters in the linear-elastic, isotropic simulation of PS and are given in Table 6.
Established material/engineering parameters of the linear-elastic, isotropic model: Young’s moduli

The calculated deformation profile based on specimen B1 is given at the top of Figure 16 and is compared with 2D DIC evaluation for an axial elongation of

Transverse isotropic FEA simulation of specimen B1 validated by 2D DIC: comparison of vertical displacements of results gained from the experiment by means of DIC (b) with numerical results calculated by means of FEniCS simulation
17
(a) of sample B1 at about
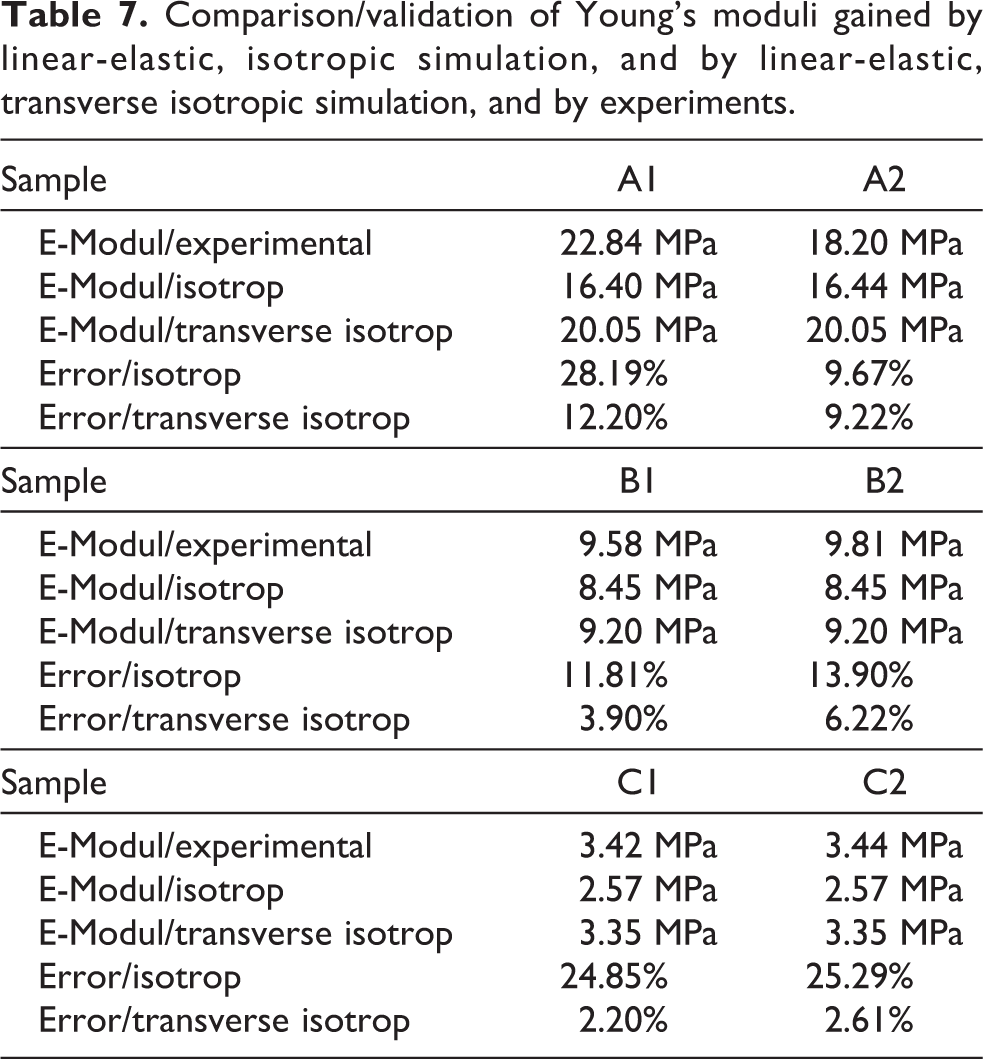
Young’s moduli gained from experimental characterizations and Young’s moduli obtained from FEM simulations are compared in Table 7. Obviously, values of the transverse isotropic model fit the experimentally measured parameters in a much better way in contrast to the isotropic material model.
Comparison/validation of Young’s moduli gained by linear-elastic, isotropic simulation, and by linear-elastic, transverse isotropic simulation, and by experiments.
Furthermore, results of transverse isotropic FEM simulations are compared with results obtained from extension tests by means of stress–strain curves in Figure 17. We state that transverse isotropic model is sufficient enough to capture the deformation behavior of pantographic metamaterials for axial elongations up to about

Comparison of stress–strain relations obtained from extension tests performed on specimens A1, B1, and C2 and FEM calculations (transverse isotropic linear-elastic FEM simulation by means of FEniCS 17 ). Computationally homogenized transverse isotropic stiffness matrix in Voigt’s notation has been used as FEM-input parameter. FEM: finite-element method.
All microstructural features (such as fibers, voids, and their interfaces) were modeled homogeneously. But this homogeneity does not exist in the real manufactured specimens. Due to manufacturing circumstances in FDM printing, heterogeneous inner structures occur. Temperature differences between solidified fibers and deposited melt cause heterogeneous interfaces, which were not taken into account in FEM simulations. This could also explain the arithmetic difference of about 6% between transverse isotropic FEM and experimental results.
Conclusion
Three types of pantographic metamaterials consisting of different substructures were additively manufactured (namely, FDM) using three different slicing strategies. PETG was used as filament material. Young’s modulus of 3D-printed PETG was determined as
In general, 3D-printed metamaterials with a pantographic substructure show much higher strains (
Footnotes
Acknowledgment
We acknowledge support by the German Research Foundation and the Open Access Publication Fund of TU Berlin.
Author contributions
The authors AÖ and GG contributed equally to this work.
Declaration of conflicting interests
The author(s) declared no potential conflicts of interest with respect to the research, authorship, and/or publication of this article.
Funding
The author(s) received no financial support for the research, authorship, and/or publication of this article.