
Abstract
Herein, the effects of recycled polymers on the mechanical properties of additively manufactured specimens, specifically those derived by fused deposition modelling, are determined. The intention is to investigate how 3D-printing can be more sustainable and how recycled polymers compare against conventional ones. Initially, sustainability is discussed in general and more sustainable materials such as recycled filaments and biodegradable filaments are introduced. Subsequently, a comparison of the recycled filament recycled Polyethylene terephthalate (rePET) and a conventional Polyethylene terephthalate with glycol (PETG) filament is drawn upon their mechanical performance under tension, and the geometry and slicing strategy for the 3D-printed specimens is discussed. Finally, the outcomes from the experiments are compared against numerically determined results and conclusions are drawn.
Introduction
This research was conducted to reveal a new perspective on sustainable materials in 3D-printing technology which offers plenty of new opportunities for sustainable and efficient production of architectured materials. Additive manufacturing (AM) enables the design of highly complex or even hybrid parts by customized mass production 1 using less material to save weight. Thus, with the rise of AM technologies, the design of slender, tailored materials has experienced a major boost. Owing to the precise deposition of printable material(s) with microscale accuracy in three dimensions, a desired structure can now easily be built. 2 Additionally, it requires less production processes, thus saving resources. Yet, nowadays the main material for fused deposition modelling (FDM) 3D-printing are thermoplastics, which subsequently increases the overall use of plastic. 3 The commonly known dilemma with plastics is their negative impact on the environment and humans. Thus, the increase in sustainable production steadily becomes more essential, especially in nowadays’ dense population and higher living standards as a result of worldwide industrialization. 4 In contrast to these demands are finite resources and inefficient use of products because of ‘throwaway mentality’. The impact of climate change and increased environmental awareness additionally call for innovations to be more sustainable. Although the main concerns are climate and environment-related topics, further aspects like mechanical properties, price and availability are key parameters for the market entry of sustainable materials. 5 To date, many of those parameters, for example, mechanical properties in 3D-printed sustainable materials, are not fully investigated. That leads to insecurity of potential customers. Thus, the objective of this article is to introduce different sustainable materials. To illustrate potential comparative studies, tensile tests are furthermore conducted on specimens made from a conventional polymer material and a recycled polymer material. Specifically, a 100% recycled PET (rePET) filament is compared to a conventional PETG filament. This comparison is chosen since PETG is commonly considered the superior polymer for 3D-printing thus allowing for assertions about the application potential of the recycled filament. A study comparing commercially available virgin and recycled versions of the same polymer filaments would be superfluous since the mechanical properties are virtually identical. 6,7
Printing parameters and test results are discussed to develop a better understanding of the theoretical and practical aspects of the specimens’ physical characteristics. The specimens’ linear elastic tensile moduli are compared to make recommendations for the safe application in engineering design. Additionally, their non-linear tensile behaviour is discussed. Furthermore, a finite element study is conducted yielding an excellent comparison of the linear elastic behaviour.
Sustainability
Basic definitions
The term sustainability was famously defined as ‘Development that meets the needs of the present without compromising the ability of future generations to meet their own needs’ by the Brundtland Commission. 8 Although sustainability is commonly understood as environmentalism, the modern definition of the term exceeds the dimension of environment by two further pillars: society and economy. A common illustration of the modern understanding of sustainability is the three pillars of sustainability.

The three pillars of sustainability. Source: Adopted from von Keyserlingk et al. 9
However, there are many more approaches to define sustainability, but the Triad-Approach by the Brundtland Commission is the most widely accepted, which is shown in Figure 1. Economic sustainability describes the optimization of the economic return while maintaining the required input resources leading to non-declining welfare. 10 In this context, resources are defined as the goods, merchandise, capital or services available at a given time. ‘Social sustainability refers to a society’s ability to maintain, on the one hand, the necessary means of wealth-creation to reproduce itself and, on the other, a shared sense of social purpose to foster social integration and cohesion’. 10 Ecological sustainability describes the far-sighted and considerate use of natural resources. Maintaining the health status of ecosystems is achieved by consuming less natural resources than are regenerated. Disregard of ecological sustainability can lead to unrecoverable damage to the environment, which can result in drastic influences of the life of future generations. 11
Sustainability in 3D-printing
The 3D-printing technology used in this study is FDM/fused filament fabrication (FFF). The raw materials for this technology are thermoplastic polymers in form of spooled up wires called filaments.
12
This filament is heated to the melting point and then applied by a robotically moved nozzle to form structures layer by layer. These polymers are often made of mineral oil, a non-regenerating, fossil substance. This material use leads to severe issues when it comes to ecological sustainability.
13
As the ecological interpretation of the term sustainability is clearly the most affected, the aim of this study is to investigate on improvements in ecological direction. Sustainability on FDM/FFM 3D-printing filaments can be increased through various strategies. Nevertheless, we have identified three main strategies, through which an increase in ecological sustainability can be accomplished: recycling, compostable and biobased.
‘Recycling is the processing of used items to obtain materials that can be used to make new products’. 14 Recycled and reprocessed polymers can also be used for 3D-printing filaments. 15 This saves fossil resources, therefore it is one way to achieve a more sustainable product. Examples for the use of recycled polymers in AM can be found in the literature. 16,17 Another strategy to improve polymers towards ecological sustainability is the use of bioplastics as raw material. Bioplastics can either be biobased or they can be biodegradable as is shown in Figure 2. Also the combination of both characteristics is possible. Biobased bioplastics are more sustainable as they use renewable resources instead of mineral oil. Biodegradable plastics are more sustainable as they degrade quickly under normal environmental conditions, when disposed improperly, so they do not contribute to the problematic of microplastics. 19 One often mentioned criticism about the environmental effects of biodegradable bioplastics is the emission of greenhouse gases such as methane during the composting process and the waste of energy in comparison to thermal utilization in waste combustion. 20

Dimensions of bioplastics. Source: Adopted from Pakkanen et al. 18
As recycled 3D-printing filaments are already available and seem to be a proper improvement on sustainability in comparison to regular, mineral oil-based filaments, a recycled product was chosen as subject of this study.
Materials and methodology
Additive manufacture of the test specimens
PET and PETG are commonly used materials of which two specific filaments were selected for printing and are summarized in Table 1.
Polymer filaments used for the test specimens.

To obtain valid experimental results, the aimed for behaviour is a constant strain in the centre area of the specimen in a tensile test. Such a strain distribution is commonly realized using a ‘dogbone’ form for the specimen. Hence, the geometry and slicing strategy for printing was developed accordingly based on previous studies. 21 For the proper geometry, larger curvatures and softer edge transitions are applied, which reduced the localized stress concentrations on the edges and avoids failure at those edges. 22,23
Another key factor altering the mechanical characteristics – such as the tensile strength or failure behaviour – is the orientation of the printing lines namely the slicing strategy. 24 To optimize the standard slicing strategy, all printing lines of the specimens were oriented in the tensile direction where possible. This was equally realized in all layers. Owing to weak adhesion among different printing lines, the printed material is anisotropic. Since there is not yet a specific norm for specimens for tensile testing 3D-printed materials, only for injection moulded materials and composites, a customized geometry was developed. This geometry is based on ISO 527-1, 25 which is for tensile tests of plastics in general and plastic composites and ISO 3167, 26 related to multipurpose test specimens for injection moulded plastics. A close-up of the customized specimens is shown in Figure 3.

Technical drawing of the tensile test specimen (all dimensions are in mm).
A total number of 10 specimens (5 rePET and 5 PETG) were printed in 12 layers with geometrical dimensions shown in Figure 4. The printer used was the Ultimaker 3 Extended (Utrecht, Netherlands) FDM printer with the settings summarized in Table 2.
Printing settings of FDM printer used for this study.

FDM: fused deposition modelling.

Close-up view of the printed PET specimens showing the layer orientation.
Experimental set-up
Uniaxial tensile tests were undertaken on the previously developed and printed specimens made of rePET and PETG. The force and corresponding displacement was measured upon tilt mounting the ends of the specimens horizontally into a micro-force testing device (MTS Tytron 250; MTS Systems Corporation, Eden Prairie, Minnesota, USA), see Figure 5. Displacement controlled experiments were conducted with a ramp speed of
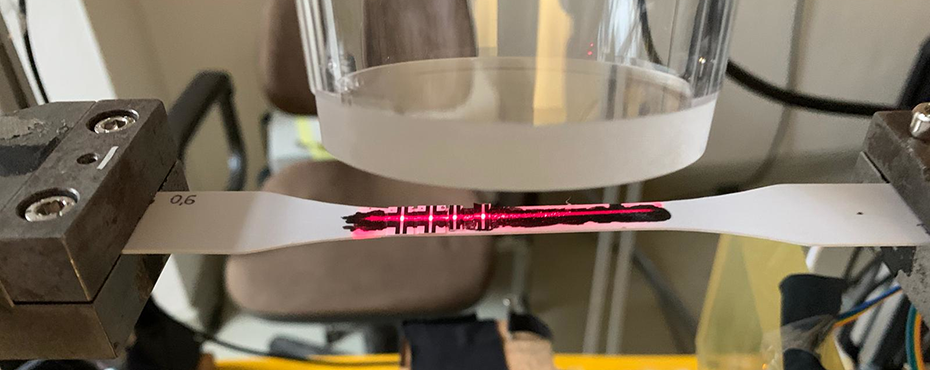
Experimental test rig.
Numerical model
For validation of Young’s modulus obtained by the inverse analysis, we utilize a direct solution procedure as in Abali 27 based on the finite element method (FEM). This procedure is implemented using open-source packages developed under the FEniCS project. 28 This framework has been verified using closed-form solutions in Abali et al. 29,30 and also used in polymer materials manufactured using a similar 3D-printer. 31
Since only the linear elastic range is relevant for the determination of the tensile modulus, the material properties are modelled using the isotropic homogeneous Hooke’s law defined by Young’s modulus, Poisson ratio and the linearized strain tensor. These assumptions are valid for geometries of a characteristic length one order in magnitude higher than the filament thickness and for small deformations all of which is adequate in the present case.
The numerical procedure can be subsumed in the following steps: First, one-eighth of the specimen’s geometry is discretized in space using a 3D tetrahedral mesh obtained by the NetGen meshing algorithm as shown in Figure 6. This mesh is used in FEniCS to build tetrahedral finite elements with linear shape functions for the displacement. The partial differential equation to be solved, that is, the balance of linear momentum complemented by Hooke’s law, is converted into a linear weak form. Combined with appropriate boundary conditions, that is, prescribed tensile displacement in axial direction on one end, prescribed zero displacements where the specimen is clamped (cf. Figure 6) and symmetry conditions on the other boundaries, the resulting system is directly assembled and solved in FEniCS.
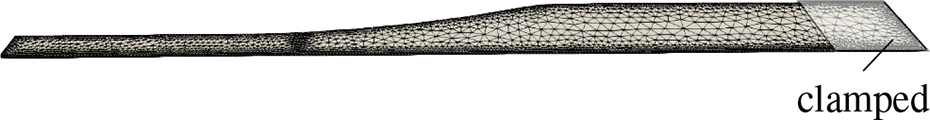
Mesh used in the finite element simulation exploiting the symmetry of the specimen. The highlighted area has all degrees of freedom fixed to emulate the clamps in the experiment.
Results and discussion
In the following subsections, the behaviour of the specimens under tension will be presented and discussed. Since the materials exhibited a fundamentally different behaviour in the non-linear range (cf. Figure 7), the discussion is split into two parts – linear elastic and non-linear behaviour.

Tensile force versus displacement diagram of the tensile tests. The arithmetic mean is depicted by the solid and dashed lines, while shaded areas are 95% confidence intervals.
Linear elastic behaviour
The overall tensile behaviour of all specimens is depicted in the force–displacement plot in Figure 7 where black lines (solid and dashed) represent the arithmetic mean of the force and shaded areas the 95% confidence intervals. By visual inspection, it is noticeable that the repeatability of the results is very high in the linear elastic range which is the main interest in engineering design. Thus, this section focuses on the determination of the tensile modulus stemming from the respective data. To determine this linear elastic material property, the stress–strain equivalents are required. This is because according to the literature,
25
the slope of the stress–strain curve between 0.05% and 0.25% is to be used to determine the tensile modulus. From the experiments, the uniform nominal strain
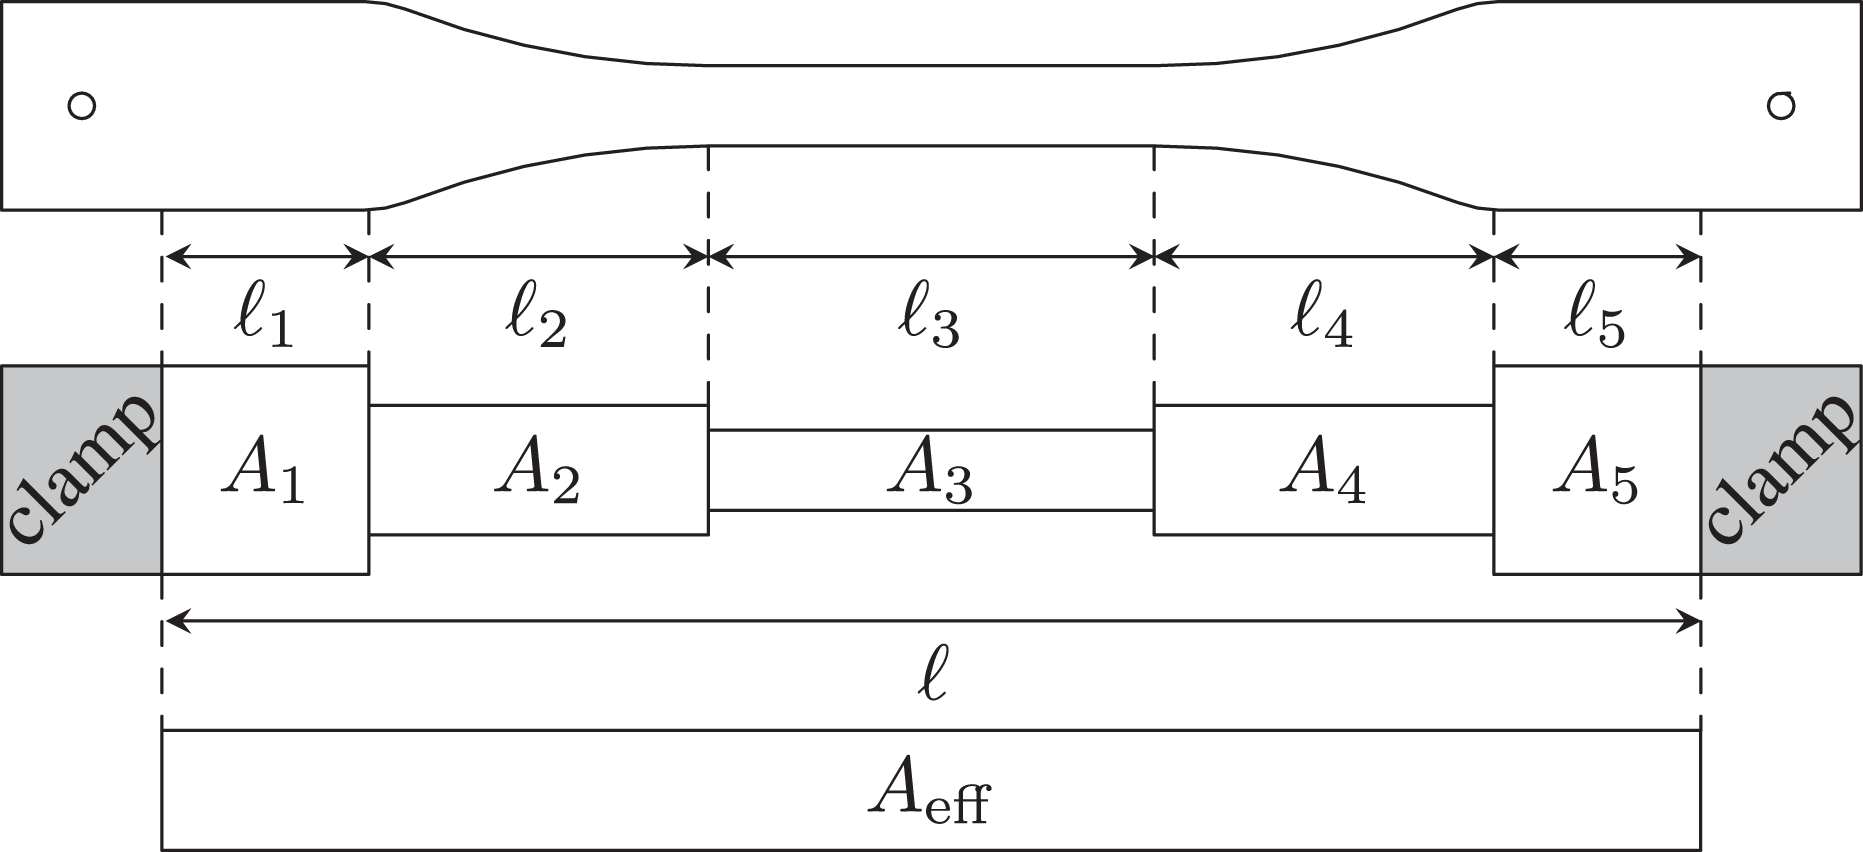
Approximation of the specimen’s geometry through segments of constant cross sections Ai to determine an effective cross-sectional area
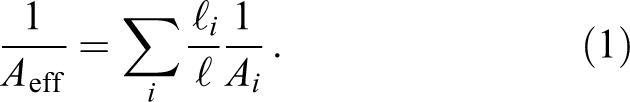
The derivation of the effective area is based on the principle of determining an equivalent stiffness of several Hookean springs in series. Therefore, the specimen is split into five segments that are chosen based on significant changes of the overall geometry, see Figure 8, and the effective area is derived as follows
With the aid of the
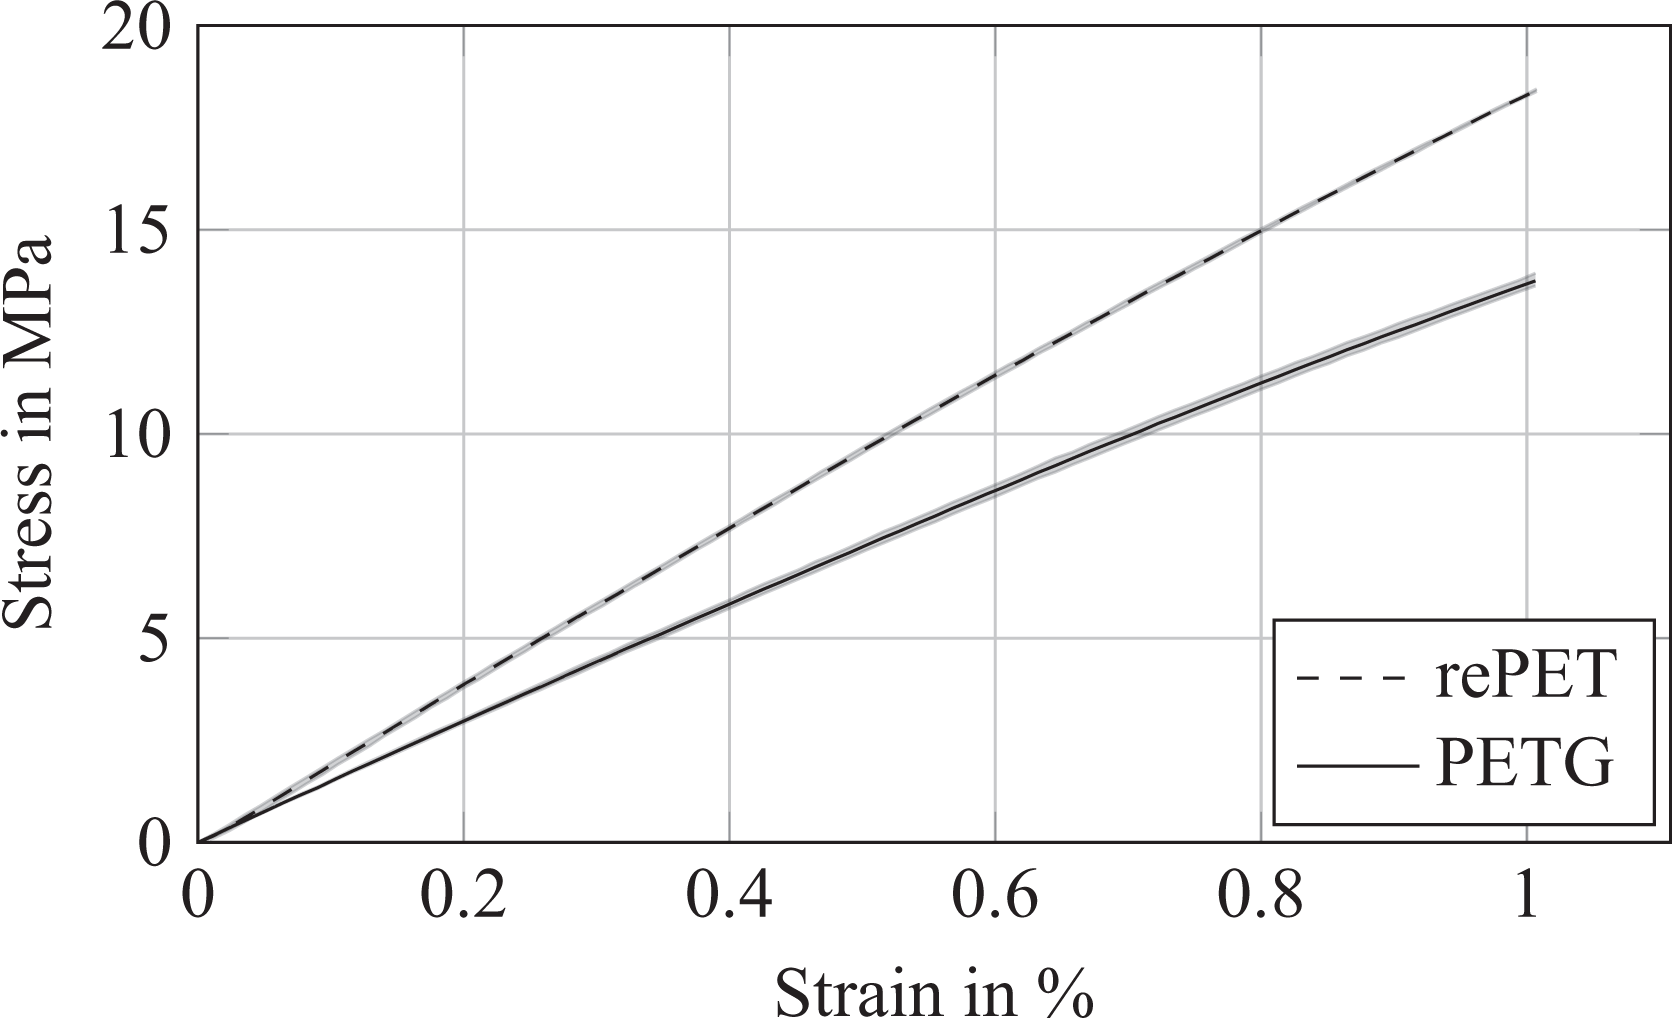
Effective stress over nominal strain in the linear elastic range as determined from the experimental force–displacement data. The mean value is depicted by the solid and dashed lines, while shaded areas are 95% confidence intervals.
From these data, the tensile modulus is derived and compiled in Table 3.
Tensile modulus from experimental data.

rePET: recycled PET.
When comparing the mean value of rePET from the above table with that from the manufacturer (see Table 1) around 15.3% discrepancy can be noted. It can be assumed that the manufacturer data are based on tensile tests of mould specimens out of the same material justifying this discrepancy.
The mean tensile modulus for PETG can, however, not be directly compared to manufacturer’s data since only the flexural modulus is available. Recent experiments 21 undertaken with the same filament revealed a tensile modulus of 1737 MPa also yielding around 15% difference. Generally, it can be noticed that the recycled material performs better in the linear elastic range and a safety factor of at least 0.8 is recommended in engineering design. The experimentally achieved mean tensile modulus from Table 3 is subsequently used in the aforementioned, complementary numerical model. The results of the quantitative comparison are visualized in Figure 10.

Force–displacement diagram comparing experimental results to the results from the FEM simulation in the linear elastic range using the mean tensile modulus. FEM: finite element method.
As obvious, an excellent agreement of the numerical model with the experimental data can be achieved. This confirms that the chosen strategy for determining the effective area is feasible and suggested for further use in experimental procedures in 3D-printed materials’ response.
Non-linear tensile behaviour
In this subsection, the non-linear tensile behaviour of the specimens and their completely different response is being addressed. Since the materials behaved very differently, non-linear behaviour is to be prevented for their safe application and the filaments are only to be used for structures assessed with engineering design principles.
The five samples made of PETG in Figure 11 showed significant plastic deformation during the tensile test. After the ultimate tensile strength (UTS) was reached, necking occurred in the gauge section, which can be explicitly observed and the bodies continued to elongate without breaking until the testing machine reached its programmed maximum testing time of 20 s. The entire deformation occurred in the gauge section of the specimens.
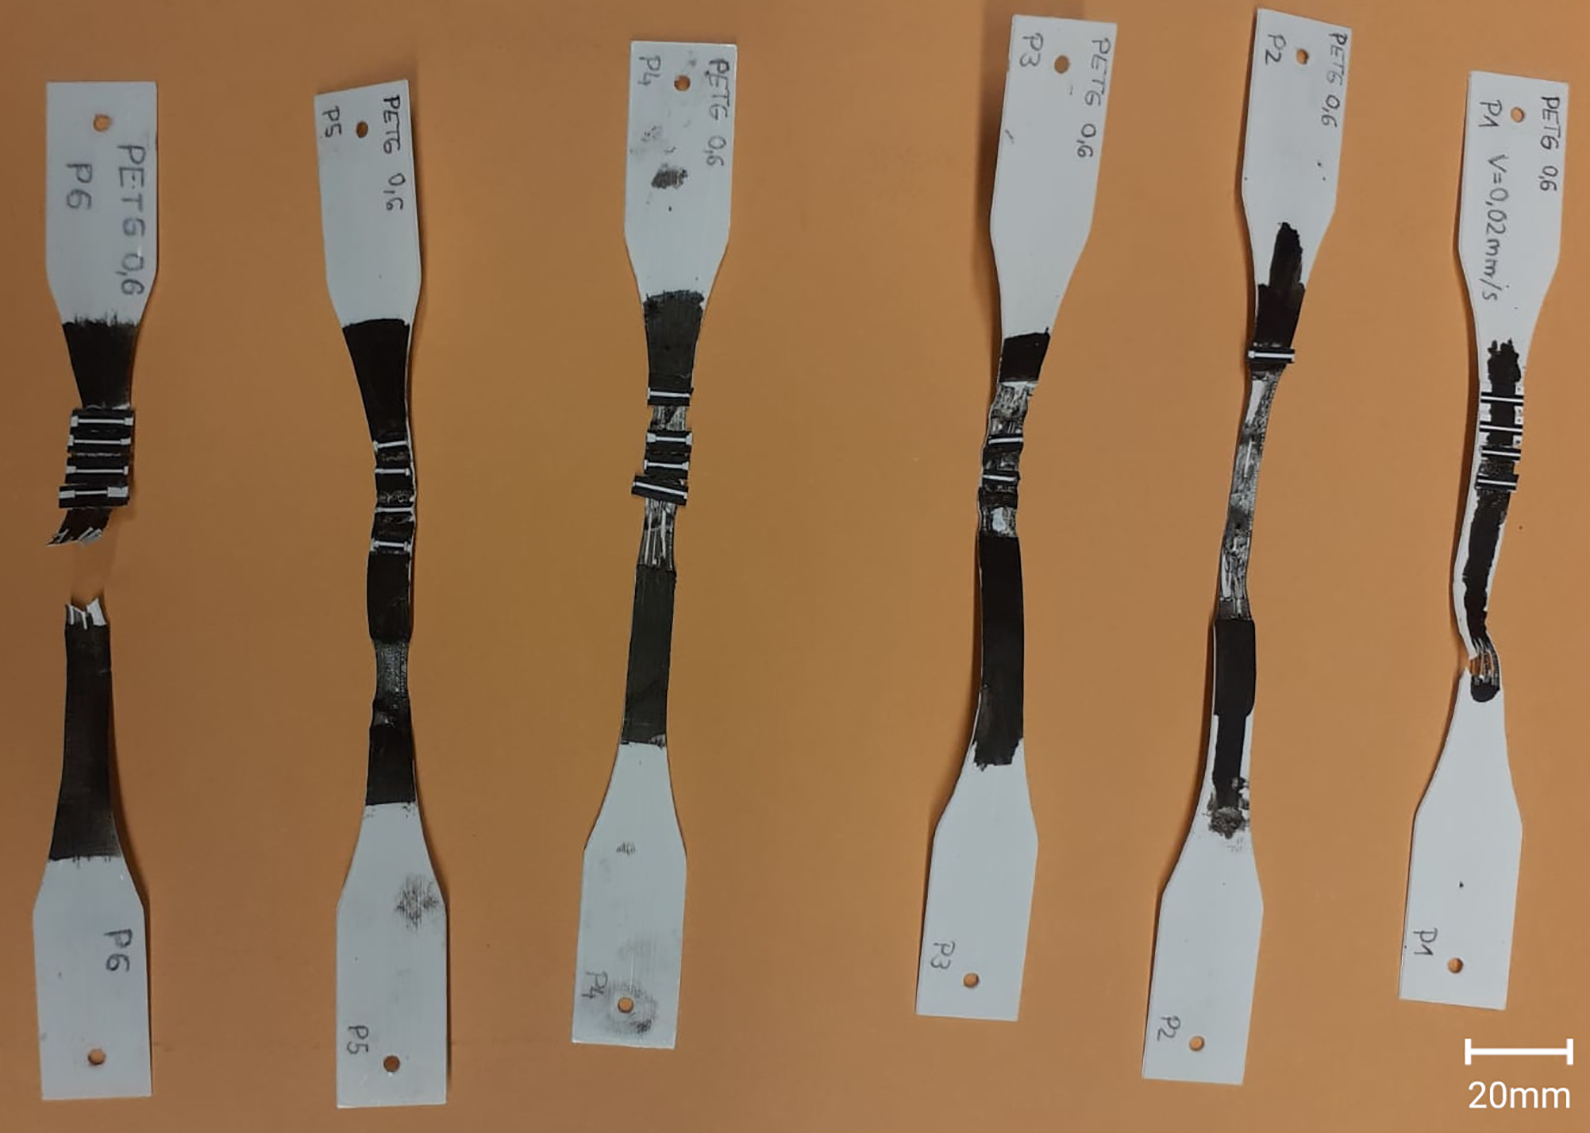
Inspection of the PETG specimens upon the uniaxial tensile tests.
The five samples made of rePET in Figure 12 showed brittle failure with almost no visible stretching or necking before fracture. It is clearly visible that they all failed in the gauge section as expected. Since the samples remained in the elastic region before failure, the deformation during the tensile test was temporary and has recovered after the stress is removed. After failure, the specimens returned to their original lengths. No plastic deformation was observed.

Inspection of the recycled PET specimens upon the uniaxial tensile tests. Note: During the tensile test the centre part of specimen 1 got lost, hence the size of specimen 1 in this picture is smaller than the others.
At the end of the tests, the data summarized in Table 4 were obtained. For each specimen, the acquired values for UTS, plastic deformation, failure and elongation at break are shown. The elongation at break is noted with the time at break (tb). In case the specimen did not break, the test was stopped manually after a specific time (ts) and the maximum elongation at that point was noted.
Characteristics and deformation behaviour of the specimens.
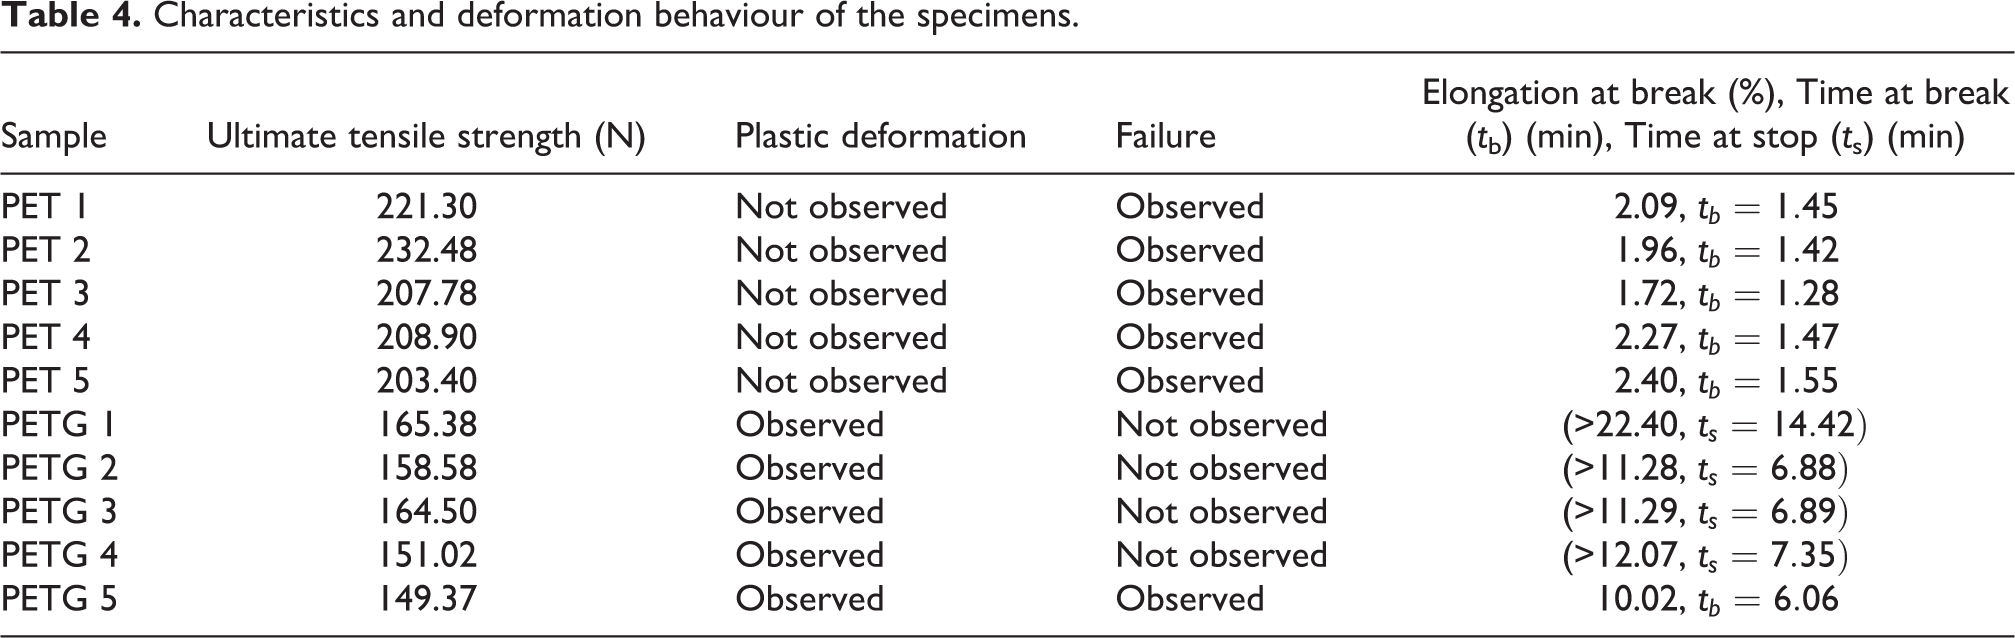
The UTSs of the PET specimens were significantly higher in comparison to the specimens made of PETG. PET specimens mostly passed the mark of 200 N, whereas the PETG specimens only reached about 160 N in UTS. However, all PET specimens failed at a displacement of about 3 mm, whereas the PETG specimens showed a high ductility and did not break at a displacement of 10 mm. Moreover, the PETG specimens maintained a nearly constant force of about 130 N over a large range of elongation.
Conclusions
Investigations on the potential of using rePET filaments compared to conventional PETG for AM of architectured materials are presented. Initially, sustainability is discussed in general. Subsequently, the manufacturing strategy is presented, followed by the experimental set-up and the numerical model. The tensile experiments revealed little variations in the linear elastic range, while the non-linear behaviour was fundamentally different. In the non-linear range, PETG showed a very high ductility, whereas rePET showed a brittle failure behaviour. It is therefore suggested to use the material for engineering design only and avoid non-linear behaviour. Hence, a procedure was suggested to determine the tensile modulus stemming from the experimental data with a stress over an effective area corresponding to the constant nominal strain. The obtained tensile moduli underestimate the data provided by the manufacturers and a knock-down safety factor is proposed. It is further observed that rePET outperforms the conventional PETG and is subsequently to be preferred in engineering design, particularly when environmental considerations are furthermore taken into account.
Footnotes
Acknowledgements
The authors gratefully acknowledge sponsorship of the filament ONEPET by Filamentive (Bradford, UK).
Declaration of conflicting interests
The author(s) declared no potential conflicts of interest with respect to the research, authorship, and/or publication of this article.
Funding
The author(s) disclosed receipt of the following financial support for the research, authorship, and/or publication of this article: We acknowledge support by the Open Access Publication Fund of TU Berlin.