
Abstract
Background
The COVID-19 pandemic highlighted plasma as a strategic resource with continually increasing demand. Demographic data for plasma donors are limited compared with blood donors. Increased information regarding pre-pandemic donor demographics may serve as a baseline for evaluation of post-pandemic practices.
OBJECTIVES
This study asked the question, “What were the demographics of source plasma donors in the US compared to the general population and how did these change over a five-year period preceding the pandemic?”
STUDY DESIGN
Donor demographic data were retrospectively analyzed for the years 2014, 2016 and 2018 from a network of US plasma centers.
METHODS
Routine demographic data obtained prior to source plasma collection from all plasma donors at Grifols US centers were retrospectively analyzed. Donor screening and eligibility requirements were standardized across all donor sites and met all donor eligibility requirements (Code of Federal Regulations: 21 CFR part 600). During each calendar year, only data from the first donation in that year were included with each cohort year.
RESULTS
This study included 1,303,049 unique donors. Donors were predominantly young adult males, although females increased from 37.4% to 41.6%. Caucasians constituted the highest proportion, followed by African American and Hispanic donors. Demographics were generally stable, but the 2018 cohort and the US population exhibited significantly different age, race/ethnicity, and sex profiles. Of 2014 donors, 9.0% returned in all three years studied (2014-2016-2018), with a higher return rate of 16.0% observed for donors returning in just two of the years (2014-2016). Multiyear donors were predominantly male and African American.
CONCLUSION
US plasma donor demographics over a five-year period (2014-2018) showed generally consistent characteristics but differed from the general US population. Multiyear donors were demographically distinct from single-year donors. These data serve as a snapshot of the US source plasma donor base prior to the COVID-19 pandemic.
Keywords
Introduction
The plasma collection and distribution challenges created by the COVID-19 pandemic have helped to emphasize that human plasma is a strategic resource, just like petroleum. 1 In the United States (US), source plasma is collected from healthy, compensated donors through plasmapheresis. It is used exclusively for further manufacturing into products for medical use (rather than being transfused in the hospital). These plasma-derived medicinal products (PDMPs), such as intravenous immunoglobulin (IVIG), albumin, and coagulation factor concentrates, play an important role in the treatment of many diseases, and are classified as essential medicines by the World Health Organization (WHO). 2
Evidence-based patient blood management has contributed to a continuous decline in red blood cell collection and transfusion since 2008. 3 However, the worldwide demand for source plasma continues to grow steadily (from 19 million liters in 2002 to 55 million liters in 2018) due to a number of factors (Figure 1). These factors include 1) introduction of novel PDMPs (such as hyperimmune antibody preparations developed during the COVID-19 pandemic) 4 ; 2) expanding clinical indications for current products (particularly IVIG), 5 and 3) opening of new markets, as lower- and middle-income countries increase their use of PDMPs in patient care. 5

Most of the world's source plasma comes from the US. 6 While excess plasma recovered by community blood donation centers can be used for PDMP manufacturing, this provides less than 10% of the total US supply 6 and only a small fraction worldwide (Figure 1). Much has been published about blood center recruitment strategies and donor demographics for hospital blood needs,7–10 but comparatively little is available regarding the recruitment and demographics of source plasma donors.11–15 PDMP availability is dependent on a consistent and reliable supply of plasma, making it important to understand plasma donor demographic characteristics for use in developing recruitment and retention plans.
In 2018 the WHO reported that 90 countries imported all of their PDMPs. 16 There is an urgent need for countries outside of the US to attempt to increase their own source plasma production.5,17 In addition, US plasma manufacturers must recover from the dramatic challenges of the COVID-19 pandemic. We believe that increased information regarding pre-pandemic donor demographics would help to serve as a baseline for evaluation of post-pandemic practices. A robust longitudinal baseline was established for the large group of donors collected in Grifols-affiliated US plasma centers over a five-year period prior to the pandemic. We asked the question, “What were the demographic characteristics of source plasma donors in the US compared to the US population and how did these change over a five-year period preceding the pandemic?”
Materials and Methods
Source plasma collection
In the US, the blood collection and source plasma collection industries have bifurcated into parallel systems that differ significantly. For instance, source plasma donors are compensated for their expenses and inconvenience related to donation, while blood center donors are not. The quality assurance and safety systems also differ. The evolution of the US plasma donor system, along with current collection, testing, and compensation practices, has been recently reviewed.5,6
Study design
This is a retrospective review of donor demographic data routinely obtained prior to source plasma collection. Data from the 2014, 2016, and 2018 cohort years were studied to 1) establish a baseline for demographic characteristics of the donor population, 2) compare these to the US general population demographics, 3) to evaluate the overall demographic stability of the donor pool over time, and 4) to assess the demographic characteristics of multiyear donors. Due to the retrospective nature of the analysis and the very large number of donors involved, no additional donor data such as socioeconomic status, education, or reasons for donating were collected.
Study population
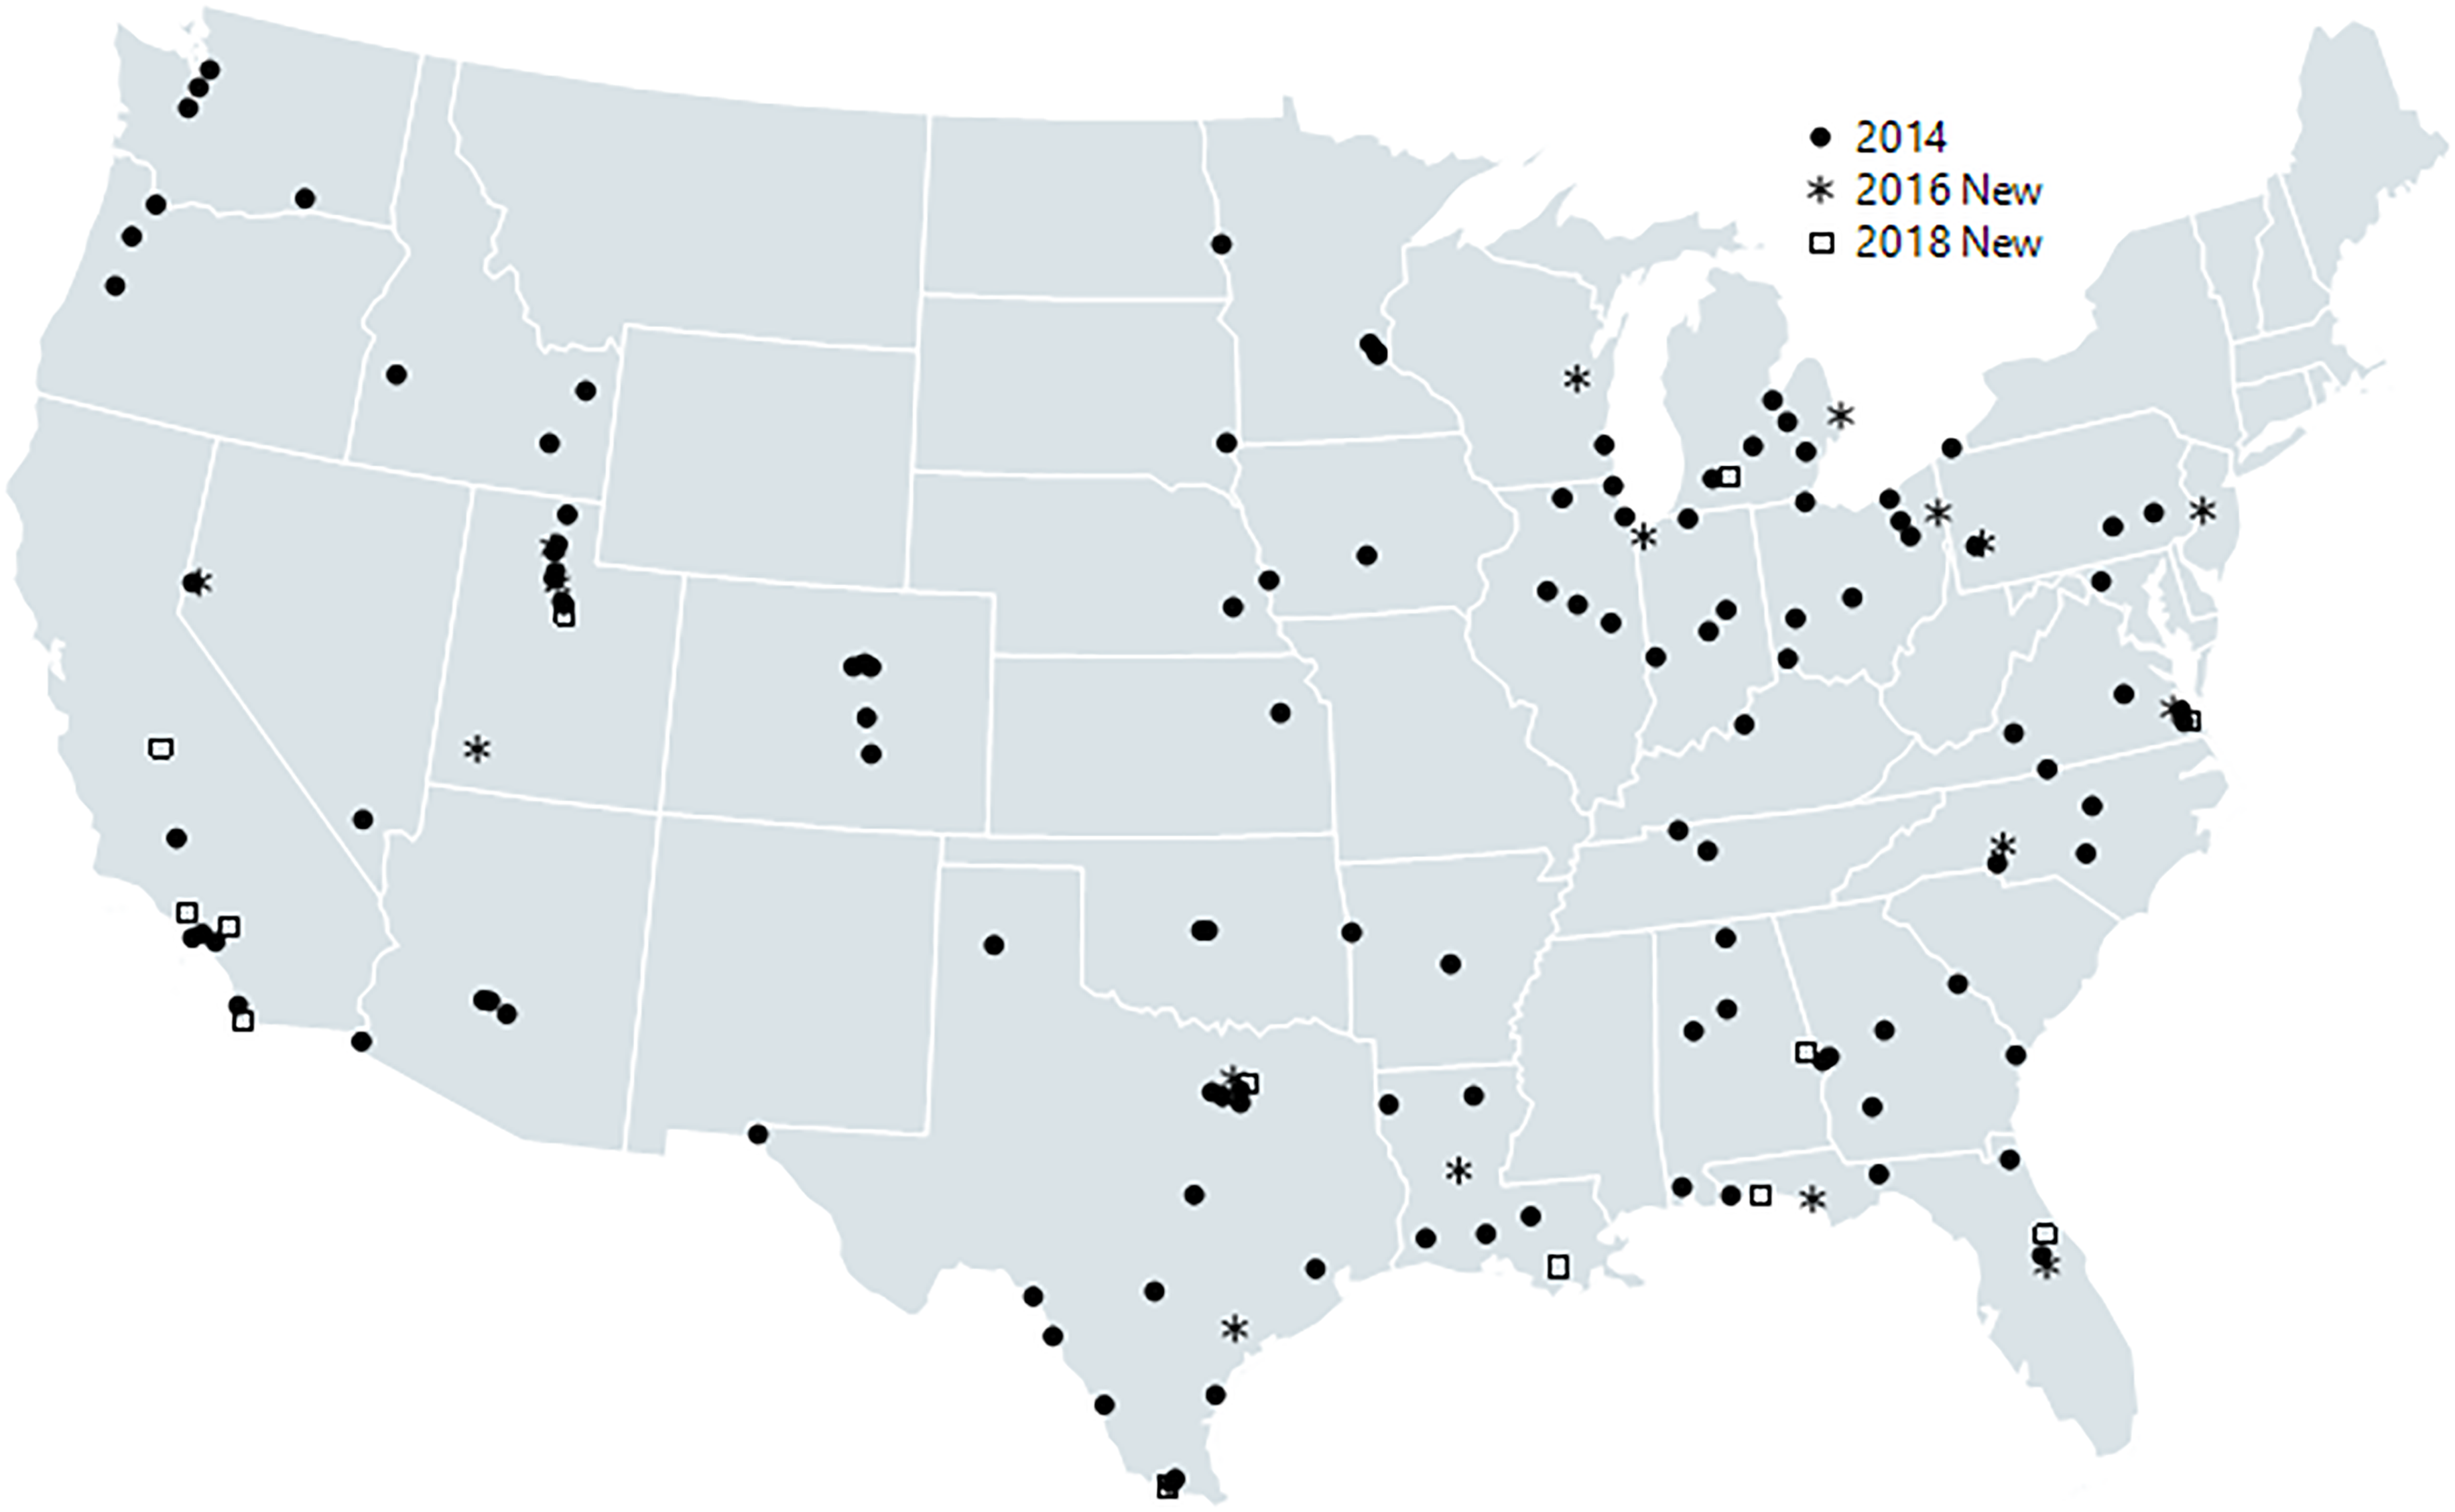
Demographic data from all plasma donors donating at Grifols US centers (ie, Biomat, Talecris, PlasmaCare) in the years 2014, 2016 and 2018 were analyzed. These constituted 25-30% of plasma donor centers in the US. 18 The total number of collection centers increased for each successive cohort year: 147 (2014), 171 (2016) and 189 (2018) (Figure 2).
Ethics statement
All donors signed an informed consent for plasma donation, in English or Spanish, prior to the first donation and annually thereafter. These specifically included permission to use routinely collected screening, laboratory and demographic data for de-identified analysis and publication.
Donor eligibility criteria
Donor eligibility criteria and donation procedures have been previously described.19,20 US source plasma collection is regulated by the Food and Drug Administration (FDA). Donor screening and eligibility requirements were standardized across all donor sites and meet all donor eligibility requirements outlined in the Code of Federal Regulations (21 CFR part 600). 21
On the day of the first donation and then annually, all donors provide a detailed medical history, and undergo a physical examination. Prior to each donation, donors complete a medical screening to confirm they are healthy and meet all donor eligibility requirements. This facilitates the minimization of conditions that could adversely affect the health of the donor, or the safety, purity, or potency of any manufactured product. Each donation also undergoes complete laboratory screening as required.5,6
In addition, donors are required to meet all routine plasma industry requirements for weight (≥ 110 pounds), blood pressure, pulse, temperature, hematocrit, and total protein. Although the CFR does not specify an upper age limit for source plasma donation, the Grifols age requirement is ≥ 18 years (or as required by any applicable state law) to 69 years. However, in this dataset, some donors ≥ 70 years of age were included as they were participants in a specialty program for which no upper age limit applied, provided certain additional donor eligibility criteria were met (including approval from their personal physician).
Dataset analyzed
During each calendar year, only data from the first donation in that year were included with each cohort year. Care was taken so that donors who visited more than one donor center per year were only counted once. Counting only the first donation was an arbitrary choice made to facilitate analysis, as most demographic data does not change between donations. However, this choice may have resulted in a slightly lower donor age. If donors donated in more than one of the cohort years studied, they were included in the total donor number for each year for purposes of general demographic comparisons.
Between 2014 and 2016, the corporate method of collecting donor race/ethnicity data was standardized and modified to expand the number of race/ethnicity categories. It also changed from being assigned by staff to being self-selected by the donor. These changes made it difficult to compare 2014 donor race/ethnicity data to subsequent years; accordingly, race/ethnicity data for the 2014 cohort were excluded from the single calendar year donor demographics analysis.
Multiyear donors donated in more than one of the calendar years studied. To investigate the demographic variability of repeat donors, two independent subgroups were broken out of the 2014 donor cohort and an additional subgroup was broken out of the 2016 donor cohort. These three subgroups consist of individuals who donated: 1) in all three years studied (2014, 2016 and 2018—which represents a 5-year period); 2) only in the first two years (2014 and 2016 but not 2018); and 3) donors that did not donate in 2014 (2016 and 2018 but not 2014). Donors who donated in 2014 and 2018 but not 2016 (n = 24,303) were not counted as part of the multiyear subgroups.
For multiyear donors, race/ethnicity attribution from the last calendar year was employed in the demographic characteristics analysis, while the first calendar year race/ethnicity attribution was used as the reference cohort for the return rate analysis.
The 2018 general 22 and “Not Hispanic or Latino” 23 US population data were derived from US Census data. Race/ethnicity group estimated counts were derived from the “Not Hispanic or Latino” population data for non-Hispanic race/ethnicity groups. Estimated counts were derived from ≥ 18 year or ≥ 20-year estimates based on the availability of partitioned data (noted in respective data tables). For the comparison of age by race/ethnicity and sex, African American estimated counts were derived from the general race/ethnicity category, since the 2018 “African American not Hispanic or Latino” data with age partition starting at 18 year was unavailable and the difference in counts between the two race/ethnicity categories (general and “Not Hispanic or Latino) was small (3.2%).
Statistical analysis
Statistical analysis was performed using SAS JMP version 14.0.0 (SAS Institute Inc., Cary, NC). Overall, an exploratory descriptive analysis was applied to the study population. Donor demographic profiles for each calendar year were compared descriptively to assess possible changes in the yearly donor population from 2014 to 2018. Hypothesis-based inferential statistic tests were not applied to compare the demographics across multiple years since each calendar year population was large and represented the true population and donors were redundant across multiple years. Descriptive statistics were reported as counts and proportions (percentages) for donor distribution by sex, age groups, and race/ethnicity groups. Age statistics were reported as mean, median, and interquartile range (IQR, 25th to 75th percentile).
Donor return rates were calculated using the formula: return rate = (count of return subset)/(total of subset's reference cohort) * 100. Due to the nature of the dataset, a direct comparison of the return rates between the 2014-2016 and the 2016-2018 subgroups is not possible.
Results
Donor population
A total of 1,303,049 unique donors were analyzed in the study over the three cohort years (see Table 1). The total number of donors collected during each cohort year shown in Table 1 represent new unique donors plus returning donors from the multiyear subgroups. The total number of donors increased by 16.3% between 2014-2016 and 7.5% between 2016-2018.
Sex and age characteristics of the donor cohorts compared with the US population

The percentage of male and female donors in the applicable year.
NA = Not available; cSD = Standard deviation; dIQR = interquartile range, 25th to 75th percentile.
Presented as % of total by sex and overall (“total”).
Age groups and sex proportions are for the general US population, 18 to 74 years of age. Median age data are for the entire general US population. Margin of error for all proportions were ± 0.1%
Donors ≥65 years had a maximum age limit of 69 years except for those in a specialty program for which there was no upper age limit. Comparison is to the 65–74 year general US population group; older general US population age groups are not included in this analysis.
Sex distribution
For all three cohort years, there was a higher proportion of male donors. However, the proportion of female donors increased from 37.4 to 41.6% from 2014 to 2018 (see Table 1).
Age distribution
Overall, half of each yearly donor cohort consisted of young adults with median age less than 28-29 years, with the sex specific age distribution curve being generally similar to the total cohort age distribution curve. When donors were stratified by age groups, in the 2014 and 2016 cohorts the highest proportions of donors overall were in the 18-24 group (see Table 1). However, in 2018, donor age increased slightly so that the highest proportion of donors was in the 25-34 group.
Race/ethnicity distribution
Due to the described procedural changes after 2014, comparisons of donor racial composition did not include 2014 data. Overall, race/ethnicity composition was similar in 2016 and 2018, with the highest proportion of donors being “Caucasian not Hispanic or Latino” (37.3 and 35.7% respectively), followed by African American and Hispanic (see Table 2). Although Caucasian donors constituted the highest numerical count each year, the 2016 to 2018 increases were highest in Hispanic donors (14.9%) compared to 2.8% and 7.4% in Caucasians and African Americans, respectively (see Table 3).
Race/ethnicity distribution of the 2016 and 2018 donor cohortsa by sex compared with the US population

Data for race/ethnicity were collected using different criteria in 2014, thus 2014 data were omitted in this table.
All values are presented as percent; for each sex, percent is calculated based on sex total count.
Presented as percent of overall total count.
Race/ethnicity group estimated counts were derived from the “Not Hispanic or Latino” US Census population data for non-Hispanic race/ethnicity groups.
Donor age by sex and major race/ethnicity groups in the 2016 and 2018 cohortsa

Data for Not Hispanic or Latino US population, 18 to 74 years of age. Median age data for the entire US population.
The African American estimates were derived from the general US population data.
SD = Standard deviation.
IQR = interquartile range, 25th to 75th percentile.
Donors ≥ 65 years had a maximum age limit of 69 years except for those in a specialty program for which there was no upper age limit. Comparison is to the 65 to 74 year US population group; older US population age groups are not included in this analysis.
For both 2016 and 2018, Caucasian donors constituted the oldest donor group while the median age of Hispanic donors was two to three years younger than either Caucasians or African Americans (see Table 3).
Comparison to the US population
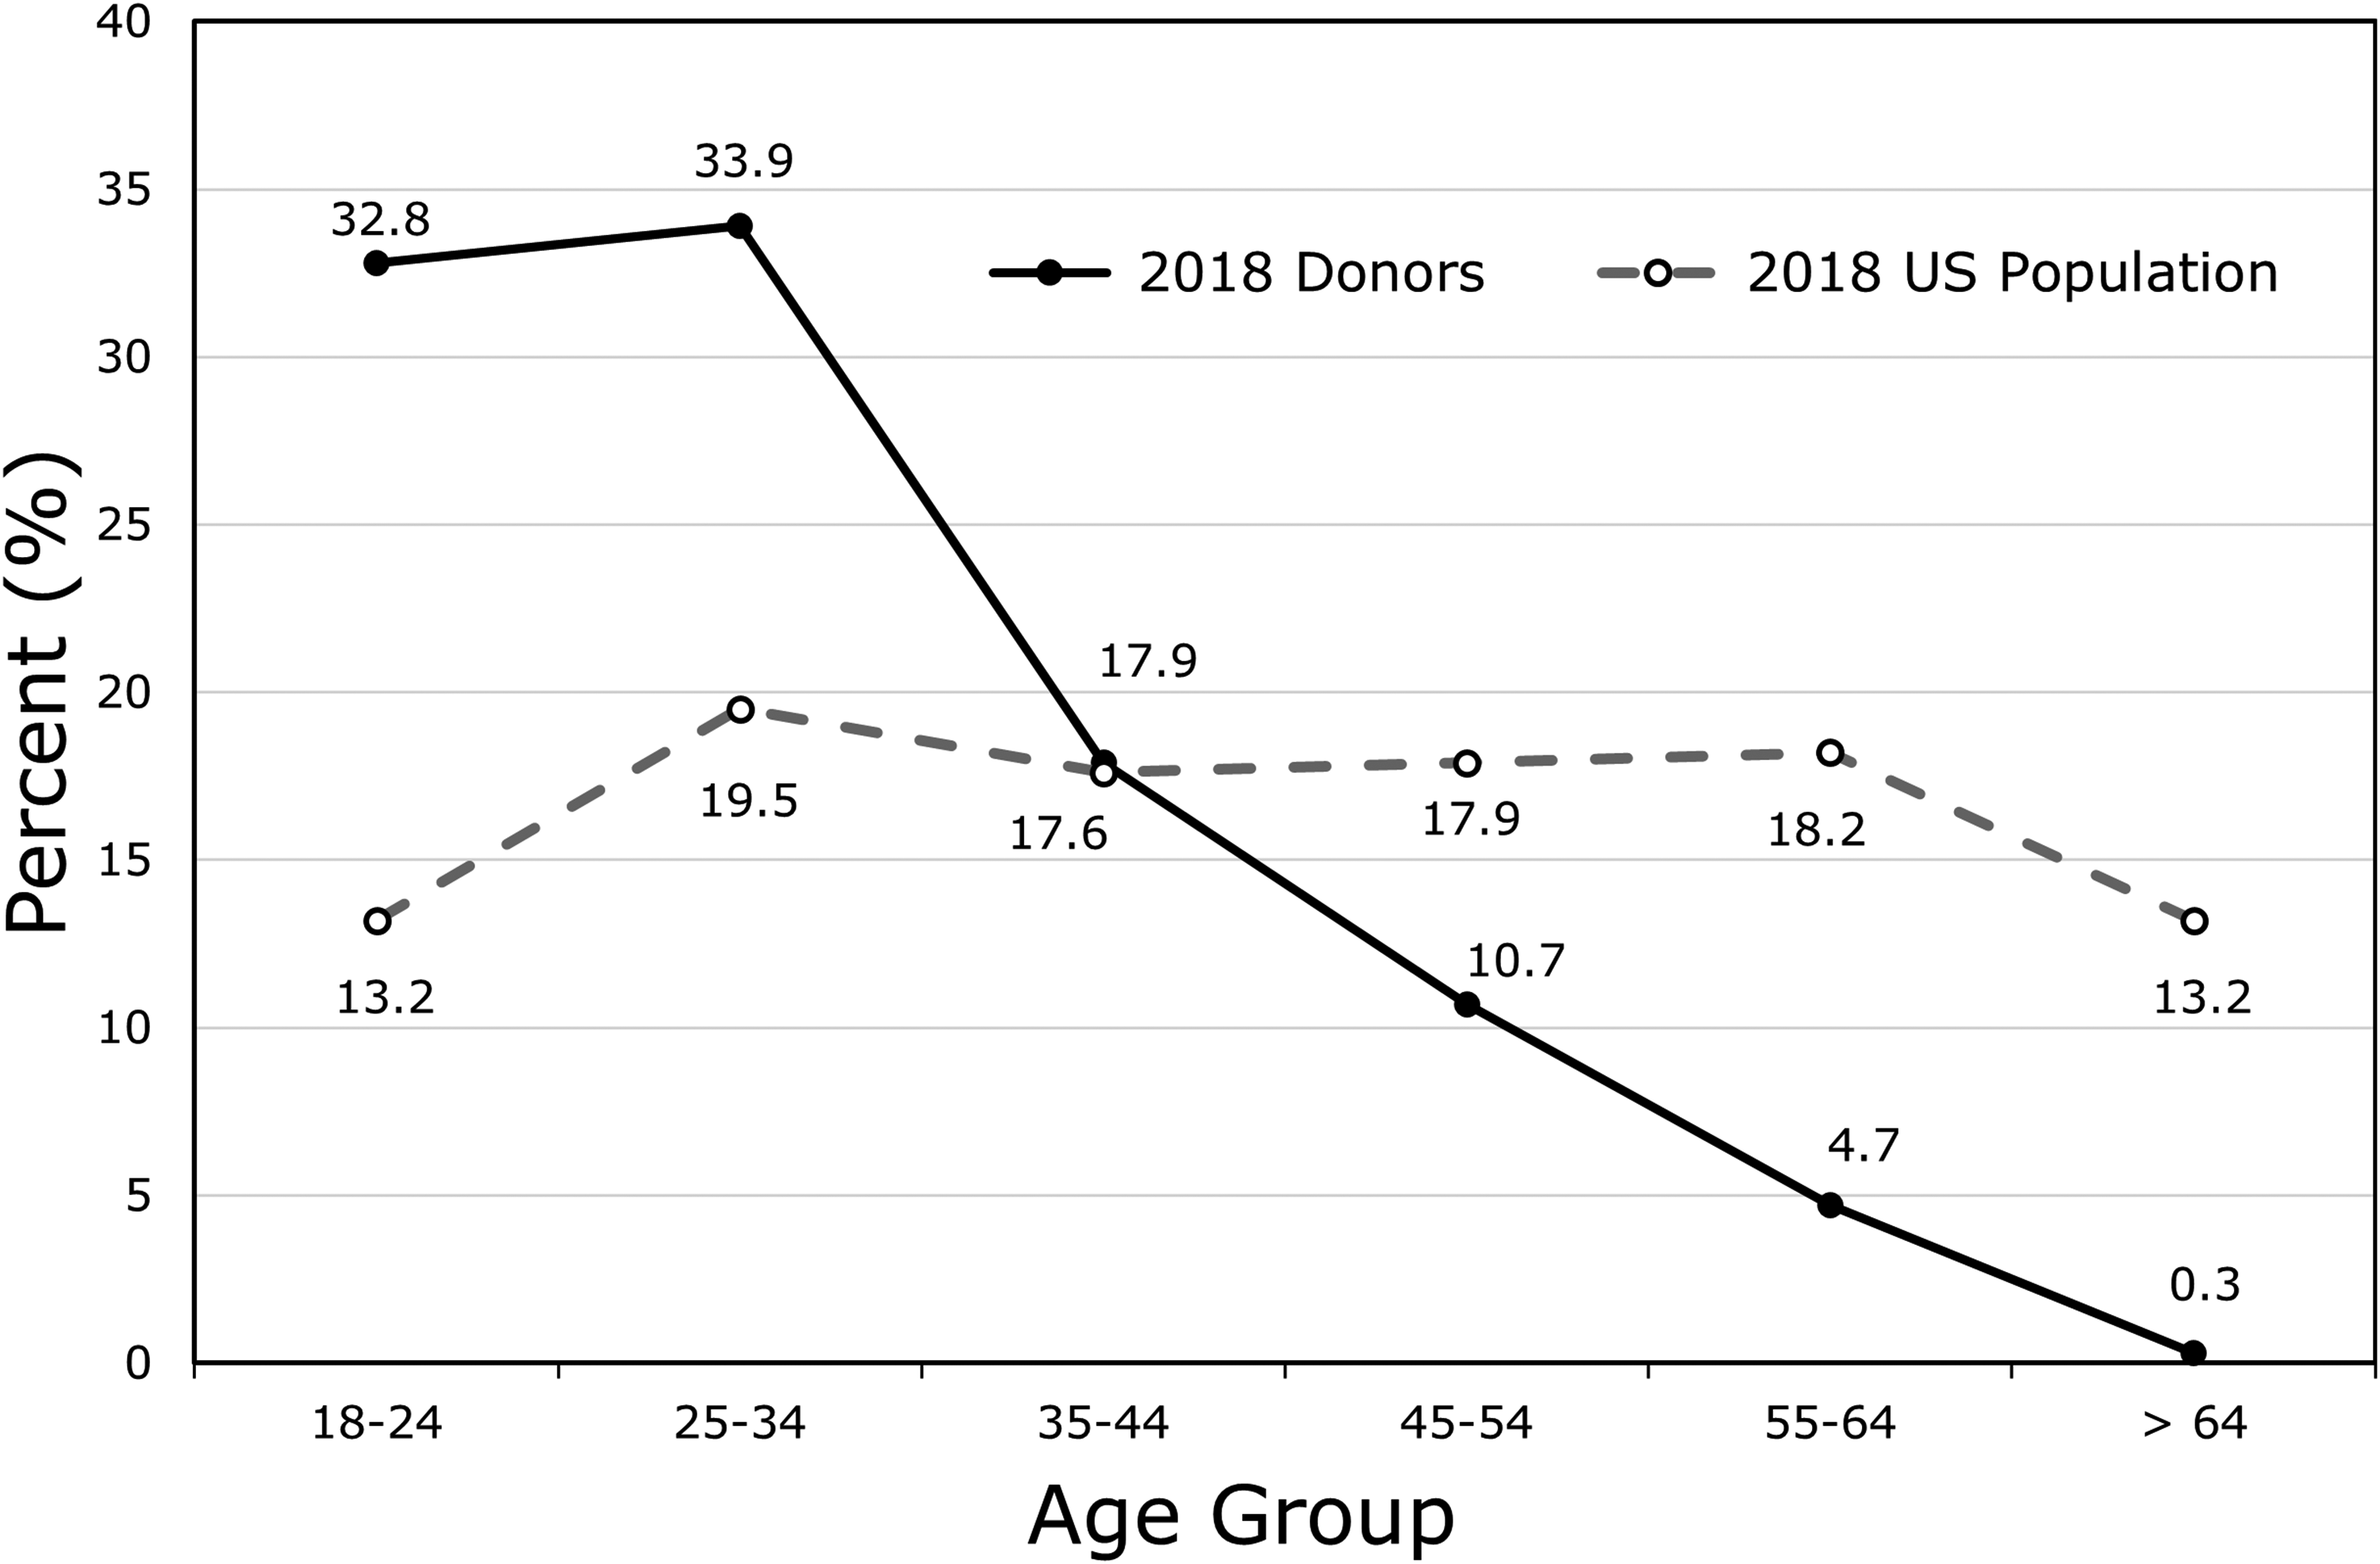
The 2018 donor cohort and the US population exhibited significantly different demographic profiles (see Table 1). Most donors were male while the general US population has a slight female predominance. Overall, median donor age was about 10 years younger compared to the US population, with proportionately more donors in the 18-24 and 25-34 age groups and fewer in the 45 and older age groups when compared with the US population (see Figure 3). Caucasians were the most frequent race/ethnicity group in both donor and US populations. (Figure 4, and Table 2). In contrast to the US population, plasma donors were more frequently African American (2.5 times more than the US population), Hispanic (1.3 times more), Native American (2.1 times more), or reporting two or more races/ethnicities (2.1 times more).

Comparison of the racial/ethnic composition of the 2018 donor cohort and the 2018 US population.
Donor retention
Overall returning donor numbers
Of all the donors that donated in 2014, 23.5% returned in 2016. Of all the donors that donated in 2016, 24.9% returned in 2018.
Multiyear donor subgroup analysis
As shown in Table 4, return rate for donors in the 2014-2016 subgroup (that only donated with the 2014 and 2016 cohorts) was 14.5% while the return rate for the 2014-2016-2018 subgroup (that donated in all three cohort years) was 9.0%. The return rate for the entire 2016-2018 subgroup (that did not donate with the 2014 cohort, but that donated in the 2016 cohort and returned in 2018) was 21.5%. Donors 18-24 years of age showed low return rates in all three subgroups while rates were consistently higher in the 35-64 age groups (Table 4). In all three multiyear subgroups, return rates were higher in male donors. There was a greater preponderance of male donors in the 2014-2016-2018 subgroup (2.7 times more males than females) relative to 2014-2016 (which had 2.1 times more males) and 2016-2018 (which had 1.7 times more males). This suggests that multiyear male donors likely donated for longer periods than multiyear female donors (see Table 5).
Return rate variation based on demographic differences of the multiyear donor subgroups

Return (%) = (count of return subset/total of subset's reference subgroup) * 100.
2014 donors who returned in 2016 and 2018, % calculated using sex, age, and race/ethnicity recorded in 2014; reference cohort is 2014 donors.
2014 donors who returned in 2016 only; % calculated using sex, age, and race/ethnicity recorded in 2014; reference cohort is 2014 donors. Note that 2014-2016-2018 group data were removed from the 2014-2016 return rate calculations to assure independence of the two groups.
Donors who did not donate in 2014, but who donated in 2016 and returned in 2018; % calculated using sex, age, and race/ethnicity recorded in 2016; reference cohort is donors who donated in 2016. Note that due to the nature of the dataset, the 2016-2018 return rate is not directly comparable to the 2014-2016 rate.
Comparison of the demographic characteristics of the multiyear plasma donor subgroups

Donors who donated in 2014, 2016, and 2018; attributes calculated using donor information recorded in 2018.
Donors who donated in 2014 and 2016 only; attributes calculated using donor information recorded in 2016.
Donors who donated in 2016 and 2018 only; attributes calculated using donor information recorded in 2018.
SD = Standard deviation.
IQR = interquartile range, 25th to 75th percentile.
In all three of the multiyear subgroups analyzed, donors were most likely to be African American or Caucasian, and in the 25-34 year age group (see Table 5). Multiyear female donors were more frequently Caucasian with an age distribution similar to multiyear male donors.
Return rates for African American, Hispanic, and Native American donors were consistently higher than the overall subgroup return rates, but Asian donors and donors with no race/ethnicity reported were lower (see Table 4).
The demographic differences between the multiyear subgroups for age, sex, and race/ethnicity are illustrated in Figure 5.

Comparison of sex, age groups, and major race/ethnicity groups in the multiyear donor subgroups.
Discussion
This multiyear retrospective study provides a detailed descriptive analysis of the demographic characteristics of compensated source plasma donors from a large US donor center network and compares these with the US population. These demographic data were collected from over 1.3 million source plasma donors spanning five years, which is among the largest cohorts ever reported. These data serve as a robust snapshot of the US source plasma donor baseline demographics prior to the COVID-19 pandemic. The study also evaluates the demographic stability of the donor population over time and identifies unique demographic characteristics found in multiyear donors.
Comparison of the demographic characteristics in the three donor cohorts indicate that the basic demographic characteristics of the donor pool remained relatively stable over the period (majority male, majority Caucasian, consistent average age). However, some trends in donor age, sex and race/ethnicity were observed. A small but steady increase in donor age for both sexes and overall is in agreement with the reported overall aging of the US population.22,24 These data also agree with the mean donor age increase recently reported over a three year period in a large plasma donor deferral study. 25 When compared to US blood donors for hospital use, source plasma donors had a higher proportion of male donors and were about 10 years younger than the blood donor population. 26
There was a significant difference in identified race/ethnicity of plasma donors when compared to US blood donors, where the majority of donors were Caucasian. 27 Most plasma donors were from communities of color (62%-65%), though the highest single donor subcategory was “Caucasian not Hispanic or Latino.” In contrast, African American, Hispanic, and Asian donors appeared underrepresented in regular blood donor populations.8,28 This difference was especially pronounced in the multiyear 2014-2016-2018 subgroup where the highest proportion of donors overall by race/ethnicity group was African American (see Table 5). The slight increase in Hispanic donors and donors of two or more races/ethnicities during the five-year duration agrees with trends in the US population. 23
Relatively few publications have described the demographics of plasma donors. These papers often deal with relatively small donor pools or evaluate regions with significant population homogeneity and differing recruitment practices.11–13,15,20,29 In US studies, plasma donors were 61-68% male, primarily Caucasian (46%-64%), and primarily under 35 years of age.13,15,20,27 As expected, these US sex and age results are generally consistent with our results, although a direct comparison of age group proportions is not possible. Similarly, reports of US plasma donors have shown that Caucasians constituted the largest proportion of plasma donors, although in one study, 20 they did not constitute a majority of the donors. This consistency of data among various reports suggests that the donors evaluated here are representative of US plasma donors over the five-year period. Several smaller European studies have been performed.11,12,29 However comparison with these results is difficult, as donors were usually recruited for the studies, which were typically not balanced for race/ethnicity, sex, and age of the general donor population. A recent donor demographic survey from China reported that the majority of plasma donors were women (71%), farmers (89%), and the majority of all donors (79%) were between the ages of 46 and 55. Notably, the majority (60%) had a donation history of at least five years. 17 These data are quite different from those of US plasma donors.
Multiyear donor subgroups exhibited significant differences in demographic characteristics when compared to the yearly donor cohorts, specifically higher proportions of male donors, African American donors, and older donors. These differences may relate both to the ability of individual donors to continue donating and to socioeconomic factors which could influence the decision to donate over longer time periods.
Donor return rates varied based on the length of donation history, with a 14.5% overall return rate for the 2014-2016 subgroup and just 9.0% for the 2014-2016-2018 subgroup. A lower return rate for the 2014-2016-2018 subgroup relative to the 2014-2016 subgroup is expected since more donors would likely be lost over a five-year period.
The importance of recruiting new donors is underscored by the low overall donor return rates in the multiyear subgroups. Of interest, although donors in the 18-24 and 25-34 age groups constitute about two-thirds of donors in each of the three subgroups (see Table 5), the return rates for these younger groups were proportionately lower than other age groups (see Table 4). This difference and other differences in return rates may be of importance in planning donor recruitment and retention. Recruitment of donors likely to have higher return rates could be beneficial in maintaining a more stable donor population. In addition, understanding why younger donors discontinue donating may reveal information on both the motivations and barriers to continued long-term source plasma donation. Donations among the younger age groups could be influenced by changes in geographic location (eg, relocation for school or after graduation) and changes in economic status (eg, post-graduation employment). Collection and analysis of additional demographic data is needed to clarify these factors.
The multiyear return rates may support previously reported results that a small percentage of donors continue to donate over the course of multiple years. 15 Interestingly, across the age groups analyzed, male donors were more likely to return over the study period (2014-2016-2018) when compared to females except in the ≥65 age group. Sex-related differences in health and social and economic factors likely contribute and warrant further study.
Our analysis has several possible limitations. Donor trends may reflect changes in the overall US population but may also be influenced by new donor center locations, community stability, cultural motivations, and local recruitment practices. Due to the retrospective nature of the study, socioeconomic data were not collected; however, it is likely that socioeconomic factors may also have influenced the demographic patterns. The exclusion of 2014 race/ethnicity data due to differences in data collection methodology prohibited the evaluation of changes in donor race/ethnicity composition for the entire five-year period. Another limitation is the lack of multiyear donor data for the “in between” years of 2015 and 2017. Although it is reasonable to assume that donors who donated in 2014 and 2016 or 2016 and 2018 also donated in the intervening years, this continued donation practice is not documented. Another limitation is that donors were drawn from the areas served by Grifols centers. Figure 2 demonstrates a wide distribution of collection centers across the continental US, but it also shows some areas that had no study collections (such as the far northeast). Although additional donor centers were added in 2016 and 2018, due to the large number of donors and the nature of the calculations, we believe that the effect of additional centers was not profound.
This study documents the demographics of US plasma donors over a five-year period preceding the COVID-19 pandemic. It is hoped that these data may be used as a baseline comparison when the post-pandemic “new normal” is sought by US plasma manufacturers. In addition, it may inform countries seeking to help meet the increasing worldwide demand by establishing or ramping-up their own plasma programs. This and future studies of large segments of the plasma donor pool will provide important information toward a better understanding of the demographic composition of donors supplying source plasma and will hopefully facilitate targeting of donor recruitment and retention to insure a continuing supply of plasma.
Declarations
Ethics Approval
The data used in this study was routinely collected for all plasma donors and was anonymized or de-identified for analysis in this study. The study was conducted in accordance with the Declaration of Helsinki and all applicable federal and local regulations.
Consent to Participate
All donors signed an informed consent for plasma donation, in English or Spanish, prior to the first donation and annually thereafter. These specifically included permission to use routinely collected screening, laboratory, and demographic data for de-identified analysis.
Consent for Publication
The described donor consent forms specifically included permission for publication.
Footnotes
Acknowledgements
We are grateful to Daniel Munoz Perales and Tristan Cook of Grifols’ Donor Center Systems Department for technical support with donor record database management and query and to Jordi Bozzo, PhD, CMPP, Michael K. James, PhD (Grifols Scientific Publications) and Frank Bray, BS, CHDA for editorial assistance.
Author contributions
Competing Interests
MRB, MAB, TG and MB are employees of Grifols. CW and KPC are consultants to Grifols.
Availability of Data and Materials
The aggregated data underlying these analyses are available from the corresponding author upon reasonable request.
Funding
The author(s) disclosed receipt of the following financial support for the research, authorship, and/or publication of this article: This work was supported by the Jose Antonio Grifols Lucas Foundation, (grant number NA).