
Abstract
Developing system understanding and testing interventions are critical steps to addressing wicked problems. Fuzzy cognitive mapping (FCM) can be a useful participatory modeling tool that enables aggregation of individual perspectives to build system models that represent groups’ collective intelligence (CI). However, current FCM aggregation methodologies for creating CI models have rarely been tested and compared. We conducted 51 FCM interviews with local experts in the Flint, MI food system to map their mental models about how different food system sectors influenced desirable outcomes. Using four differing aggregation techniques, based on experts’ identity diversity and cognitive diversity, we generated four CI models. The models were compared based on their similarity to real-world complex systems using performance metrics like network structure, micro-motifs, cognitive distance, and scenario outcomes. We found that using cognitive diversity to group individuals was better suited for modeling systems with diverse holders of knowledge.
Keywords
Understanding and addressing social and environmental problems is challenging because of the complex interacting systems that create these issues. For some time, researchers have advocated for research and governance to incorporate stakeholder engagement and local knowledge transparently and equitably into decision-making processes. Fuzzy cognitive mapping (FCM) is one potential tool to address this need since it allows for multiple knowledge systems to be integrated. FCM is semi-quantitative modeling method that can combine expert knowledge and stakeholder perspectives into a holistic representation of a system that can be used to test potential interventions. As the potential application of FCM expands, more methodological development and testing is needed to gauge best practices. Previous FCM studies have primarily used differences in participant identity or background as a proxy for differences in knowledge about a system, given the assumption that experiences related to identity shape how people learn about systems and their attitudes and values. However, there has been limited testing of this assumption in FCM studies, and in other contexts research has found ranges of knowledge and beliefs within a single identity category. To address this gap, we tested combining individual fuzzy cognitive maps based on both identity and knowledge, and tested the resulting collective intelligence model to figure out which most parsimoniously and accurately represented the real-world system in which complex problems are embedded. We found that for our system, the Flint, Michigan food system, the local expert participants had many sources of knowledge from their jobs, volunteering, community organizing, and their lived experience as Flint residents. Thus, aggregating by knowledge, what participants included and focused on in their map, led to a more parsimonious model. We also found that more specific categories for different topics in the models created a more accurate and appropriately scoped model. Particularly when working with community members or other non-systems experts, it is important to balance the size and scale of model with the goals of the modeling process. A model with too many concepts and connections can be tough for viewers to understand, but too few concepts and connections makes it more challenging to do advanced analyses. For this context, we valued creating an accessible model that still reflected a complex system and allowed us to test interventions.Significance Statement
Introduction
Wicked problems are fundamentally difficult to understand and manage. They are marked by uncertainty, complexity, trade-offs, and counterintuitive causal relationships (Head and Alford, 2015; Rittel and Webber, 1973; Turner et al., 2017). The complex socio-environmental systems that produce wicked problems like poverty, climate change, or food insecurity are generally decentralized, with diverse groups of stakeholders and bodies of governance with independent and often conflicting interests that can make top-down solutions ineffective (Weber and Khademian, 2008). Furthermore, wicked problems often have no definitive solution, but rather multiple possible interventions that can range in quality and differ in stakeholder preference (Head and Alford, 2015; Rittel and Webber, 1973). Even reaching the decision-making stage can be trying, as researchers or stakeholders first need to establish an understanding of the issue to identify and evaluate possible actions.
Methods for understanding, much less addressing, wicked problems remain somewhat elusive. A combination of fields is required, including complex systems, decision-sciences, and modeling, in order to deepen system understanding and promote collaboration among actors to achieve collective action (Freeman et al., 2020). Using a case study of food insecurity in Flint, MI, we propose a fuzzy cognitive mapping (FCM) methodology for aggregating the knowledge of experts. Aggregation is the process of combining multiple FCMs into a single model, which we will refer to in this paper as a “metamodel.” Generally, the goal of aggregation is to create a more accurate and parsimonious representation of a system. FCMs can be aggregated into a metamodel by grouping participants with either homogenous or heterogenous expertise. Using a bottom-up system approach to understanding wicked problems, FCM allows researchers, community leaders, and policymakers to integrate principles of participatory system modeling with collective intelligence theory (Gray et al., 2020). FCM can be effectively used to aggregate local knowledge, evaluate interventions (leverage points), and engage community members to assist in decision-making that puts possible interventions into practice.
Mental models are grounded in constructivist psychological theories which assert that individuals organize knowledge and information into mental systems (Craik, 1952; Gray et al., 2014, 2015; Voinov et al., 2018). These internal abstractions of the real world can be externalized during an FCM modeling session and represented as a network with directed and weighted causal connections between components (Gray et al., 2014, 2015; Stylios and Groumpos, 2004). Systems approaches, like FCM, are used at a variety of scales to develop a holistic understanding of the structure and dynamics of complex systems that is needed to design and implement multi-level management strategies that maximize desired outcomes and minimize undesired outcomes (Barnhill et al., 2018; Ruben et al., 2019). The semi-quantitative nature of FCMs enables “what-if” analysis through scenario testing, which is useful for testing system sensitivity to change, deepening understanding of system dynamics, and evaluating proposed interventions (Giabbanelli et al., 2017; Gray et al., 2015; Mourhir, 2020).
There are trade-offs associated with FCM, primarily a loss of explicit temporal and quantitative analytical capabilities as legibility and accessibility increase. Accessibility is particularly important as FCM can serve as a method for participatory modeling, defined by Voinov et al. as “a purposeful learning process for action that engages the implicit and explicit knowledge of stakeholders to create formalized and shared representations of reality” (Voinov et al., 2018). Participatory FCM studies are generally transdisciplinary, drawing on diverse knowledge and community member experience working with, living in, and managing complex systems. There is a long tradition of using diverse perspectives and expert judgement in a variety of academic fields, and FCM studies can expand traditional definitions of expertise to center community voices (Galafassi et al., 2017; Otway and Von Winterfeldt, 1992; Skjong and Wentworth, 2001; Teck et al., 2010). Transdisciplinary work is advantageous to addressing wicked problems as it bridges boundaries between disciplines and communities through collaboration and co-learning to further our collective understanding of complex systems and problem-solving capacity (Head and Alford, 2015; Hinrichs, 2012; Pettigrew et al., 2001; Weber and Khademian, 2008). While participatory work is more resource-intensive, as additional time and labor is devoted to design, communication, and collaboration, ultimately decisions are higher quality and legitimacy (NRA, 2008). It also closes the gap between theory and practice as engagement with multiple actors at different levels and scales is vital to implementing transformative solutions to wicked problems (Van de Ven, 2007; Van de Ven and Johnson, 2006; Willett et al., 2019).
Another challenging aspect of wicked problems is that individuals can struggle to make high-quality decisions due to biases and cognitive limitations like bounded rationality or mental ability to accurately manage complexity (Doyle and Ford, 1998; Gregory et al., 2012; Simon, 1957). One way to circumvent the limitations of individuals is to average or weight together multiple FCMs into group models and/or a singular collective intelligence model (Aminpour et al., 2020, 2021b; Gray et al., 2020). This process uses wisdom of the crowd and collective intelligence theories; Aminpour et al. (2020) and others showed that individual perspectives can be aggregated to accurately approximate real-world systems and facilitate effective decision-making (Aminpour et al., 2020; Arlinghaus and Krause, 2013; Gray et al., 2020; Woolley et al., 2010). However, FCM is very much a developing field. There have been significant innovations to the field since the inception of FCM in the late 1980s, yet as recently as 2014 a methodological assessment found limited mathematical techniques for aggregation (Jetter and Kok, 2014; Kosko, 1986). Early studies simply added adjacency matrices of individuals then qualitatively validated the aggregated map, while others first weighted and/or grouped participants into sub-domains of specialized knowledge in order to maximize independence between groups (Nadkarni and Nah, 2003; Nii, 1986; Rantilla and Budescu, 1999; Rush and Wallace, 1997; Stylios and Groumpos, 2004). Ultimately, the goal of many modeling efforts is to create a parsimonious model that simplistically and accurately represents a real-world system (see Figure 1) (Jones, 1952; Plouffe et al., 2001). Four-quadrant chart showing the usefulness of FCM models based on visual simplicity and dynamic complexity.
Currently there are two main schools of thought about how to group individuals to create an effective collective intelligence model: utilizing identity diversity (Aminpour et al., 2020, 2021a; Gray et al., 2012; Schwermer et al., 2021) or cognitive diversity (Aminpour et al., 2021a; Cholewicki et al., 2019). Identity diversity (surface-level diversity) is based on traits of individuals like social categories such as demographics, while cognitive diversity (deep-level diversity) refers to differences in cognitive traits like intelligence, attitudes, information, or values (Aminpour et al., 2021b; Baggio et al., 2019; Phillips and Loyd, 2006). An abundance of research has evaluated the connection between and influences among surface-level identity and deep-level diversity, as well as how diversity impacts outcomes such as productivity, problem-solving, and decision-making (Chen and Kenrick, 2002; Hong and Page, 2004; Jackson et al., 1995; Page, 2007; Phillips, 2003; Williams & O’Reilly III, 1998).
Previous FCM studies have used identity diversity characteristics as a proxy for cognitive diversity, given the hypothesis that commonalities in social identities lead to shared experiences that influence knowledge and perception, and therefore an individuals’ mental model (Aminpour et al., 2021b). However, a more complex relationship between the two can cause identity diversity to be an imperfect proxy. Studies have shown heterogeneity in deep-level perspectives within a homogenous identity diversity group (Chatman et al., 1998; Phillips and Loyd, 2006). Further challenges to linking identity diversity and cognitive diversity arise from ambiguous delineation of social groups and/or multiple sources of knowledge and system understanding. Nevertheless, studies find that heterogeneous teams create more innovative solutions to problems and improved system management than homogenous counterparts, often due to the differences in cognition such as information and perspective (Baggio et al., 2019; Hong and Page, 2004; Jackson, 1991; Page, 2007).
Simply put, the critical conceptual difference between these aggregation methods rests in whether participants are grouped based on similarities in their social categories or the content of their individual cognitive maps. Currently, comparisons of these two aggregation techniques and discussion of the implications of those methods is lacking. Our primary research question is: what are the critical differences between, and advantages and disadvantages of, aggregating fuzzy cognitive maps based on identity and cognitive diversity? In this paper we test variations within the two aggregation techniques (see Figure 2) to determine which would be better suited for various types of research questions or study systems based on performance metrics like resource inputs, cognitive distance of groups, and similarity to the real-world system. In addition, we explore the challenges of and possible solutions to aggregating participants without discrete expertise groups. Specifically, this case study deals with participants with knowledge of multiple, overlapping food system sectors so cannot be grouped into a single type of expertise. Finally, we synthesize quantitative and qualitative findings of how aggregation techniques on a single dataset resulted in collective intelligence models of varying quality. This study fills a fundamental methodological gap by comparing aggregation techniques and providing guidance on an innovative method for combining knowledge from diverse experts to address wicked problems in complex systems. Illustration of four metamodel aggregation techniques, two based on identity diversity and two of cognitive diversity.
Methods
Data collection
Definitions of the food system sectors.

We elicited study participants (N = 51) through snowball sampling, beginning with CCP members, by having each participant recommend up to three additional Flint food system experts. We used a broad definition of expertise when considering participants, including knowledge and experience from any source, including through formal work, unpaid labor (i.e., volunteering or activism), as well as through their lived experience. While some participants have focused expertise in a single sector and some have more broad expertise in several sectors, all hold expertise in the Flint food system. To address biases of snowball sampling, we also contacted influential Flint-based organizations, identified in a stakeholder analysis, or groups that were underrepresented or absent from the initial participant list provided by the CCP, such as convenience stores and local producers. However, Flint is a highly studied city and we found that personal referrals from our community partners and snowball sampling were more effective for participant elicitation than cold contacting.
We elicited experts’ cognitive maps through virtual semi-structured interviews using a seven-step process (Figure 3). The mapping interviews took between 60 and 90 min. Prior to the interview, participants were provided with a handout of base component definitions, which were also reviewed during the meeting to ensure common understanding of concepts (Step 1). At the beginning of the interview, participants self-identified their experience within the different sectors, listing how many years of experience they had, and stating if they were a Flint resident (Step 2). Interviewers oriented participants to the FCM process using a simple example to explain causal connections, polarity, and weight (Step 3). Participants began with a base map of the three sectors (see Figure 4) where they first determined the weights of the connections from “Use of Retail” to the five retail sub-sectors, and from “Use of Supplemental Sector” to the three retail store concepts (Step 4). While the fourth sector, production, was not explicitly part of the base map, participants could add a “Gardening + Local Agriculture” component at any time. FCM interview process. Base map of the interview.

Next, participants were asked to select from seven food system values, determined by workshops with Flint community members (Belisle-Toler et al., 2020, 2021). Participants were asked to prioritize values that they have experience in or consider particularly important to add to their maps, which they then connected to the sectors (Step 5). For the rest of the interview, participants added any additional components or connections they perceived as important or influential to the Flint food system, which were semi-constrained to relevant topics by the interviewer (Step 6). Concept map creation followed established FCM data collection practices (Gray et al., 2014). The interviewer screenshared MentalModeler, an online fuzzy cognitive mapping software, to each participant and added components and connections based on the participants’ answers and directions. Participants routinely verified that the component names, connection direction, polarity, and weight were correct to their understanding of the Flint food system with regular prompting from the interviewer. Finally, participants completed a post-interview survey that collected demographic information and feedback on the modeling experience (Step 7).
Data preparation
To prepare the data for aggregation, we combined components with synonymous meaning. Standardizing concepts leads to easier aggregation and analysis (Gray et al., 2014; Jetter and Kok, 2014; Mourhir, 2020). Two researchers collaborated to reduce unique components not defined by the researchers (non-base components) based on conceptual similarity, based on the process of FCM standardization (Siqueiros-García et al., 2019). We used an inductive process as our decisions to combine concepts were made based on patterns in participant answers. For example, seven participants combined income and employment into a single component, so we grouped those and other participants’ concepts like “Jobs,” “Employment,” and “Income” into the single component of “Income + Employment.” Original maps were updated with the simplified, more consistent component names. Occasionally the polarity of connections was changed, in cases where the initial concept like “Unhealthy Food Choices” was grouped with the much more prominent “Healthy Food Choices” component. If two concepts were combined into a single component, for example, “Expired Food” and “Food Waste” within a single map were reduced to “Food Waste,” connections were preserved and combined through addition as needed. Interview audio was transcribed using Otter.AI and was corrected and verified by a researcher for accuracy. Researchers coded each transcript using MAXQDA for descriptions of (1) novel components and (2) connections between components based on the participant’s concept map. See Appendix C for a list of novel components.
Data analysis
Saturation
We calculated thematic saturation by determining the number of novel categories within each individual cognitive map beginning with the first participant to find the point that all categories are represented (see Appendix D for categorization schemes). Due to the number of participants and scale of the interview topics, achieving saturation at the component-level is unrealistic because we largely left the concepts unstandardized, which is a trade-off in cognitive mapping (Gray et al., 2014). Concepts ranging from the micro to macro levels, for example, from individuals having microwaves in their homes to national immigration policy, can all have relevance to the Flint food system and be part of participants’ cognitive maps. Thus, we used thematic saturation to determine if a comprehensive inventory had been collected. Achieving saturation ensures a holistic collective intelligence model as additional data collection (interviews with more participants) would likely not lead to the identification of additional categories (Guest et al., 2006; Saunders et al., 2018).
Aggregation based on identity diversity
One innovative method for aggregating individual cognitive maps into a collective intelligence model is combining the adjacency matrices of individual models by stakeholder or expertise group using the arithmetic mean of connection weights, and then aggregating group models using the median connection weight (Aminpour et al., 2020; Gray et al., 2012). This multi-step aggregation method has proved to result in parsimonious CI models when groups demonstrate diverse expertise (Aminpour et al., 2021a). However, unlike previous FCM studies that had firm boundaries between stakeholder or expertise groups, we found a high level of expertise overlap between the different sectors (Gray et al., 2012; Schwermer et al., 2021). For example, one participant may have 4 years of experience working for a supplemental nutrition program, 6 years of volunteering at emergency food distributions, and have used the retail sector for the 10 years they have lived in Flint. To address this complexity, we used two different methods of grouping individual cognitive maps based on self-identified expertise (see Figure 5). The first method of grouping used the exact description of their expertise, resulting in nine expertise groups. The second method of grouping divided participants with a single expertise group into the four sectors and grouped participants with experience in three or more sectors into a multi-sector group. For participants with expertise in two sectors, their map was included in both groups. This results in five groups, four based on sector expertise and one for multi-sector expertise. Comparison of participant groups based on expertise. The bottom left box shows grouping based on exact self-identified expertise group, while the bottom right box shows each sector, with participants in two sectors being sorted into both expertise groups. A color-coding key and an example of how participants with multiple sectors of expertise would be categorized in each grouping scheme is included.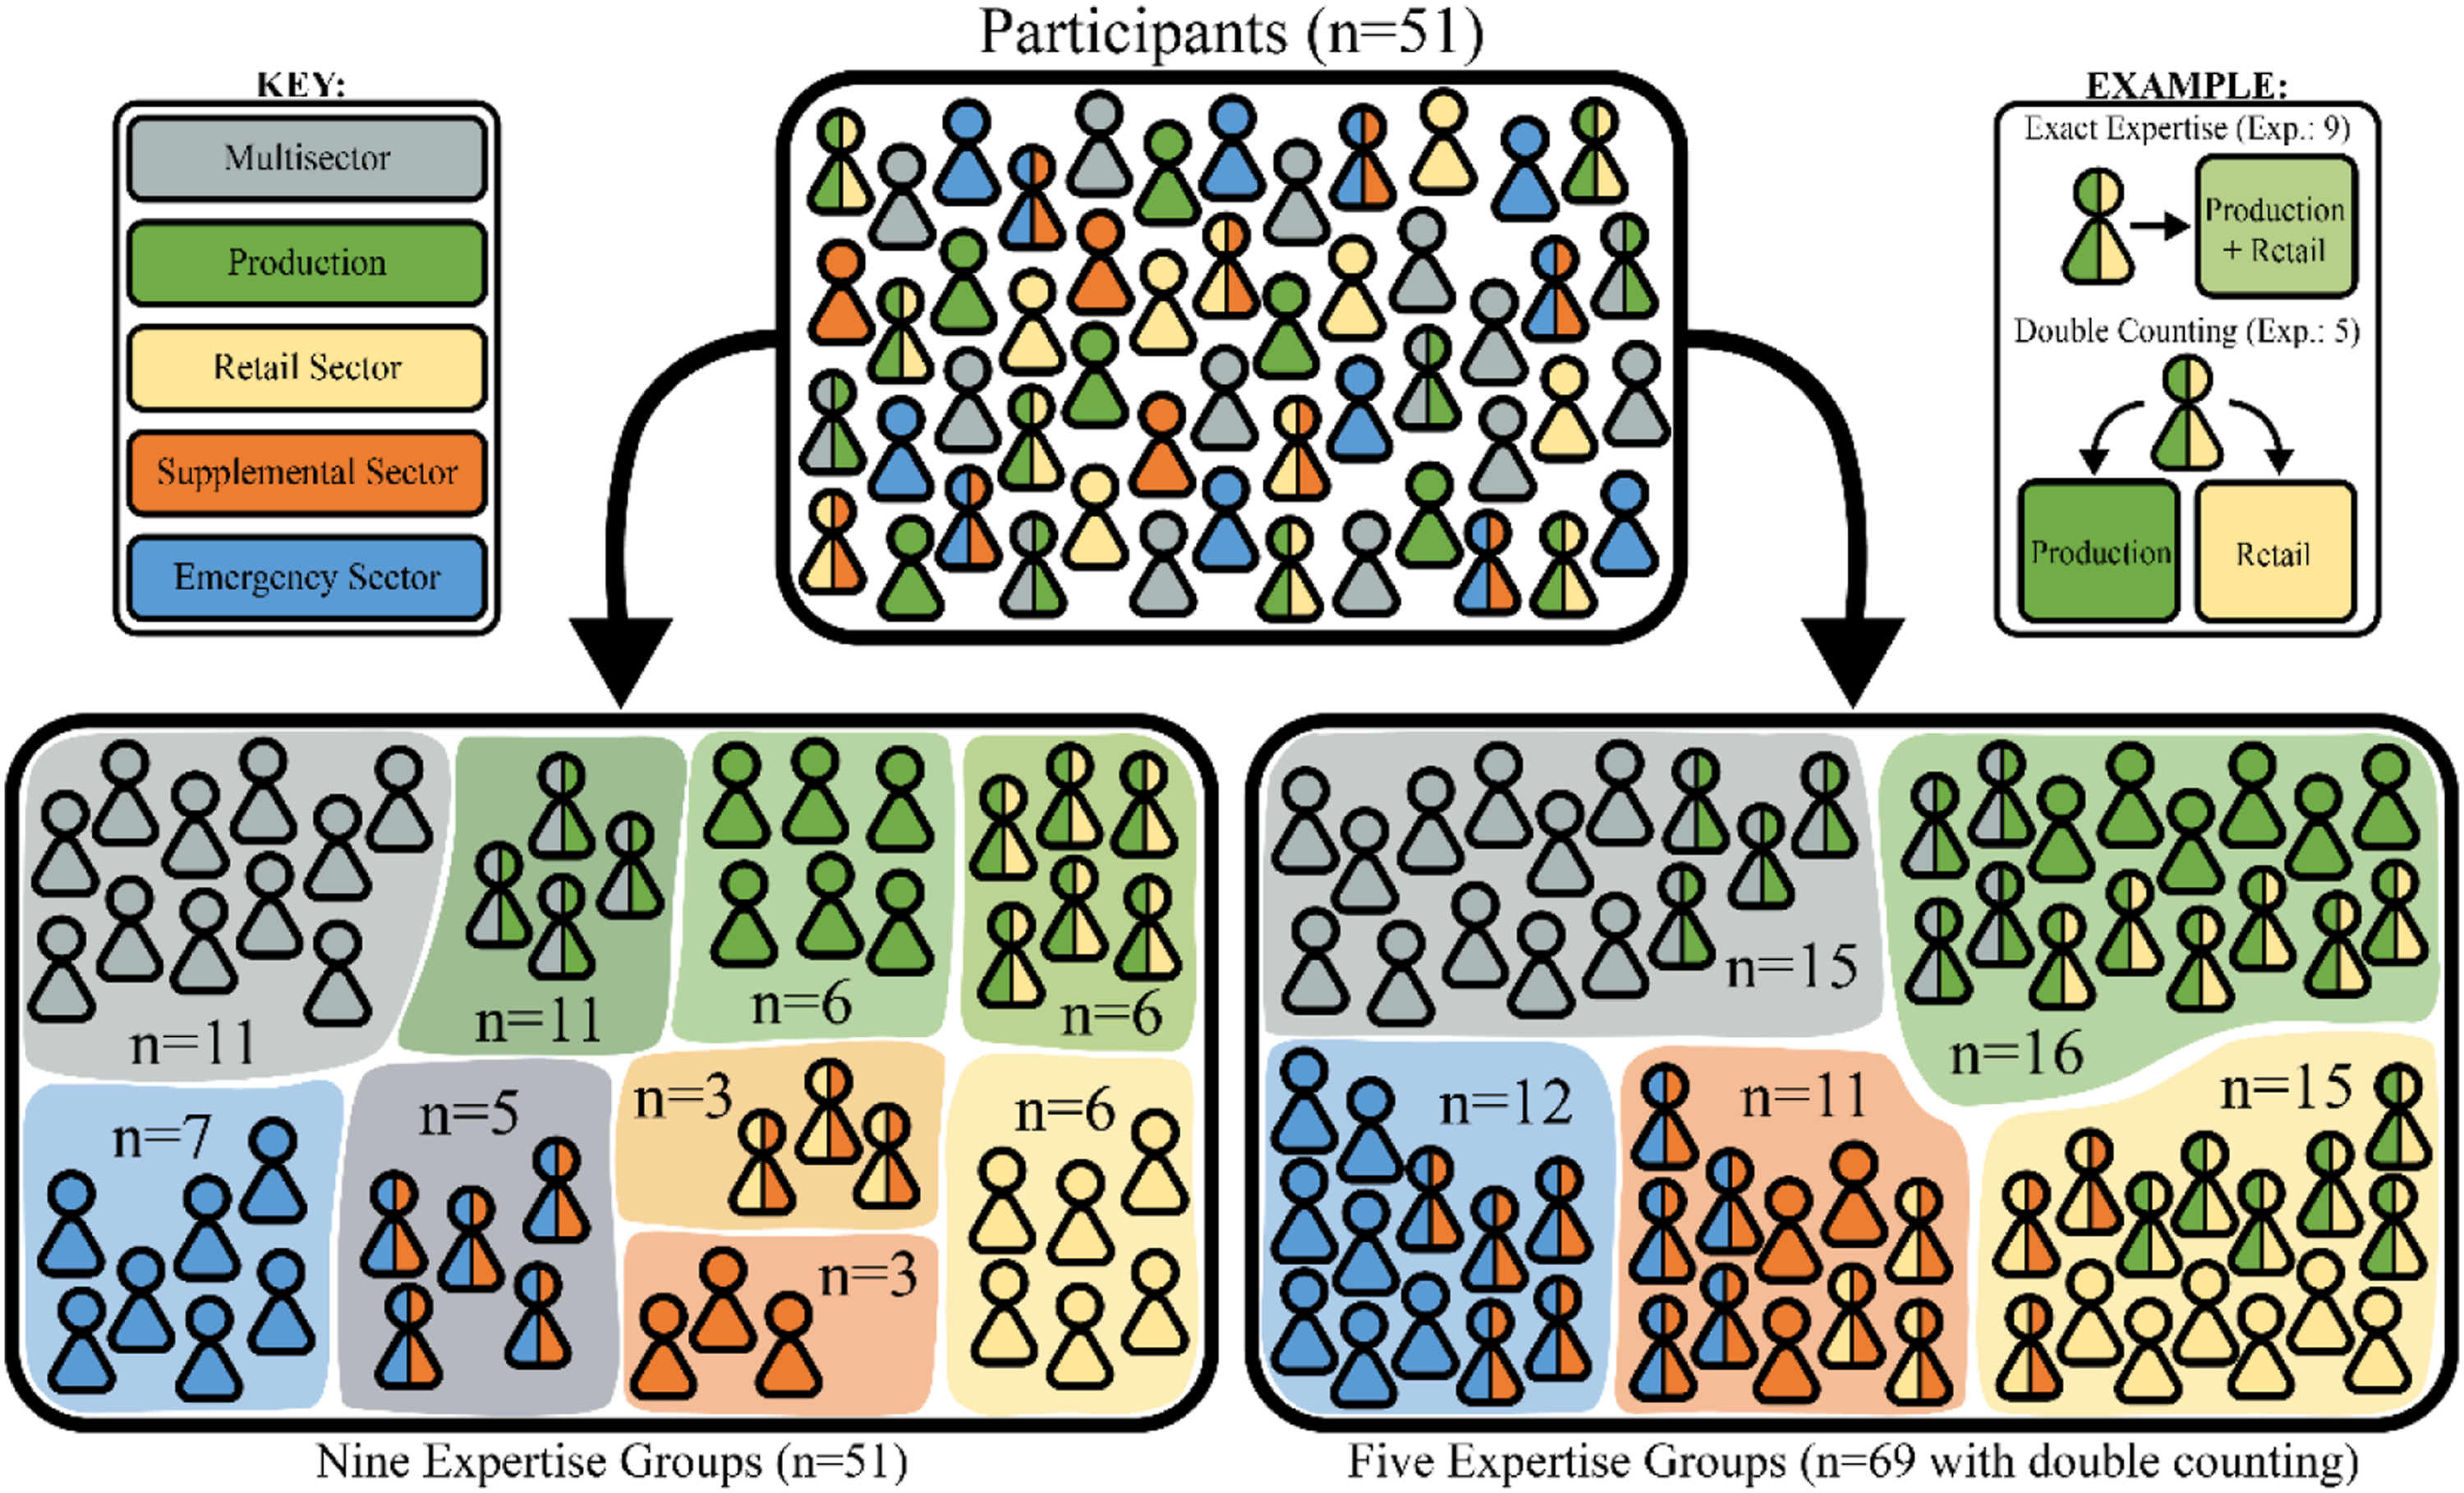
Aggregation based on cognitive diversity
A second, more data-driven approach to aggregation of individual cognitive maps is by categorizing components, conducting a Principal Component Analysis (PCA), and grouping participants based on cognitive diversity (Aminpour et al., 2021a; Cholewicki et al., 2019). The goal of this type of categorization is to determine the major conceptual groupings of components which can be used to analyze the models and link participants based on conceptual similarities (see Figure 6). We explore two methods for emergent categorization: (1) a more in-depth scheme typifying components as firstly their function in the problem space (activities, drivers, barriers, and outcomes) and secondarily based on thematic similarities, and (2) a higher-level scheme organizing components based on the sector or element of the food system (see Table 5 in Appendix D). Visualization of process for creating a conceptual categorization scheme, use of scheme for calculating the absolute weighted degree centrality of each category, principal component analysis, and clustering based on the resulting dendrograms. For details on the categorization scheme and dendrograms, see Appendices D and H, respectively.
A cornerstone of the categorization schemes was the values and sector definitions emerging from conversations with Flint residents and food system experts (see Appendix B). Also highly influential was Ericksen’s conceptualization of the food system, which is used by the larger Flint Leverage Points Project (Ericksen, 2008). However, a small deviation was made away from using a “human capital” framing (Bowles and Gintis, 1975; Tan, 2014). Other sources, primarily in the sustainability or food systems space, were used to determine common terms in academic literature for drivers (Haddad et al., 2016; HLPE, 2017; O’Neill et al., 2014), outcomes (Keyes, 1998; Ostrom, 2009; WFS, 1996), and barriers (D’Este et al., 2012; Swanson and Tokar, 1991; Trianni et al., 2017; Truman and Elliott, 2019). Both categorization schemes were evaluated and validated by multiple researchers.
For each FCM a standardized sum of centrality (NSc) was generated for each category (Cholewicki et al., 2019). First, we calculated c
i
as the weighted contribution of each component i.

Using the weighted absolute degree centrality of the different categories, we conducted a Principal Component Analysis (PCA) in R (Jolliffe, 2002). Principal components (PCs) associated with eigenvalues greater than one were included, which represented more than 50% of the explained variance. Then, we reduced the number of dimensions and used the PC coordinates for hierarchical clustering by Ward’s method (Ward Jr, 1963). Hierarchical cluster analysis is a common method for grouping a set based on similarities among the items, in this case participant cognitive maps. Clustering correlated variables allows for the creation of a dendrogram, a kind of tree diagram used to visualize hierarchical clustering (Bridges, 1966). We used the dendextend R package to create dendrograms of each categorization schemes’ PCA results, as well as tanglegrams which can be used to compare two dendrograms of the same set (Galili, 2015; Nöllenburg et al., 2009). The entanglement function was also used to calculate the alignment of the two dendrograms, with zero representing perfect alignment and one representing complete misalignment (Galili, 2015).
As there are relatively few observations, 51 participants in multidimensional space, calculating a useful number of groups can be challenging. For clarity, “clustering” is used both in the context of hierarchical clustering which produces dendrograms, and the process of clustering data or items into groups. For the purposes of this paper, we will refer to determining participant groups from a hierarchical cluster as “grouping.” Common methods like the gap or silhouette statistics can be ill-suited for data without well separated clusters (Tibshirani et al., 2001). While there are more complex methods of determining a useful number of groups within high-dimensional data, one advantage of hierarchical clustering and dendrograms is the ability to visually assess the data (Bouveyron et al., 2007; Steinbach et al., 2004). Hierarchical clustering does not rely on a set number of groups, rather dendrograms can be “cut” at different levels which varies the number of groups (Steinbach et al., 2004). Aspects of the dendrograms such as stem height and researchers’ subject matter expertise can effectively be used to determine an appropriate number of groups.
Metamodel creation
Once the participants are grouped, either by identity diversity or cognitive diversity, individual maps are aggregated into group-level models using the arithmetic mean of connection weights. Then, a single collective intelligence model was created using the median of group-level models’ connection weights, as section 2.3.2 describes. See Figure 7 for a visual representation of the aggregation methodology. Visualization of methodology, describing the stages of data collection, concept standardization, grouping based on expertise and conceptual categories, aggregation, and data analysis.
Network structure measures
The following network structure measures were calculated for each participants’ cognitive maps, group models, and the collective intelligence models: 1) Total Components (N) – number of components in a model. 2) Total Connections (C) – number of connections in a model. 3) Density (D) – number of connections as a proportion of the number of all possible connections. 4) Connections per Component (C/N) – number of connections as a proportion of components. 5) Number of Driver, Receiver, and Ordinary Components – total number of components with only outward connections (drivers), inward connections (receivers), or both (ordinary).
Micro-motifs
Micro-motifs, which are also called causal motifs of network substructures, are fundamental causal structures in networks that represent different dimensions of systems thinking (Levy et al., 2018; Milo et al., 2002). Compared to random networks of the same size and density, complex networks like the food system are found to have a significantly higher occurrence of complex micro-motifs (Milo et al., 2002). Micro-motifs have been used in FCM studies to compare levels of systems thinking across individuals and within aggregated models (Aminpour et al., 2021a; Hamilton et al., 2022). Using the six substructures proposed by Levy et al. (see Figure 13), we determined the number of each micro-motif within the individual maps, group maps, and metamodel. For each FCM map, we counted the number of motifs in 1000 simulated random graphs of the same size and density (Levy et al., 2018). Specifically, we used the number of vertices and edges from the original graph as the basis for generating random sequences of out- and in-degrees, ensuring that each component had at least a degree of one and the resulting graph would have the correct density. See Github repository for information on the code. Once the 1000 simulated graphs were generated and micro-motifs counted, we calculated the probability distribution for each micro-motif for each set of graph dimensions.
Cognitive distance
One of the ways to compare FCMs is by calculating a network distance. There are many approaches to defining network distance that differ in treatment of connection direction and weight (Tantardini et al., 2019). In this study, we use “cognitive distance,” introduced by Aminpour et al. (2021a), which has been utilized to consider the direction and weight characteristics of each network. For clarity, cognitive distance is a metric that is calculated between networks, while cognitive diversity refers to the differences in how participants understand and think about the system. In this approach, the cognitive distance is the function of two separate network distances: (1) the Jaccard distance, which accounts for the direction characteristics of FCMs (Tantardini et al., 2019), and (2) a Euclidian distance between the subsets of eigenvalues of the normalized graph Laplacians constructed from the weighted, undirected network topology, which considers the weight characteristics of FCMs (Aminpour et al., 2021b; Gera et al., 2018). The cognitive distance between every pair of metamodels was computed to explore cognitive distance across the data manifold. To provide deeper insights into how the cognitive distances of individual FCMs vary within or across groups (based on similarities in their social categories or the content of their cognitive maps), the average and standard deviation of the intergroup and intragroup cognitive distances have been calculated. A shorter intragroup cognitive distance average (standard deviation) is taken to represent a more homogenous group of cognitive maps, and conversely for a larger intergroup average.
Cognitive color spectrum
Cognitive Color Spectrum (CCS) is a visualization tool that has been utilized for the comparison of individual FCMs (Cholewicki et al., 2019; Hodges et al., 2019) and evaluation of cognitive maps across subgroups (Arroyo-Lambaer et al., 2021) based on the domination of predefined or emergent categories—demonstrating the proportion of each category in the individual FCMs. CCS uses network characteristics such as degree centrality (Cholewicki et al., 2019) or betweenness centrality (Arroyo-Lambaer et al., 2021) as a measurement for representing the proportion of each category. Each CCS can be demonstrated as a bar chart in that each color is representative of a unique category and the length of color is representative of the relative share of the centrality of each category in each FCM. In this study, CSS has been utilized to compare the four metamodels based on the high-level categorization (including 16 categories). Weighted absolute degree centrality (explained in section 2.3.3) has been selected to measure the centrality share of each category within each map.
Evaluation of metamodels
Community consultive panel (CCP) members and several other Flint food system experts who participated in modeling provided feedback through a survey to verify how the aggregated metamodels captured the Flint food system. The three dimensions of evaluation were as follows: (1) the components included in the model, (2) the proportion of the themes, and (3) the outcomes of scenarios. The survey questions asked participants to select what the best representation of the Flint food system would be, which we used to evaluate the performance of the four collective intelligence models. For more information about the survey instrument, see Appendix E.
Results
Data collection and preparation
In total, 51 participants were interviewed. Participants had, on average, 10.25 years of experience with the Flint food system, and 82% were residents of Flint, MI. See Figure 8 for an overview of self-identified sector expertise. Through the concept standardization process, 469 non-base components were reduced to 281 novel components. This resulted in a total of 2613 connections across the 51 individual fuzzy cognitive maps. See Appendix C for a definition of each novel concept and the number of mentions across the individual cognitive maps. Self-identified sector expertise groups.
Data analysis
Saturation
The thematic saturation points were 23 and 12 participants for the in-depth and high-level categorization, respectively (see Figure 9). Saturation of categories based on in-depth (25 categories) and high-level categorization (16 categories).
Aggregation based on expertise
Aggregation based on expertise group led to the creation of two metamodels (see Figures 10 and 11). The expertise groups and group-level models can be found in supplemental information (see Appendices F and G, respectively). Metamodel from nine expertise groups (n = 51). Metamodel from five expertise groups (n = 69).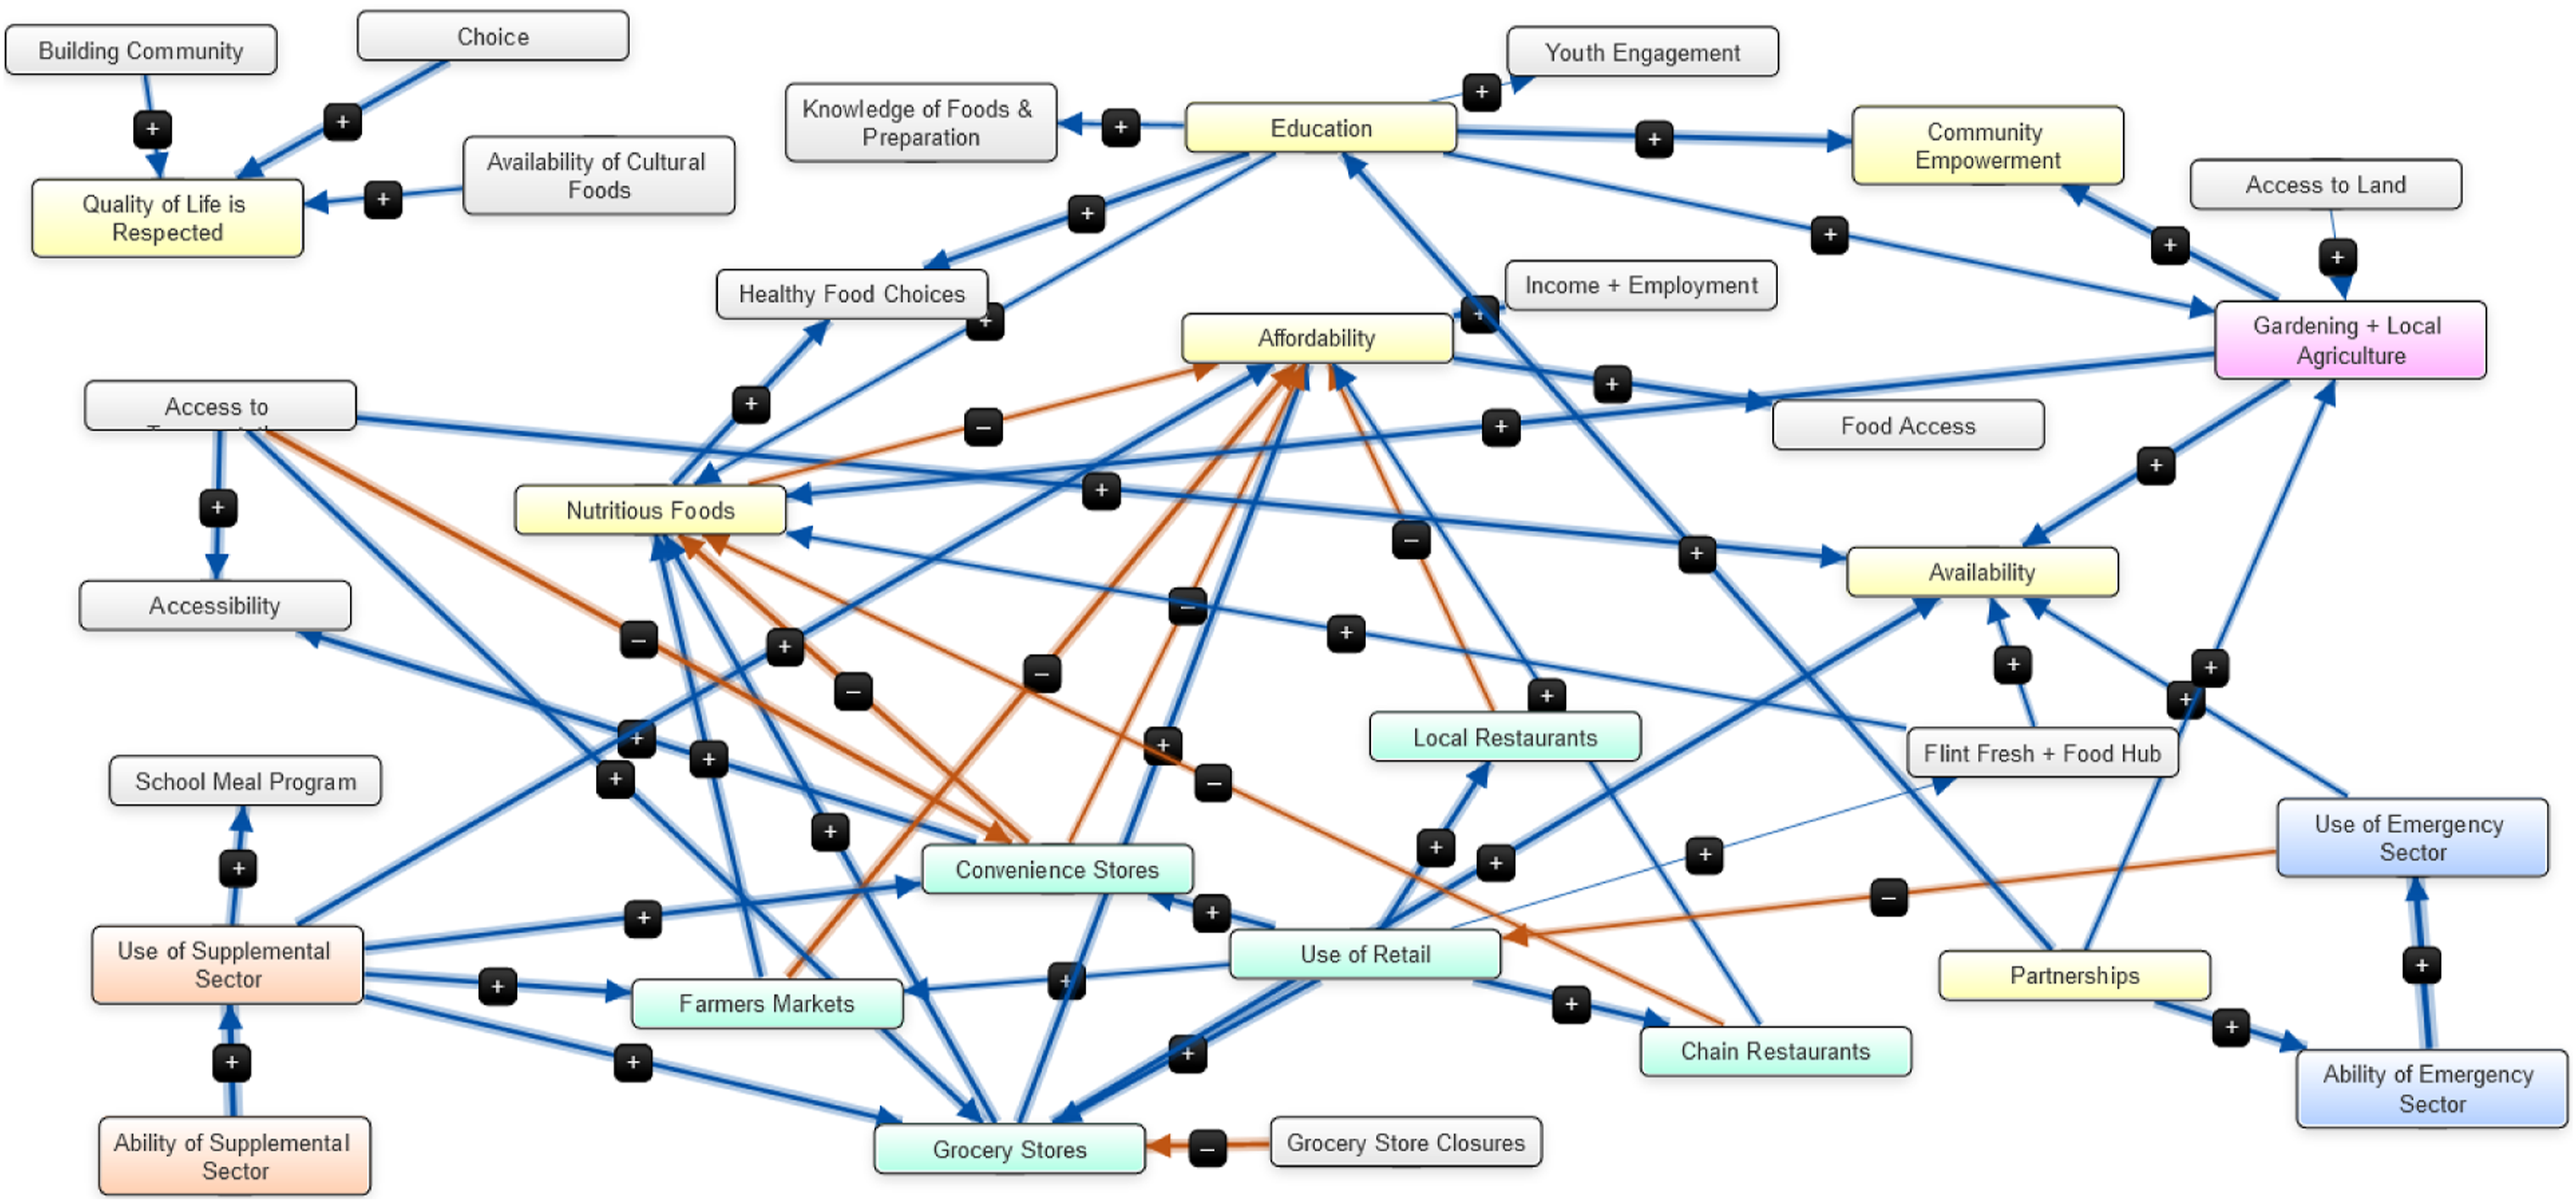

Aggregation based on cognitive diversity
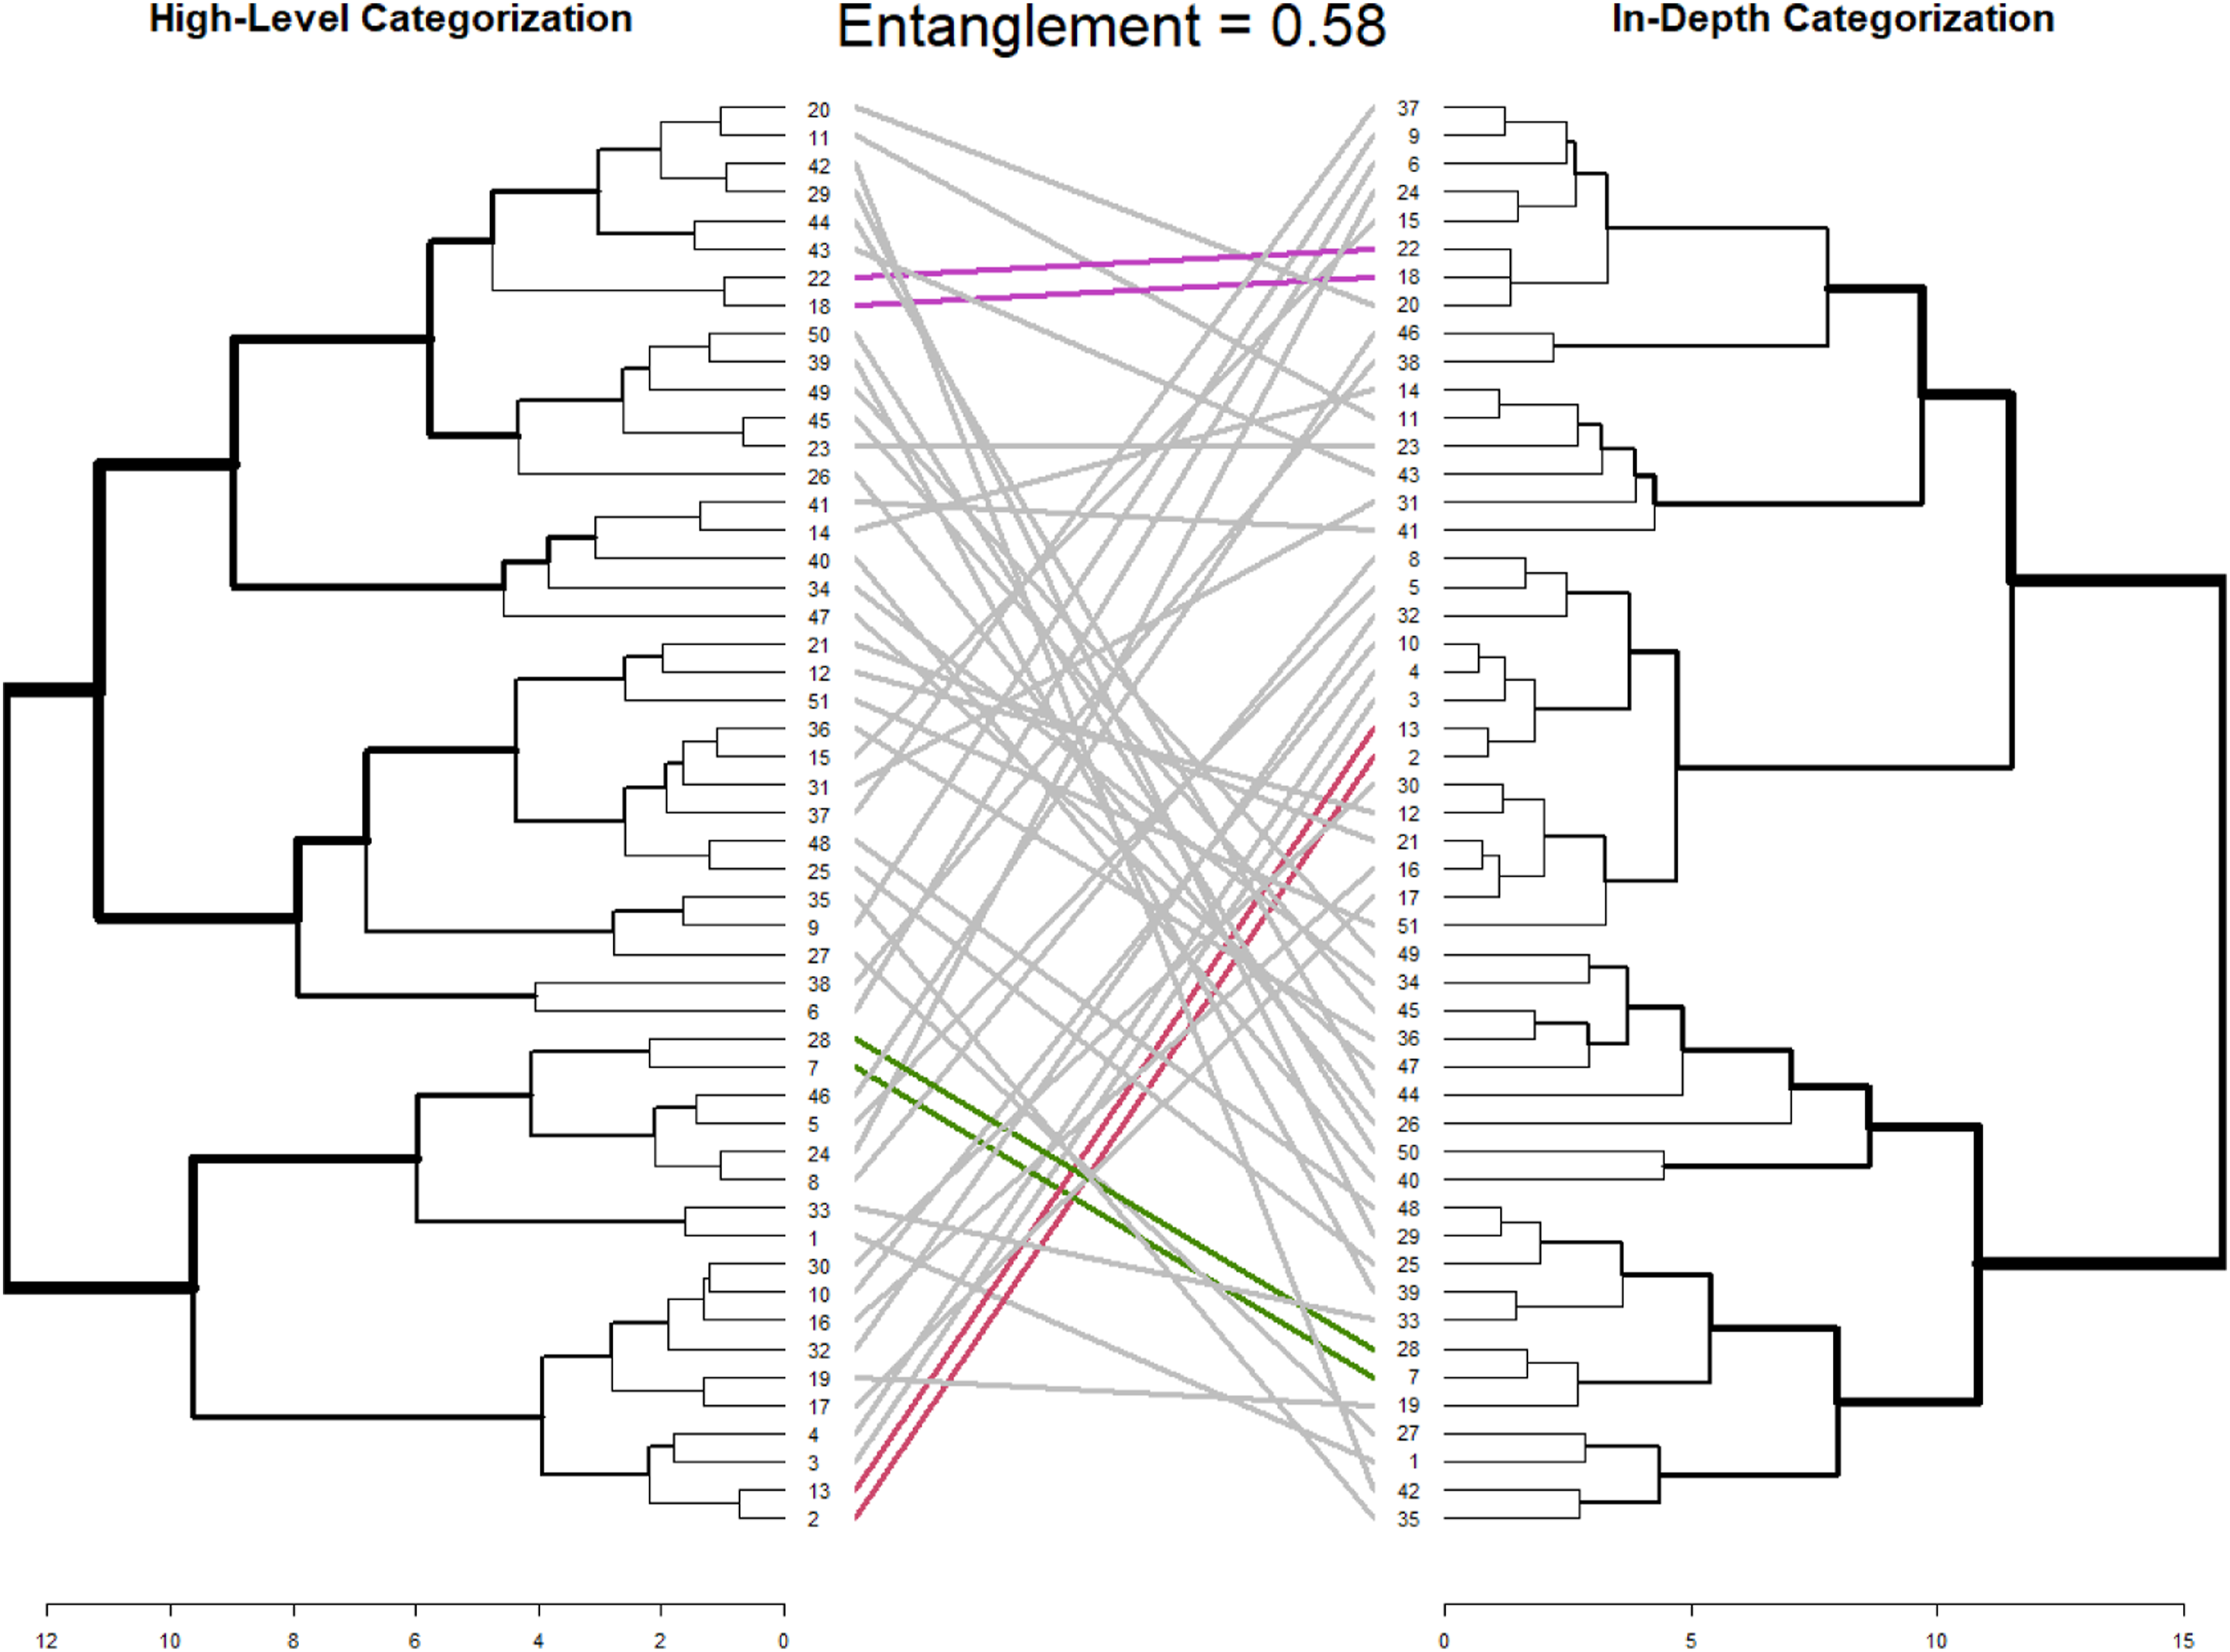
Using the in-depth categorization scheme, the original 25 categories were reduced to 10 dimensions which explained 73.6% of the variance. Then, the histogram was used to determine the correct number of clusters, which is five for this data (see Appendix H). Similarly, the high-level categorization was reduced from 16 to six dimensions, which represented 63.4% of explained variance. The number of groups for this categorization scheme was also five. Groupings were used to create metamodels (Figures 12 and 13). The group models for each aggregation technique can be found in supplemental information (see Appendix G). A tanglegram of both dendrograms was created and had an entanglement score of 0.58 (Figure 14). Metamodel from in-depth categorization (n = 51). Metamodel from high-level categorization (n = 51). Tanglegram of hierarchical clustering based on PCA using high-level versus in-depth categorization. The colored lines indicate pairs grouped together in both dendrograms.

Network structure measures and micro-motifs
Network structure measures of the metamodels and average of the individual cognitive maps.

Micro-motifs were detected and counted in the individual, group, and metamodels (see Appendix I for precise counts). In addition, the final number of motifs was compared to 1000 random sample connected networks of the same size and density to calculate the probability of the model having fewer motifs than was present (see Figure 15) (Hamilton et al., 2022). For example, if a metamodel had four instances of bidirectionality, the percentage of random networks with three or less of that particular micro-motif would represent the probability that the metamodel would have fewer network structures. Specifically, 100% and 0% mean that no random graphs had as high or as low a frequency of the motif, respectively. By comparing the network structures of the collected model to the distribution of micro-motif counts from randomly connected networks of the same size and density, we can draw conclusions about the complexity of the collected FCM. Comparison of metamodels and average of individual maps prevalence of micro-motifs based on the probability of random connected networks of the same size and density having less of the specific motif. Micro-motif figures adapted from Levy et al., 2018.
In general, complex systems, like the Flint food system, are expected to have higher instances of micro-motifs than random graphs. We found that micro-motif prevalence varied across the metamodels, with Exp.: Five and C.D.: In-Depth having the highest prevalence. Both cognitive diversity metamodels followed similar patterns, but the identity diversity models were very different. Exp.: Nine had few complex micro-motifs like feedback loops, while Exp.: Five had many more than random networks of the same size. These differences are likely caused by the relative sizes and aggregation methods; as Exp.: Nine is a much smaller network with a lower C/N score and was aggregated across more groups, so there are less chances for micro-motif dynamics to be preserved.
Cognitive distance and cognitive color spectrum
To compare metamodels based on their network structures, the cognitive distances between each pair of metamodels was calculated. Figure 16 represents all the possible pairwise cognitive distances for metamodels. Each of the reported cognitive distances has been multiplied by a standardization coefficient for mapping to a normalized range from 0 to 1. The shorter cognitive distance represents greater similarity. As represented in Figure 16, “Exp.:Five” and “Exp.:Nine” metamodels have the longest cognitive distance, and “C.D.: In-Depth” and “C.D.: High-Level” have the shortest distance, demonstrating that the metamodels resulting from grouping participants based on the similarities in their social categories are considerably different, from metamodels resulting from grouping participants based on similarity of individual cognitive maps. Therefore, using different methods for grouping the participants based on their expertise (five groups vs nine groups) has led to structurally different aggregated models. In contrast, using different categorization schemes (In-Depth vs High-Level) has resulted in structurally similar aggregated models. In addition, the aggregated model with nine groups of expertise is structurally closer to the aggregated models based on cognitive diversity rather than an aggregated model with five groups of expertise (i.e., the cognitive distances between the Exp.: Nine and aggregated models based on the cognitive diversity is shorter in comparison with the cognitive distance between the Exp.: Five and the aggregated models based on the cognitive diversity). Furthermore, since aggregated models are dependent on the grouping methods, the intragroup and intergroup cognitive distances based on the participants' social categories or their cognitive maps have been calculated to provide deeper group-level insights. Intragroup/Intergroup distances are reported in Appendix J. Generally, the average intragroup cognitive distances are lower than the average intergroup distances for groups based on their cognitive maps. However, by grouping participants based on their expertise, a considerable number have higher average intragroup cognitive distances in comparison with average intergroup cognitive distances: four groups out of the nine groups of expertise and four groups out of the five groups of expertise have higher intergroup distances. This finding indicates a higher level of heterogeneity in the FCMs within groups of expertise based on the network structure assessment, particularly in the case of the “Exp.: Five” group. Calculated cognitive distance for each pair of metamodels.
Using the cognitive color spectrum tool, four different bar charts for each of the metamodels were produced to explore their similarities and differences contextually (Figure 17). Each color in the bar charts represents one of the 16 predefined categories and the length of each color demonstrates the relative share of each category based on the weighted absolute degree centrality. As shown in Figure 17, the metamodels follow approximately the same contextual pattern regarding the domination of different themes. For all of them, “Retail Sector” and “Food Security Outcomes” are the most dominant themes (i.e., there are more components and connections in the metamodels related to these themes). On the other hand, themes including “Governance and Policy,” “Systematic outcomes,” “Disposal and Waste,” “Community,” and “Economics” are less dominant (i.e., there are no or a few components and connections in the metamodels related to these themes). For a detailed definition of each theme, see Appendix D. Among all the metamodels, the metamodel from the five expertise groups (Exp.: Five) is the only metamodel that considered the “Governance and Policy,” and the metamodel from the nine expertise groups (Exp.: Nine) is the only metamodel that does not contain components or connections related to the “Disposal and Waste” and “Systematic Outcomes.” Cognitive color spectrum for each of the four metamodels. Each color is representative of a unique category and the length of color is representative of the relative share of the centrality of each category in each FCM.
Metamodel evaluation
The metamodel evaluation survey was completed by nine participants. Of the random sample of novel concepts, eight of the 20 were rated as important by less than half of the participants (Figure 18). The metamodel from five expertise groups had the most components rated by the majority as important (10/12), with the other metamodels encoding only two. Interestingly, two highly rated components were not present in any of the metamodels, and eight components rated as neutral/not important by the majority were in at least two metamodels. For example, the “Funding + Grants” component was in 14 individual maps and two of the metamodels but was rated mostly as neutral. This pattern shows an interesting difference in the concepts seen as significant in hindsight rather than those often discussed during modeling interviews. Importance rating of sampled components results from survey participants, compared to presence of component in the four metamodels (X in a green box means the component was part of the metamodel).
Considering the themes, the C.D.: High-Level metamodel had the highest verification to the Flint food system, with four “likes,” five “neutrals,” and no “dislikes.” Exp.: Nine and C.D.: In-Depth had a ratio of 3-5-1 likes, neutrals, and dislikes, respectively. Exp.: Five had the lowest scores from participants, with two dislikes (see full results in Appendix E). The average predicted scenario outcome is compared to the metamodels’ outcomes in Figure 19. Comparing the total differences across scenarios, the order of performance from best to worst is (1) C.D.: In-depth, (2) C.D.: High-level, (3) Exp.: 9, and (4) Exp.: 5. See full calculation in Appendix E. Comparison of the average outcome of scenarios predicted by survey participants and the actual scenario outcome values of the four metamodels.
Discussion
Technique comparison
Comparing the two metamodels based on expertise groups, the most obvious differences are in size. The effect of “double counting” some participants to create five expertise groups was an overrepresentation of components which led to a very large map. For example, if only two participants mentioned a component, but both were double counted into four different groups, then that component would be present in the metamodel. In contrast, splitting participants into nine, small groups meant that at least five participants must mention a component, and potentially more if multiple were in the same expertise group. In that sense, aggregating with nine expertise groups led to an underrepresentation of commonly mentioned components. For communicating results to participants and/or community members, a concise model with a limited number of concepts is advantageous, so aggregating with a higher number of expertise groups may be preferred depending on the research question and context, as the process creates a metamodel with absolute core concepts and connections. However, there is also a loss of model complexity, which is evidenced by the disconnected cluster centered around the “Quality of Life is Respected” component (see Figure 10). This is unexpected as the vast majority of participants’ FCM networks were fully connected. In a case where preserving complexity is preferred, aggregating with fewer groups is advantageous.
For the cognitive diversity metamodels, one difference is the saturation point. The high-level categorization scheme hit saturation at 12 participants, while the in-depth categorization scheme took 23 participants. This is unsurprising, as the key difference between the two schemes was the number and depth of dimensions to compare individual maps. Further evidence of the outcome of the categorization scheme is the tanglegram and final grouping. The two dendrograms have an entanglement factor of 0.58, which means that there is more misalignment of paired participants than alignment. Just under 50% of the participants were sorted into the same final group. Using simple linear regression to calculate a correlation coefficient for group membership, the two cognitive diversity groupings have a moderate correlation of 0.407. Comparatively, the nine groups based on expertise has correlation coefficients of 0.234 and 0.116 with the in-depth and high-level categorization groups, respectively (see Table 9 in Appendix F for a full breakdown of group membership). However, despite categorization differences that lead to two different groupings, the cognitive diversity metamodels have similar components and connections. There are relatively small differences between the two metamodels, which speaks to the influence of a few key categorization dimensions being very influential, and that the addition of more categorization depth has a relatively smaller influence on the ultimate model composition. Given this finding, we recommend that researchers and practitioners prioritize determining key dimensions or conceptual categories for their data. In this case, a more detailed and labor-intensive categorization scheme did inherently improve the metamodel.
Performance metrics
We can use network structure measures and micro-motifs as dimensions to evaluate how well the metamodels fit the expectations of complex systems. Generally, we would expect that complex systems have a comparatively higher density and lower C/N (Eden et al., 1992; Hage and Harary, 1983; Özesmi and Özesmi, 2004). Micro-motifs are also expected within complex systems, with higher numbers of simple structures like multiple causes and moderated effects, and comparatively lower counts of complex structures like bidirectional effects and feedback loops (Levy et al., 2018). This is not a universal rule so researchers and practitioners should use their knowledge, relevant literature, and other sources of system understanding to establish expectations for the specific system under study. The high-level cognitive diversity and nine expertise group metamodels performed best based on density and C/N, while the in-depth cognitive diversity and five expertise group metamodels had higher instances of micro-motifs.
Levy et al. found that more complex causal structures were underrepresented in experts’ maps, a finding that is reflected in this study (see Table 10 in Appendix I) (Levy et al., 2018). In general, the micro-motif count within the individual maps decreased in-line with Levy’s findings of micro-motif prevalence (e.g., a common micro-motif like multiple causes has a probability of 91.4% while more complex motifs like feedback loops has a 17.9% chance) (Levy et al., 2018). In contrast to Hamilton et al. (2022)’s finding of more feedback loops in aggregated cognitive maps than individual maps, we found very few feedback loops in the aggregated maps. This difference is likely due to dissimilarities in aggregation methodology and the modeled system. The large number of concepts, reflective of the multiscale system being modeled, made it unlikely for feedback loops to be preserved in the aggregated metamodel. Many participants modeled complex system dynamics through mediating components that “fell out” during aggregation. One area for further study would be techniques for preserving connections during the aggregation process.
To compare the four metamodel network structure and their contextual composition, “cognitive distance” and “cognitive color spectrum” tools have been utilized. By calculating the pairwise cognitive distance between every two metamodels, aggregated models were sensitive to the selected grouping method based on their expertise (longer cognitive distances); however, aggregation based on different categorization schemes was not very influential (shorter cognitive distances). Therefore, researchers using a top-down approach for creating aggregated models need to consider that social group or expertise may be a poor proxy for structural similarity of cognitive maps. When using the bottom-up approach for creating metamodels, we found that different categorization schemes may not lead to structurally different aggregated models. This may be due to key components within a few categories being highly influential to participant grouping, despite differences in categorization schemes. In general, comparing the intra-/intergroup cognitive distances (that considers the 281 components and all the possible connections between the components separately) confirms that PCA has grouped participants with similar cognitive map structure.
Despite metamodels having considerable differences in their network structure (such as the number of components, number of connections, and pairwise cognitive distances), different aggregation techniques have resulted in almost contextually similar metamodels that cover most of the predefined themes (regarding the cognitive color spectrum bar charts). For each of the four metamodels, “Retail Sector” and “Food Security Outcomes” are the dominant categories, which is unsurprising as many base components were in those categories. One takeaway from this result is that using different aggregating techniques can lead to the creation of structurally different cognitive maps, but the collective intelligence model still contains the major themes identified by participants (see Figure 20, in Appendix E). The critical differences are generally the less frequently mentioned themes.
Metamodel evaluation
While aggregating using five expertise groups and double counting participants led to the largest map with the most components, this metamodel was generally validated as the least similar to the Flint food system in terms of themes and scenario outcomes. A high number of components, and particularly presence of components that are perceived as important to depicting the food system, enables more detailed discussion of dynamics and more possible scenarios. However, the larger metamodel performed the worst for scenario outcomes, which could be the product of a few different things. First, the additional components and connections could be clouding or diluting critical system dynamics. Second, double counting could be amplifying incorrect perceptions of system dynamics by overrepresenting some interview participants. Regardless, the metamodels aggregated using cognitive diversity were validated as the most correct for both the scenario and themes section, with the in-depth categorization scheme performing the best overall. In general, the qualitative evaluation of themes seemed to be the least accessible way for community members and experts to compare metamodels.
Limitations and considerations
There are several key limitations of this study. First, consider the grouping of participants into multiple expertise groups. Group membership can be contrasted easily between the other three metamodels, but the “double counting” of participants makes it impossible to directly compare them. Secondly, when calculating cognitive distance, all the connection weights have been assumed to be positive despite the cognitive maps containing negative connections. Therefore, other methods of calculating network distances should be considered and developed (Tantardini et al., 2019). Approaches deriving from recent developments in graph signal processing (GSP) and graph neural networks (GNNs), which leverage correlations among multiscale features on non-Euclidean domains, form a promising line of research into FCM and complex systems modeling more generally. Such methods expand the space of network features which, perhaps counterintuitively, enables more nuance in the comparison, clustering, classification, and communication of such. The merits of these methods have been demonstrated in the analysis of protein networks, the C. elegans neural connectome, and social networks (Brugnone et al., 2019; Gao et al., 2019; Zhang et al., 2021). Natural extensions of these methods will enable researchers to employ far more of the information in each cognitive map in comparison, for instance, of those of varied size. Associated theory (from, for example,, the scattering transform literature of Perlmutter et al., 2019; Bruna and Mallat, 2013) should further enable the identification and reduction of researcher bias in these contexts, while simultaneously increasing their specificity and range of use. There is great potential for insight into complex systems like the Flint food system via the overlap of perspectives in FCM and GSP.
One consideration for interpreting the results is the number of novel concepts. With almost 300 components, comparison of individual models can be difficult. While it was important for this specific system to preserve details to inform the creation of detailed sub-models, further concept standardization using broad terms would shift how individual models are compared and the resulting metamodel. As previously discussed, there were relatively few feedback loops in the metamodels which would likely increase with fewer components. Another consideration is the nature of the expertise pool, as the participants of this study naturally have unclear delineation in expertise or stakeholder group. It is impossible to have knowledge of a food system that exists in a vacuum, as we all bring sociocultural experiences with and perspectives on food into discussions. In a different system with more distinct roles or types of experience, identity diversity might serve as an adequate proxy for cognitive diversity.
Model selection
Considering all the above factors, which is the “best” metamodel? Unsurprisingly, there is no simple answer. There are three key dimensions when considering the value of a model: (1) the fit for the system and use, (2) the similarities to a complex system, and (3) the accuracy to the real-world system being studied. One consideration is the constraints on the study, for example, the amount of time, resources, and expertise available to the research team, as well as urgency for results. Categorizing components to determine cognitive diversity can be a time-intensive process depending on the number of components and relies on subject matter expertise by researchers. The PCA process also requires a level of quantitative proficiency. Especially in a study with a fast deadline, for example, in the case of a shock or crisis, aggregating by self-identified identity diversity would be a much quicker process. A second consideration would be the audience; who is learning from and/or using the information generated by the model? In general, FCMs can be developed and communicated largely in lay terms and with simple logical heuristics that are fairly intuitive and easy to understand. If results are going to be shared with community members who have not been privy to the modeling process, a more simplistic model with fewer components and connections will be a better communication tool.
Aggregation methods can also be informed by the goals or purpose of the research. If the goal is to model the real system, or to inform a quantitative modeling technique, a more complex, difficult to visually interpret model may be appropriate. Depending on the research questions, it may be more or less important to achieve a model that reflects complexity or similarity to the real-world system. Markers such as network structure measures, micro-motifs, themes, and scenario outcomes are less relevant if the goal is to compare the knowledge and understanding of specific stakeholder groups, or if FCM is being used as a tool to facilitate discussion. In sum, there is a key trade-off between model size and complexity, as model size and density rise, legibility decreases. However, a more complex system enables more analysis options for running scenarios and is often needed to accurately capture system dynamics. For the purposes of the Flint Leverage Points Project, aggregating by cognitive diversity using the in-depth categorization scheme was selected due to the balance between visual legibility and complexity, and how the model captured the Flint food system when validated alongside other research results. While the model is not as accessible as the metamodel generated by using the nine expertise groups, the complexity is needed to explore a variety of scenarios based on leverage points, which is the ultimate goal of the project. A smaller model is not sufficient for the primary need, so extra effort can be put into explaining and breaking down the final aggregated model to overcome the negatives of that trade-off.
Conclusion
Fuzzy cognitive mapping and the aggregation of individual maps into a collective intelligence model can be applied to many socio-environmental systems. Participatory modeling using FCM can improve the outcomes of modeling efforts in several ways: (1) modeling can follow an equitable engagement process to incorporate diverse knowledge sources for a more holistic understanding of systems, community knowledge, and values, (2) the products of participatory modeling can be improved system understanding, communication tools, and exploration of interventions to support decision-making, and (3) decisions based in participatory modeling can be high-quality with more acceptability, as stakeholders were directly involved and the decision-making process is more explicit and transparent (Aguilar, 2005; Gray et al., 2012, 2015; Gregory, 2000; Mourhir, 2020). The gap in FCM methodology we addressed is an analysis of how best to aggregate individual maps to help achieve these desirable outcomes. We conclude that aggregating by expertise group, or another marker of identity diversity, is ill-suited for modeling real-world systems with diverse knowledge holders. In those cases, double counting participants or creating many groups results in under- and overrepresentations of components. Developing a categorization scheme as the basis of aggregating by cognitive diversity is extremely influential, and analysts should ensure that key categories are appropriately reflected.
Ultimately, researchers and practitioners should carefully consider the trade-offs with resource inputs, communicability, and complexity when deciding what is the most appropriate aggregation technique that meets the needs of their work and the nature of the specific system. Methodological innovations for FCM are constantly expanding, which increases the possibilities for where and how FCM can be applied. To address societal issues like food insecurity, we need tools that take systems lenses and engage stakeholders to deepen our understanding of systems, evaluate interventions, and implement effective leverage points. FCM offers an accessible and flexible method for participatory research that can combine diverse perspectives to accurately represent complex systems and provide a basis for equitable decision-making. A core challenge of wicked problems is the inextricable link to complex socio-environmental systems, which makes tools for systems work vital to ensuring a sustainable future.
Supplemental Material
Supplemental Material - Modeling complex problems by harnessing the collective intelligence of local experts: New approaches in fuzzy cognitive mapping
Supplemental Material for Modeling complex problems by harnessing the collective intelligence of local experts: New approaches in fuzzy cognitive mapping by CB Knox, Steven Gray, Mahdi Zareei, Payam Aminpour, Renee V Wallace, Jennifer Hodbod and Chelsea Wentworth
Footnotes
Acknowledgments
We thank the members of the Flint community who shared their insights and time, and the members of the Community Consultative Panel who assisted in this research by participating and offering feedback on data collection and results. We would also like to thank all research team members of the Flint Leverage Points Project, and Dr. Nathan Brugnone for his insights throughout the review process.
Declaration of conflicting interests
The author(s) declared no potential conflicts of interest with respect to the research, authorship, and/or publication of this article.
Funding
The author(s) disclosed receipt of the following financial support for the research, authorship, and/or publication of this article: This research was funded by the Foundation for Food and Agriculture Research [FFAR 10.13039/100011929 FFAR No. 560827] and was conducted in partnership with the Community Foundation of Greater Flint.
Open Practices
The raw data and analysis code used to conduct analyses for this manuscript are available upon request. The questionnaires/research instruments used to collect these data are also available upon request. This study was not pre-registered in any data base.
Data availability statement
Data is available via Open Data Flint: ![]()
Supplemental Material
Supplemental material for this article is available online.
References
Supplementary Material
Please find the following supplemental material available below.
For Open Access articles published under a Creative Commons License, all supplemental material carries the same license as the article it is associated with.
For non-Open Access articles published, all supplemental material carries a non-exclusive license, and permission requests for re-use of supplemental material or any part of supplemental material shall be sent directly to the copyright owner as specified in the copyright notice associated with the article.