
Abstract
Background
A growing body of research has identified behavioral markers of collective intelligence to diagnose the quality of group collaboration in real time. Prior work suggests that real-time collaborative process metrics may be used not only to measure and predict the collective intelligence of a group, but also to improve team performance through targeted interventions.
Purpose
This research examines whether providing teams with real-time feedback on their collaborative process metrics improves performance and collective intelligence in a dynamic team task.
Research Design
We conducted two experiments in which teams collaborated on an online search and rescue task. Experimental conditions varied whether teams were exposed to real-time displays of their collaborative process metrics.
Study Sample
Participants were organized into teams and completed the task in an online experimental environment.
Data Collection and/or Analysis
We collected behavioral trace data capturing team interactions and computed real-time collaborative process metrics. Team performance and collective intelligence were analyzed across experimental conditions to assess the effects of feedback exposure.
Results
Contrary to expectations, real-time feedback did not uniformly improve collaboration quality or performance. In several instances, teams over-corrected their behavior in response to feedback on a single dimension, which negatively impacted other dimensions of collaboration and reduced task performance.
Conclusion
These findings suggest that real-time digital nudges aimed at improving collaboration can produce unintended consequences. Caution is warranted when deploying process-level, real-time interventions, as optimizing one collaborative dimension may disrupt others and undermine collective intelligence.
Introduction
Collaboration has become the engine of innovation in every corner of society. Increasingly, scientific insights, patent applications, and even Nobel prizes are the products of collaboration (Council, 2015; Nobel Prize Outreach AB, 2025; Wuchty et al., 2007). This trend also extends to the workplace, where over 65% of work is organized around teams globally (Goodwin, 2023) and over 84% of US workers collaborate with colleagues on the job (Herway et al., 2019). This growth in collaboration has been driven by an exponential increase in global connectivity (Altman and Bastian, 2024), enabled by technology (Malone, 2018), which has also driven the information revolution, resulting in more and more specialization in many fields and the concomitant need for mechanisms to integrate expertise (Jones, 2009; Wuchty et al., 2007). At the same time, the world experienced an explosion in distributed work arrangements made necessary by the COVID-19 pandemic, and now is still in use by over 80% of organizations worldwide (Deloitte, 2024). Consequently, collaboration occurs in many forms—colocated versus distributed, synchronous versus asynchronous—leading some to urge researchers to abandon traditional static notions of “teams” and understand collaborative groups as complex, adaptive systems (Arrow et al., 2001; Mathieu et al., 2019) and to focus on “teaming” as an activity instead of teams as an entity (Edmondson, 2012; Wageman et al., 2012).
Related work has urged the field to evolve from a focus on evaluating collaboration based on team performance—typically measured based on overall quality or efficiency of output resulting from a complex multifaceted process (Cohen and Bailey, 1997; Mathieu et al., 2008)—to instead view it through the lens of collective intelligence (CI) (Woolley et al., 2015). Social scientists focused on improving the quality of collaborative work have increasingly drawn on concepts of intelligence in their theorizing (Csaszar and Steinberger, 2022), as that literature has studied the functions that enable complex systems to adapt and accomplish goals in dynamic environments (Legg and Hutter, 2007). And with the rapid growth in the need for collective action and collaboration to address problems across all layers of society, we urgently need to evolve our understanding of the contributors to the quality of these processes from the simplistic, deterministic impact of structures or resources to the mutually-adaptive systems comprising collective intelligence (CI).
Toward this end, recent work has articulated the Transactive Systems Model of Collective Intelligence (TSM-CI), conceptualizing CI as emerging from the co-adaptation of collective memory, attention, and reasoning systems, each of which evolve on the basis of separate but interdependent influences from the collaborators and the environment (Woolley and Gupta, 2024). Related work based on this model has identified observable collaborative process behaviors that can be used as a composite to diagnose the current and future state of CI in a collaborating group (Zhao et al., 2023) as well as individually to evaluate the outcomes of interventions targeting specific individual processes (Gupta et al., 2024).
In this paper, we integrate recent work establishing the observable collaborative process indicators for CI, which we refer to in combination as the Team Effectiveness Diagnostics (TED), with adjacent work on the benefits of real-time feedback displays as interventions to improve the quality of group collaboration (DiMicco and Bender, 2007; Glikson et al., 2019). In the behavioral sciences, nudges are typically defined as interventions that alter behavior by changing how information or choices are presented, without restricting options or materially changing incentives (Thaler and Sunstein, 2021). While nudges have been shown to influence individual decision-making in many domains, their effects are often context-dependent and may produce unintended consequences when applied to complex, dynamic systems such as collaborative team settings.
In the two studies we present in this paper, we manipulate whether collaborating groups receive real-time feedback based on one or a combination of the TED metrics to evaluate the resulting impact on the quality of their collaboration and their overall performance. In our first study, we found that providing real-time feedback on the three different TED components did not improve collaboration or performance relative to the control group (which received no feedback). We reasoned that this may be due to the amount and complexity of the information, and so in Study 2 we limited the real-time feedback condition to only receive information about collective effort (the component most strongly associated with performance overall). However, we were surprised to observe that providing feedback on collective effort only led groups to over-emphasize effort at the expense of the other collaborative process dimensions (task strategy and skill use) ultimately hurting performance.
Our findings have important implications for the literature on collective intelligence and its application to interventions for improving team performance. First, our findings demonstrating the difficulty of conveying clear leverage points for improving CI reinforces our theoretical understanding of the complex adaptive systems underlying collective intelligence (Woolley and Gupta, 2024). Second, in terms of application, our findings suggest that technological interventions need to be deployed with extreme caution, as we observed. Rather than responding in the moment to a specific indicator, interventions need to prompt more systemic adjustments, likely involving the collective reflection and adaptation of multiple elements. Finally, future research could examine alternative ways such feedback might be used to improve collaboration, possibly through integration with effective coaching interventions that are administered at appropriate times in the group’s life cycle (Hackman and Wageman, 2005).
Related research
For decades, collaboration has been considered synonymous with teamwork, where a team was defined as a clearly identified (or “bounded”) group of contributors that share responsibility for accomplishing common goals (Hackman, 1987; Mathieu et al., 2008). Though many researchers have always focused on successful goal accomplishment as the definition of team performance, some have argued for a broader conceptualization of team effectiveness, pointing out that more sustained performance would also require that the team learns and improves in their work together over time (refer to as “performance behaviors” (Mathieu et al., 2008)) and that individual members’ needs and goals are satisfied by their work on the team (Hackman, 1987).
However, over the past three decades, dramatic shifts in how collaboration occurs in many settings are at odds with the traditional concepts of “team” or “teamwork” along with the basis of team effectiveness. Globalization, together with the global connectivity that enables it, ushered in the information revolution and the resulting radical increase in specialization across many fields (Jones, 2009). Organizations discovered that they could draw on expertise from anywhere in the world, leading to a dramatic rise in the use of virtual and globally distributed teams. The use of teams began increasing exponentially in science and engineering in the 1980s, with social science and management soon following in the 1990s, reflecting similarly expanded use of teams in organizations (Council, 2015; Nobel Prize Outreach AB, 2025; Wuchty et al., 2007). However, due to a constantly changing set of contributors whose involvement in the work varies significantly in terms of length of time, extent of contribution, and accountability for outcomes, these collaborations bear little resemblance to traditional concepts of teams, with important implication for how to define or measure team performance or team effectiveness in order to create the conditions for it.
Recent research has proposed that given our growing understanding of teams as complex adaptive systems, it is no longer useful to examine the quality of collaboration on the basis of more narrowly defined performance outcomes, nor on the basis of more traditional concepts of team effectiveness which assumes a more stable, ongoing entity. Instead, social scientists focused on improving the quality of collaborative work have increasingly drawn on concepts from research on intelligence in their theorizing, as that literature has, for decades, studied the functions that enable systems to adapt and accomplish goals in dynamic environments. And with the rapid growth in the need for collective action and collaboration to address problems across all layers of society, we urgently need to evolve our understanding of the contributors to the quality of collective functioning from the simplistic, deterministic impact of structures or resources to the mutually-adaptive systems comprising collective intelligence (CI).
Intelligence, whether in the context of an individual, a collective, or a technological system, is broadly defined as the ability to perform or achieve goals in a wide range of environments (Legg and Hutter, 2007). The Transactive Systems Model of Collective Intelligence (TSM-CI) posits that CI arises from three distinct but interconnected collective cognitive systems: the Transactive Memory System (TMS), Transactive Attention System (TAS), and Transactive Reasoning System (TRS). These systems dynamically regulate the cognitive resources distributed among group members, ensuring efficient coordination, adaptive responses to environmental changes, and sustained motivation.
Each of the transactive systems operates outside of explicit awareness via the perceptions and judgments that drive collaborators’ behavior. These qualities make it impossible for an observer to directly assess the functioning of a given transactive system, compounded by the common difficulties of diagnosing and intervening in any complex adaptive system. These difficulties underscore the need for valid indicators of system functioning to help serve as diagnostics to guide potential interventions.
Building on classic models of team effectiveness, extant research has identified and explored three collaborative process indicators that are significant predictors of CI: (1) the sufficiency of the collective effort members are expending in carrying out collective work; (2) the appropriateness of task performance strategies, or how efficiently and effectively collaborators are coordinating their inputs to achieve shared goals; and (3) whether the collective is making the best use of knowledge and skill of the collaborators in carrying out collective work.
Recent work demonstrates that these three collaborative processes provide observable signals of the ongoing function of the underlying transactive systems. Like the systems underlying them, the three collaborative process indicators do not operate in isolation, and monitoring them in combination provides real-time information about the functioning of the underlying, largely unobservable complex adaptive system.
We integrate this extant work demonstrating the utility of these collaborative process indicators with adjacent work on the benefits of real-time feedback displays as interventions to improve the quality of group collaboration (DiMicco and Bender, 2007; Glikson et al., 2019). Extant research on team coordination has demonstrated the potential benefits of various kinds of interventions for improving the quality of team collaboration and performance (Goh et al., 2013; Woolley, 1998). Recent work has tested approaches to monitoring team coordination to determine the timing of appropriate interventions and improve their performance benefits (Gorman et al., 2020; Wiltshire et al., 2024).
Related studies involving technology-based interventions, including real-time feedback displays focusing on relative speaking time and task engagement (DiMicco and Bender, 2007; Glikson et al., 2019), have reinforced the benefits of real-time feedback and its positive impact on team performance. However, some of these studies have yielded mixed results, where in some cases technology-based interventions are ineffective or even backfire (Gupta et al., 2019). That said, extant work has not yet tested the impact of providing real-time feedback based on the collaborative process metrics predicting CI. Leveraging these unobtrusive measures to enhance CI could serve as a very valuable way to improve performance in a wide variety of settings, and thus exploring their potential application could have significant implications for future research and application.
Overview of studies
We conducted two experiments to evaluate the effects of providing real-time feedback via collaborative process metrics to collaborators as they worked together on the quality of collaboration and performance. We specifically used the three collaborative process metrics—Effort, Skill utilization, and task Strategy developed and demonstrated to predict CI in existing research (Gupta et al., 2019; Riedl et al., 2021; Zhao et al., 2023) which we refer to in combination as Team Effectiveness Diagnostics (TED). In both experiments, participants collaborated in teams of four in an online game where they performed a search and rescue mission, adapted from an individual search and rescue real-time decision-making task (Nguyen and Gonzalez, 2023).
In the first experiment, half of the teams received real-time feedback on all three TED metrics simultaneously, with the metrics updated in near real-time throughout the team’s work. In the second study, we only provided real-time feedback on collective effort (the dimension most strongly related to overall performance) to limit cognitive load, and also tested three alternative visualizations of the metric. Both experiments produced surprising results, which we will reflect upon further in the discussion of each experiment.
We will provide an overview of the methods of each experiment together to make it more concise and easy for the reader to comprehend, and then review the results of each experiment in turn.
Methods
Experimental task: Team Minimap
In both experiments, participants collaborated on the Internet in teams of four in a multiplayer adaptation of a Search and Rescue task in the Minimap environment developed by Nguyen and Gonzalez (2023), herein referred to as the Team Minimap task. The players navigated through a grid environment to search for and rescue victims of three types that varied in the severity of their condition and the amount of effort required to save them. Players had no way to communicate verbally with each other during the game. Participants were assigned to one of two distinct roles, medic or engineer that varied in their capabilities. Medics were able to rescue victims of any color, but needed the engineer to be present next to them in order to rescue the most severe (red) victims, which had to be saved during the first 3 minutes of the mission. Engineers had unique capabilities to remove the rubble that created barriers to finding victims, but were only able to triage the least severely injured victims independently (see Appendix for more details on the game). Each team’s goal was to maximize the points earned by collaborating to find and rescue as many victims as possible during their five-minute mission, where more severely injured victims earned more points but required more resources for rescue. Doing so required coordinating tasks that varied in levels of interdependence. The full task and partially observed view available to participants are shown in Figure 1. The (a) full view of the map and (b) partially observed participant view of the Minimap Environment.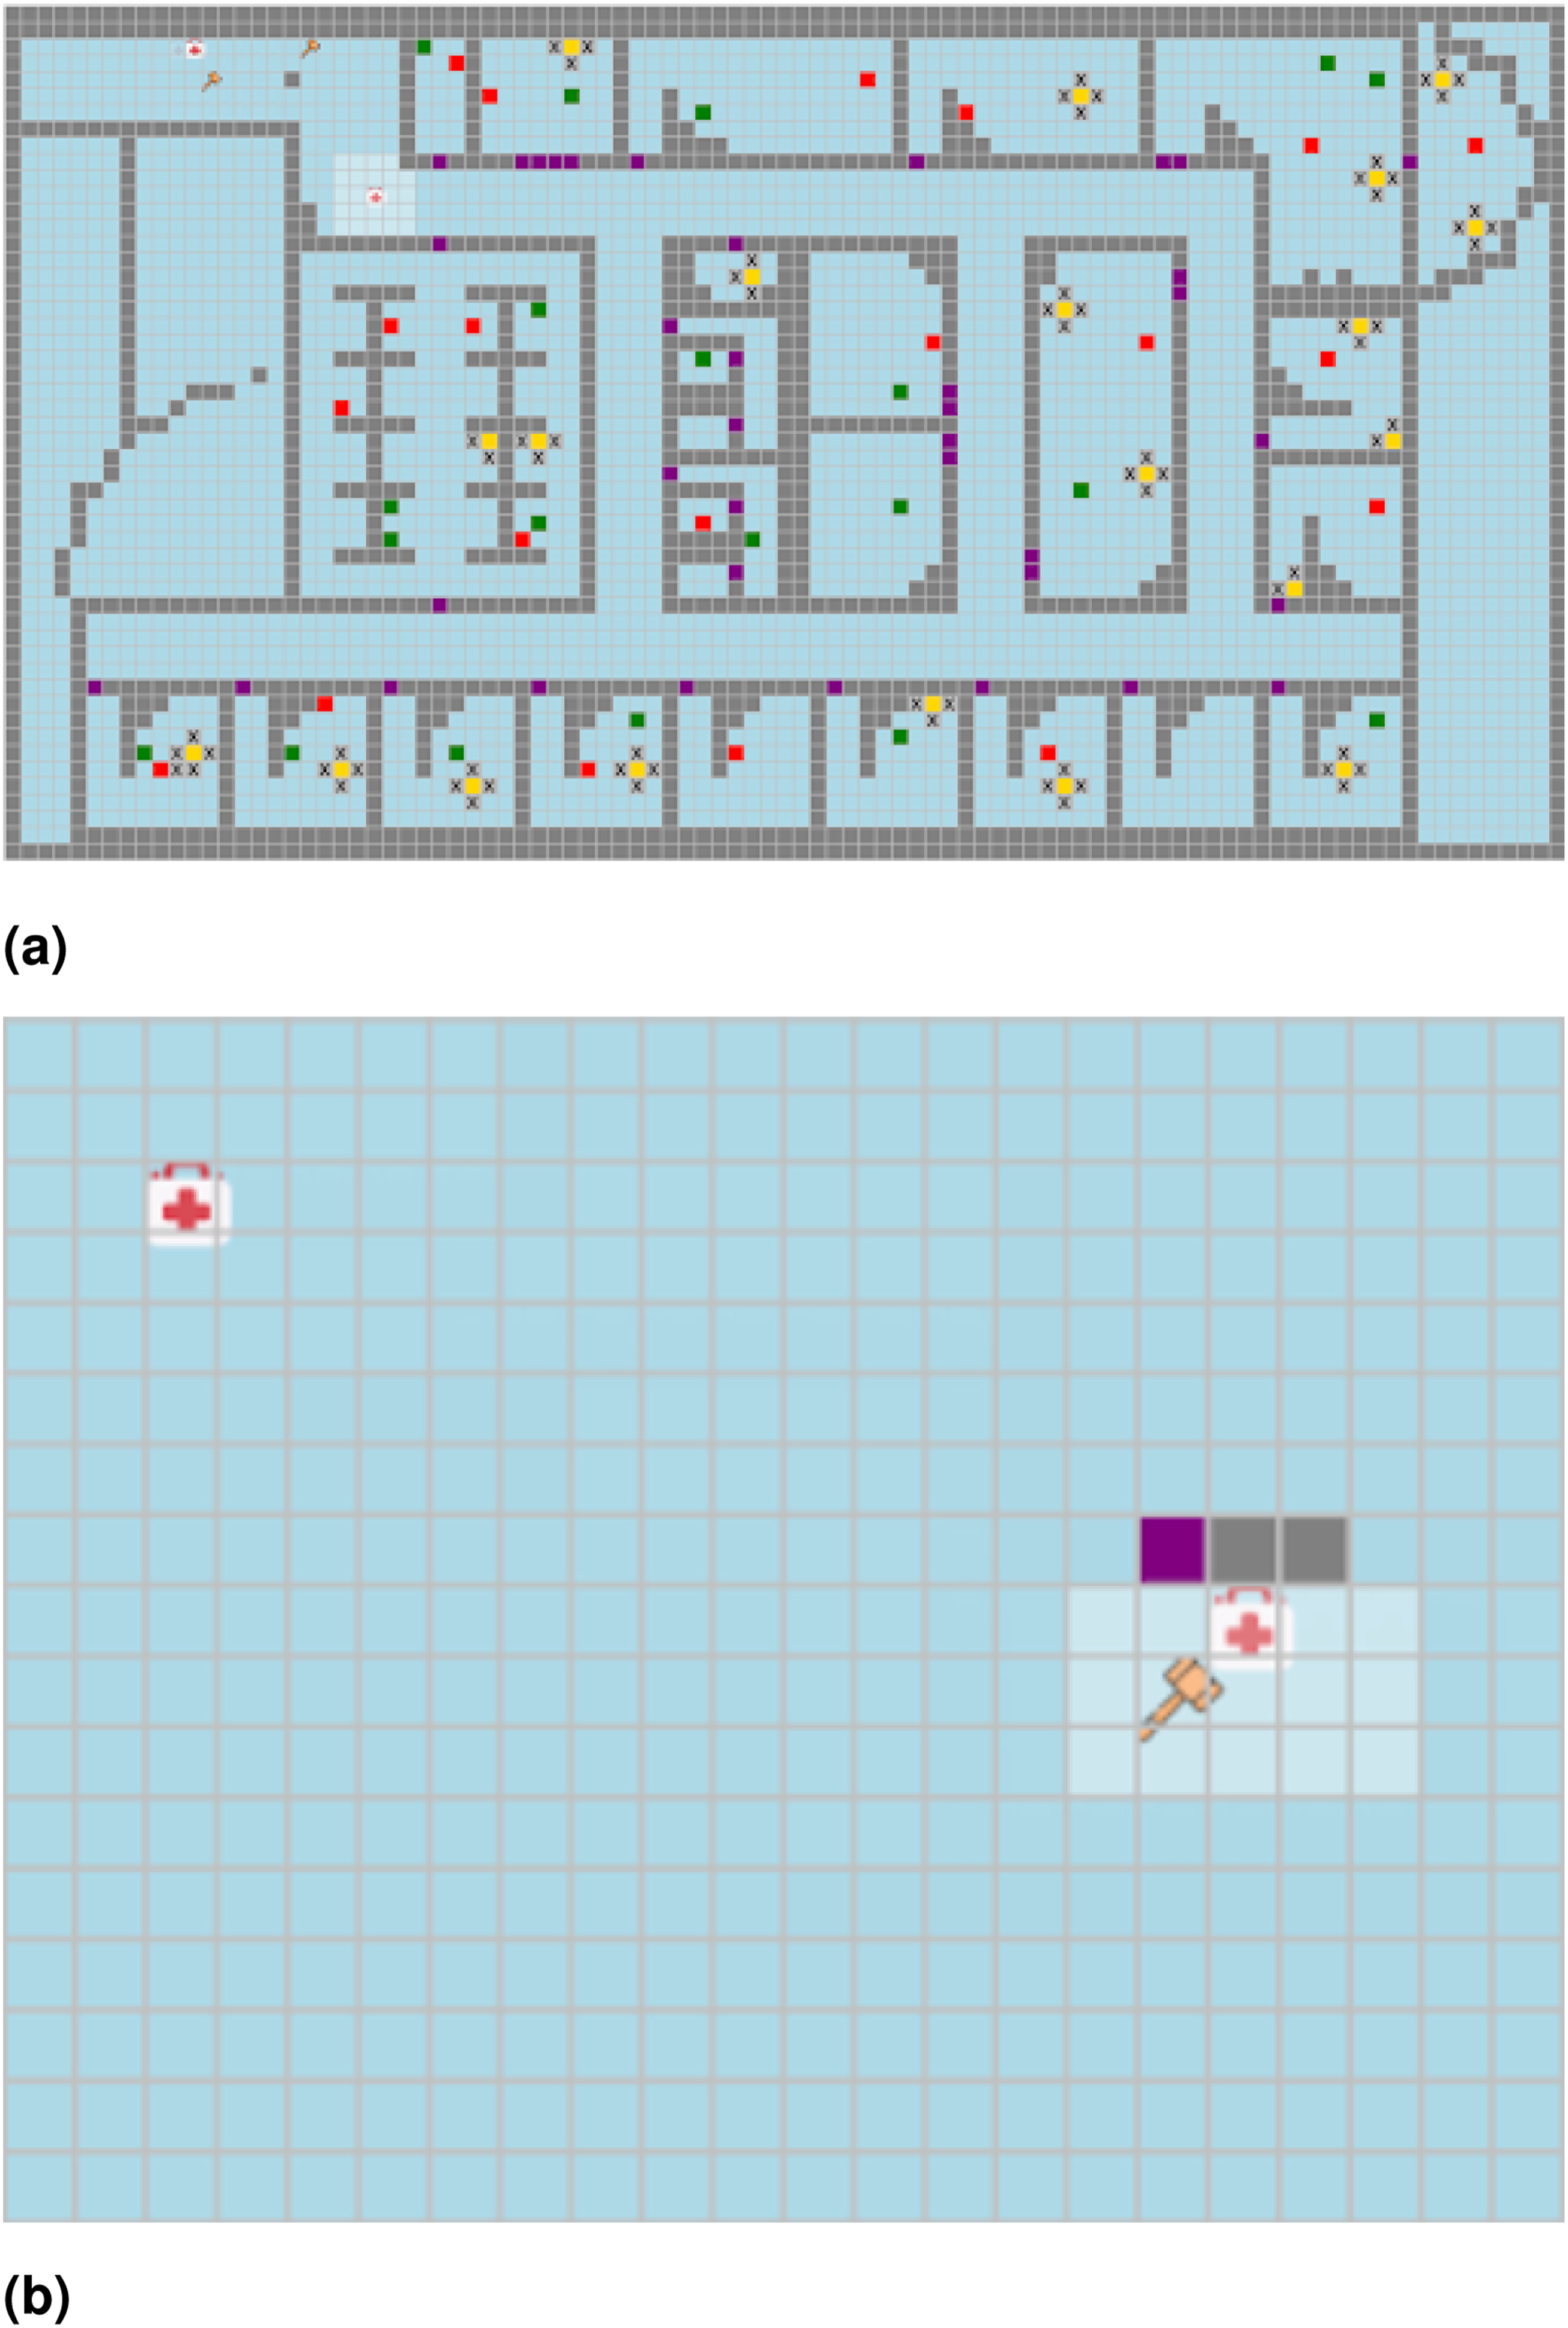
Participants
The experiments were approved by Carnegie Mellon University’s IRB, approval number CR202400000013. We recruited participants from Amazon Mechanical Turk who were assigned to teams of four via an online waiting room in which participants would wait for up to 10 minutes as interested players were gathered and then were assigned to a team and launched into the game. If a participant was not assigned to a team within 10 minutes, they received a base payment and was released. If any player disconnected or left the study before completion, the data for their team were excluded from our analysis. In Study 1, we had 25 teams complete the mission in the experimental condition (TED (Full); a total of 100 participants, 41% female, 2% non-binary; average age 40.49 ± 12.44) and 28 teams in the control (No TED; a total of 112 participants, 44% female, 1% non-binary; average age 39.74 ± 11.07). In Study 2, we had an additional 57 teams participate in the TED (Effort) condition (a total of 228 participants; 44% female, 1% non-binary; average age 39.41 ± 10.96). Teams were randomly assigned to receive real-time feedback on Effort through one of three different visual display formats; see Figure 3.
Study design and procedures
Design
In both Experiments 1 and 2, teams in the experimental condition received real-time feedback based on TED metrics as they complete two five-minute missions administered in Team Minimap, and we compare the quality of team collaboration and performance of the experimental condition with a control condition that receives no real-time feedback. In Study 1, teams in the TED (Full) condition see real-time feedback for all three TED metrics (effort, strategy, and skill) on the three-panel gauge display, shown in Figure 2. Each measure is detailed below. In Study 2, teams in the TED (Effort) condition receive real-time feedback on the Effort metric only. We also varied the visual presentation of the information to test the effect of the display format (see Figure 3 for the three variations used.) The participant’s view of the three-gauge display in TED (Full) study. The value shown on the gauge was updated every 3 s with the previous interval’s team-level measures. The effort displays shown in the TED (Effort) study.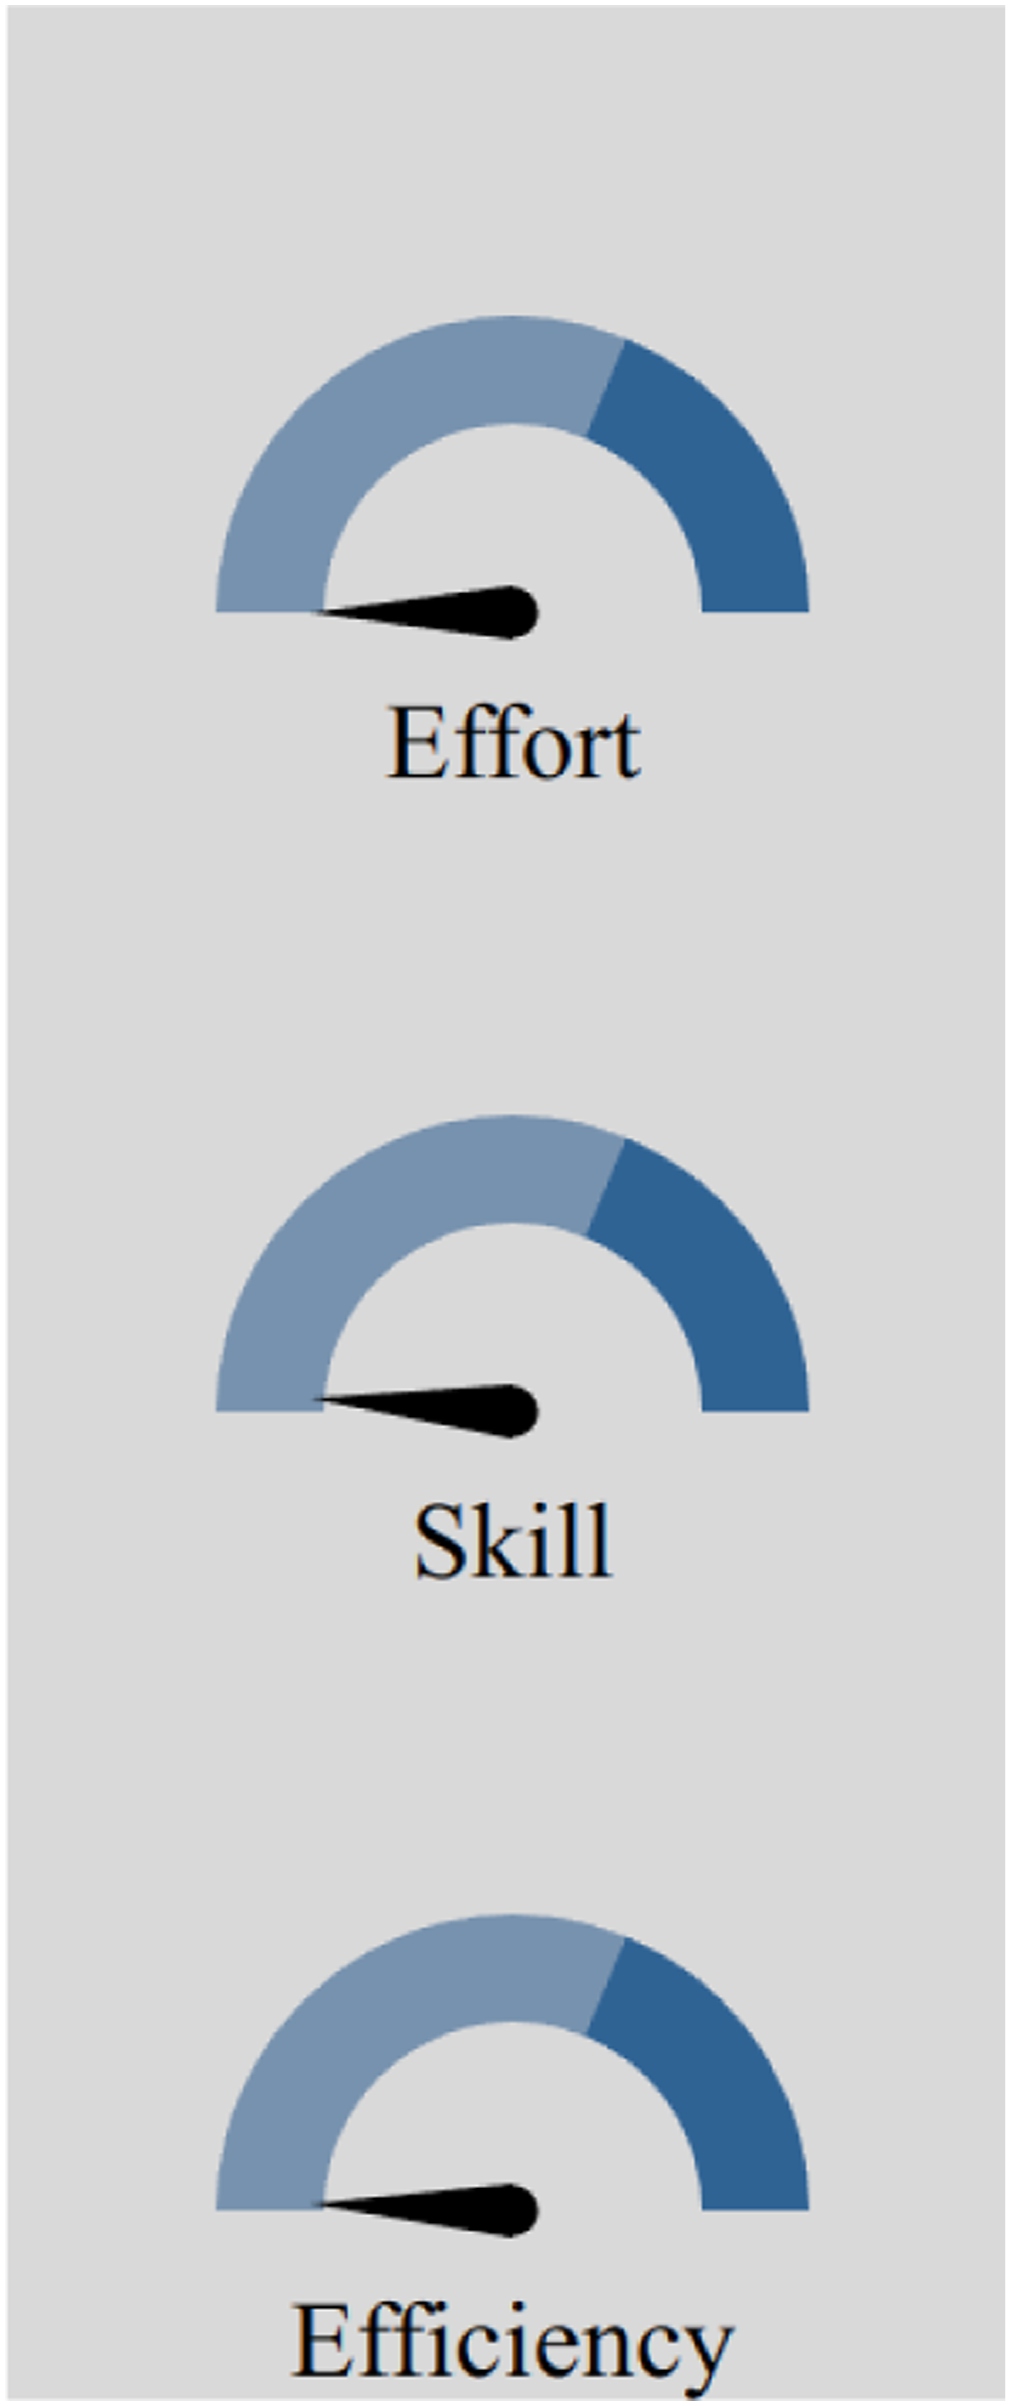

Procedures
In both Study 1 and Study 2, participants first provided demographic information and then received instructions for the Team Minimap mission. The instructions were generalized to include information about all roles in the task. They were then assigned to a group of 4 players, and completed two identical 5-min missions in Team Minimap. Their roles were assigned at the start of the first mission and were held constant throughout the two missions. After the missions were finished, participants completed a short post-task survey collecting participant perceptions of their team and our real-time feedback displays and were released. Although we do not present an analysis of the survey data, the full details of what was collected are available in Appendix.
TED metrics
The real-time feedback provided to teams in the experimental condition were based on the TED metrics initially developed in extant literature (Glikson et al., 2019; Gupta et al., 2019; Riedl et al., 2021) which in composite predict collective intelligence and team performance, by design. We also confirmed in initial tests that they are correlated with team performance; skill use has a positive but nonsignificant correlation with performance r = 0.26 (p < 0.1), while effort and strategy were much more strongly related, r = 0.47 (p < 0.01) and r = 0.86 (p < 0.01), respectively. Each measure is calculated in the context of Team Minimap as described below. In the displays to participants, each measure was normalized to be between 0 and 1 using min–max normalization with the maximum attainable values over the calculated interval.
Effort was measured for each three-second interval throughout each mission based on the aggregated number of keystrokes and associated game actions performed by each player. Different actions required different levels of effort. For example, triaging a low-severity victim required 10 keystrokes, while triaging more severely injured victims required 20 keystrokes. For an engineer, removing rubble required 5 keystrokes, and for any player opening a door required 1 keystroke. Player movement is factored into their Effort as 1 keystroke per tile covered, or if players utilized their speedup capability that total was doubled. Players only received Effort credit for successful actions—when a door is successfully opened or a victim is successfully triaged, each player involved gets Effort credit for the associated number of keystrokes.
Strategy captures the efficacy of members’ collaboration to accomplish the varied goals in the mission. Here, we break strategy into two important components: synergistic gain and exploration gain. Synergistic gain is based on player activities that enable teammates to perform their tasks. Activities that result in synergistic gain are unique to each role. For engineers, synergistic gain is based on the proportion of each time interval spent clearing rubble, standing next to a red victim, or opening doors, as all of these actions allow the medics on their team to do their tasks more efficiently. For medics, synergistic gain is based on the proportion of the total possible victims saved at each interval, as medics are uniquely capable of saving certain victims but enable engineers to save others only if they are present. In addition to synergistic gain, exploration gain represents how much time a player spends discovering new and unexplored territory which can be very valuable for enhancing opportunities for team goal accomplishment. For both medics and engineers, exploration gain is based on the proportion of positions visited that have not been previously visited by any team member. A Strategy score for each player is calculated as a linear combination of both gain measures.
Skill Use is based on the degree to which team members use the unique knowledge and capabilities that come with their assigned role, as doing so results in more efficient work and effective outcomes than if members try to do tasks primarily themselves. In the Team Minimap context, Skill Use is based on the proportion of time players spend using their unique and specialized skillsets. For the engineer, Skill Use is based on the proportion of time spent clearing rubble, opening doors, and using their speed-up to move faster; for the medic, Skill Use is based on the proportion of time spent rescuing victims only they can rescue as well as using their speed-up.
Results
Study 1: No TED versus TED (Full)
In Study 1, we compared the control condition (No TED) to TED (Full), the experimental condition where teams received real-time feedback on all three metrics.
Figure 4 displays the average score by condition, based on the total number of points teams earned in the task by rescuing victims, as described in Section. A two-sided Mann–Whitney test reveals no significant differences (p > 0.05) between the scores in the two conditions. We did not find evidence to support our prediction that providing real-time feedback based on the three TED metrics would improve team performance. Average game score in the No TED and TED (Full) conditions. Score is increased by rescuing victims. *p < 0.05, **p < 0.01, ***p < 0.001, ****p < 0.0001.
To further explore teams’ behavior in these two conditions, we evaluated each of the individual collaborative process metrics for evidence of influence related to the feedback provided by each TED metric. Figure 5 displays the comparison of scores on each metric by condition. As shown in the figure, teams in the TED (Full) condition achieved higher levels of Effort (p < 0.01, U-statistic = 3369, biserial-rank correlation r = 0.22) and Skill Use (p < 0.01, U = 3289, r = 0.24) on average than teams in the No TED condition; however, there was not a significant difference in Strategy (p > 0.05, U = 4653, r = −0.10). Based on this overview, we noted that it did appear that the real-time feedback on TED metrics influence teams collaboration as it related to Effort and Skill Use, even though it did not have a significant effect on overall performance. The TED metrics for No TED and TED (Full). Effort is shown in (a), Skill in (b), and Strategy in (c). The average over each 3 second interval is shown for each measure. *p < 0.05, **p < 0.01, ***p < 0.001, ****p < 0.0001.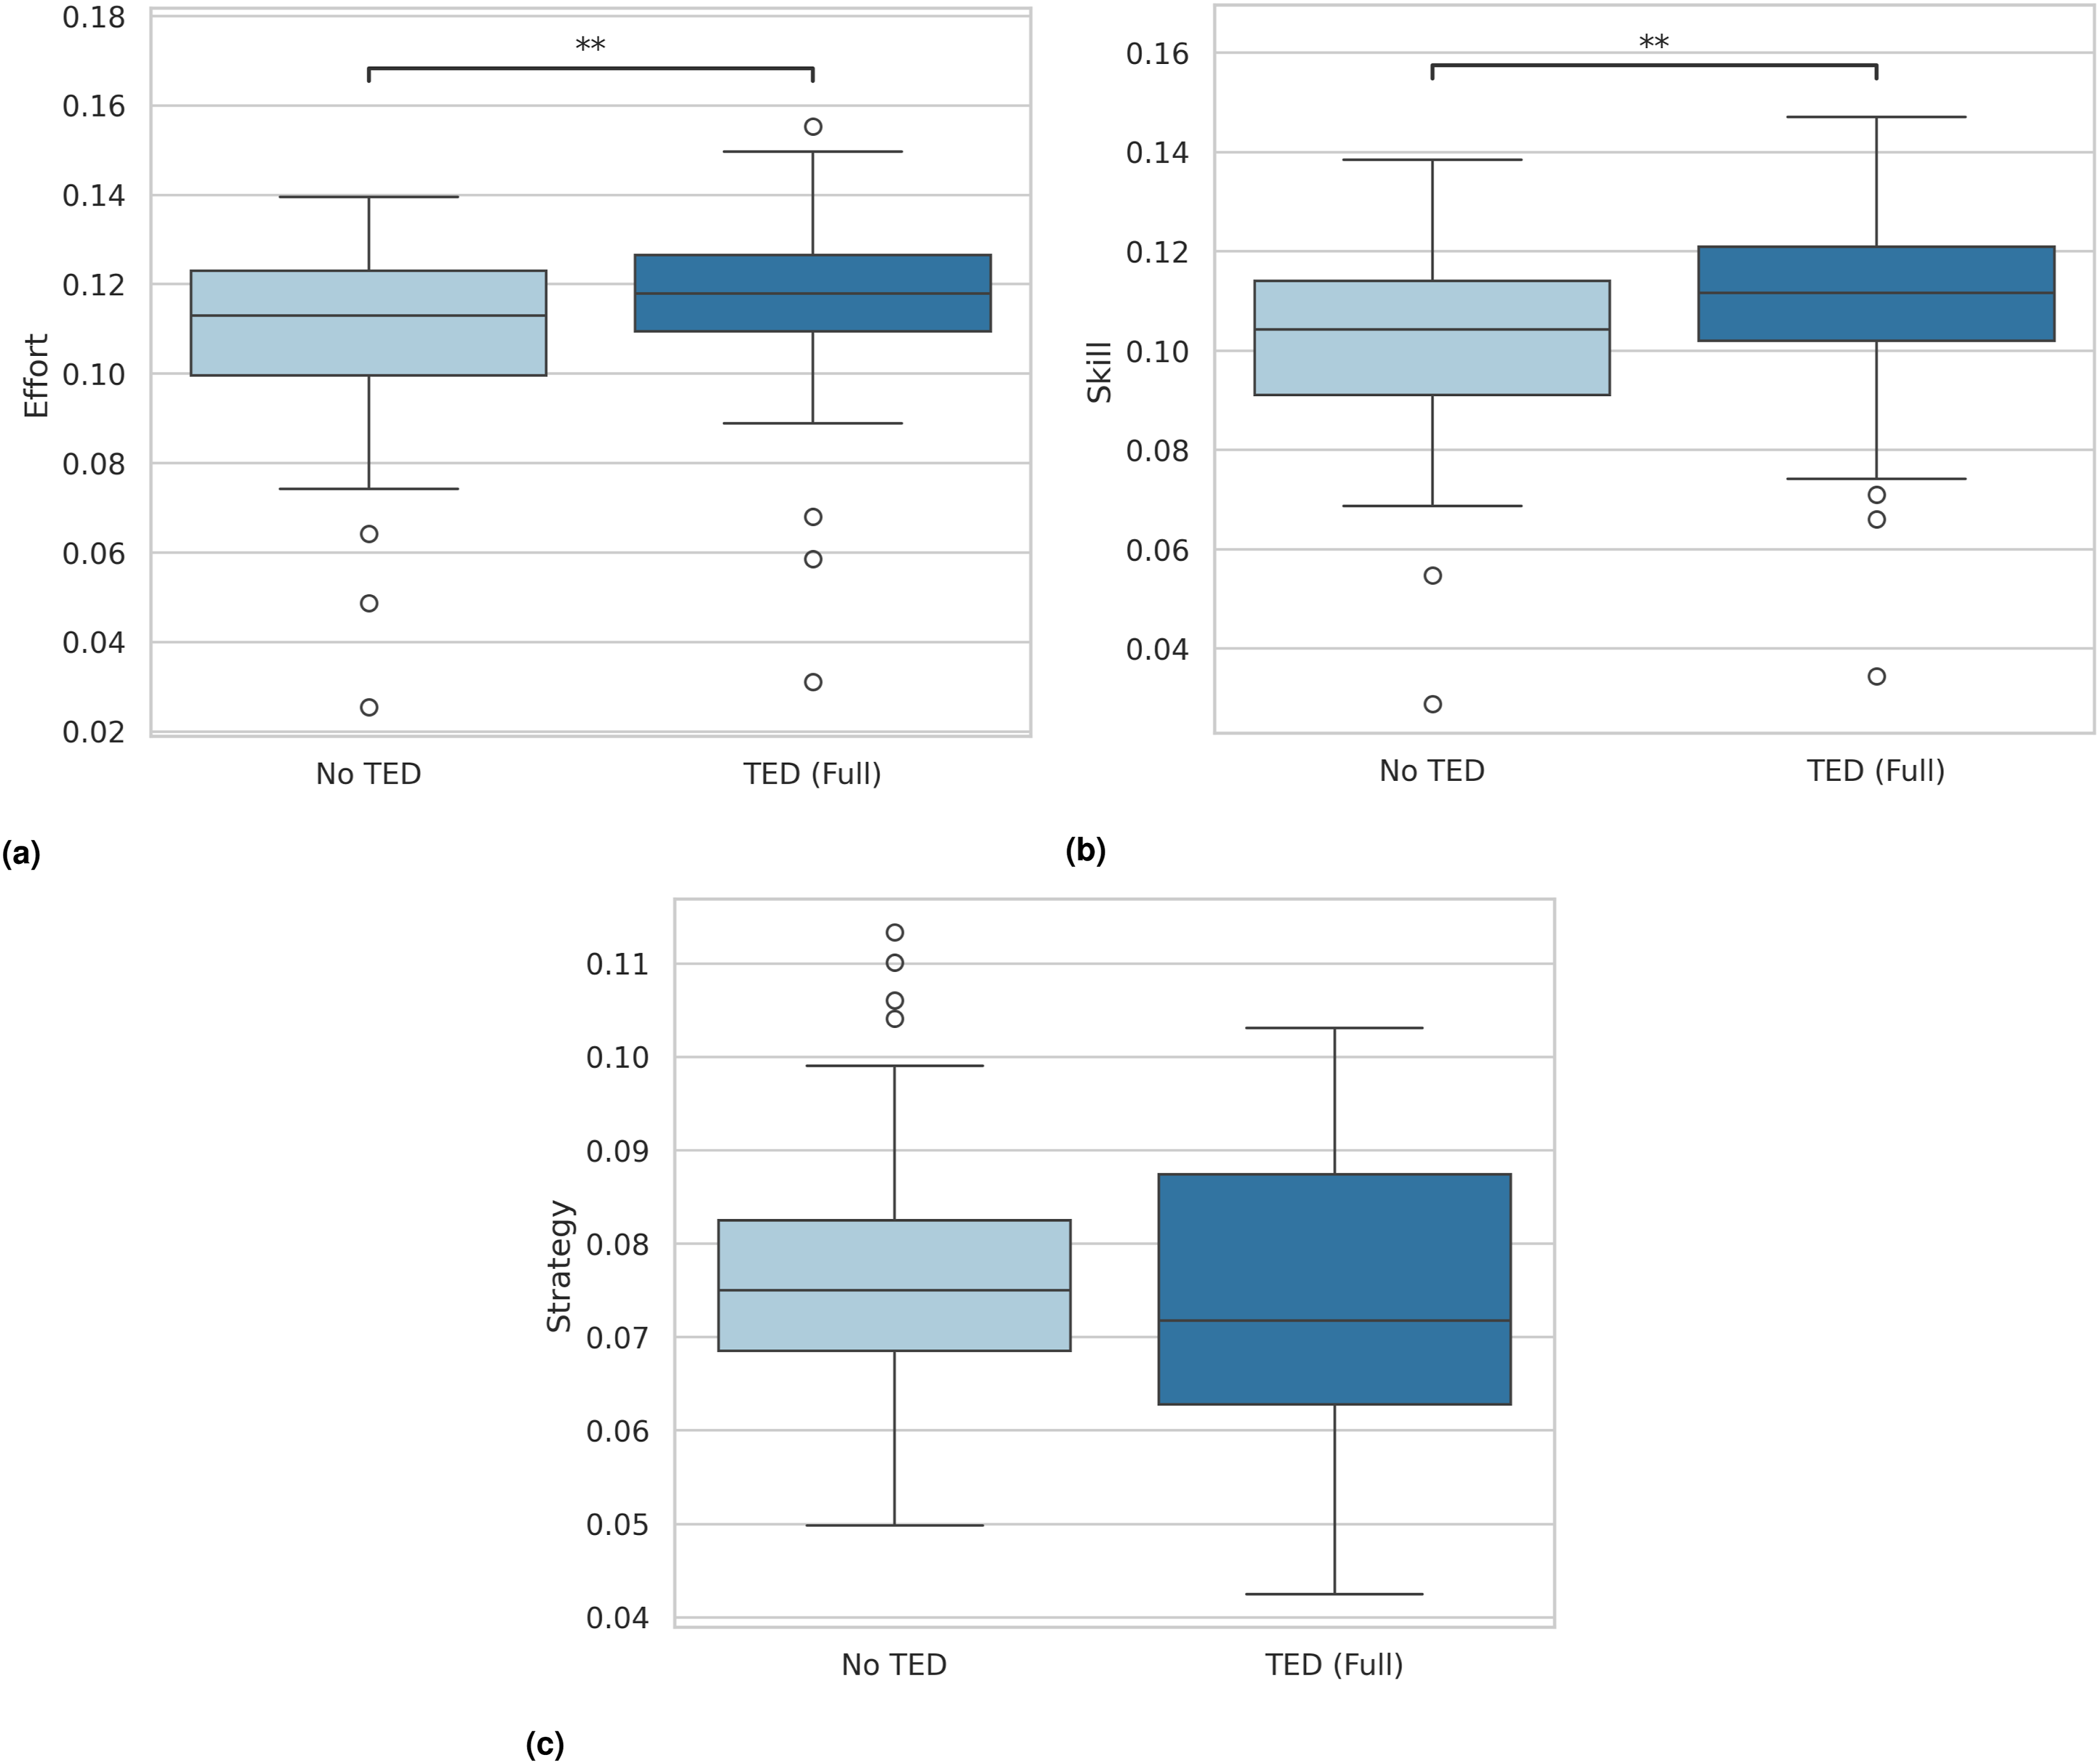
We further examined more specific behaviors contributing to different TED metrics to get more insight on how the real-time feedback changed participants’ behavior. We focus on components that are not directly captured in the team’s overall score (such rescuing victims). Figure 6 presents a comparison for the component measures of Effort: movement, rubble clearing, and door opening. As shown in the figure, we only observe a significant difference in the overall distance moved (p < 0.0001, U = 2413, r = 0.390), where participants who observed the TED measures covered more ground in the Team Minimap environment in each calculation interval than participants in the No TED condition. Neither the amount of rubble cleared (p > 0.05, U = 3711, r = 0.06) nor the number of doors opened (p > 0.05, U = 3681, r = 0.07) varied significantly between the experimental and control conditions. Thus, participants receiving feedback from the Effort metric responded by increasing the activity that most had the clearest connection and was most quickly reflected in a change in the metric. The components of the Effort metric by condition. *p < 0.05, **p < 0.01, ***p < 0.001, ****p < 0.0001.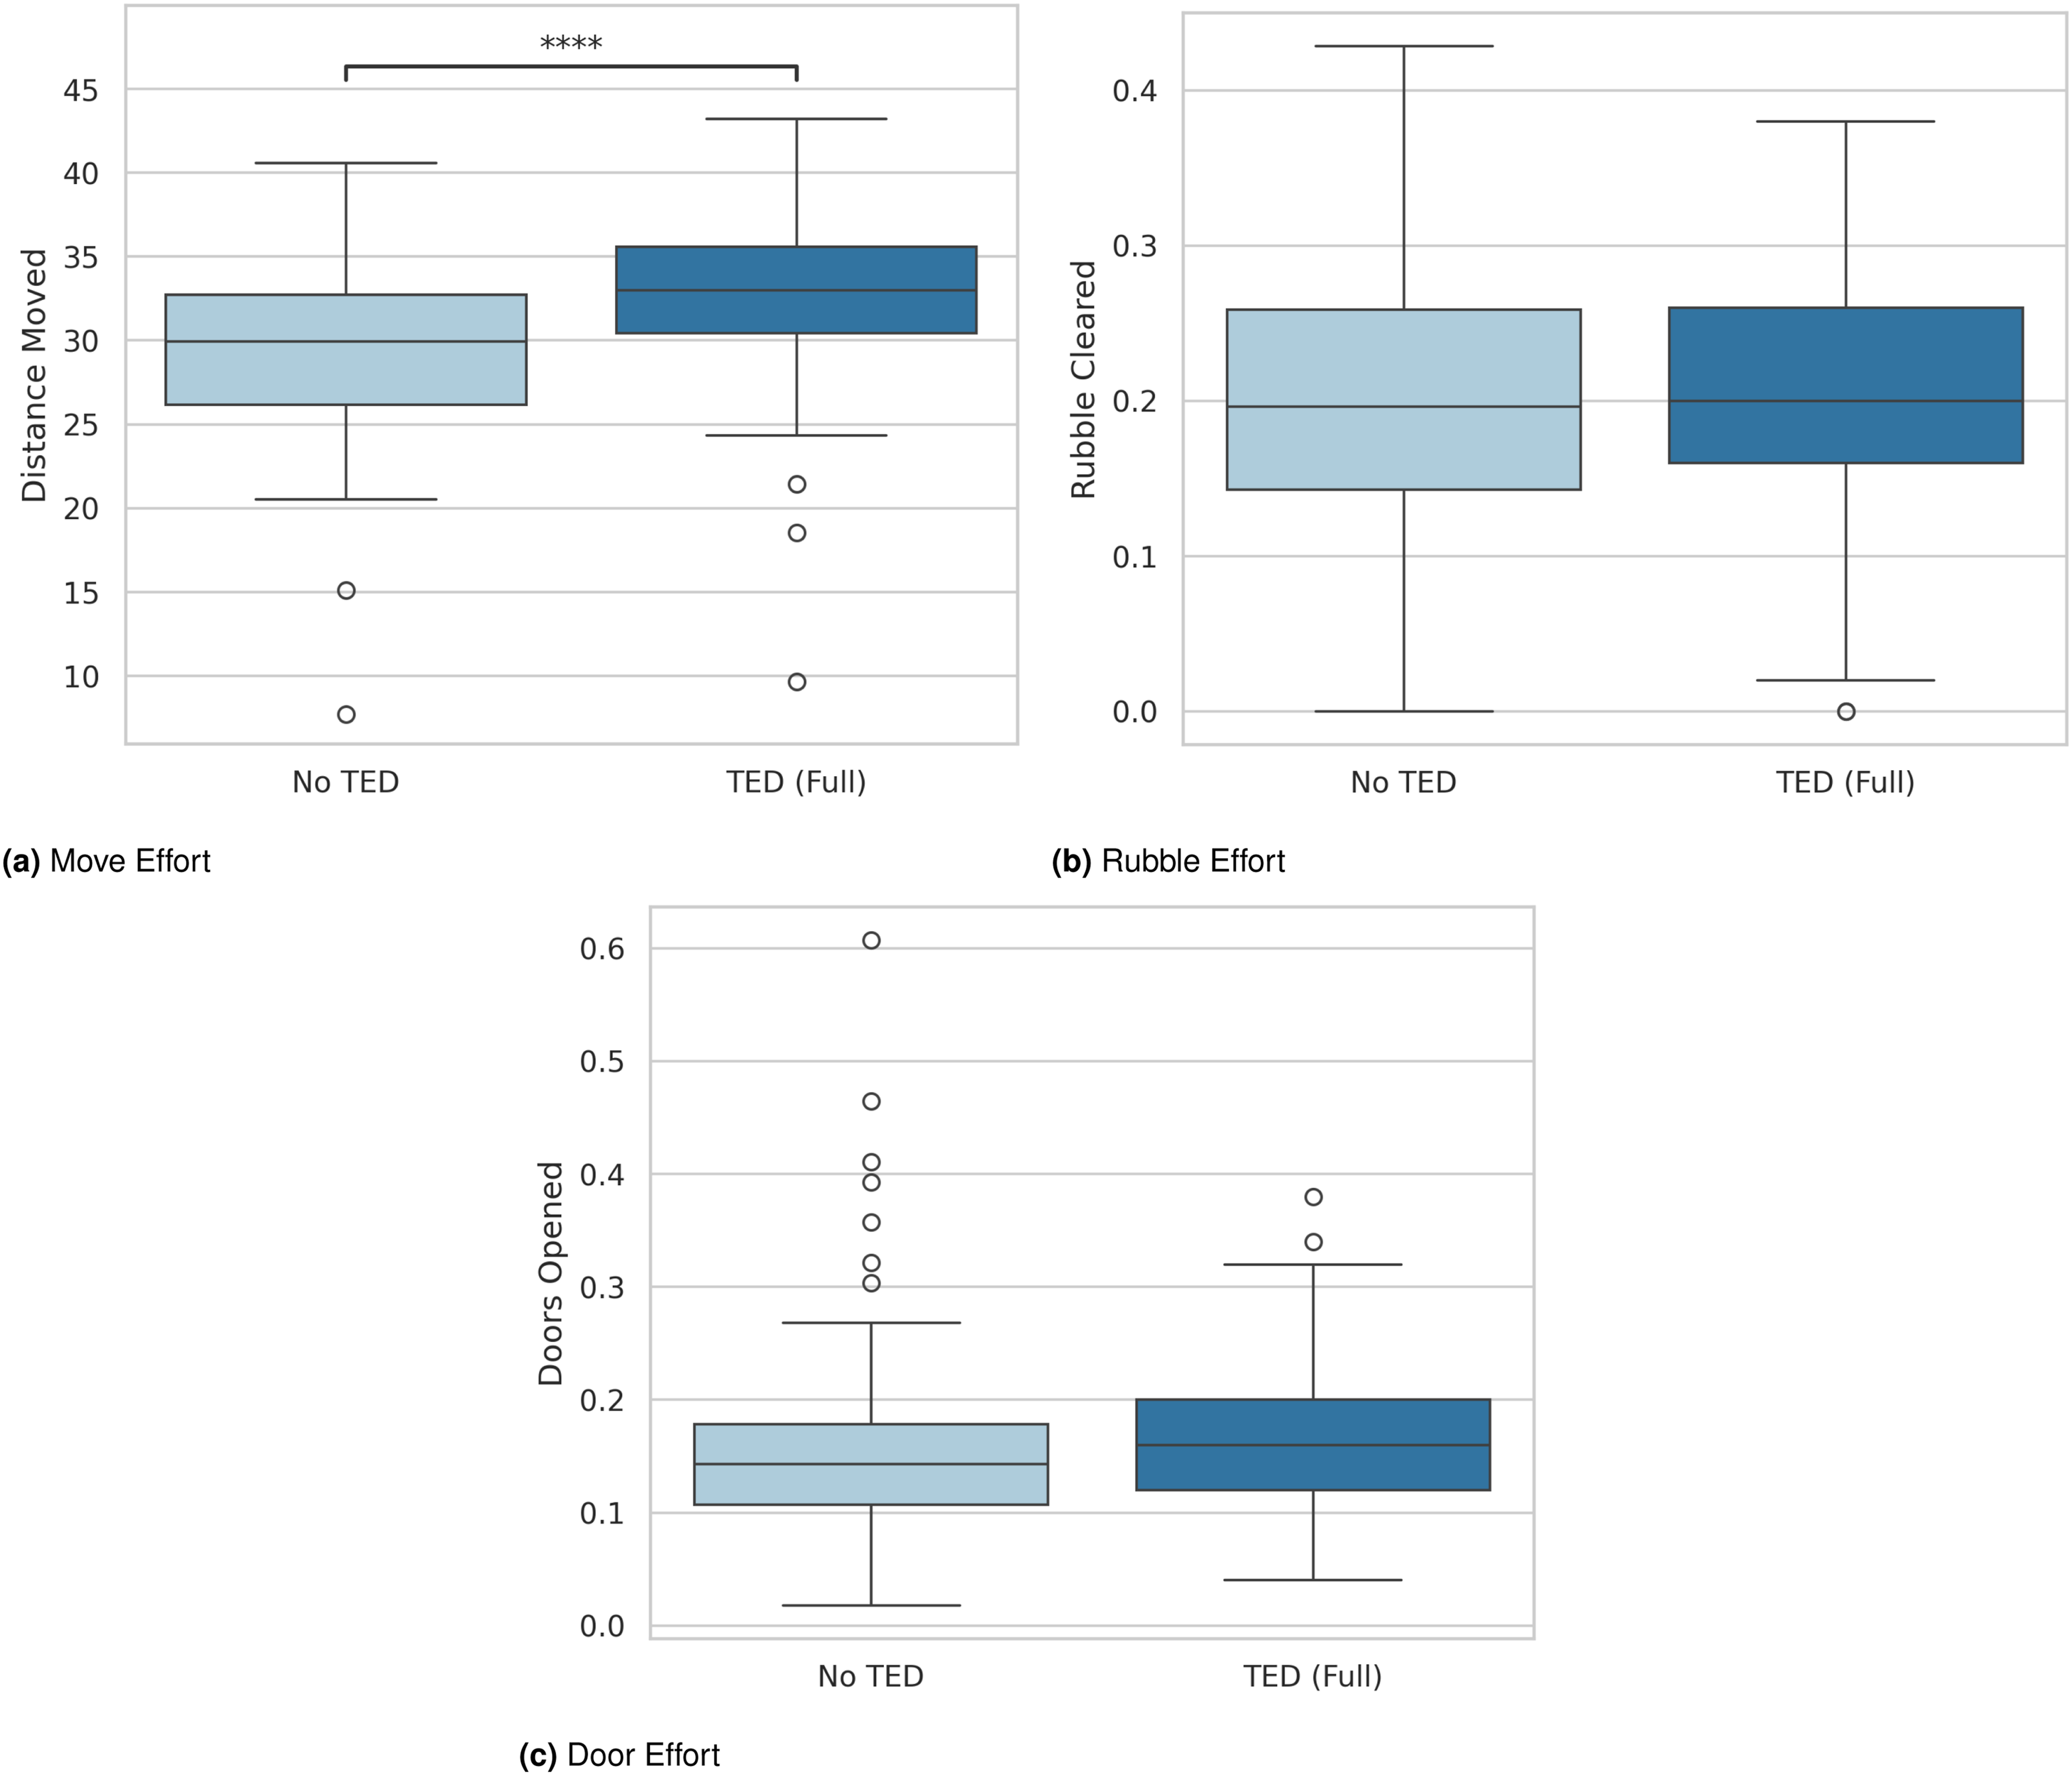
We similarly explored the inputs to the Skill Use metric: the time participants in the engineer role spent waiting for the medic to arrive so they could triage the most severely injured (red) victims (Inaction Red Duration) and usage of the speedup action (Speedup Action Active). As shown in Figure 7, we observe no significant differences in “Inaction Red Duration” (p > 0.05, U = 3976, r = 0.0). However, participants in the TED (Full) condition spend significantly more time using the speedup action compared to the No TED condition. Similar to our observations of the inputs to the Effort metric, here, we see the feedback increase use of a capability (speedup action) that results in improvement on both the Effort and Skill Use Metrics in a relatively short time frame, leading those participants to increase their usage of the speedup action overall. Additional TED metric components for the No TED and TED (Full) conditions: (a) Inaction of engineers next to the red victim and (b) speedup actions. The former captures how long engineers were inactive near a red victim waiting for a medic to triage the victim. The latter is the average amount of time that a player was utilizing the speedup action to double their movement speed. *p < 0.05, **p < 0.01, ***p < 0.001, ****p < 0.0001.
Study 1 summary
In Study 1, we found no significant differences in overall performance between the No TED and TED (Full) conditions. However, teams with the TED display showed significantly higher Effort and Skill Use. Further exploration showed that these differences were driven primarily by increased movement and greater use of the speedup action—behaviors that have a more direct impact on the metrics displayed. These observations suggest that while the TED feedback did not improve the final scores, the real-time feedback influenced participants’ behaviors in ways that they could more directly observe reflected in the TED metrics.
However, the lack of a significant impact on the overall score led us to wonder if displaying all three metrics might reduce the clarity of the feedback. Thus, we decided to conduct a second experiment, focusing specifically on the Effort Feedback display (which had the larger effect in Study 1) and also exploring whether the format of the display could make a difference.
Study 2: Effort display
In Experiment 2, teams in the TED (Effort) experimental condition received feedback only on the Effort dimension and were randomly assigned to receive it via one of three different visual displays (see details in Appendix). We compare the collaboration and performance of teams in the TED (Effort) condition to teams in the No TED condition.
Figure 8 displays the overall score of No TED and TED (Effort). Here, in contrast to Study 1, we do observe a significant difference in performance between the No TED and TED (Effort) conditions—however, it is in the opposite direction from what we predicted. Teams in the TED (Effort) condition earned a significantly lower score than teams in the No TED condition (p < 0.05, U = 1043, r = −0.31). Average game score in the No TED and TED (Effort) conditions. *p < 0.05, **p < 0.01, ***p < 0.001, ****p < 0.0001.
We again conducted additional exploration of the component scores and collaborative processes to try to gain additional insight into these findings. First, in looking at components of the final score (which is a weighted sum of the victims saved), we see in Figure 9 a significant decrease in the numbers of both the least severe (green) (p < 0.05, U = 5239, r = −0.21) and moderately severe (yellow) (p < 0.0001, U = 5929, r = −0.37) victims saved in the TED (Effort) condition compared to the No TED condition. We observe no significant difference in the number of red victims saved (p > 0.05, U = 4640, r = −0.07). Average number of victims saved in the No TED and TED (Effort) conditions. Green victims can be saved by any player, yellow require the medic, and red require one of each type. *p < 0.05, **p < 0.01, ***p < 0.001, ****p < 0.0001.
As in Study 1, we also explore the details of the collaborative process metrics to examine how the real-time feedback received by TED (Effort) teams changed their behavior. In Figure 10, we see a significant increase in Effort for TED (Effort) compared to No TED, as expected (p < 0.001, U = 3086, r = 0.28), but we also see a significant increase in Skill Use (p < 0.001, U = 2960, r = 0.32) similar to Study 1. In addition, we also see a significant decrease in behaviors contributing to the Strategy metric in TED (Effort) teams compared to the No TED teams (p < 0.0001, U = 6004, r = −0.39). Three TED metrics for No TED and TED (Effort), Effort in shown in (a), Skill in (b), and Strategy in (c). The average over each 3 second interval is shown for each measure. *p < 0.05, **p < 0.01, ***p < 0.001, ****p < 0.0001.
Figures 11 and 12 show the comparison of the TED (Effort) and No TED conditions on the component measures of the collaborative process scores. Similar to Study 1, we see significant increases in both the distance moved (p < 0.0001, U = 1964, r = 0.52) and usage of the speedup action (p < 0.0001, U = 1298, r = 0.68) in the TED (Effort) teams compared to No TED; no other significant differences are observed on the remaining component measures: rubble cleared (p > 0.05, U = 4480, r = −0.11), doors opened (p > 0.05, U = 3971, r = 0.02), and engineer inaction near red victims (p > 0.05, U = 4363, r = −0.08). Therefore, it appears that the reduced quality of collaboration reflected in lower Strategy scores in TED (Effort) teams is largely related to their rescuing of fewer victims. The components of the Effort metric by condition. Additional TED metric components for the No TED and TED (Effort) conditions: (a) Inaction of engineers next to the red victim and (b) speedup actions. The measures are described in Figure 7.

Study 2 summary
In Experiment 2, we tested whether getting teams focused on just one collaborative process metric (the one deemed most critical to performance) would result in more improvement in overall performance compared to the potential confusion and complexity of processing three composite metrics. Instead, our findings suggest that participants over-focused on the single point of feedback, perhaps even to the exclusion of the components that most contributed to their final score. Consequently, teams’ over-emphasis on effort led to worse performance compared to teams receiving no feedback.
Discussion
Societies are becoming increasingly complex, requiring collective actions of teams that can perform tasks in a wide range of environments (Gonzalez et al., 2023). Furthermore, in such complex socio-cognitive systems, collectives must adapt to dynamic environments in real-time, and adjust their actions accordingly (Galesic et al., 2023). To prepare for such complex challenges, we must answer questions about why collectives are sometimes successful and why other times they may not collaborate and adapt dynamically.
Collective intelligence metrics have shown some effectiveness in predicting team performance in some specific tasks. However, our study addresses a significant unexplored challenge: devising methods to measure collective intelligence in real-time during the execution of dynamic tasks. A critical need exists to formulate CI metrics capable of encapsulating the collaborative dynamics inherent in group interactions. Additionally, it is imperative to develop methodologies in parallel to determine the degree to which such CI metrics can foster improvements in group performance and collaboration. Our findings highlight that the metrics employed to measure or predict CI may not always align with human objectives to improve CI. Consequently, a crucial obstacle in developing CI-based interventions lies in providing metrics or information within these interventions that participants can safely adopt as objectives, ensuring congruence with the objective of increasing CI.
The research carried out here illustrates the role of visual displays in shaping team CI and their influence on team collaboration performance. Our results underscore the nuances involved in displaying CI metrics in real-time while performing a dynamic task in a team.
In Study 1, we presented three CI metrics—effort, skill utilization, and task strategy. These Team Effectiveness Diagnostic (TED) metrics were shown using gauges that were updated in real time. The expectation was that continuous and immediate awareness of the CI of the team would allow participants to adjust their behavior to improve collaboration and task performance. Instead, what we observed was a correlation between effort exerted and performance, but not an ultimate improvement in performance. Study 2 involved a simplified presentation of effort on various types of displays. However, we found that this only accentuated the results of Study 1. Teams in the TED (Effort) condition performed worse in terms of number of points, as increased attention to effort and skill occurred at the expense of attention to task strategy. The components of our measures are important for team success, although we are reminded of Goodhart’s law (Strathern, 1997) by the results: the transformation of the measures from metrics to targets reduces their efficacy as metrics. Participants maximized the presented metric to their own detriment, as direct metric exploitation had no direct benefit to their team performance.
One potential reason for the ineffectiveness of displays in producing productive behavior change is in concurrent information processing. In real-time tasks, it can be difficult to concurrently process the information on the display, complete the team-based task, and think about how to use the information on the display productively. Previous work has shown that the cognitive system is serial and not parallel, so we cannot do things simultaneously that require the same cognitive channel (Gonzalez, 2005; Gonzalez and Golenbock, 2003). Similarly, individuals may have limited attention and the real-time displays allocated a fixed-budget of attention away from completing the task successfully (Kahneman, 1973). The capacity to reason effectively about how to use the information on the display may have been limited and individuals did not recognize that they were utilizing it in ways that were negative for both themselves and their team.
This insight aligns with and extends previous research on the effectiveness of after-action reviews (AARs) in promoting team learning and performance (Keiser and Arthur Jr, 2021; Tannenbaum and Cerasoli, 2013). Similarly to AARs, our results suggest that the continuous presentation of CI metrics during task execution may overburden cognitive resources, leading participants to misinterpret real-time feedback. Rather than offering real-time feedback, which can be distracting or misinterpreted, AARs provide an opportunity to reflect on past performance and build shared understanding.
In fact, an alternative mechanism for a successful intervention can provide participants with the opportunity to retrospectively analyze team performance metrics to provide ample opportunity to reason about their performance. Gonzalez (2005) demonstrated how varying levels of reflective performance information were useful to improve skill in a single-player dynamic decision-making task, particularly when using expert demonstrations. In our current setting, a similar design may be used to reflect on measures that capture the multi-player dynamics in this task, for example, the CI and corresponding examples of successful behavior. Instead of presenting a continuous display that requires parallel information processing, the CI metrics could be provided at the end of a task episode to highlight exemplar moments for team coordination. In team tasks, the interdependence between team members adds significant complexity over the individual setting; individuals must coordinate their behavior changes with one another to be successful, and providing sufficient opportunity and information to reason about this process is crucial.
There are several avenues for future research. The first is in the refinement of the metrics presented. Our operationalization of the TED measures was based on previous work that they were effective diagnostics for collective intelligence; however, they were shown to be unsuitable for dynamic decision-making tasks. In the environment at hand, measures that contain separate information should be developed that, when taken to their extremes, still results in productive team behavior.
In addition, there is the question of when or how often to present an intervention. In our work, the display was constant and participants were always able to view it. Interventions may be less effective when the message is constant or coupled with other information, rather than when presented at critical points (Lejarraga and Gonzalez, 2011). Indeed, information and behavioral interpretation may be more effective if displays or interventions are dynamic or provided at intervals—potentially while the task is paused or between rounds. This relates to the idea of “just-in-time” interventions, where interventions are made adaptively at critical moments. Such interventions have often been applied in health settings, with some positive results observed (Hardeman et al., 2019; Schembre et al., 2018). In the context of teaming, effective just-in-time interventions may be provided in situations of coordination breakdown (Van Eijndhoven et al., 2023) or transitionary periods in teamwork (Wiltshire et al., 2024). Wiltshire et al. (2024) outline the potential of approaches that provide interventions at unstable points in teamwork by adaptively identifying when coordination transitions will occur. Such tailor and precise interventions may provide a benefit from the constant feedback presented in our work and is an important avenue for future investigation.
Our work highlights the difficulty of defining metrics that participants can use to increase collective intelligence, while also highlighting the efficacy of visual displays for behavior change. In moving forward, work should explore approaches that circumnavigate Goodhart’s law and reduce the cognitive load on participants.
Significance statement
Teams increasingly rely on digital tools to support coordination, especially in distributed and high-stakes environments. A growing body of research suggests that collective intelligence—the capacity of groups to adapt and perform effectively across tasks—can be diagnosed using real-time indicators of collaboration quality. This paper challenges the assumption that making such indicators visible to teams during task execution will reliably improve performance.
Across two controlled experiments, we show that real-time feedback based on validated collective intelligence metrics does not necessarily enhance collaboration. In fact, in some cases, it degrades performance. Teams exposed to live feedback systematically altered their behavior in response to the displayed metrics, often in narrow or myopic ways, over-emphasizing visible dimensions such as effort while neglecting processes like strategy and coordination. These findings provide empirical evidence that when diagnostic measures become targets, they may lose their value as indicators of underlying system health.
For basic science, this work advances understanding of collective intelligence as a complex adaptive system that cannot be effectively optimized through single, real-time control signals. It highlights the distinction between measuring collective intelligence and intervening on it, underscoring the cognitive and attentional limits that shape how humans interpret feedback during dynamic teamwork.
For applications in human–AI teaming, organizational dashboards, and collaborative platforms, our results urge caution in deploying real-time “nudges” intended to improve teamwork. Rather than continuous feedback, effective interventions may require reflective, well-timed, or coached use of collective intelligence metrics. Designing tools that support learning without inducing counterproductive over-correction is critical as teams increasingly collaborate with intelligent systems.
Footnotes
Funding
The authors disclosed receipt of the following financial support for the research, authorship, and/or publication of this article: This research was supported by the Defense Advanced Research Projects Agency and was accomplished under Grant Number W911NF-20-1-000, and by the AI Research Institutes Program funded by the National Science Foundation under the AI Institute for Societal Decision Making (AI-SDM), Award No. 2229881.
Declaration of conflicting interests
The authors declared no potential conflicts of interest with respect to the research, authorship, and/or publication of this article.