
Abstract
Aiming at the frequent occurrence of the wind turbines failures, a set of analytical methods was developed to carry out the reliability assessment from multi-dimensions, considering the fault characteristics of the wind turbines subsystems, the variation of its failure process, and the wind turbines reliability indexes. Through classification processing of failure data, the Pareto diagram was applied to search the weak subsystem. A fault tree model is constructed, which can figure out the logical relationship between its failure events by the Fussell–Vesely algorithm. According to various characteristics of the bathtub curve, the failure process based on power law process (PLP) model was proposed, it has been discussed that the change criteria of the wind turbines failure with the running time. At last, reliability indexes such as availability were solved and compared to judge the wind turbine performance status. A case study was given in which the failure data are from a wind farm in China. The results indicate that electrical control and pitch subsystems are weak subsystems, and the minimum bottom event in their fault tree model may lead to system failure. Besides, the PLP model can describe the failure process of wind turbines.
Introduction
Wind power production has steadily grown in the last few decades because it is environmentally friendly. 1 –3 As the core device of wind power system, wind turbine undertakes the important task of converting wind energy into electricity. Due to the complex operating condition of the system, the reliability problem seems particularly relevant. Therefore, it is meaningful for scientific research to guarantee and improve the reliability of the wind turbine.
In many actual engineered applications during the 20 years’ service period, wind turbines achieve safe and stable operation, and the seasonal availability is not less than 97%. It is a necessary condition to maintain the reliability level. 4 Because of the frequent failure of wind turbines, many scholars have conducted further research on this problem in recent years. Uzunoglu et al. 5 based on the whole life cycle of wind turbines operation data verified the correctness of the bathtub curve, and through the research on the failure data, it is found that pitch subsystem, frequency converters, and control communication systems have the highest failure rates in wind turbine faults. Tavner et al. 6 studied the operation of three groups of wind turbines in Germany when the types of wind turbines are the same, but the wind fields are located in different climates; the results show that different geographical locations and climatic conditions have different effects on the failure rate of wind turbines. Habibi et al. 7 used a model-based wind turbine fault monitoring and fault-tolerant control scheme to improve wind turbine reliability and focused on its advantages, capabilities, and limitations. Rezamand et al. 8 took the generator of wind turbine as the research object and used nonparametric life data analysis, Weibull standard folio life data analysis, and accelerated life test analysis (ALTA) standard folio life data analysis to predict the reliability of wind turbines generators, and the research results provide the basis for the maintenance of wind turbine. Lin et al. 9 employed relevant measures to ensure reliability in each stage of designing, manufacturing, and maintaining through the work on the faulty mechanism of critical components of the wind turbines.
Many scholars evaluated the reality of wind turbines from a qualitative or quantitative perspective. Yan et al. 10 established a fault tree model with wind turbine transmission system as the research object to research the relationship between fault and fault characteristics and fault sources. In the work of Zhang et al. 11 and Kang et al., 12 a fault tree model for wind turbines was established to discuss the order dependencies and redundancy of fault events. Marquez et al. 13 used fault tree analysis (FTA) to identify and monitor the key components of the wind turbine and completed the qualitative evaluation of the state of the wind turbine. Slimacek and Lindqvist 14 presented to establish a mathematical model of wind turbine reliability based on the Poisson process and applied the fault data of wind turbine to verify the validity of the model. Guo et al. 15 established a three-parameter Weibull failure rate function based on the failure data for the reliability evaluation of wind turbines.
The work takes inspection data of 13 wind turbines in the first phase of a wind farm in China as the research object. The reliability of the batch of wind turbines is evaluated by multi-dimensions with a set of methods. The Pareto chart and FTA are taken as tools to complete the qualitative analysis of the wind turbine subsystems and quantitative evaluation by a mathematical model of the wind turbines failure process based on power law process (PLP) is implemented. Finally, various reliability indexes are solved and compared with references to complete the comprehensive evaluation of the wind turbines.
Problem statement
Wind turbine is a large and complex component composed of pitch subsystem, blade subsystem, brake subsystem, and so on. Each wind turbine in the wind farm was equipped with the Supervisory Control and Data Acquisition (SCADA) system. 16,17 The system monitors the wind turbine’s various operating conditions such as mechanical state parameters and external environmental parameters in real time and stores historical data. When the wind turbines fault, the system records the time of fault and the cause of fault and other information, which is extremely important to assess the reliability of wind turbines.
Reliability is an important index to measure the quality of a product, which is an inherent attribute of the system. The reliability is defined as the capability of a product to perform specified functions under definite conditions and within a limited period time in GB/T 37079-2018. The state of the wind turbine unable to perform the specified functions is called a fault, which is a function of the running time, and its variation trend is shown in Figure 1.

The bathtub curve.
As shown in Figure 1, the bathtub curve represents the general change trend of the failure process of the wind turbine in the whole life cycle, and the bathtub curve has obvious stages. According to the change of the failure rate with the running time, it can be divided into three periods: The first period is the infant failure period, and failures frequently occur at this period. However, with the increase in the operating time of the wind turbine, the failure rate gradually decreases. The second period is the occasional failure period, and the failure rate of the wind turbines is low and stable operation during this period. The third period is the wear failure period. During this period, with the increase of the operating time of the wind turbines, the fault rate rapidly increases, and it is easy to cause the product to be scrapped.
Methods and models
Fault tree analysis
FTA is a directed graph that reflects the fault propagation, 18,19 which is used to evaluate the reliability of large and complex systems like wind turbines. FTA establishes and analyzes wind turbine event fault tree to research the fault mechanism. Here, we demonstrate the weak links and potential hidden troubles of each wind turbine system and make maintenance strategies in time to ensure its reliability level. The logical relationship of various events in the wind turbine system fault tree is shown in Figure 2.
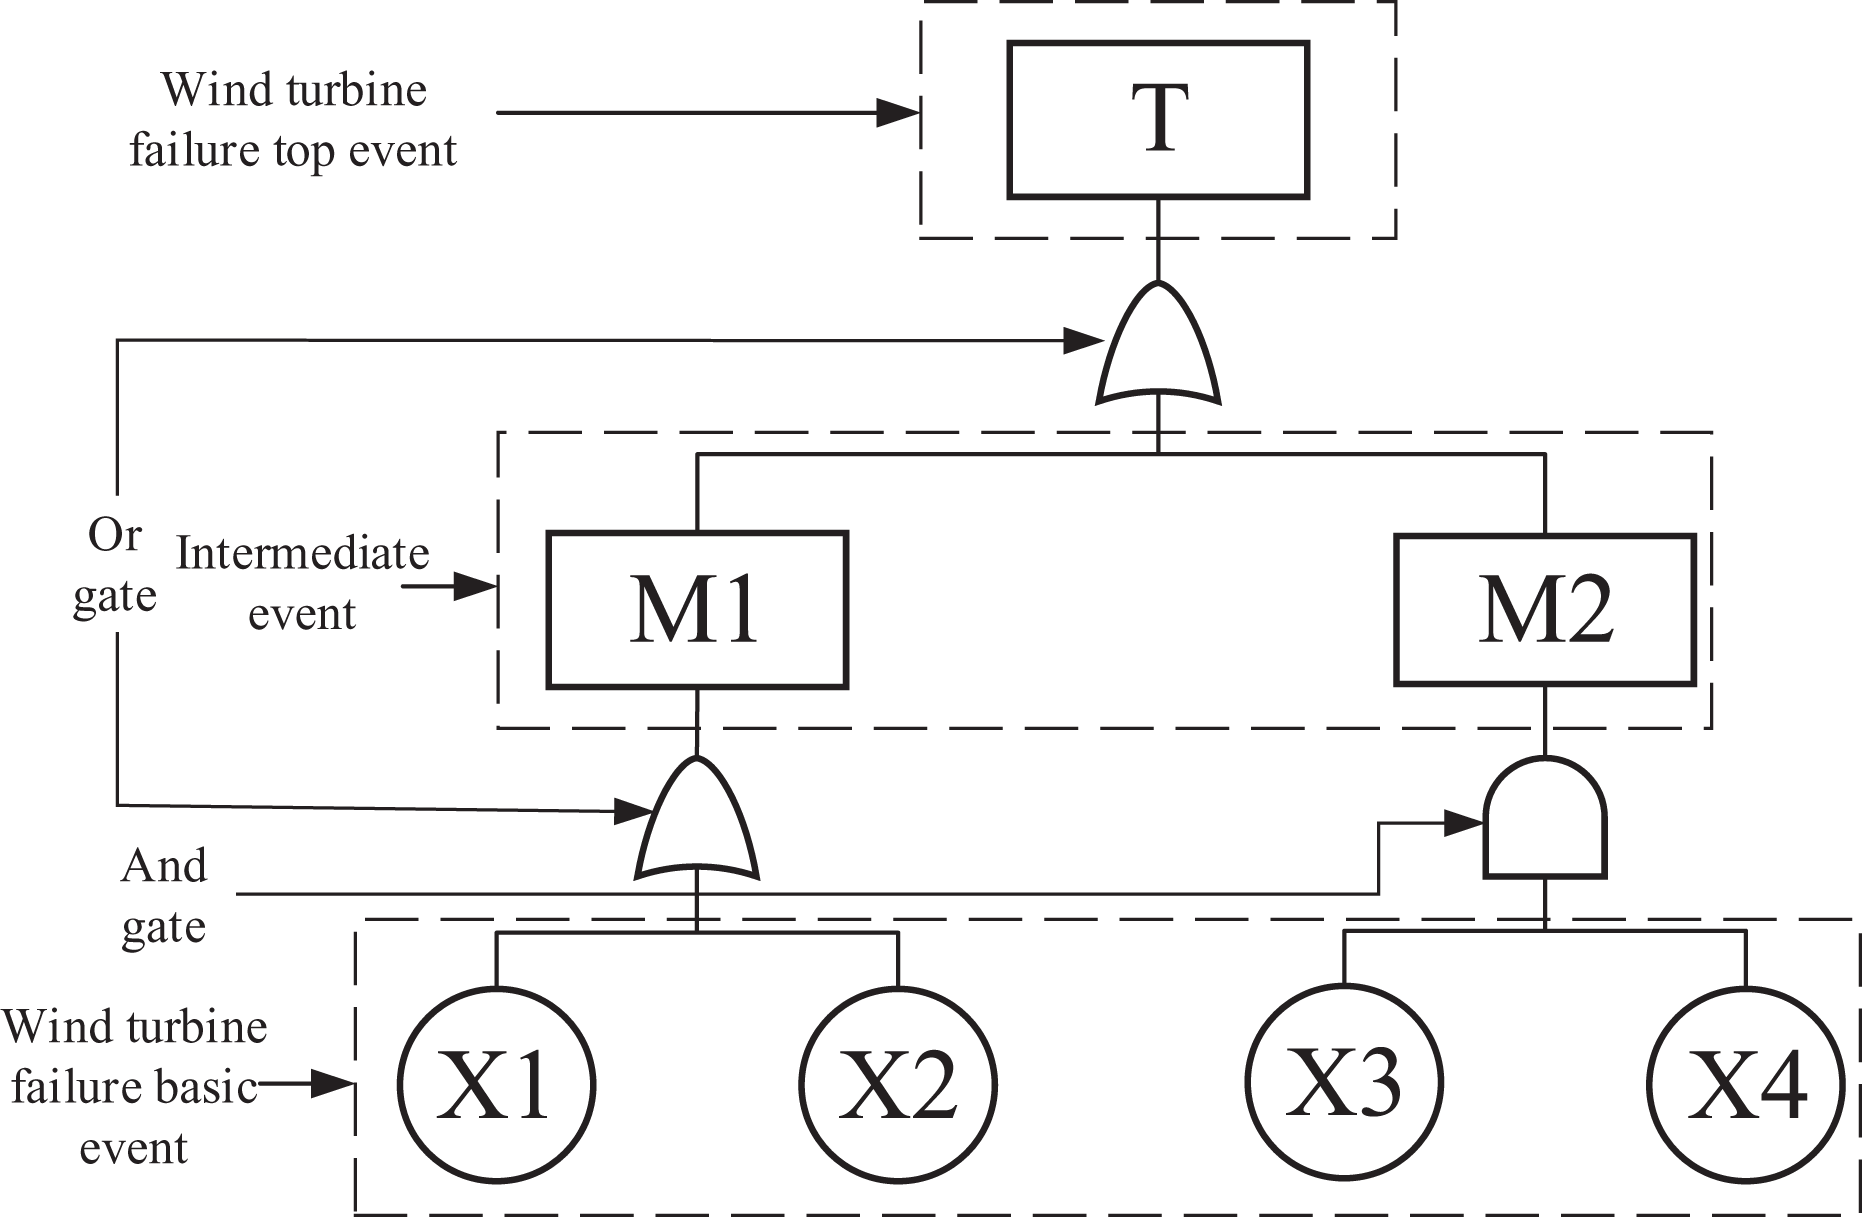
The fault tree model.
PLP modeling
As a typical nonhomogeneous Poisson process, the distribution function of the PLP is in good agreement with the “bathtub curve” of the failure rate of mechanical equipment in three stages. Therefore, it is widely utilized in the reliability assessment of repairable mechanical equipment.
20
The following steps are given to establish the PLP: Step 1: Problem analysis
Assume that there are m wind turbines, and the shutdown failure data are time truncated at time T, the shutdown fault statistics interval for the jth wind turbine is [0, T], the time of occurrence of the ith shutdown failure is tj
, i
, and the total number of shutdown failures is nj
. Step 2: Hypothesis
The null hypothesis H
0: β = 1, which obeys homogeneous Poisson distribution, opposite H
1: β ≠ 1, assumption obeys nonhomogeneous Poisson distribution. Step 3: The failure process model
The various indexes of wind turbines of a failure process model include intensity function


where λ is the scale parameter, β is the shape parameter, and t is the running time. Step 4: The solution of the model
Calculate the statistic, confidence intervals, and parameters required by the model, and is given as
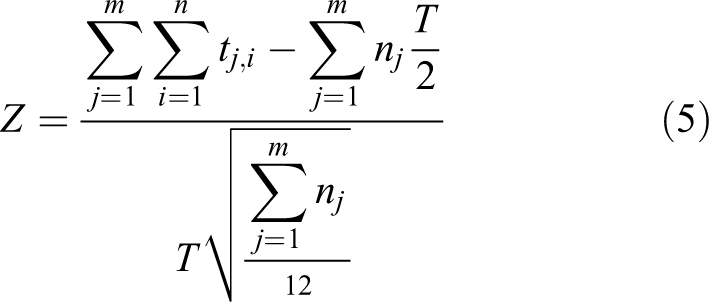
where Z is an asymptotic normal distribution. After confidence
The method of maximum likelihood
21
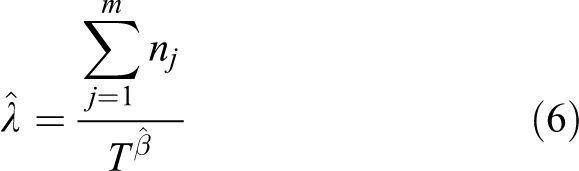
is applied to obtain the scale parameter estimate

Step 5: The analysis of model results
When the value of Step 6: Summary
The modeling of the PLP can be completed according to the above steps 1 to 5. To facilitate understanding, the flow chart for establishing the PLP model is given, as shown in Figure 3.

The flowchart of the power law process model.
As can be seen from Figure 3, step 3 (the failure process model) is the key part, and the established model includes indexes such as wind turbine failure intensity, MTBF, and cumulative failure intensity. The failure intensity of the wind turbines represents the conditional probability of failure in the next unit time under the condition that the wind turbines have not failed at a certain time; so, the probability of failure can be predicted. The wind turbine MTBF represents the time elapsed by a wind turbines failure; so, the MTBF value in the next unit time can be predicted. The cumulative failure intensity of the wind turbine represents the cumulative number of failures of the wind turbine in the statistical time; so, it can predict how many failures will occur in the next unit of time.
In short, the PLP model established can predict the probability, the number of occurrences, and MTBF of fault in the next unit of time of the wind turbines operation. Therefore, the reasonable maintenance strategy can be developed in advance to reduce the occurrence of wind turbines failure according to the predicted results of the PLP model in actual conditions.
Comprehensive evaluation-availability
Availability is a comprehensive reflection of production reliability, expressing the probability 22 that the production completes the prescribed functions under the set condition within the fixed time. The equation for calculating the availability of can be written as
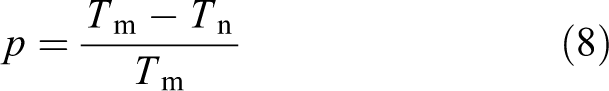
Here, p represents the average annual availability of wind turbines in a wind farm, T m represents the number of hours at a given time, and T n represents the number of shutdown hours due to failure or maintenance.
Multi-dimensional reliability evaluation process
The multi-dimensional reliability evaluation process of wind turbines using the abovementioned method is described in this work, as shown in Figure 4.
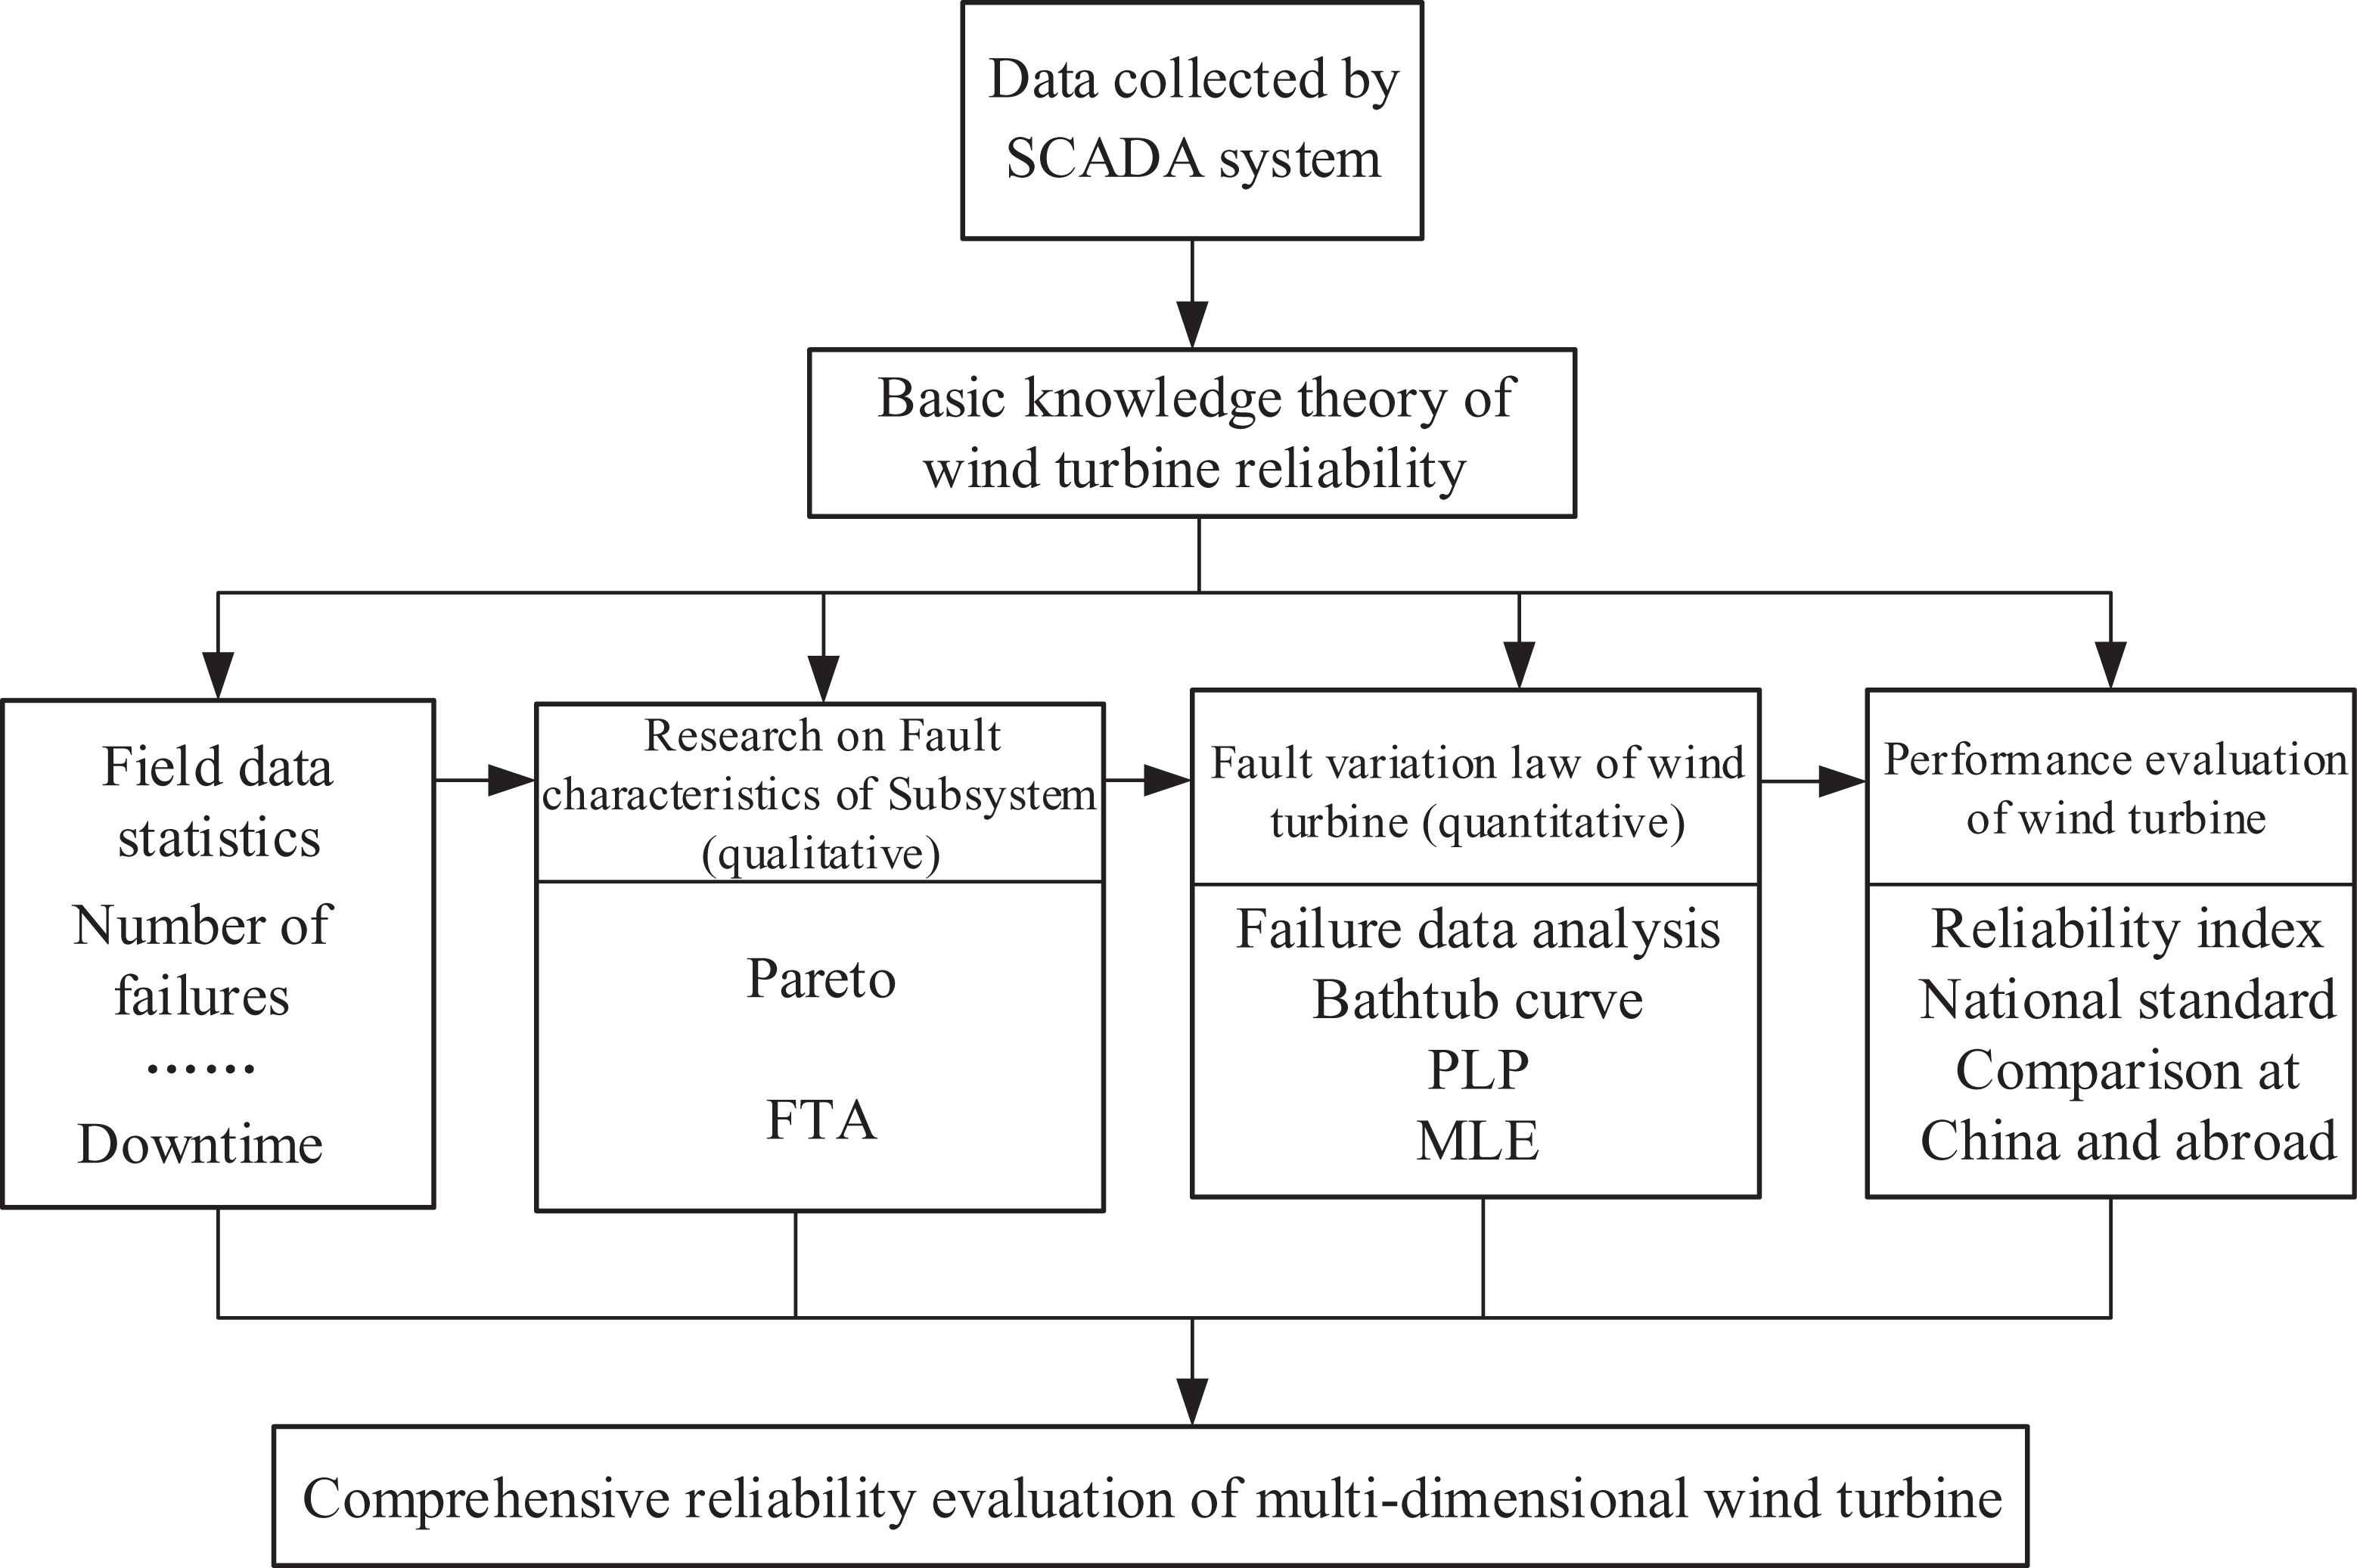
The flowchart of reliability evaluation.
As a graphic deductive method, FTA qualitatively expresses the internal relationship between failures of wind turbines subsystems and points out the logical relationship between fault events. And the proposed PLP model quantitatively describes the changes in the failure process and operating time of the turbines from a system perspective criterion. Availability evaluates the performance of wind turbines as a whole. These three dimensions together constitute the multi-dimensional evaluation system of reliability in this study.
Case study
The first phase project of a wind farm in Jiangxi Province was commissioned and put into operation in May 2017, with a total of thirteen 2.5-MW direct-drive onshore wind turbines. The SCADA system records wind turbines failure data and stores information in real time. The work data were based on the operating data of the wind farm from 0:00 on July 1, 2018, to 0:00 on July 1, 2019, which belongs to part of the life cycle data of wind turbines.
Fault characteristics
When wind turbines fail, the SCADA system generates a failure record, and different failure record are able to identify different subsystems. The wind turbine subsystem is selected as the research object, and then, a Pareto of the number of failures made, as shown in Figure 5.

The number of subsystem failures Pareto.
Figure 5 illustrates that the frequency of failure of the electronic control system, the pitch subsystem, the generator system, and the hydraulic system are frequent; the cumulative ratio is nearly 69%. Among them, the number of failures of the electronic control system is the largest, reaching nearly 30%. The weak subsystem of the wind turbine seriously affects the reliability of the whole system. Therefore, it is necessary to study the failures which reveal a weak subsystem when evaluating the reliability of the wind turbine.
Since the pitch subsystem and blade subsystem played a vital role in the safe and efficient operation of the wind turbine, the pitch subsystem and the blade subsystem alarms were frequent in actual monitoring. Therefore, the pitch subsystem and blade subsystem are selected as the research object. It attempts to analyze FTA; its fault tree of the pitch subsystem is shown in Figure 6 (the fault events and their definitions are given in Table 1, and the minimal cut set of the fault tree is given in Table 2).

Pitch subsystem fault tree.
The fault tree event and its definition.

The fault tree minimal cut set.

As evidenced by Figure 6 and Table 2, the minimal cut set of the pitch subsystem X1 (the battery is not charged), X2 (the sensor value exceeds the limit), X5 (abnormal vibration), and X6 (the motor is installed incorrectly) are all first-order minimal cut sets. The smaller is the order of the minimal cut set, the more critical it is. Therefore, it is necessary to pay attention to such single-point failure modes and eliminate them as much as possible. The blades system consists of blades and hub, and the subsystem fault tree of the blade is shown in Figure 7.

The subsystem fault tree of the blade.
As is shown in Figure 7 and Table 2, the first-order minimal cut set of X14 (extreme climate) of the blade subsystem is a single point of failure and needs to be focused on prevention. In addition, there are redundant protections in the blade subsystem, such as the minimal cut sets X15 (angle of attack imbalance) and X16 (hub mass imbalance), which occurs at the same time that can induce an intermediate event M9 (blade system imbalance). The concern extent of such failure modes can be placed after a single point of failure.
The fault events and their classifications are given in Table 1. In this work, the Fussell–Vesely algorithm
23
(minimal cut set of Fussell–Vesely) obtains the minimal cut set of the fault tree; according to the logical structure of the fault tree, from the top event, the analysis layer by layer was performed, and the output event of the logic gate is replaced with the input event. When the
To sum up, the subsystems such as electric control, pitch subsystem, and blade subsystem are weak wind turbines systems, which are focused on during the operation and maintenance of wind turbines. In addition, the fault tree model needs to text these minimal cut sets when conducting reliability evaluation. It can significantly reduce the difficulty of failure diagnosis, doing an accurate search for failure sources.
Variation of the failure process
The shutdown failure data of a total of 13 wind turbines in this wind farm have been selected from July 1, 2018 to July 1, 2019. According to the statistics, the cumulative number of shutdowns for wind turbines failure is 261, and some of the shutdowns are listed in Table 3.
The wind turbine shutdown failure data.

The interception time of the failure data T = 8760 h, the value of Z = −2.77 is obtained using equation (5), the confidence is assumed to be
According to equations (6) and (7), the scale parameter estimate is nearly 0.05, and the shape parameter estimate is nearly 0.95; so, the failure intensity function, cumulative intensity function, instantaneous MTBF, and cumulative MTBF are expressed as follows


The failure intensity curve is shown in Figure 8, the (instantaneous, cumulative) MTBF is shown in Figure 9, and the cumulative fault intensity curve is shown in Figure 10.

The fault intensity curve of the wind turbine.

The wind turbine mean time between failures.

The cumulative fault intensity curve of wind turbine.
Figure 8 shows the failure intensity curve of the wind turbine, and the shape parameter estimate β = 0.95 < 1, which represents the conditional probability of failure in the next unit time under the condition that the wind turbine has not failed at a certain time. The failure intensity of the batch of units decreases monotonously and becomes flat. Failure intensity of the wind turbines is relatively high in the initial period of use, but the failure intensity decreases with the increase of the operating time. The wind turbine is in an improved state, which is in the first stage of the bathtub curve.
Figure 9 shows the (instantaneous, cumulative) MTBF of the wind turbines, which represents the time elapsed by a failure of the wind turbine. The MTBF in the initial stage of operation of the wind turbines is relatively small. However, the MTBF gradually increases with the increase in the running time. The wind turbines are in an improved state, which is consistent with the conclusion of the failure intensity curve of the wind turbines (see Figure 7). Besides, the MTBF shows a time trend, based on which the MTBF of the next working point of the wind turbines can be effectively predicted.
Figures 8 and 9 only show that the wind turbines are in a state of improvement. However, whether the power law model is effective or not is shown in Figure 10.
Figure 10 shows the cumulative failure intensity curve of the wind turbines, which represents the cumulative number of failures of the wind turbine in the statistical time. The actual value is the cumulative number of shutdown failures of the wind turbines obtained from statistics, and the PLP model represents the cumulative failure intensity function g(t). The curve of the PLP model tends to be consistent with the curve of the actual cumulative shutdown failure times, and the PLP model may reflect the failure process.
Wind turbine reliability-related indexes
From the analysis above, calculate the reliability-related indexes of the batch of wind turbines and compare the shutdown fault data. 24,25 The results are given in Table 4.
Comparison of reliability indexes.

Table 4 lists that the wind turbines of the wind farm have frequent faults. They do not cause long shutdowns, and the normal shutdown is far lower than the international level. 25 Also, the availability rate is about 98.3% to meet the Chinese standard of about 97% reliability for onshore wind turbines.
Conclusion
In this article, a reliability assessment framework has been proposed. Based on this method, the operating condition of a system has been characterized by the reliability-related indexes.
The items of a system have been categorized into different items, and most of the failures come from the electrical control subsystem, pitch subsystem, generator subsystem, and hydraulic subsystem, among which the electric control subsystem has the highest proportion of failures. The minimal cut sets of failure events should be monitored regularly. In addition, the redundant protection design in the blade subsystem can effectively not only reduce its failures but also improve its reliability.
The proposed PLP model significantly reflects the failure process of the wind turbines according to the bathtub curve. The results showed that the failure process of the studied wind turbine is in an improved condition.
Footnotes
Author contributions
Jianfeng Wei contributed to data curation and formal analysis; Yuqiao Zheng contributed to funding acquisition; Jianfeng Wei contributed to investigation; Yuqiao Zheng contributed to methodology, project administration, and resources; Bo Dong contributed to software and supervision; Yuqiao Zheng contributed to validation; Jianfeng Wei contributed to visualization; Kai Zhu and Bo Dong contributed to writing—original draft; and Yuqiao Zheng contributed to writing—review and editing.
Declaration of conflicting interests
The author(s) declared no potential conflicts of interest with respect to the research, authorship, and/or publication of this article.
Funding
The author(s) disclosed receipt of the following financial support for the research, authorship, and/or publication of this article: This work was supported by the National Natural Science Foundation of China [grant numbers 51965034 and 51565028] and the Fundamental Research Funds for the Lanzhou city Innovation and Entrepreneurship Project No. 2018-RC-25.