
Abstract
The ultrafine tin oxide (SnO2) nanorods/reduced graphene oxide (rGO) composites are synthesized by a two-step hydrothermal method. The prepared nanocomposites are characterized by scanning electron microscope, X-ray diffractometer, and Fourier transform infrared spectra. The results of electrochemical performance show that specific capacitance of the composite can reach 262.2 F g−1 at the current density of 100 mA g−1 in the 1 M Na2SO4 electrolyte. An initial capacitance retention of the composite is 96.1% after 6000 cycles, indicating its excellent electrochemical performance.
Introduction
Electrode materials play the most important factor in determining the performance of supercapacitors, usually exhibiting low energy density and high cost in the practical application. Graphene, a new member of the carbon family with high specific surface area, good electrical conductivity, and high flexibility and mechanical strength, has attracted more attention as the electrode materials of supercapacitor. However, the graphene-based supercapacitor usually presents low specific capacitance due to the stacking effect. To solve this problem, many various metal oxide nanomaterials-decorated graphene have been fabricated. Among these materials, SnO2 has attracted more attention due to its low cost. 1 –3 In fact, the fabricating of SnO2 with various materials as electrodes for supercapacitor exhibits significant enhancing on the performance. For example, the SnS2-SnO2 nano-heterostructured as an electrode material for supercapacitor applications shows a capacitance of 149 F g−1 at 2 A g−1. 4 The nanoporous SnO2/carbon nanotubes composites for supercapacitor application show the 188.42 F g−1 at a potential scan rate of 2 mV s−1. 5 For many of these composites materials, many studies show that graphene is an effective conductive substrate for further construction of the high-quality SnO2 nanomaterials. 1,6 –12 The preparation of SnO2/graphene composites can not only effectively prevent the reunion of SnO2 nanostructures and stack of graphene resulting the larger electrical activity surface area but also improve the electrical conductivity and mechanical stability of composite material, which is good for the transport of ionic and the improve of electrochemical performance.
Although the previously reported SnO2/graphene composites electrode materials have excellent cycle stability, their specific capacitance is not ideal. Taking into consideration the fact that SnO2/graphene composites have structural advantages and a large specific surface area, it has further research value. Among various electrode materials, manganese dioxide (MnO2) has been studied as the most promising electrode material for supercapacitors due to its large theoretical specific capacity (1370 F g−1), low cost, and natural abundance. However, the development of MnO2-based electrode materials is still limited by its inherent defects, including low conductivity, slow ion transport speed, and large volume changes during charge and discharge. It has been reported that ultrafine MnO2 nanorods have been synthesized by hydrothermal reaction through the addition of concentrated hydrochloric acid to an aqueous solution of permanganate (KMnO4). 13 We plan to further combine the ultrafine SnO2 nanorod/rGO composite with MnO2 nanorods and hope to obtain higher performance electrode materials through the synergistic effect of the three materials.
In this study, the ultrafine SnO2 nanorods/rGO composites are synthesized by a simple one-step hydrothermal method. 6 Although the composite electrode shows excellent cycling stability, its specific capacitance is not ideal. To further improve the performance of SnO2/rGO composites, the SnO2/rGO composites are treated by a second-step hydrothermal reaction with the help of KMnO4 solution. However, no MnO2 or other manganese-based oxides are detected in the products after the second-step hydrothermal reaction. But the results of the electrochemical test of final synthesized materials show significant improvement in the electrochemical performance. The specific capacitance can reach 262.2 F g−1 at the current density of 100 mA g−1 in the 1 M Na2SO4 electrolyte. An initial capacitance retention of the composite is 96.1% after 6000 cycles, indicating its excellent electrochemical performance.
Experiment section
All chemical reactants used are of analytical grade without further purification. First, the rGO-loaded superfine SnO2 nanorods composites are synthesized by a simple one-step hydrothermal method according to our previous reports 6 : 1 mg mL−1 graphene oxide (GO) (15 mL) water dispersion solution is added to the 9 mL SnCl4·5H2O (7.5 mg) aqueous solution, stirred vigorously for 10 min. Then hexamethylene (60 mg) and concentrated hydrochloric acid (1.2 mL) are added to the solution, respectively. Next, the mixture is transferred into a 30 mL Teflon-lined stainless steel autoclave, hydrothermally treated at 120°C for 24 h. After the reactor naturally cools to room temperature, the collected synthetic products are washed and centrifuged several times with anhydrous ethanol and deionized water, and then dried in a vacuum oven at 60°C for 12 h. The sample is marked as SnO2 nanorods/rGO (1:2). Second, the sample SnO2 nanorods/rGO (1:2) are dispersed into 24 mL water, the solution is added into 10 mg KMnO4 and stirred for 15 min in the magnetic stirrer, and then 1.2 mL concentrated hydrochloric acid was added, followed by stirring for 15 min, and subsequently, the mixed solution is treated like the first-step procedure. The final sample is marked as SGT.
The structure and morphology of the samples are observed by scanning electron microscope (SEM, Hitachi, Japan SU8010) at 5 kV and transmission electron microscopy (TEM, JEM-2010FEF, JEOL of Japan) at 200 kV, respectively. Composition and crystal structure of samples are characterized by X-ray diffractometer (XRD, D/MAX-2500, Rigaku of Japan) using copper K α radiation (λ = 1.54056 Å) at a scanning rate of 80° min−1 with the scanning range of 10–80°. Fourier transform infrared (FTIR) spectrum is performed using the spectrometer (Frontier Mid-IRFT-IR, produced by Perkinelmer of USA) in the range of 400–4000 cm−1.
The electrochemical measurements are carried out by electrochemical workstation (PGSTAT 302N) using a three-electrode system in 1 M Na2SO4 as the electrolyte. Working electrode is prepared as follows: active materials, carbon black, and polytetrafluoroethylene are mixed at the quality ratio of 80:15:5 in ethanol, grinding evenly, then the slurry is pressed to foam nickel (1 × 1 cm2) and dried at 60°C for 12 h in vacuum oven, finally pressed to slices. The quality of active material on the electrode is about 3 mg. The foam nickel coated with active materials is used as the working electrode, the platinum sheet (1 × 1 cm2) and silver/silver chloride (Ag/AgCl) electrode are used as the counter and the reference electrode, respectively. The cyclic voltammetry (CV) measurements are performed at scan rates of 5, 10, 20, 50, and 100 mV s−1 in the potential window of −0.8 to 0.4 V. The galvanostatic charge and discharge (GCD) test is carried out at the current density of 100, 200, 500, 1000, and 2000 mA g−1. The AC impedance test is carried out within a frequency range of 100 kHz to 0.05 Hz at a signal voltage of 5 mV. The cyclic stability of the composite electrode is studied by a CV test of 6000 cycles at a scan rate of 50 mV s−1. The specific capacitance is calculated using the following equation:

where I is the discharge current (A), t is the discharge time (s) took in the potential range, ΔV is the potential window width (V), and m is the mass of the active material (g).
Results and discussion
The structure and morphology of the samples are observed by SEM. It can be seen from Figure 1(a) and (b) that ultrafine nanorods are evenly distributed on the surface of rGO in the composite material. To ascertain the structure of SGT composites, TEM and high-resolution transmission electron microscope (HRTEM) analyses are performed. It can be seen from Figure 2 that SnO2 nanorods (lattice fringes is 0.36 nm as shown in Figure 2(c)) with a diameter of about 10–20 nm and a length of about 100 nm are evenly distributed on the surface of rGO consisting with the results of SEM. However, the size of SnO2 nanorods is bigger than that of the SnO2 nanorods/rGO (1:2). 6 The corresponding element distribution map (Figure 2(d)) shows that only the element distribution diagram of C, O, and Sn can be found. XRD analysis is also performed (Figure 3). The sharper and stronger diffraction peaks of SGT with smaller half peak are showed to compare with SnO2 nanorods/rGO (1:2), which indicated that the crystallization of SnO2 in SGT composites is better than in SnO2 nanorods/rGO (1:2). Figure 4 shows the FTIR spectra of both composite materials. The peak intensity of SGT composites corresponding to the stretching vibrations of C–O (C–O–C in exposide), C=O (carboxyl and carbonyl), and O–H (carboxyl) is weakened significantly, demonstrating that GO is further reduced into rGO after the two-step hydrothermal reaction.

SEM images of samples: (a) ultrafine SnO2 nanorods/rGO(1:2) and (b) SGT. SEM: scanning electron microscope.
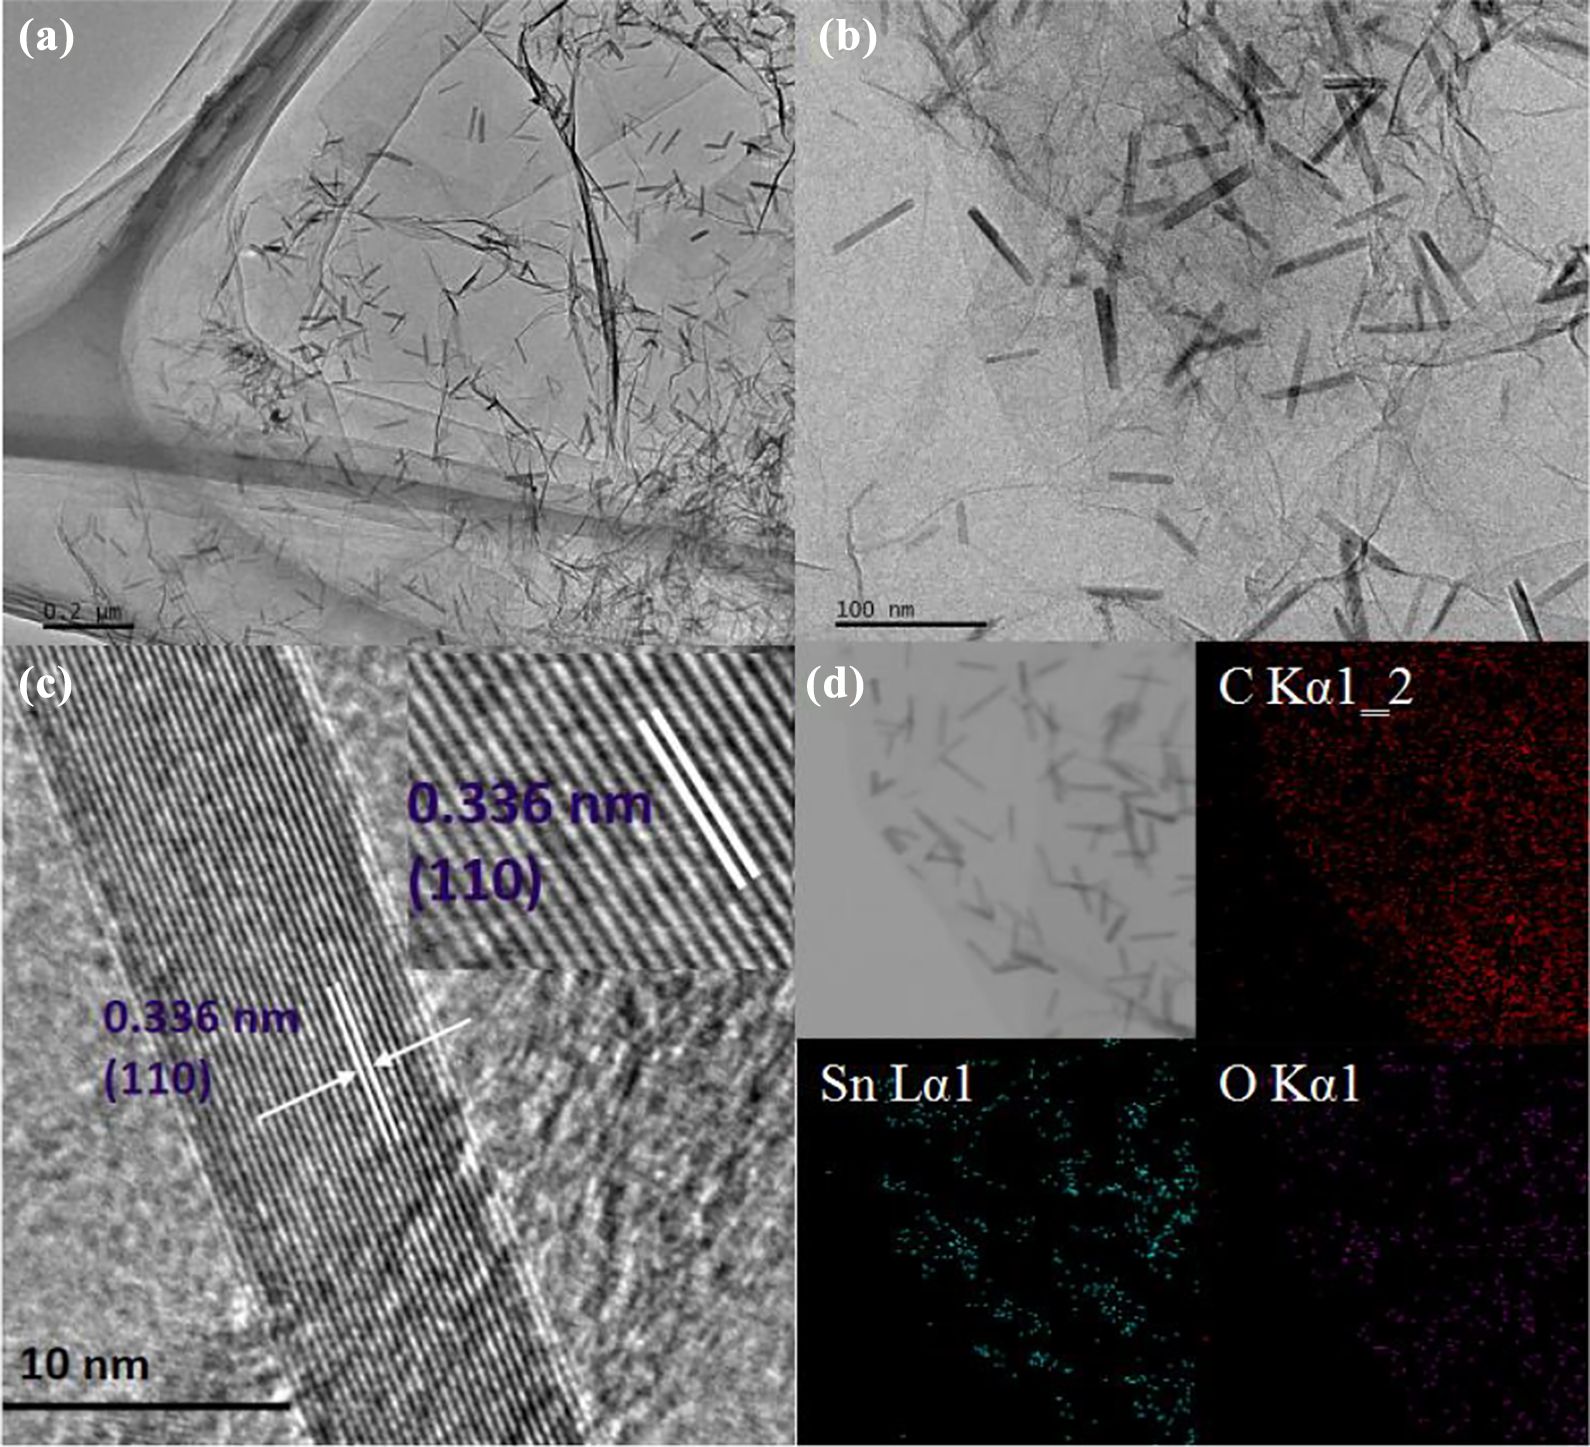
(a) and (b) TEM images of SGT composite, (c) HRTEM images of SGT composite, and (d) element mapping images of SGT composite. TEM: transmission electron microscopy.
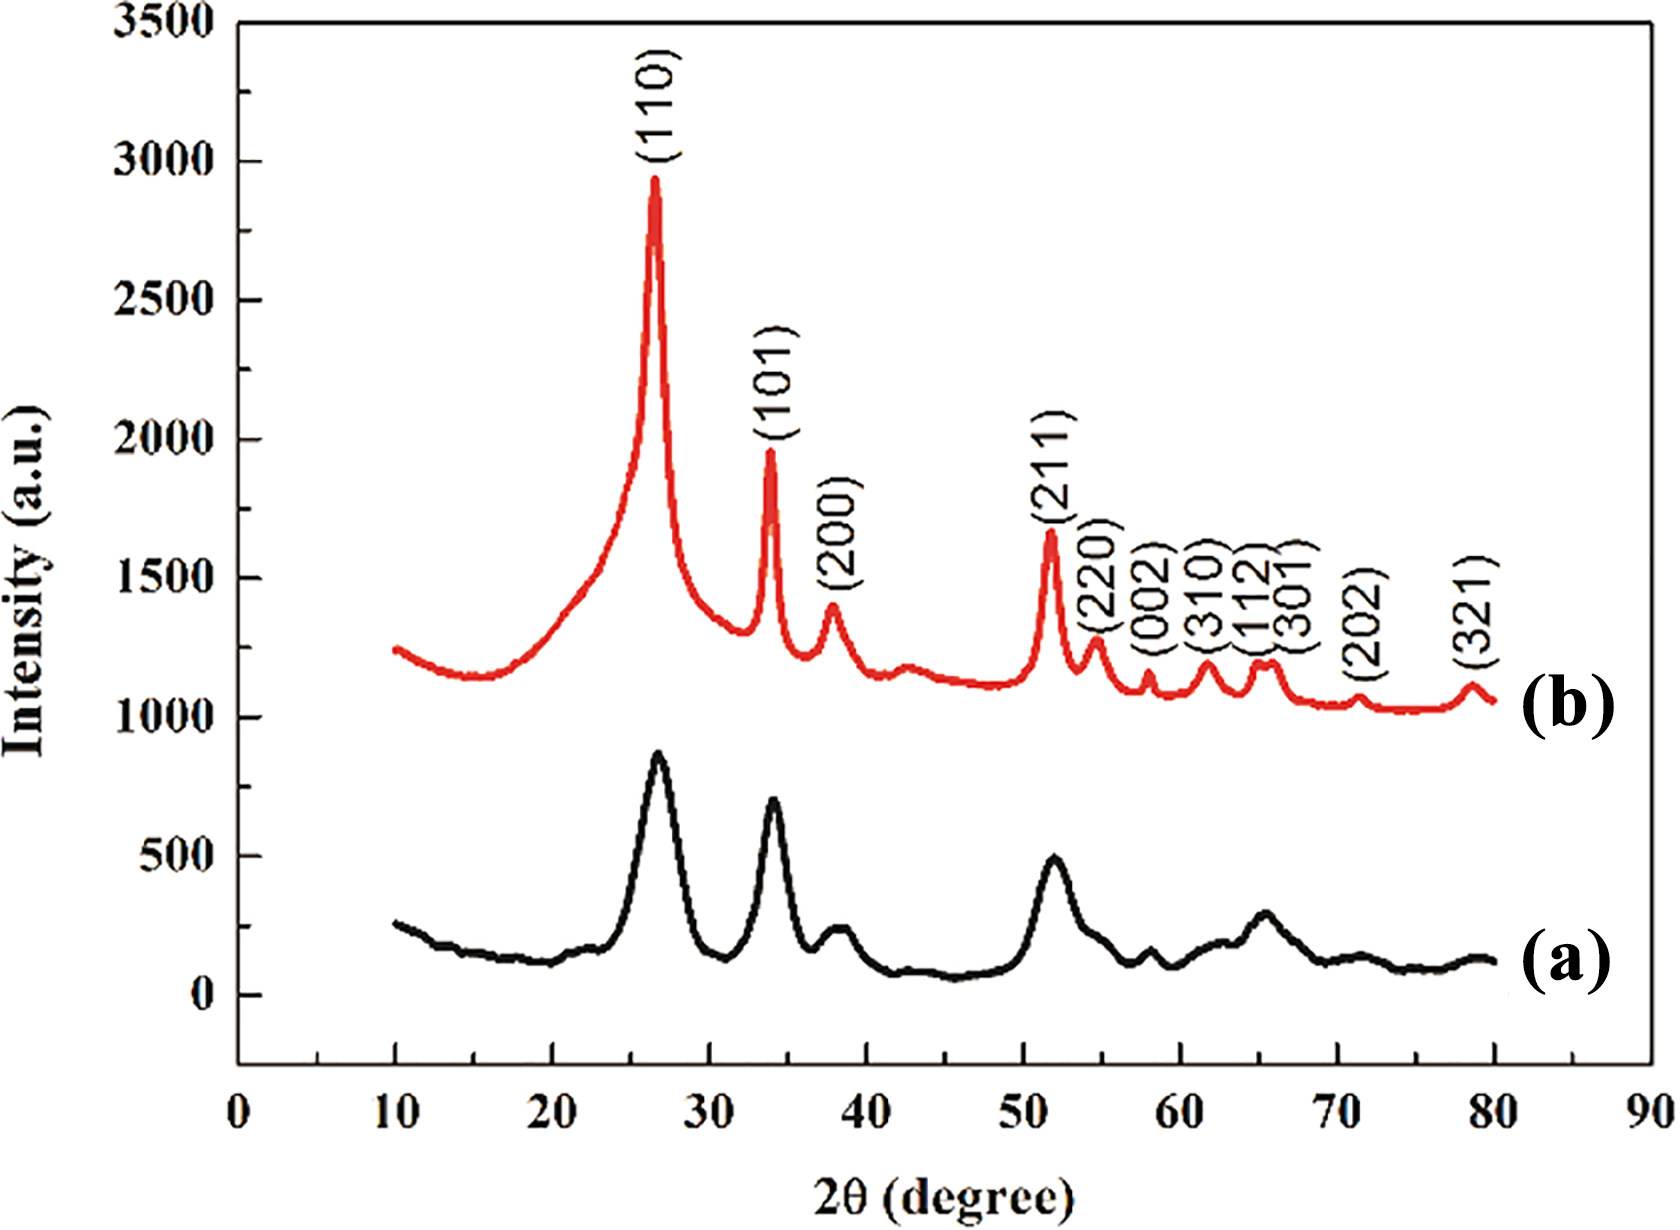
XRD patterns of the (a) ultrafine SnO2 nanorods/rGO (1:2) and (b) SGT composites. XRD: X-ray diffraction.
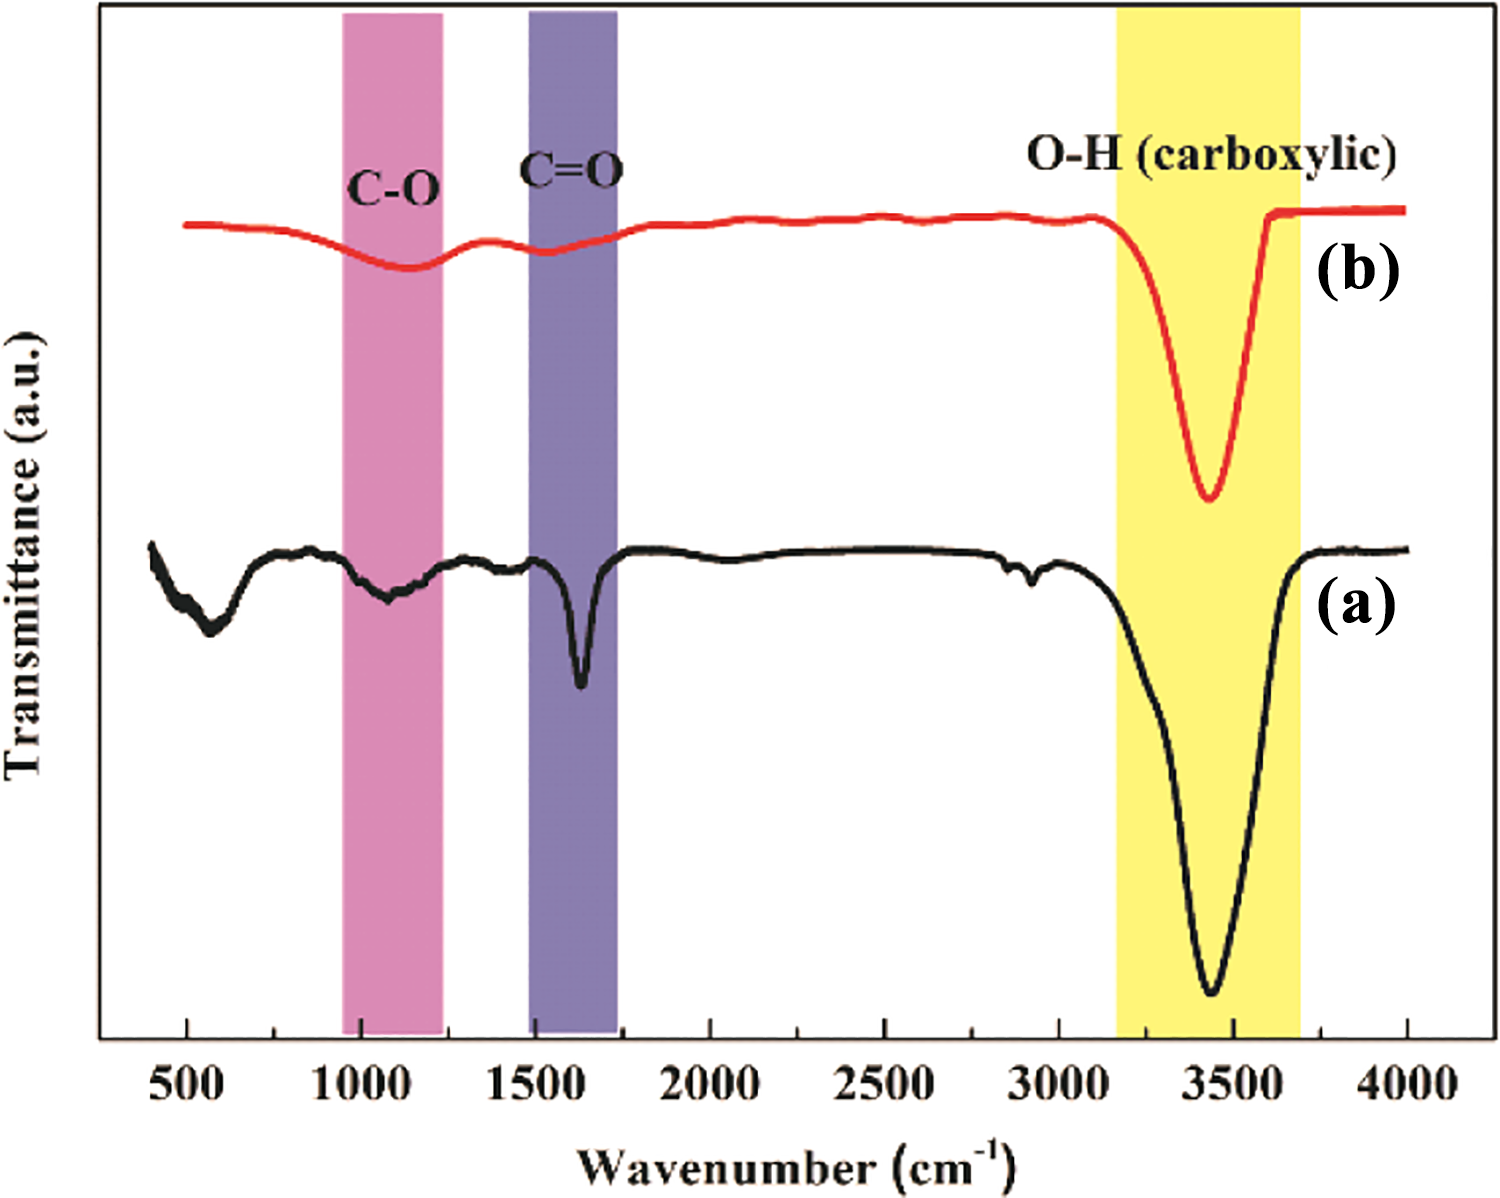
FTIR spectra of (a) ultrafine SnO2 nanorods/rGO (1:2) and (b) SGT composites. FTIR: Fourier transform infrared.
To further determine the chemical composition of the SGT composite, X-ray photoelectron spectroscopy (XPS) analysis is performed. Figure 5(a) shows the XPS full spectrum of the SGT composite. It can be clearly seen that the sample contains C, O, and Sn elements and no Mn element. In addition, the high-resolution XPS spectrum of Mn in Figure 5(b) also shows the same result. Figure 5(c) shows the high-resolution XPS spectrum of Sn 3d in the composite. The Sn 3d3/2 and Sn 3d5/2 peaks of the SnO2 nanorod are at 496.1 and 487.6 eV, respectively, which corresponds to the +4 valence Sn atom. 1 There is no peak corresponding to other valences of Sn, which proved that SnO2 is formed on the surface of graphene. In Figure 5(d), the peaks at 284.8, 286.2, and 289.0 eV correspond to C–C, C–O, and O–C=O bonds, respectively. This is very consistent with the reported results. In addition, through the test of XPS, we know that the atomic percentages of Sn and C in SnO2 nanorods/rGO (1:2) are 1.5% and 78.43%, respectively, while the atomic percentages of Sn and C in SGT composites are 1.14% and 78.52%, respectively. A little increase of C element indicates that rGO is further reduced by further hydrothermal reaction. This is advantageous for improving the electrical conductivity of the composite. When used as an electrode material, it is possible to provide more specific capacitance. In general, in a neutral Na2SO4 electrolyte, Na+ can be absorbed and desorbed on the surface of the SnO2 electrode. This process can be described as

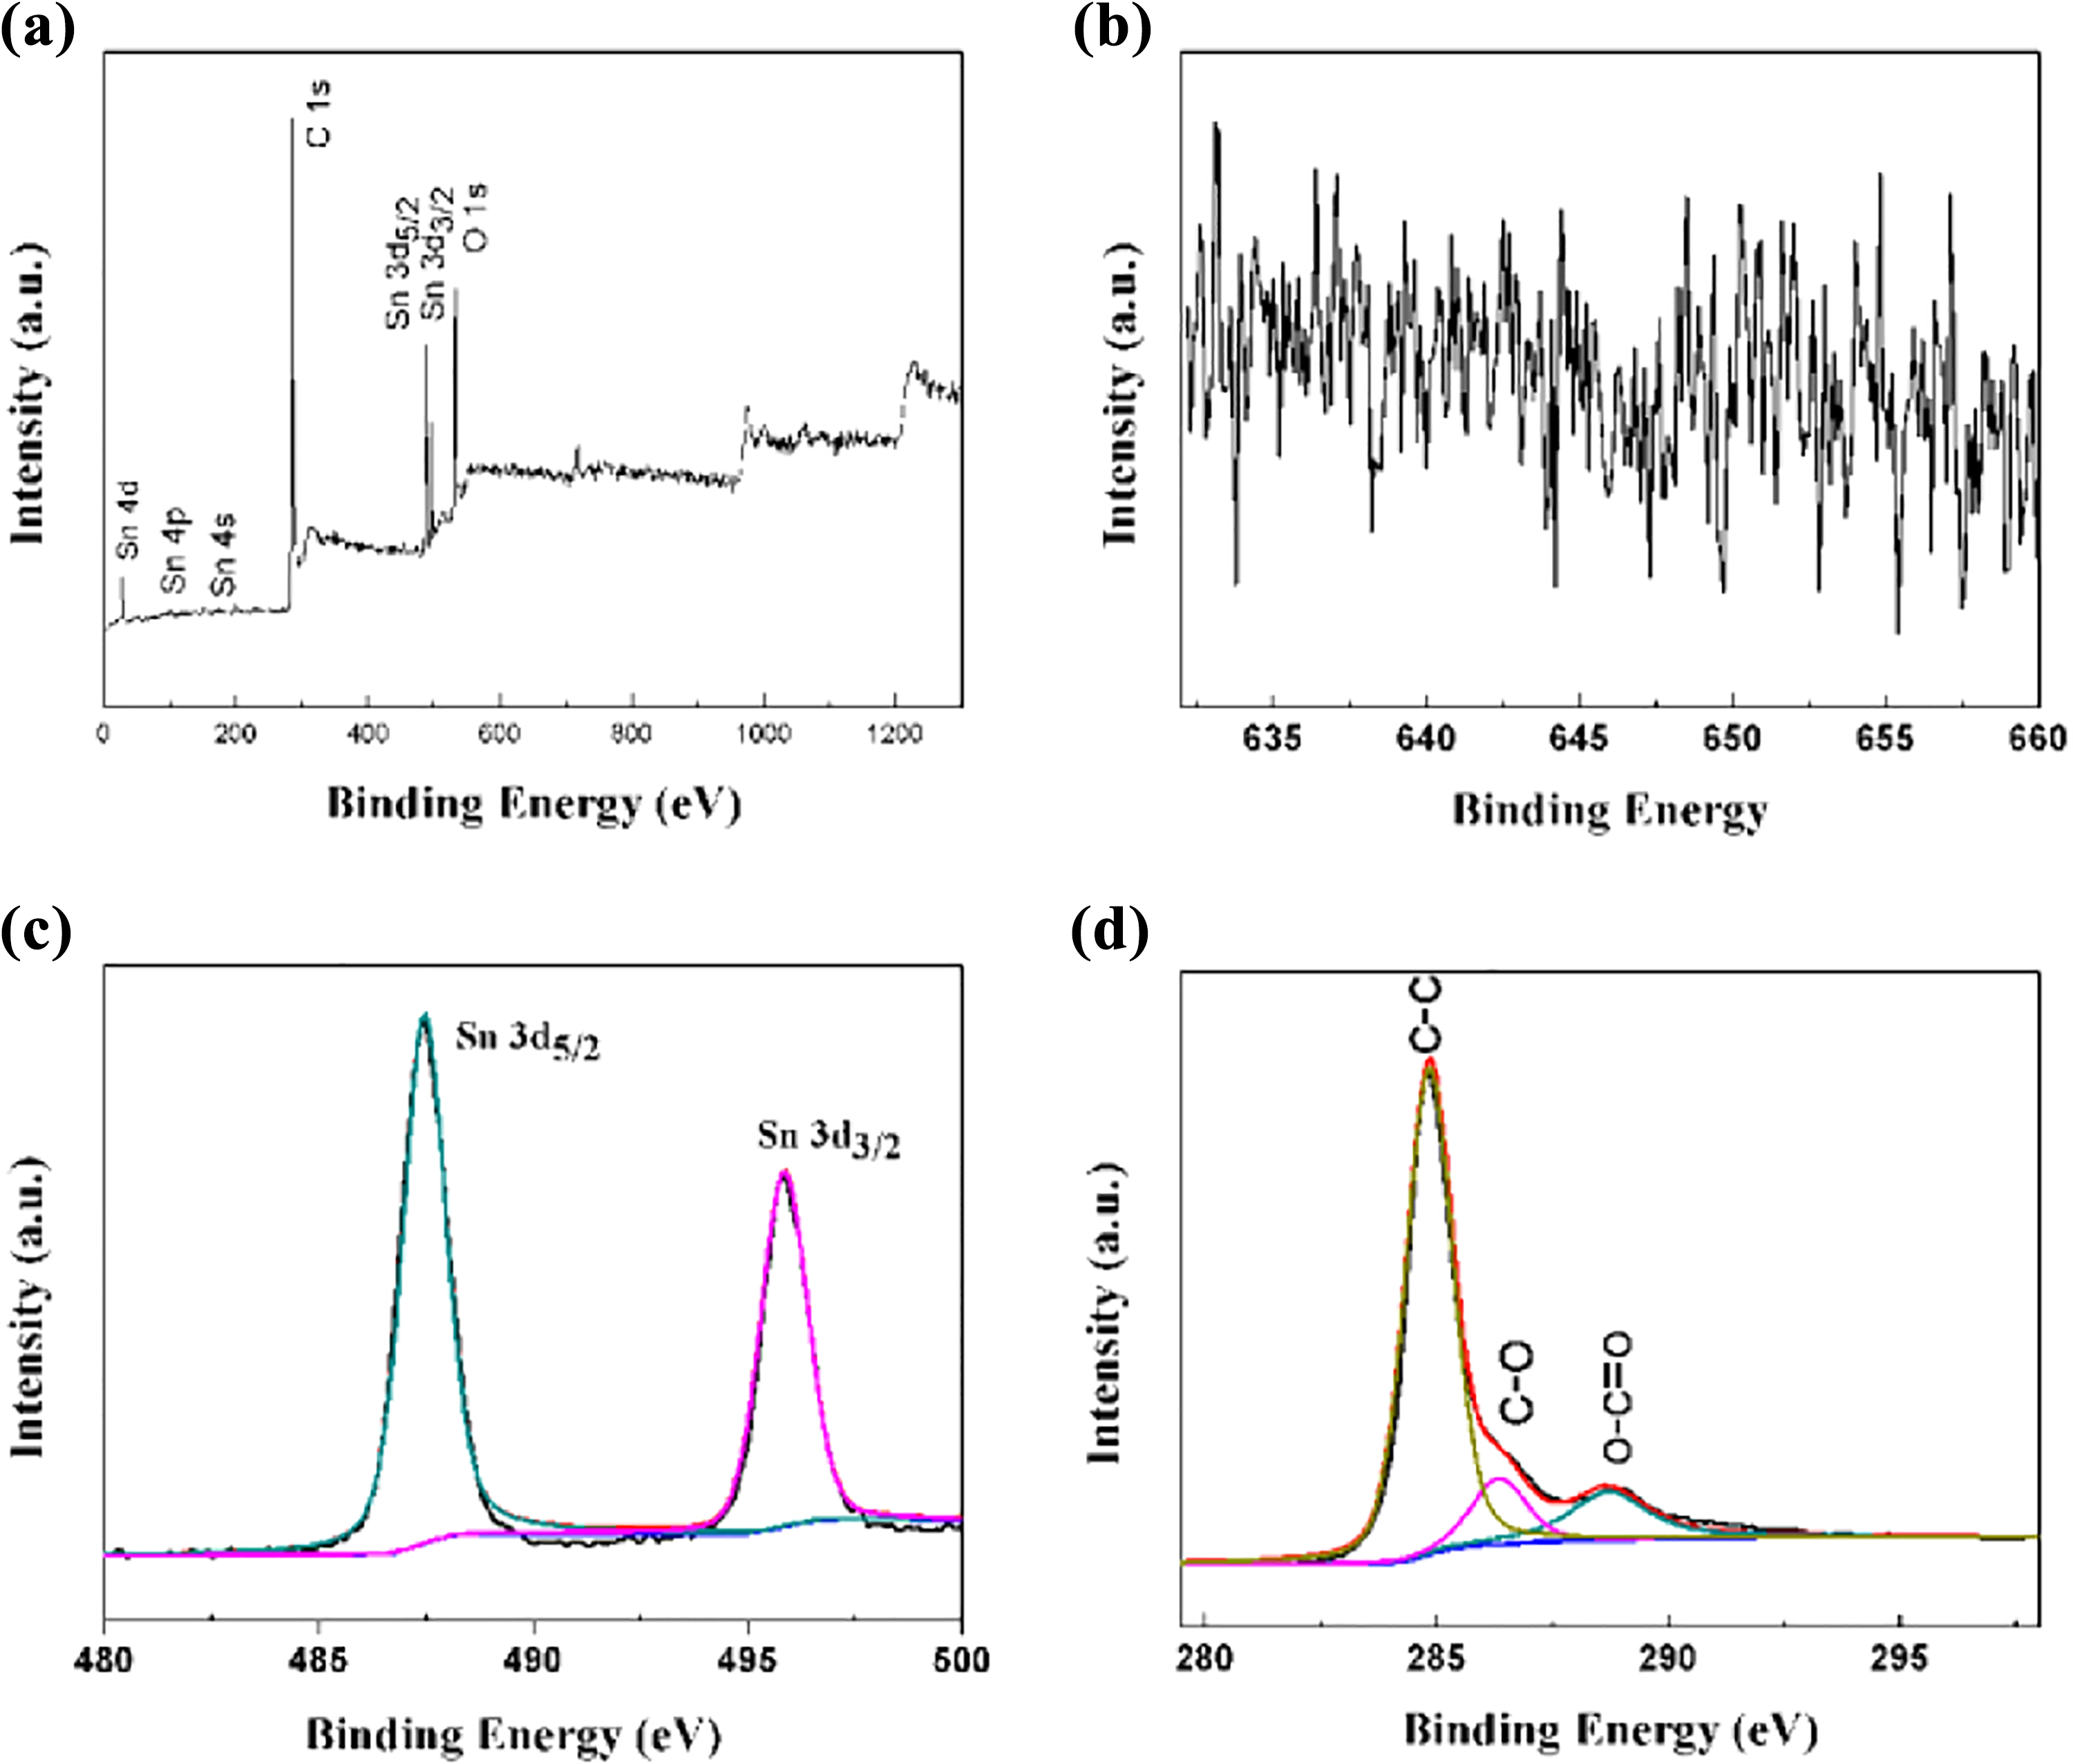
XPS survey spectrum (a) of the SGT composites, high-resolution XPS spectra of Mn (b), Sn (c), and C (d). XPS: X-ray photoelectron spectroscopy.
The above characterizations show that no MnO2 or other manganese oxides are produced in the final product. However, we find that the average size of SnO2 nanorods loaded on rGO increased, and the small size of SnO2 crystals basically disappeared compared with ultrafine SnO2 nanorods/rGO (1:2), which may be explained by the “Ostwald aging” mechanism. When hydrochloric acid is added into the SnO2 nanorods/rGO (1:2) water dispersion for further hydrothermal treatment at high temperatures, smaller size of SnO2 particles will become the source of the tin to ensure the continued growth of larger size of the SnO2. The average size of SnO2 nanorods in the final product increased, and the crystallinity of SnO2 also became better. Meanwhile, the reduction degree of rGO increased after the second hydrothermal treatment, which can enhance the conductivity of the composite material leading to its excellent electrochemical performance.
The electrochemical measurements including the GCD, CV measurements, and electrochemical impedance spectroscopy (EIS) are performed using the three-electrode system in 1 M Na2SO4 electrolyte. Figure 6(a) shows the GCD curve of composites within the potential range of −0.8 to 0.4 V at a current density of 100 mA g−1. It can be observed that the SGT composite electrode shows longer discharge time, indicating better electrochemistry performance. Figure 6(b) shows the GCD curves of SGT composite as electrodes at different current densities (100, 200, 500, 1000, and 2000 mA g−1). The specific capacity of both composites at different current densities is calculated using equation (1). It can be seen that the specific capacity of SGT composite electrode exhibits a maximum of 262.2 F g−1 at the current density of 100 mA g−1, which is higher than that of ultrafine SnO2 nanorods/rGO (1:2) (Figure 6(c)).

(a) GCD profiles of ultrafine SnO2 nanorods/rGO (1:2) (black) and SGT (red) composites at current densities of 100 mA g−1; (b) GCD profiles of SGT composites at current densities of 100, 200, 500, 1000 and 2000 mA g−1, respectively; and (c) capacitance values of ultrafine SnO2 nanorods/rGO (1:2) (black) and SGT (red) composites at different current densities. GCD: galvanostatic charge and discharge.
Figure 7(a) is the CV curve of both composite electrodes at the scanning rate of 50 mV s−1 in the potential range of −0.8 to 0.4 V, the larger area of the CV curve of SGT composite materials indicated the higher specific capacitance, which is consistent with the GCD results. In addition, the CV of SGT composites is performed at different scanning rates (5, 10, 20, 50, and 100 mV s−1), as shown in Figure 7(b). The CV curve shows a good symmetry, which indicates that the composite material has good reversibility as the electrode. With the increasing of scanning rate, the peak current value presents an upward trend, and the shape of the curve is basically unchanged, which indicates that the electrochemical properties of the SGT composite electrode in this potential range are stable. Furthermore, the cycle stability of both composite electrodes after 6000 cycles at a scan rate of 50 mV s−1 is compared, as shown in Figure 7(c). Although an initial capacitance retention of SGT composite is smaller than that of ultrafine SnO2 nanorods/rGO (1:2) after 6000 cycles attributed to the bigger size leading to structural instability under multiple cycles, 96.1% of an initial capacitance retention of SGT composite can still be reached.

(a) CV curves of the ultrafine SnO2 nanorods/rGO (1:2) (black) and SGT (red) composites at a scan rate of 50 mV s−1, (b) CV curves of SGT composite at different scan rates, and (c) cycling performance of ultrafine SnO2 nanorods/rGO (1:2) (black) and SGT (red) composites at a scan rate of 50 mV s−1. CV: cyclic voltammetry.
To analyze the internal resistance of material, EIS measurement is conducted. Figure 8 shows Nyquist curves for both composites at a signal voltage of 5 mV within the frequency range from 100 kHz to 0.05 Hz under the open-circuit voltage, and impedance diagram at high frequency and the equivalent circuit diagram of the composite material are shown in the inset. According to the analysis of high-frequency area, the equivalent series resistance of the SnO2 nanorods/rGO (1:2) and SGT composites calculated are about 1.5 and 3.25Ω, respectively. It is obvious that the equivalent series resistance of SGT composite material is much smaller than that of SnO2 nanorods/rGO (1:2). Meanwhile, the larger semicircle at the high-frequency region explains the larger charge transfer resistance of the SGT composite electrode. Although the electrical conductivity of SGT is lower than that of SnO2 nanorods/rGO (1:2) to a certain extent, it still has excellent electrochemical performance. The SnO2/rGO composite in our study may have a potential application in other energy storage fields due to its special morphology and composition. 14 –16

EIS for SnO2 nanorods/rGO (1:2) and SGT composite.
Conclusion
In summary, the superfine SnO2 nanorods/rGO composites are synthesized and further treated by the secondary hydrothermal method using KMnO4. The results show that no MnO2 or other manganese oxides are generated in the final composite. However, the capacitance performance of the composite material is improved after secondary hydrothermal treatment. The final composite electrode shows better electrochemical performance which reaches 262.2 F g−1 at the current density of 100 mA g−1 in the 1 M Na2SO4 electrolyte, significantly higher than before. An initial capacitance retention of the composite is 96.1% after 6000 cycles, indicating its excellent electrochemical performance.
Footnotes
Declaration of conflicting interests
The author(s) declared no potential conflicts of interest with respect to the research, authorship, and/or publication of this article.
Funding
The author(s) disclosed receipt of the following financial support for the research, authorship, and/or publication of this article: This work was supported by the National Natural Science Foundation of China [grant number 11504267] and Tianjin Municipal Education Commission Scientific Research Project (2018KJ151).