
Abstract
Studying proteomics data of the human brain could offer numerous insights into unraveling the signature of resilience to Alzheimer’s disease. In our previous study with rigorous cohort selection criteria that excluded 4 common comorbidities, we harnessed multiple brain regions from 43 research participants with 12 of them displaying cognitive resilience to Alzheimer’s disease. Based on the previous findings, this work focuses on 6 proteins out of the 33 differentially expressed proteins associated with resilience to Alzheimer’s disease. These proteins are used to construct a decision tree classifier, enabling the differentiation of 3 groups: (i) healthy control, (ii) resilience to Alzheimer’s disease, and (iii) Alzheimer’s disease with dementia. Our analysis unveiled 2 important regional proteomic markers: Aβ peptides in the hippocampus and PA1B3 in the inferior parietal lobule. These findings underscore the potential of using distinct regional proteomic markers as signatures in characterizing the resilience to Alzheimer’s disease.
Introduction
Alzheimer’s disease (AD) is characterized at the tissue and cellular level by the accumulation of amyloid-beta plaques and pathologic forms of tau. Typically, increasing amounts of tissue and cellular changes harbored in the brain are reflected in progressively greater cognitive impairment. However, there are unusual people with high tissue and cellular changes of AD who exhibit normal clinical behavior by rigorous research testing, a state called cognitive resilience to Alzheimer’s disease (RAD). 1 Our previous study harnessed multiple brain regions from 43 research participants who met stringent cohort inclusion and exclusion criteria for healthy controls (HC), individuals with AD dementia (ADD) only, and individuals with RAD only. 1 This stringent cohort selection allowed us to rule out potential confounding comorbidities including vascular brain injury (VBI), Lewy body disease (LBD), hippocampal sclerosis (HS), and limbic-associated TDP-43 encephalopathy neuropathologic change (LATE-NC).2 -4. With the comorbidities excluded, the cohort consisted of 11 HC, 12 RAD, and 20 ADD.
In detail, HC is defined by participants whose neuropsychological test results during their final research visit within 2 years before death ranked in the upper quartile for the cohort. Additionally, they did not exhibit AD neuropathologic change (ADNC) as per NIA-AA guidelines and showed clinically insignificant (none/low) pathological indications of VBI, LBD, HS, or LATE-NC. Individuals with RAD also had neuropsychological test results during their last visit within 2 years before death in the upper quartile for the cohort; however, individuals with RAD also displayed intermediate or high-level ADNC, a level of tissue and cellular change sufficient to diagnose dementia according to NIA-AA guidelines, along with none/low pathological changes of VBI, LBD, HS, or LATE-NC. In contrast, individuals classified as ADD were those diagnosed with dementia during their life exhibited intermediate or high-level ADNC, and possessed none/low pathological changes of VBI, LBD, HS, or LATE-NC. It is noteworthy that among older individuals, each of these 5 common comorbidities, including AD itself, can cause dementia. Our previous study excluded VBI, LBD, HS, and LATE-NC to ensure high-quality samples that focused on AD only unconfounded by common comorbidities in any of the 3 groups.
We used data-independent tandem mass spectrometry to measure up to 7,115 proteins across 4 distinct brain regions: caudate (CAUD), hippocampus (HIPP), inferior parietal lobule (IPL), and superior and middle temporal gyrus (SMTG). Through differential expression analysis, we identified 33 differentially expressed proteins (DEPs) that are associated with RAD. These findings raise intriguing questions about the pivotal proteins that could effectively differentiate the RAD group from both HC and ADD groups. By using a decision tree classifier 5 with 6 intriguing proteins, our investigation revealed the top 5 proteins that hold the greatest potential to distinguish the RAD group.
Using Decision Tree Classifier to Distinguish Clinico-Pathological Groups
With the identified 33 RAD DEPs, we first selected 6 proteins from 1 or multiple brain regions that could potentially differentiate the RAD group: (1) Aβ from CAUD, HIPP, IPL, and SMTG; (2) PA1B3 from IPL; (3) KS6A2 from IPL; (4) ICAM1 from SMTG; (5) IF5 from HIPP; and (6) TICN3 from SMTG. Aβ was chosen since it is recognized as a significant ADD marker. The remaining 5 proteins were chosen due to the presence of more than 1 significant comparison observed within their associated brain regions, based on earlier findings. 1
A decision tree classifier was constructed using these 6 proteins (yielding a total of 9 features) while considering balanced class weights. We constructed the classifier using Python version 3.9.15 and the “DecisionTreeClassifier” module from scikit-learn version 0.24.2. 6 We configured the classifier with the Gini criterion 5 and set the minimum sample split to 2. The classifier was then trained using data from 43 research participants. Upon establishing the decision tree classifier, we observed that a combination of 5 proteins—Aβ (HIPP and CAUD), PA1B3 (IPL), ICAM1 (SMTG), IF5 (HIPP), and TICN3 (SMTG)—achieved perfect differentiation among the clinico-pathological groups: HC, RAD, and ADD (Figure 1a). The primary branching was determined by the expression of Aβ (HIPP). Following this, subsequent sub-branches relied on the expression levels of TICN3 (SMTG) if Aβ (HIPP) expression was ⩽22.59, and PA1B3 (IPL) if Aβ (HIPP) expression >22.59. The next-level sub-branches stemming from PA1B3 (IPL) were segregated by IF5 (HIPP) and Aβ (CAUD), while the fourth-level sub-branch was from ICAM1 (SMTG). The decision tree underscored the pivotal role of Aβ (HIPP) as the primary distinguishing feature for clinico-pathological groups, with PA1B3 (IPL) following closely as the second most significant attribute in stratifying RAD and ADD.
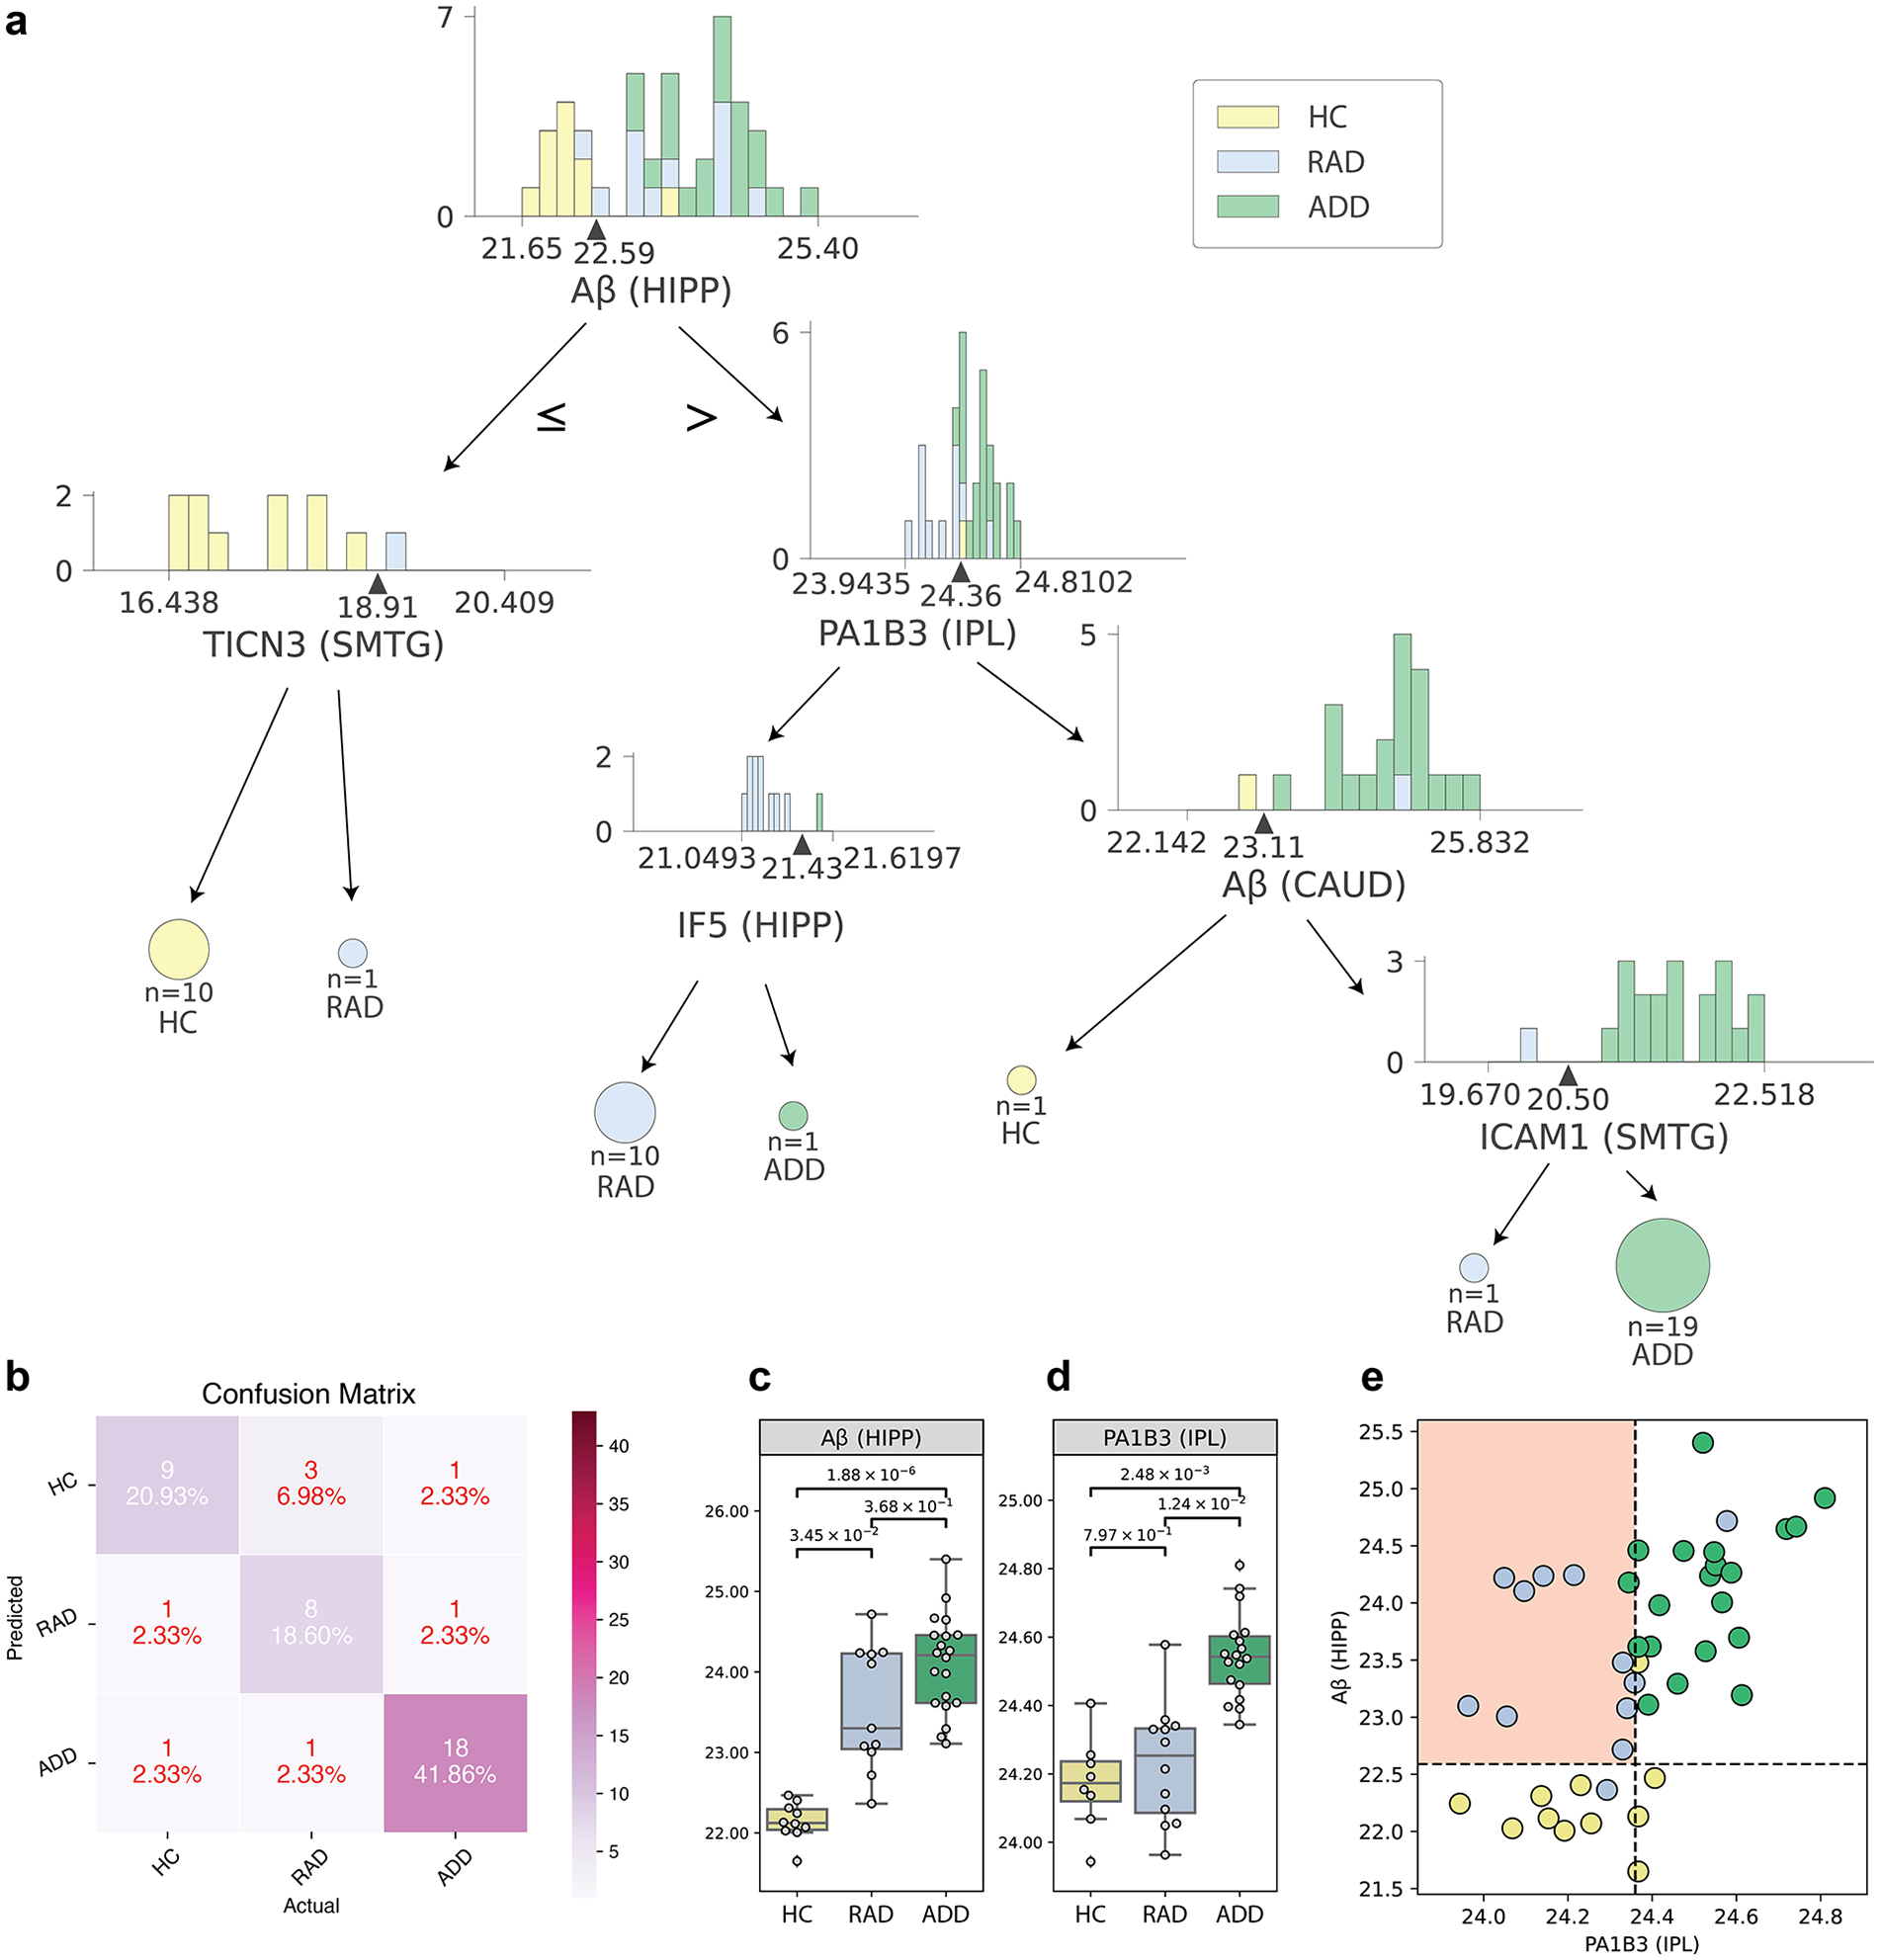
Proteomic markers that can be used to distinguish HC, ADD, and RAD groups: (a) the decision tree identified 5 proteins, (b) confusion matrix with leave-one-out cross-validation using decision tree classifier, (c) Aβ abundance in HIPP, (d) PA1B3 abundance in IPL, and (e) using Aβ abundance in HIPP and PA1B3 concentration in IPL to distinguish RAD from other groups. (c) and (d) P-values were derived from two-sided Student’s t-tests with the control for multiple hypothesis tests using the Benjamin-Hochberg procedure (FDR = 0.05).
In addition, by using leave-one-out cross-validation, we observed that these 6 proteins effectively classified the 3 clinico-pathological groups, yielding an overall leave-one-out accuracy of 81.40% (Figure 1b). The corresponding confusion matrix in Figure 1b indicated that these 6 proteins exhibit reasonable performance in distinguishing the various clinico-pathological groups.
Aβ and PA1B3 Are 2 Major Markers for Resilience to Alzheimer’s Dsisease
We focused on RAD and used a decision tree classifier to identify the most critical proteins for distinguishing this group. According to the results in Figure 1a, the proteins that emerged as most significant were Aβ (HIPP) and PA1B3 (IPL), which are found at the top root of the decision tree. Figure 1c highlights the Aβ (HIPP) expression in HC, RAD, and ADD groups, and Figure 1d highlights the PA1B3 (IPL) expression in HC, RAD, and ADD groups. The P-values were derived from two-sided Student’s t-tests corrected for multiple hypothesis tests using the Benjamin-Hochberg procedure (FDR = 0.05). Upon analyzing these protein concentrations in tissue extracts, we found that these 2 proteins exhibit distinctive patterns within the RAD group. Specifically, Aβ in HIPP appears to be effective in differentiating RAD and ADD from HC, whereas PA1B3 in IPL seems able to distinguish both HC and RAD from ADD. Based on this discovery, we presented a bi-axial plot in Figure 1e, featuring Aβ in HIPP along the y-axis and PA1B3 in IPL along the x-axis. Figure 1e suggests that Aβ in HIPP can serve as a surrogate marker for the pathological identification of AD, while PA1B3 in IPL can serve as a surrogate marker for the clinical identification of dementia in the context of AD. Remarkably, utilizing just these 2 proteomic markers can facilitate an effective identification of the RAD group.
Future Direction
Although a limited proxy for increased Aβ abundance, histologically-detected Aβ plaques typically first appear in the cerebral cortex in cognitively normal older adults and then extend to other regions of the brain in a stereotypical 5-step sequence that is highly correlated with dementia. 7 Aβ plaque accumulation in HIPP occurs relatively early in this sequence at the second of 5 phases. Our proteomic data showed that increased abundance Aβ in HIPP is more effective in distinguishing HC from those with AD pathologic changes (RAD and ADD), suggesting, like Aβ plaques, that it is a marker of transition from healthy aging to AD. In contrast, PA1B3 in IPL was effective in distinguishing the clinical expression of dementia (ADD) from the clinically normal groups (RAD and HC). These significant findings advocate for deeper explorations into regional proteomic markers, as they may hold the key to unraveling the intricate pathogenesis underlying RAD.
Aβ peptides are the endoproteolytic products of amyloid precursor protein, and an extensively studied group of peptides thought to be critical in the initiation and progression of AD. Platelet-Activating Factor Acetylhydrolase 1b Catalytic Subunit 3 (UniProt protein symbol: PA1B3, GeneCards symbol: PAFAH1B3) is a catalytic subunit that removes an acetyl group from the glycerol backbone, plays an important role during brain development, has been linked to developmental disorders like lissencephaly, 8 and may serve as the central hub protein in MAPK/metabolism. 9 Its paralog, PAFAH1B2, influences Aβ peptide production. 10 Along with previous findings, our results suggest that PA1B3 could serve as a crucial player in RAD, particularly with its ability to distinguish RAD from ADD.
We have identified that the expression of brain regional proteomics can provide valuable insights into discerning clinico-pathological groups and understanding RAD. However, due to the limited sample size in our study, it remains premature to develop computational algorithms solely reliant on proteomics data for inferring clinico-pathological groupings. Encouraged by this observation in conjunction with our previous paper and the ongoing efforts in brain data collection such as the Religious Orders Study and Rush Memory and Aging Project (ROS/MAP), 11 Banner Sun Health Research Institute data, 12 and Baltimore Longitudinal Study of Aging (BLSA), 13 we anticipate that future endeavors could lead to the establishment of an expanded brain repository featuring multi-region brain proteomics data unconfounded by comorbidities. This resource would facilitate more advanced analyses and a deeper understanding of RAD.
Footnotes
Acknowledgements
The authors acknowledge the tremendous dedication of study participants and their loved ones without whom this research would be impossible.
Author Contributions
Z.H., E.B.L., J.Y.Z., M.J.M., and T.J.M. conceived and designed the experiments. Z.H., G.E.M., J.P., D.P., E.J.F., and K.S.M. performed the experiments. E.B.L., C.D.K., C.S.L., and T.J.M. performed clinical and pathological annotations. Z.H., J.P., J.Y.Z., M.J.M., and T.J.M. contributed to data analysis. Z.H., J.Y.Z., and T.J.M. wrote the manuscript with input from all of the authors.
Funding:
The author(s) disclosed receipt of the following financial support for the research, authorship, and/or publication of this article: This work was supported by NIH awards: AG077443, AG065156, AG066509, AG066567, AG069420, and the Nancy and Buster Alvord Endowment.
Declaration of conflicting interests:
The author(s) declared no potential conflicts of interest with respect to the research, authorship, and/or publication of this article.