
Abstract
The blood–brain barrier (BBB) is a regulatory interface between the central nervous system and the rest of the body. However, BBB changes in obesity and metabolic syndrome have not been fully elucidated. We hypothesized that obesity reduces energy metabolism in the cerebral microvessels composing the BBB, reflected by downregulation of protein expression and function. We performed comparative proteomic analyses in enriched microvessels from the cerebral cortex of mice 2 months after ingestion of a high-fat diet or regular rodent chow. In mice with diet-induced obesity (DIO), there was downregulation of 47 proteins in the cerebral microvessels, including cytoskeletal proteins, chaperons, enzymes, transport-related proteins, and regulators for transcriptional and translational activities. Only two proteins, involved in messenger RNA (mRNA) transport and processing, were upregulated. The changes of these proteins were further validated by quantitative polymerase chain reaction (qPCR), western blotting, and immunofluorescent staining of freshly isolated microvessels, in samples obtained from different batches of mice. The predominant downregulation suggests that DIO suppresses metabolic activity of BBB microvessels. The finding of a hypometabolic state of the BBB in mice at the chronic stage of DIO is unexpected and unprecedented; it may provide novel mechanistic insight into how obesity influences CNS function via regulatory changes of the BBB.
INTRODUCTION
Obesity has become one of the most critical problems in human health and is associated with many complications of metabolic diseases.1, 2 Proteomic methods have been used to investigate human and mouse obesity, but most reports have focused on changes in adipose tissue.3, 4, 5, 6 Recent results suggest that the blood–brain barrier (BBB) is activated in obesity; for example, mice with adult-onset obesity show resistance to leptin transport across the BBB, region-specific astrogliosis, and upregulation of astrocytic leptin receptors.7, 8
The BBB is a regulatory interface between the central nervous system (CNS) and the peripheral circulation. It is a complex three-dimensional structure composed of specialized endothelial cells that are reinforced by pericytes, astrocytic endfeet, and extracellular matrix. The tight junctions between the endothelia and the continuous basement membrane prevent diffusion of large non-lipophilic molecules between the CNS parenchyma (brain and spinal cord) and the circulation. The function of the BBB is further reinforced by a high mitochondrial content that ensures sufficient energy, an abundance of enzymes, and metabolically active astrocytes. The functions of the BBB in obesity, however, remain unclear. We predicted that BBB homeostasis is disturbed by metabolic changes in obesity.
Although normal transport and secretory functions of the BBB are essential for CNS function, proteomic analyses have shown that BBB activity is changed under normal and inflammatory conditions such as experimental autoimmune encephalomyelitis.9, 10, 11 To determine how BBB functions are modulated by obesity, we performed comparative proteomic studies to determine the profile of protein regulation at the BBB level. Proteins derived from enriched cerebral cortical microvessels of mice fed with either a high-fat diet (HFD) or rodent chow were resolved by two-dimensional difference gel electrophoresis followed by liquid chromatography-tandem mass spectrometry identification. A total of 47 differentially expressed proteins were downregulated and belong to five different functional groups, whereas only two proteins were upregulated. Our findings indicate that diet-induced obesity (DIO) suppresses the metabolic activity of cerebral microvessels at the BBB.
MATERIALS AND METHODS
Animals and Diets
Young adult male C57BL/6J male mice (B6, Jackson Laboratories, Bar Harbor, ME, USA) were used according to a protocol approved by the Pennington Biomedical Research Center Institutional Animal Care and Use Committee. Mice were maintained in the Comparative Biology facility at Pennington Biomedical Research Center, a fully staffed, Association for Assessment and Accreditation of Laboratory Animal Care International accredited animal facility. Two groups of mice were studied. The first batch of mice were used for comparative proteomics (n=3/group). The second batch was used for nuclear magnetic resonance and body weight measurement (n=5/group) followed by qPCR. The third batch was used for western blotting (n=2/group) and immunofluorescent staining (n=2/group) of isolated microvessels from each mouse. The control mice were maintained on a rodent chow diet (LabDiet/Purina Mills International, Richmond, IN, USA), whereas the DIO group were fed with a 45% HFD from age 2 to 4 months. The feeding manipulation started at age 2 months after measurement of baseline body weight and fat composition. The control diet (Purina 5001) contains 28.5 kcal% proteins, 58 kcal% carbohydrate, and 13.5 kcal% fat. The HFD (D12451) contains 20 kcal% protein, 35 kcal% carbohydrate, and 45 kcal% fat. Body weight was monitored weekly and body composition (fat and muscle mass expressed as % body weight) was determined every 3 weeks until age 4 months by nuclear magnetic resonance (Bruker Optics, Billerica, MA, USA), as described previously. 12
Cerebral Microvessels Isolation and Sample Preparation
Cerebral microvessels were harvested with an established protocol.
13
Briefly, the mice were anesthetized and decapitated. After careful removal of the meninges and large vessels, the cerebral cortex devoid of circumventricular organs was dissected. The cortices were homogenized on ice in capillary buffer (10 mmol/L HEPES, 141 mmol/L NaCl, 4 mmol/L KCl, 2.8 mmol/L CaCl2, 1 mmol/L NaH2PO4, 1 m mmol/L MgSO4, 10 m mmol/L
Two-Dimensional Difference in-Gel Electrophoresis
After solubilization of the enriched microvessels in lysis buffer (5 mol/L urea, 2 mol/L thiourea, 2% CHAPS, 2% SB3-10, 0.2% Bio-Lyte, 2% n-dodecyl-β-
The two-dimensional difference gel electrophoresis method was used to compare the protein expression in enriched BBB microvessels from the HFD mice with those from the lean control mice. Methods for protein labeling, electrophoresis, imaging, and analysis have been described in detail previously.14, 15, 16 Briefly, protein samples were covalently labeled at lysines with spectrally resolvable CyDye fluorophores (Cy2, Cy3, and Cy5). The internal control pooled sample consisting of equal amounts of protein from each sample was labeled with Cy2 and included for each gel. Proteins extracted from the microvessel pellets from three HFD and three control mice were labeled with either Cy3 or Cy5 fluorophores. Fifty micrograms of each sample labeled with three different fluorophores was combined and used for each two-dimensional gel. DeStreak rehydration buffer (GE Healthcare, Waukesha, WI, USA) and 1% carrier ampholytes (pH 3 to 10; Bio-Rad) were used to mix the labeled protein samples that were loaded onto immobilized pH gradient strips (24 cm, pH 3 to 10 NL; Bio-Rad) for active rehydration at room temperature for 20 hours. Isoelectrical focusing of the proteins occurred at a maximum of 10,000 V for a total of 70 kVh. Ettan DALT vertical units (GE Healthcare) were used for SDS-PAGE (1 watt/gel for 1 hour, then 2 watts/gel until the bromophenol blue dye reached the gel bottom. Protein samples from the three mice in each group were labeled and separated in parallel. Besides these three biologic replicates, three technical replicate gels were run for each sample. As the three separate gels for the same biologic samples were consistent with each other, only one of the gels was chosen for two-dimensional difference gel electrophoresis. Gel images were acquired with a Molecular Imager VersaDoc gel imaging system (Bio-Rad), and gel images were analyzed with PDQuest 8.0 (Bio-Rad) image analysis software. In each of the six gels representing six different biologic samples in two groups, random matching of the control and DIO gels was performed. Spots that were at least 1.5-fold up- or downregulated with 95% significance were selected for further analysis. Preparative gels containing 250 μg of pooled internal standard were run and poststained with Sypro Ruby (Bio-Rad). Sypro Ruby images were matched with the analytical gel images, and spots of interest were selected for excision. Gel plugs (1.5 mm) were automatically excised by the use of ProteomeWorks spot cutter (Bio-Rad) and deposited in a 96-well plate for mass spectrometry analysis.
Mass Spectrometry
Tryptic digestion and liquid chromatography-tandem mass spectrometry analysis were performed as described in detail previously.16, 17, 18 Briefly, spots of interest were excised, de-stained, and digested with trypsin in-gel. The resulting proteins were extracted by the use of an automated robotic workstation (Massprep, Waters, Milford, MA, USA), injected onto a reversed-phase capillary column (Dionex, Sunnyvale, CA, USA), and eluted with an increasing acetonitrile gradient in a capillary LC system (Waters). The resulting samples were electrosprayed directly onto the interfaced time-of-flight tandem mass spectrometry (Waters) operating in automatic data-dependent acquisition mode. The tandem mass spectrometry/mass spectrometry results for the proteins were compared with those predicted from a sequence database for protein identification and assembled into groups.
Proteomics Data Mining
Determination of biologic pathways for the identified proteins was performed by use of MetaCore software (GeneGo, St Joseph, MI, USA) and Gene Ontology category enrichment with false discovery rate correction. Each protein was mapped to its corresponding gene object in the MetaCore database. Because of the redundancy of proteins appearing in the database under different accession numbers and names, the single protein belonging to the species mus musculus or with the highest protein score was selected.
Real-Time Polymerase Chain Reaction
Total RNA was extracted from enriched cerebral microvessels of the HFD mice and lean control mice (n=5/group). The RNA concentrations ranged from 300 to 600 ng/μL, and the OD280/OD260 ratios were 1.96 to 2.09. Specific primers were designed according to the corresponding gene sequences of mass spectrometry-identified proteins. Primer sequences are listed in Table 1. The mRNA expression of target genes were quantified by normalization of the cycle threshold values with those of the reference gene glyceraldehyde 3-phosphate dehydrogenase by use of the ΔΔcycle threshold method as previously described. 19
Oligonucleotide primers used for real-time PCR
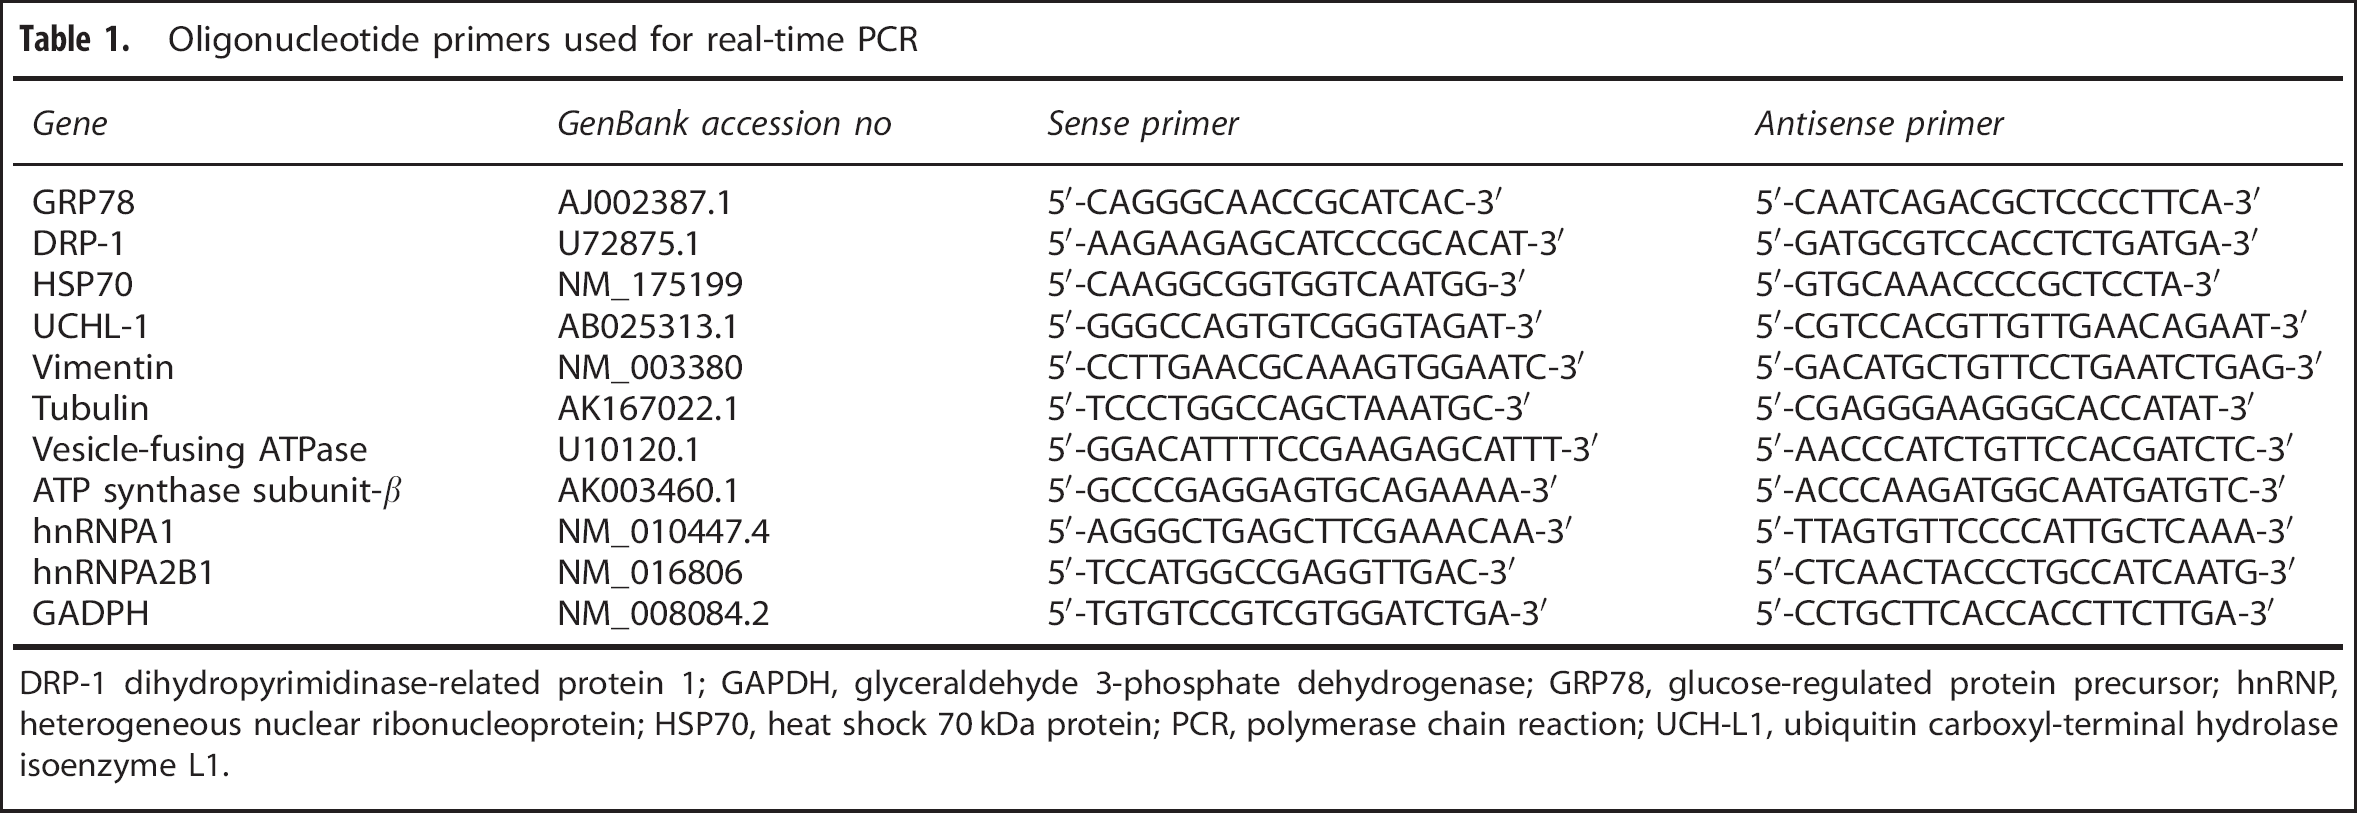
DRP-1 dihydropyrimidinase-related protein 1; GAPDH, glyceraldehyde 3-phosphate dehydrogenase; GRP78, glucose-regulated protein precursor; hnRNP, heterogeneous nuclear ribonucleoprotein; HSP70, heat shock 70 kDa protein; PCR, polymerase chain reaction; UCH-L1, ubiquitin carboxyl-terminal hydrolase isoenzyme L1.
Western Blotting
Cerebral microvessels from HFD mice and lean mice (n=2/group, with duplicated experiments) were lysed with Cellytic MT Mammalian Tissue Lysis/Extraction Reagent (Sigma, St Louis, MO, USA) in the presence of a protease inhibitor cocktail (Sigma) for 30 minutes. Cell lysates were centrifuged at 16,000 g for 15 minutes to pellet the cell debris. Supernatants were collected and protein levels quantified with a bicinchoninic acid protein assay kit (Pierce, Rockford, IL, USA). Equal amounts of protein were separated on a 10% Tris-glycine gel and transferred to a nitrocellulose membrane. After blocking with 4% bovine serum albumin in Tris-buffered saline with Tween-20 for 1 hour, the membrane was incubated with primary antibodies overnight at 4°C, washed three times with Tris-buffered saline with Tween-20, and incubated with horseradish peroxidase-conjugated respective secondary antibodies in Tris-buffered saline with Tween-20 with 5% non-fat milk for 1 hour at room temperature, followed by thorough washes with Tris-buffered saline with Tween-20 . The antibodies used are listed in Table 2. The signals were visualized with enhanced chemiluminescence-plus western blotting (WB) detection reagents (Pierce). Each reaction was performed in duplicate. The differences between groups were determined by the NIH ImageJ program for densitometric analysis and expressed as the signal/β-actin ratio.
Antibodies used for WB
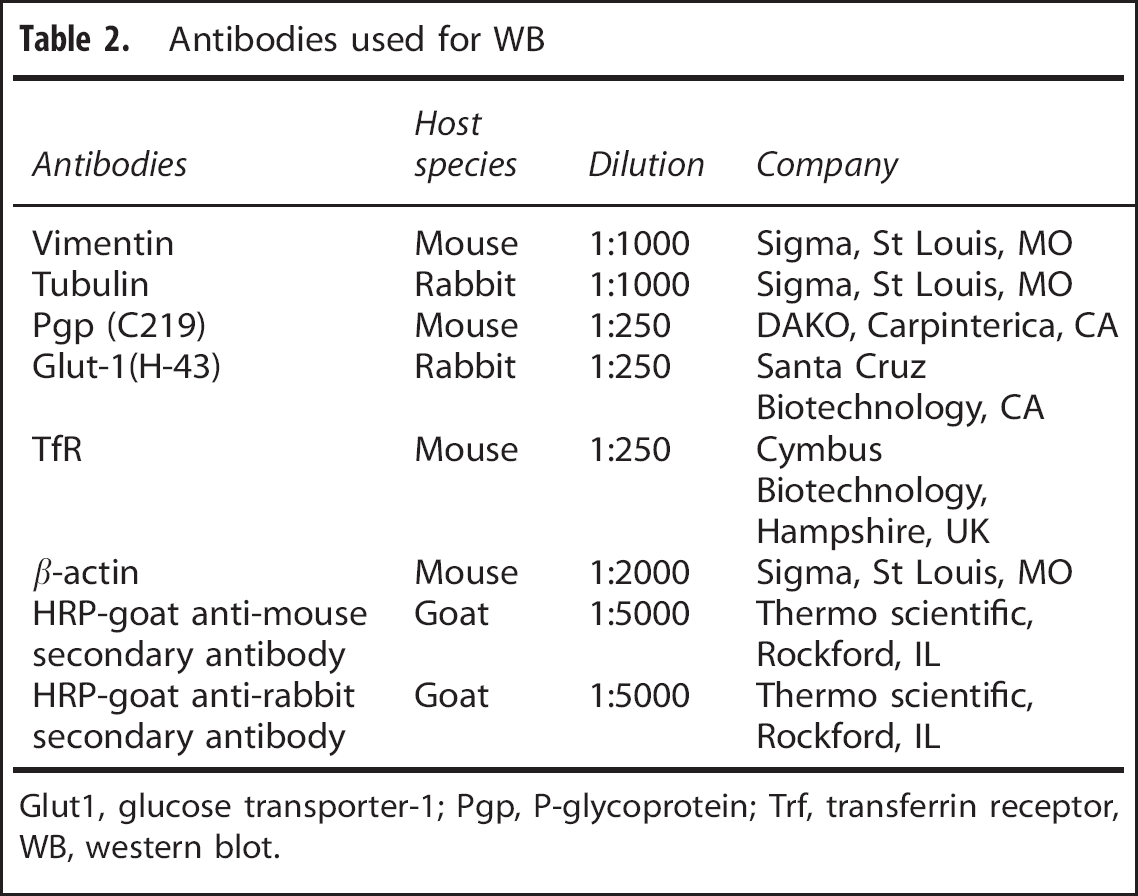
Glut1, glucose transporter-1; Pgp, P-glycoprotein; Trf, transferrin receptor, WB, western blot.
Immunofluorescent Staining
Isolated microvessels were fixed with 2% paraformaldehyde in phosphate-buffered saline for 30 minutes, permeabilized with 0.1% Triton X-100 for 5 minutes, blocked with 10% normal donkey serum in phosphate-buffered saline for 30 minutes, and then incubated with primary antibody overnight. Primary antibodies were all diluted (1:200) in phosphate-buffered saline containing 1% donkey serum. The cells were then washed three times with phosphate-buffered saline and incubated with appropriate secondary antibodies, including Alexa 488-conjugated donkey anti-mouse, Alexa 488-conjugated donkey anti-rabbit, or Alexa 594-conjugated donkey anti-rabbit antibodies (all 1:250) for 1 hour at room temperature. After thorough washes, the coverslips were mounted with Prolong Gold antifade reagent with 4',6-diamidino-2-phenylindole (Invitrogen, Carlsbad, CA, USA). Immunofluorescence was captured on an Olympus FV1000 inverted laser scanning microscope in the laboratory. The fluorescent intensity was measured after thresholding analysis and quantified by use of ImageJ software.
Statistical Analysis
Means are presented with their s.e. Differences in the relative level of mRNA expression in qPCR, protein expression in WB, and the fluorescent intensity of the immunostained microvessels were determined by 2-tailed Student's t-test. Differences of body weight and fat between the DIO and control groups were determined by repeated measure analysis of variance followed by comparison of individual days.
RESULTS
Changes of Body Weight and Fat Composition in Mice with Diet-Induced Obesity
At age 2 months, mice were randomly divided into either a HFD group or maintained on rodent chow (n=5/group). During the following 8 weeks, mice in the HFD group had a greater increase of body weight than the control group (Figure 1A). They also had greater increase of % fat (Figure 1B). The mice were killed 8 weeks after diet manipulation. Although these mice were used for qPCR validation, different batches of mice were prepared for comparative proteomics or validation of the results by WB and immunostaining of microvessels.
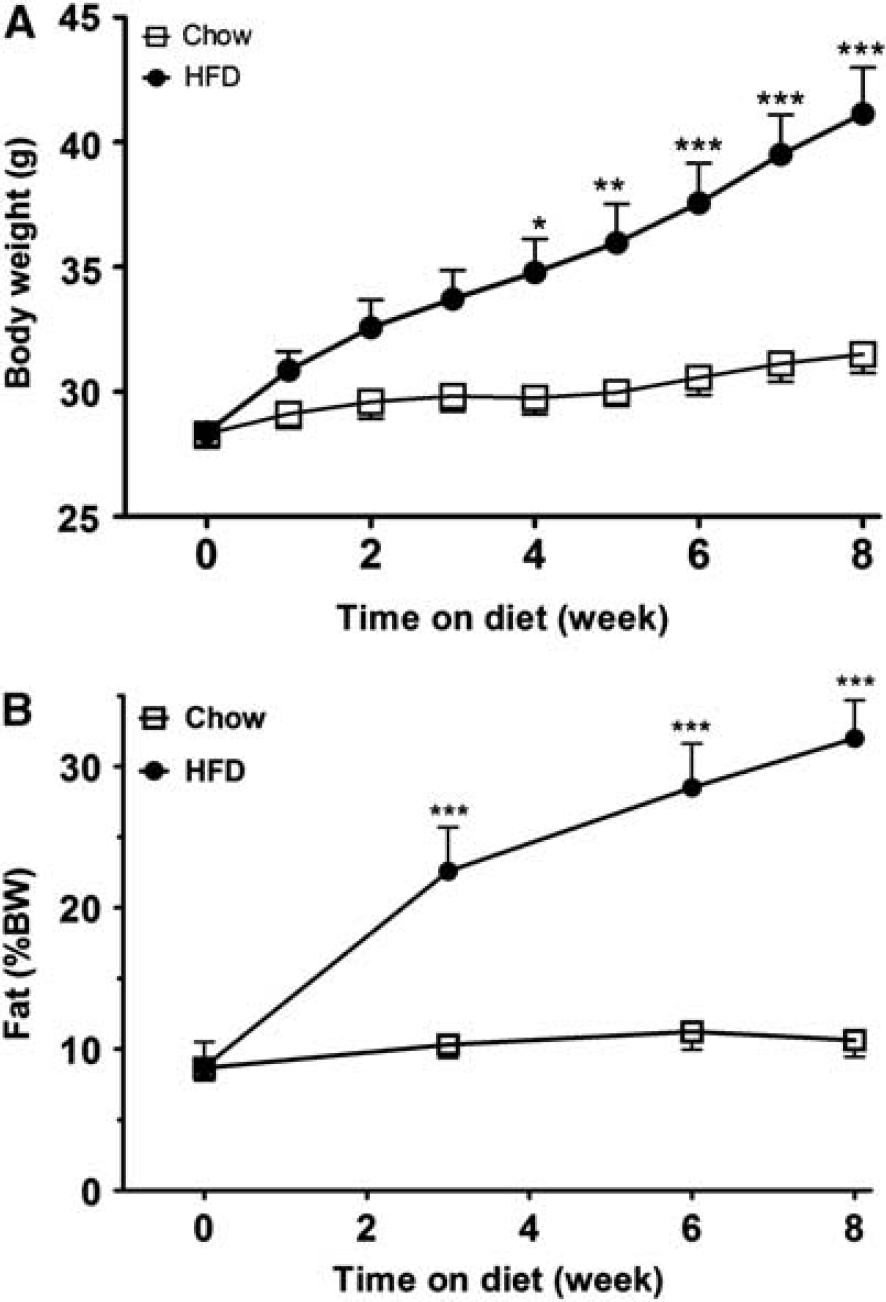
Changes of body weight and fat composition after diet-induced obesity (DIO). (
Proteomic Analysis of Microvessels from Obese and Lean Mice
To obtain enriched microvessels from cerebral cortex for proteomic analysis, microvessels were enriched by use of the capillary depletion method as described previously. 13 The morphology of isolated microvessels with this method did not differ between the control and DIO groups (Figure 2A). Proteins from the enriched cerebral microvessels were separated by two-dimensional difference gel electrophoresis, as shown in representative gel images (Figures 2B–2D). The gels were stained with cyDye, and proteins differentially expressed in the control and DIO groups were analyzed by liquid chromatography-tandem mass spectrometry. In total, 695 peptides were detected, corresponding to 49 differentially expressed proteins. Apart from two proteins (heterogeneous nuclear ribonucleoprotein A1− hnRNPA1—and heterogeneous nuclear ribonucleoprotein A2B1—hnRNP-A2B1) that were upregulated, the other 47 proteins were downregulated, as shown in Table 3.
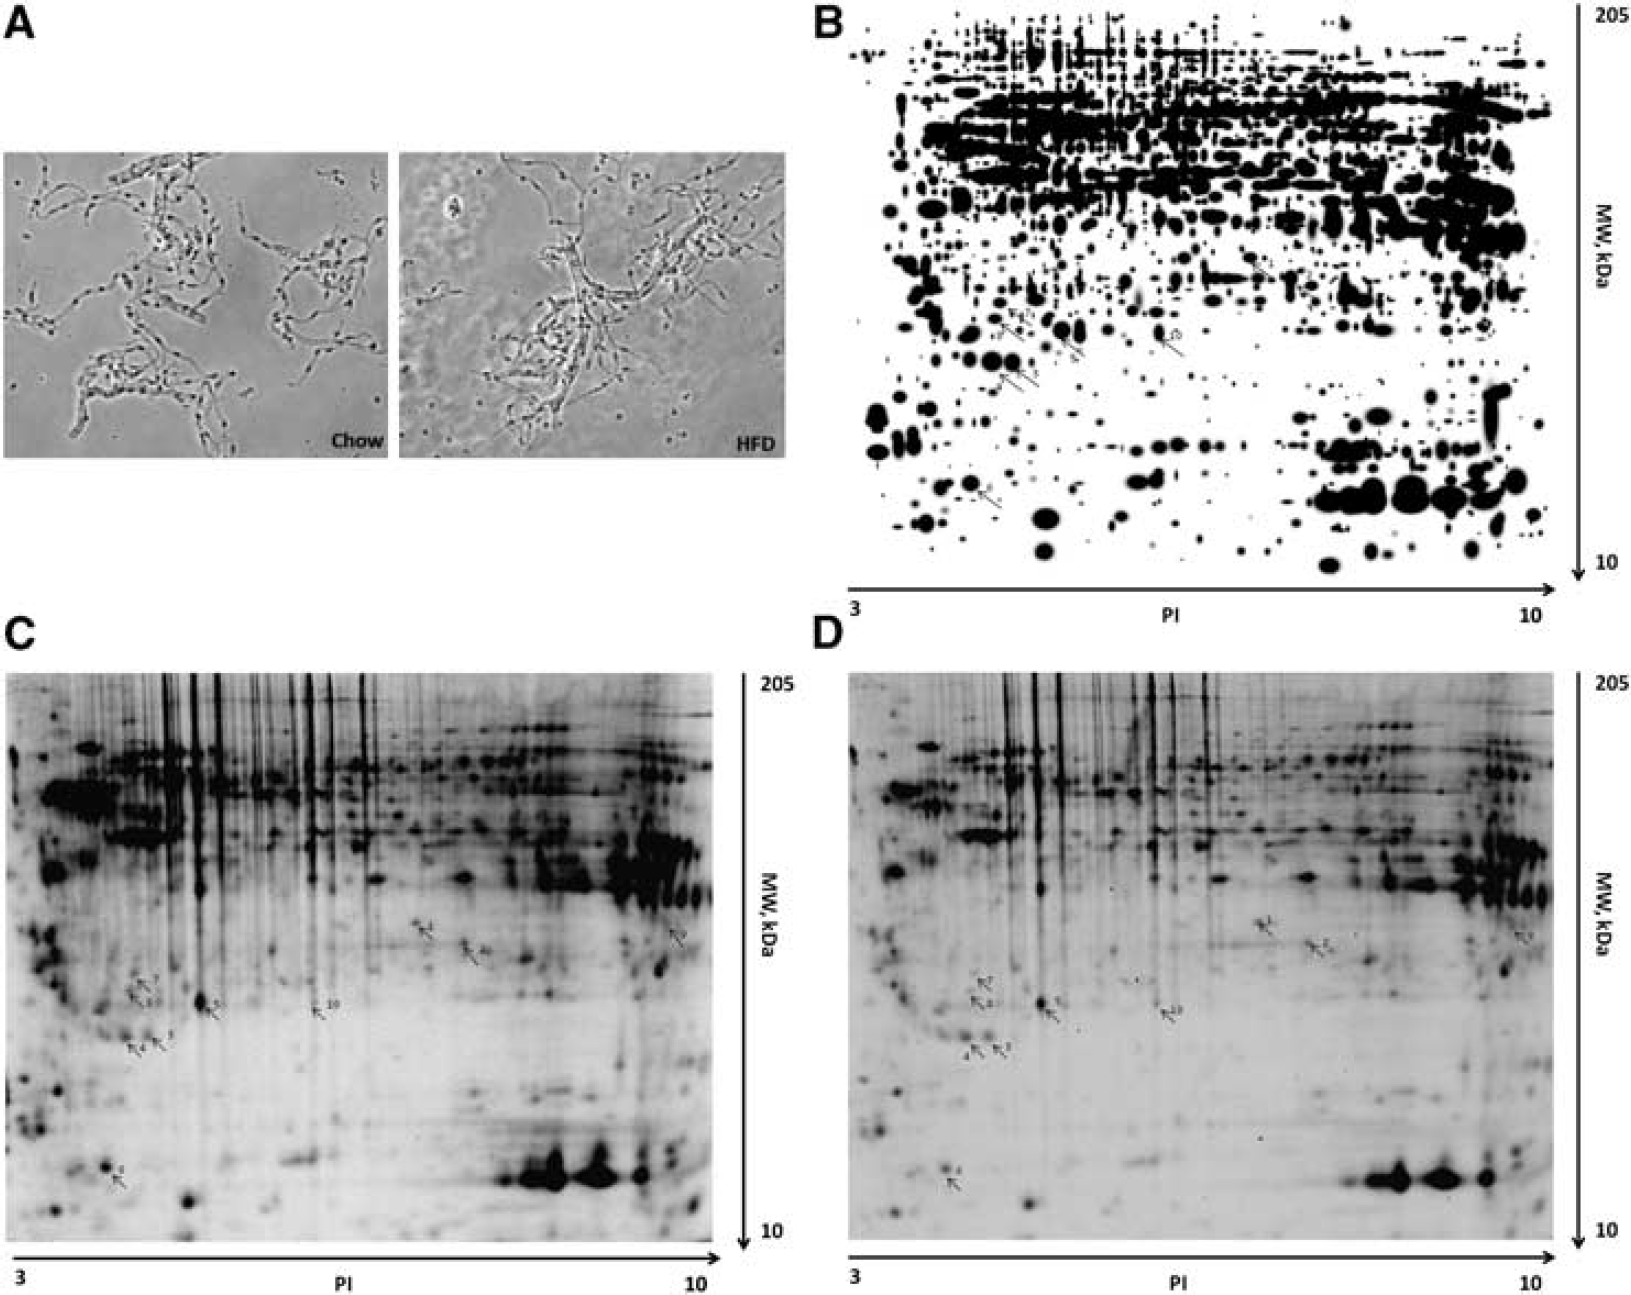
Processing of samples for comparative proteomics. (
Expressed proteins in cerebral microvessels from DIO and lean mice were identified by LC-MS/MS
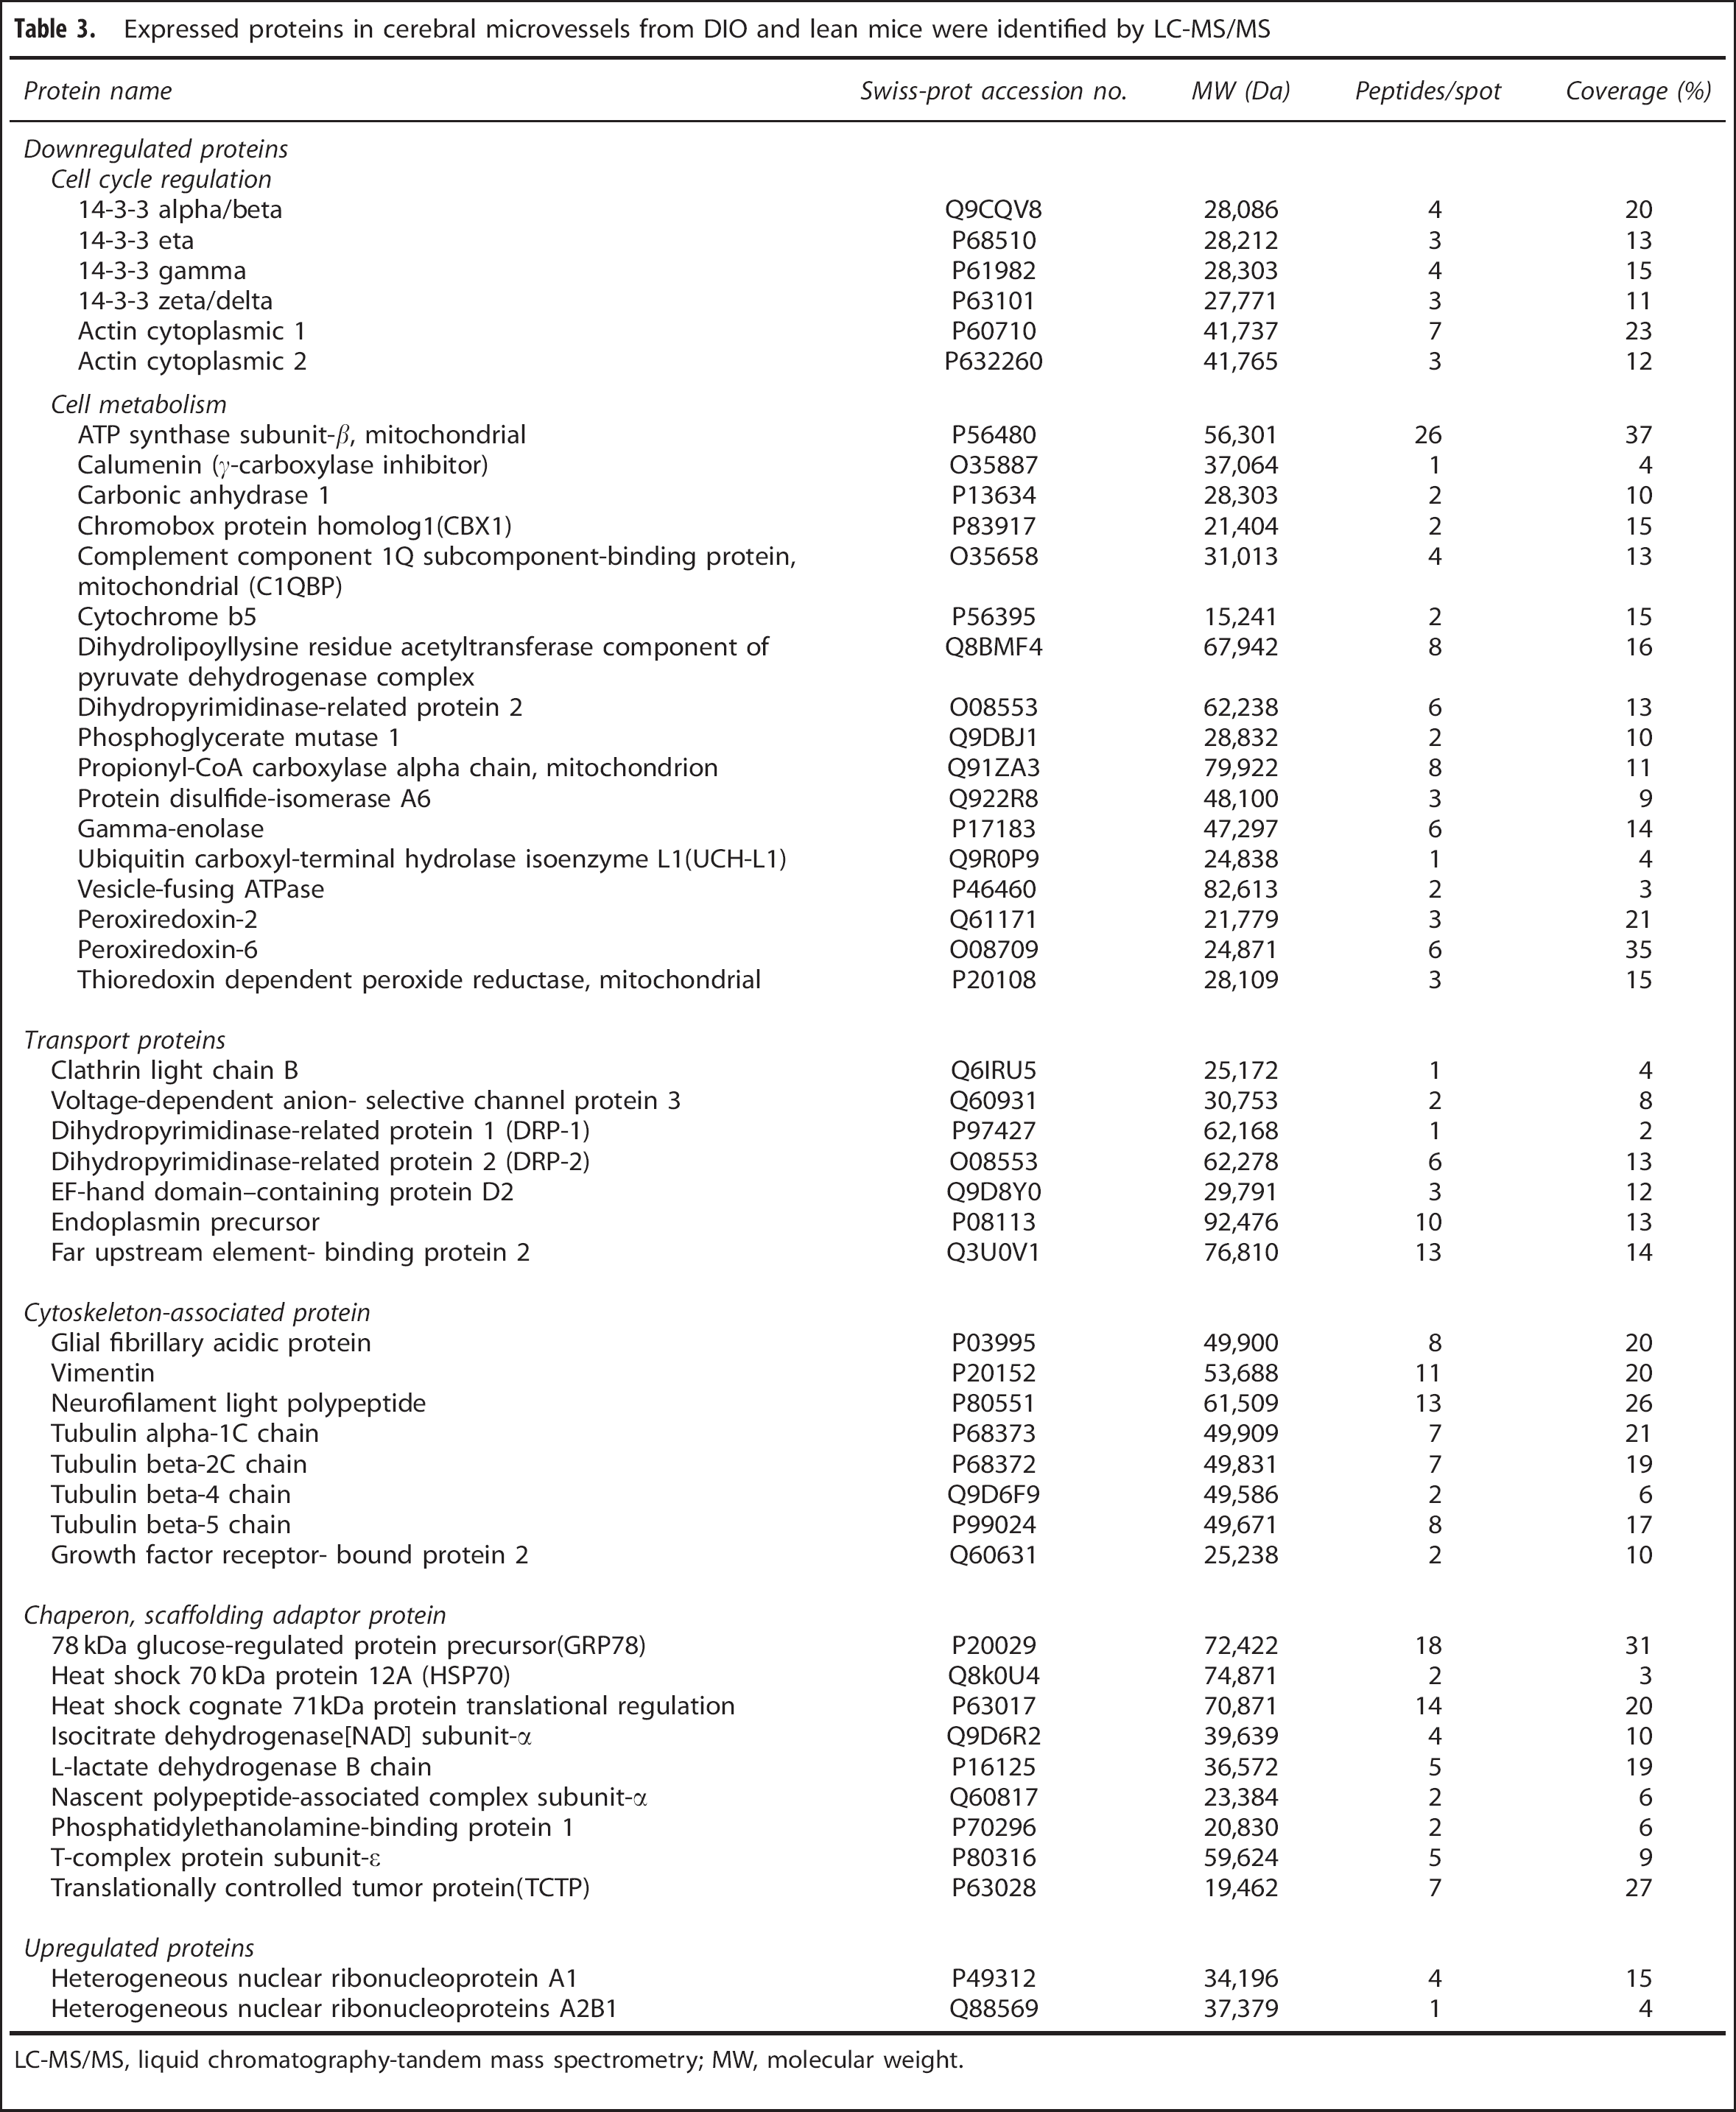
LC-MS/MS, liquid chromatography-tandem mass spectrometry; MW, molecular weight.
As determined by the use of UniProtKB/Swiss-Prot and the Gene Ontology database, the 49 identified proteins belong to functional classes and show variable subcellular locations. The 47 downregulated proteins correspond to five cellular protein groups, including cytoskeleton-associated proteins (15.68%), cell cycle regulation proteins (11.77%), transporters (13.72%), metabolism-associated proteins (33.33%), and chaperons and scaffolding adaptor proteins (25.5%) (Figure 3A). They are distributed in the cytoplasm (21%), cytoplasm and cytoskeleton (15%), membrane (11.67%), endoplasmic reticulum (10%), mitochondria (15%), and nucleus (13.33%) (Figure 3B). The two upregulated proteins are involved in mRNA transport and processing, and they are distributed in both the nucleus and cytoplasm.
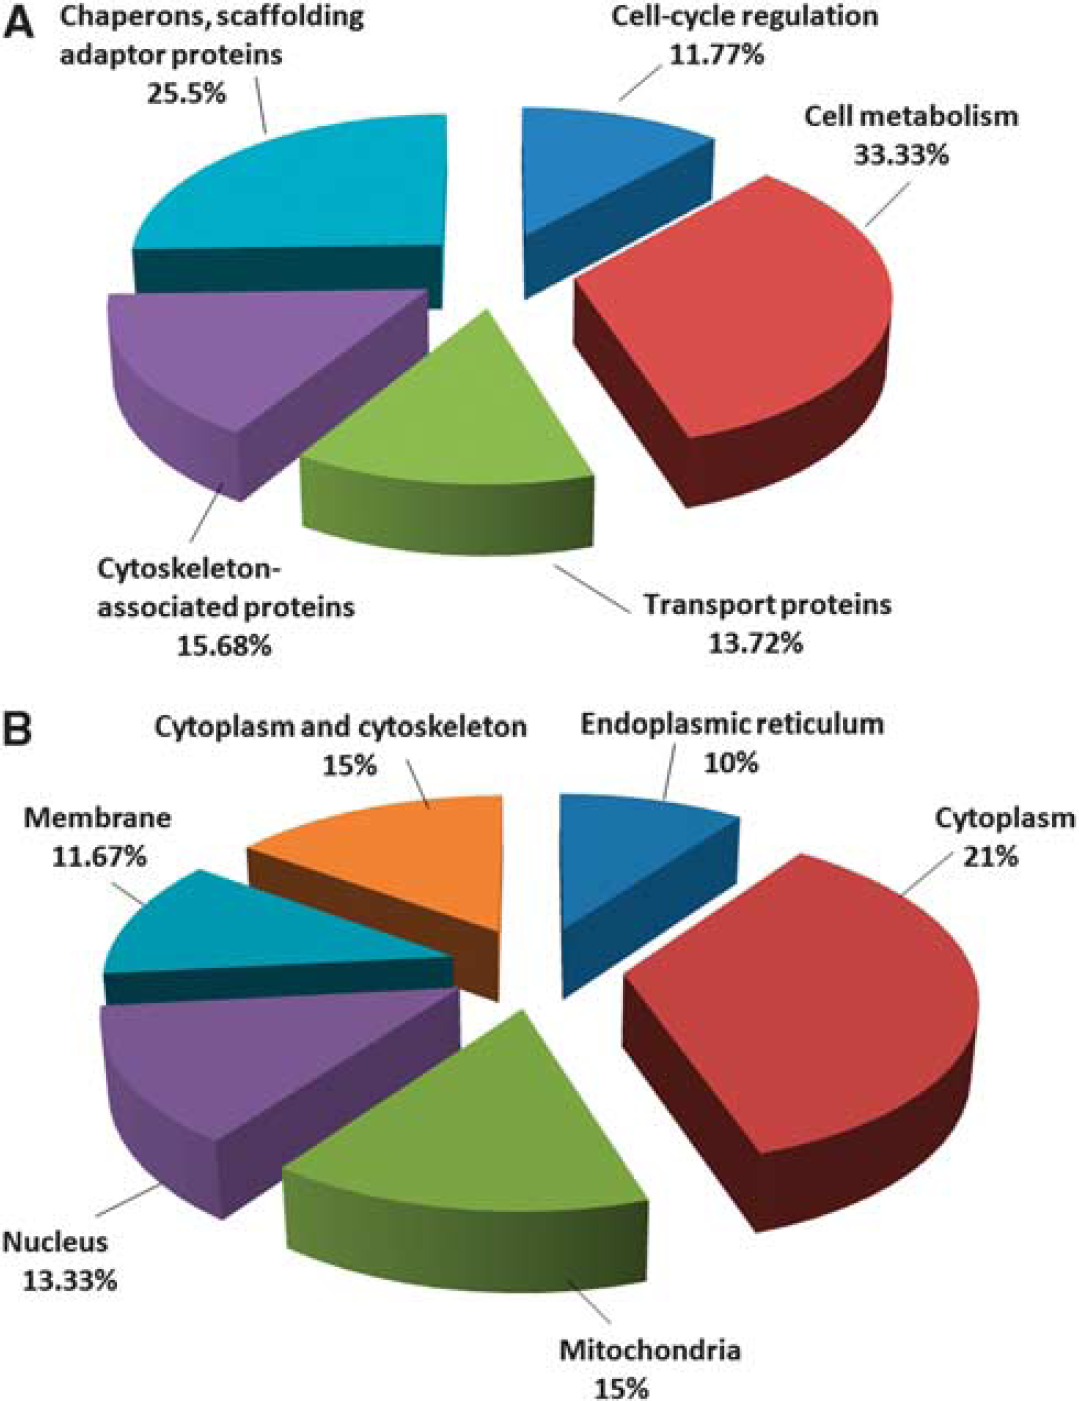
Gene ontology classification of differentially expressed protein in blood–brain barrier microvessels from control and diet-induced obesity mice according to their subcellular location and biologic function. (
Quantitative Real Time Reverse Transcriptase Polymerase Chain Reaction Validation of Selected Proteins
To determine whether the decrease of protein expression in enriched cerebral microvessels from the DIO mice shown by comparative proteomics coincides with reduced gene transcription, qPCR was performed on eight genes encoding different classes of proteins. Glyceraldehyde 3-phosphate dehydrogenase was used as a reference gene. Among these proteins, ATP synthase subunit-β and ubiquitin carboxyl-terminal hydrolase isoenzyme L1 participate in cell metabolism, dihydropyrimidinase-related protein 1 and vesicle-fusing ATPase regulate transport, vimentin and tubulin belong to cytoskeleton-associated proteins, and 78 kDa glucose-regulated protein precursor and heat shock 70 kDa protein belong to the group of chaperon and scaffolding adaptor proteins. The mRNA of all these proteins showed more than 1.5-fold decrease in DIO mice, and the changes were all significant in comparison with the lean mice (Figure 4A). There was robust upregulation of the mRNA for hnRNPA1 and hnRNP-A2B1, the two heterogeneous nuclear ribonucleoproteins shown to increase by proteomics (Figure 4B). Thus, transcriptional regulation partakes in the changes of protein expression at the BBB induced by obesity.
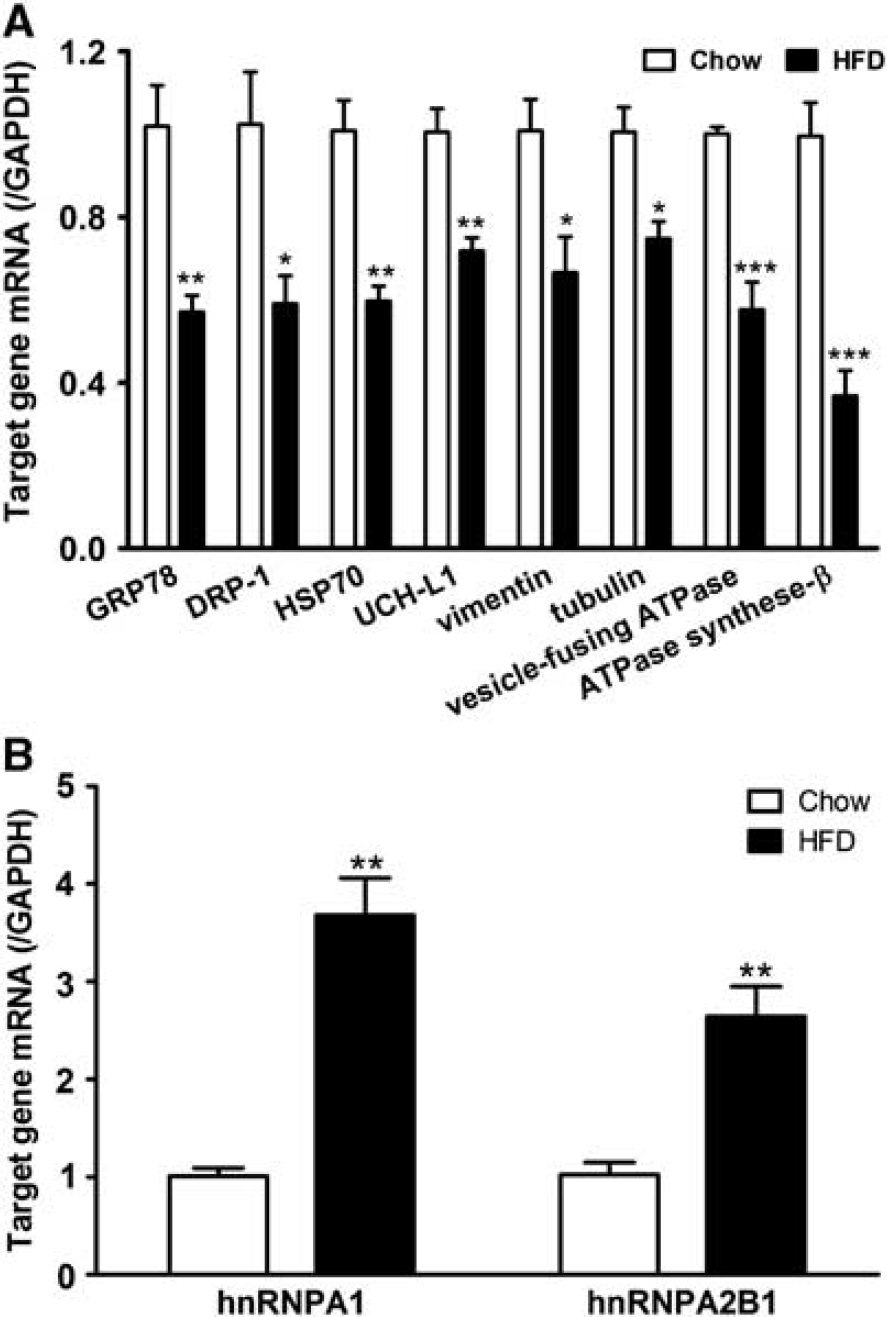
Messenger RNA mRNA of blood–brain barrier BBB microvessels from control and diet-induced obesity (DIO) mice (n=5/group). (
Western Blot Validation of Downregulated Proteins in Enriched Cerebral Microvessels from the Diet-Induced Obesity Mice
To further confirm the change of protein expression after DIO, two differentially expressed proteins, vimentin and tubulin, were selected for WB analysis with their respective monoclonal antibodies. The control protein β-actin did not show an apparent reduction (t=0.47, df=2, P>0.05), nor did GAPDH (t=0.33, df=2, P>0.05). Both vimentin and tubulin showed a reduction of signal intensity in the DIO group (Figure 5A), and their respective ratios to either β-actin or GAPDH were significantly lower (Figure 5B). As BBB transporters are susceptible to regulatory changes, we also measured the level of expression of P-glycoprotein, glucose transporter-1, and transferrin receptor. None of these proteins had significant changes (Figures 5A and 5B). Overall, results of WB supported the findings of reduced expression of selected proteins in the DIO group shown by proteomics, and were consistent with findings by qPCR.
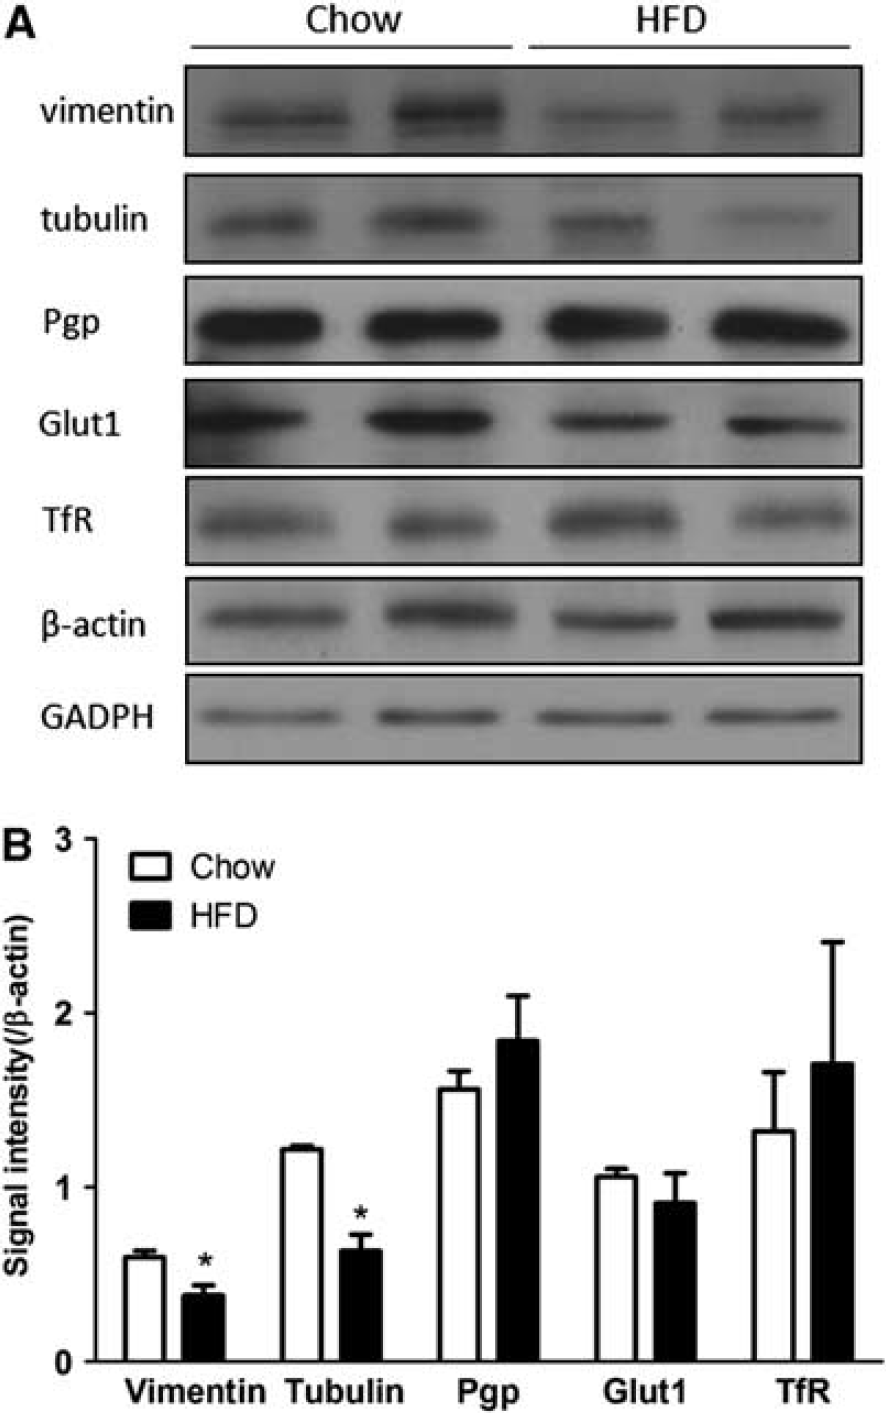
Western blot validation of downregulated proteins and transporters in blood–brain barrier microvessels from control and diet-induced obesity (DIO) mice (n=2 mice/group). (
Immunofluorescent Staining Showing Attenuated Protein Expression in Cerebral Microvessels Isolated from Diet-Induce Obesity Mice
The immunoreactivity of vimentin, tubulin, and the tight junctional-associated protein zona occludin was determined by confocal microscopy in microvessels from DIO and lean mice. Figure 6A through the midsection of the microvessels showed that the level of expression of all three proteins was decreased. Fluorescent intensity was measured by thresholding of an entire z-stack of confocally scanned microvessels, and the differences were quantified in three independent experiments by use of the ImageJ program. Figure 6B showed that the immunofluorescent intensity for vimentin, tubulin, and zona occludin each showed significant reduction in the DIO microvessels.
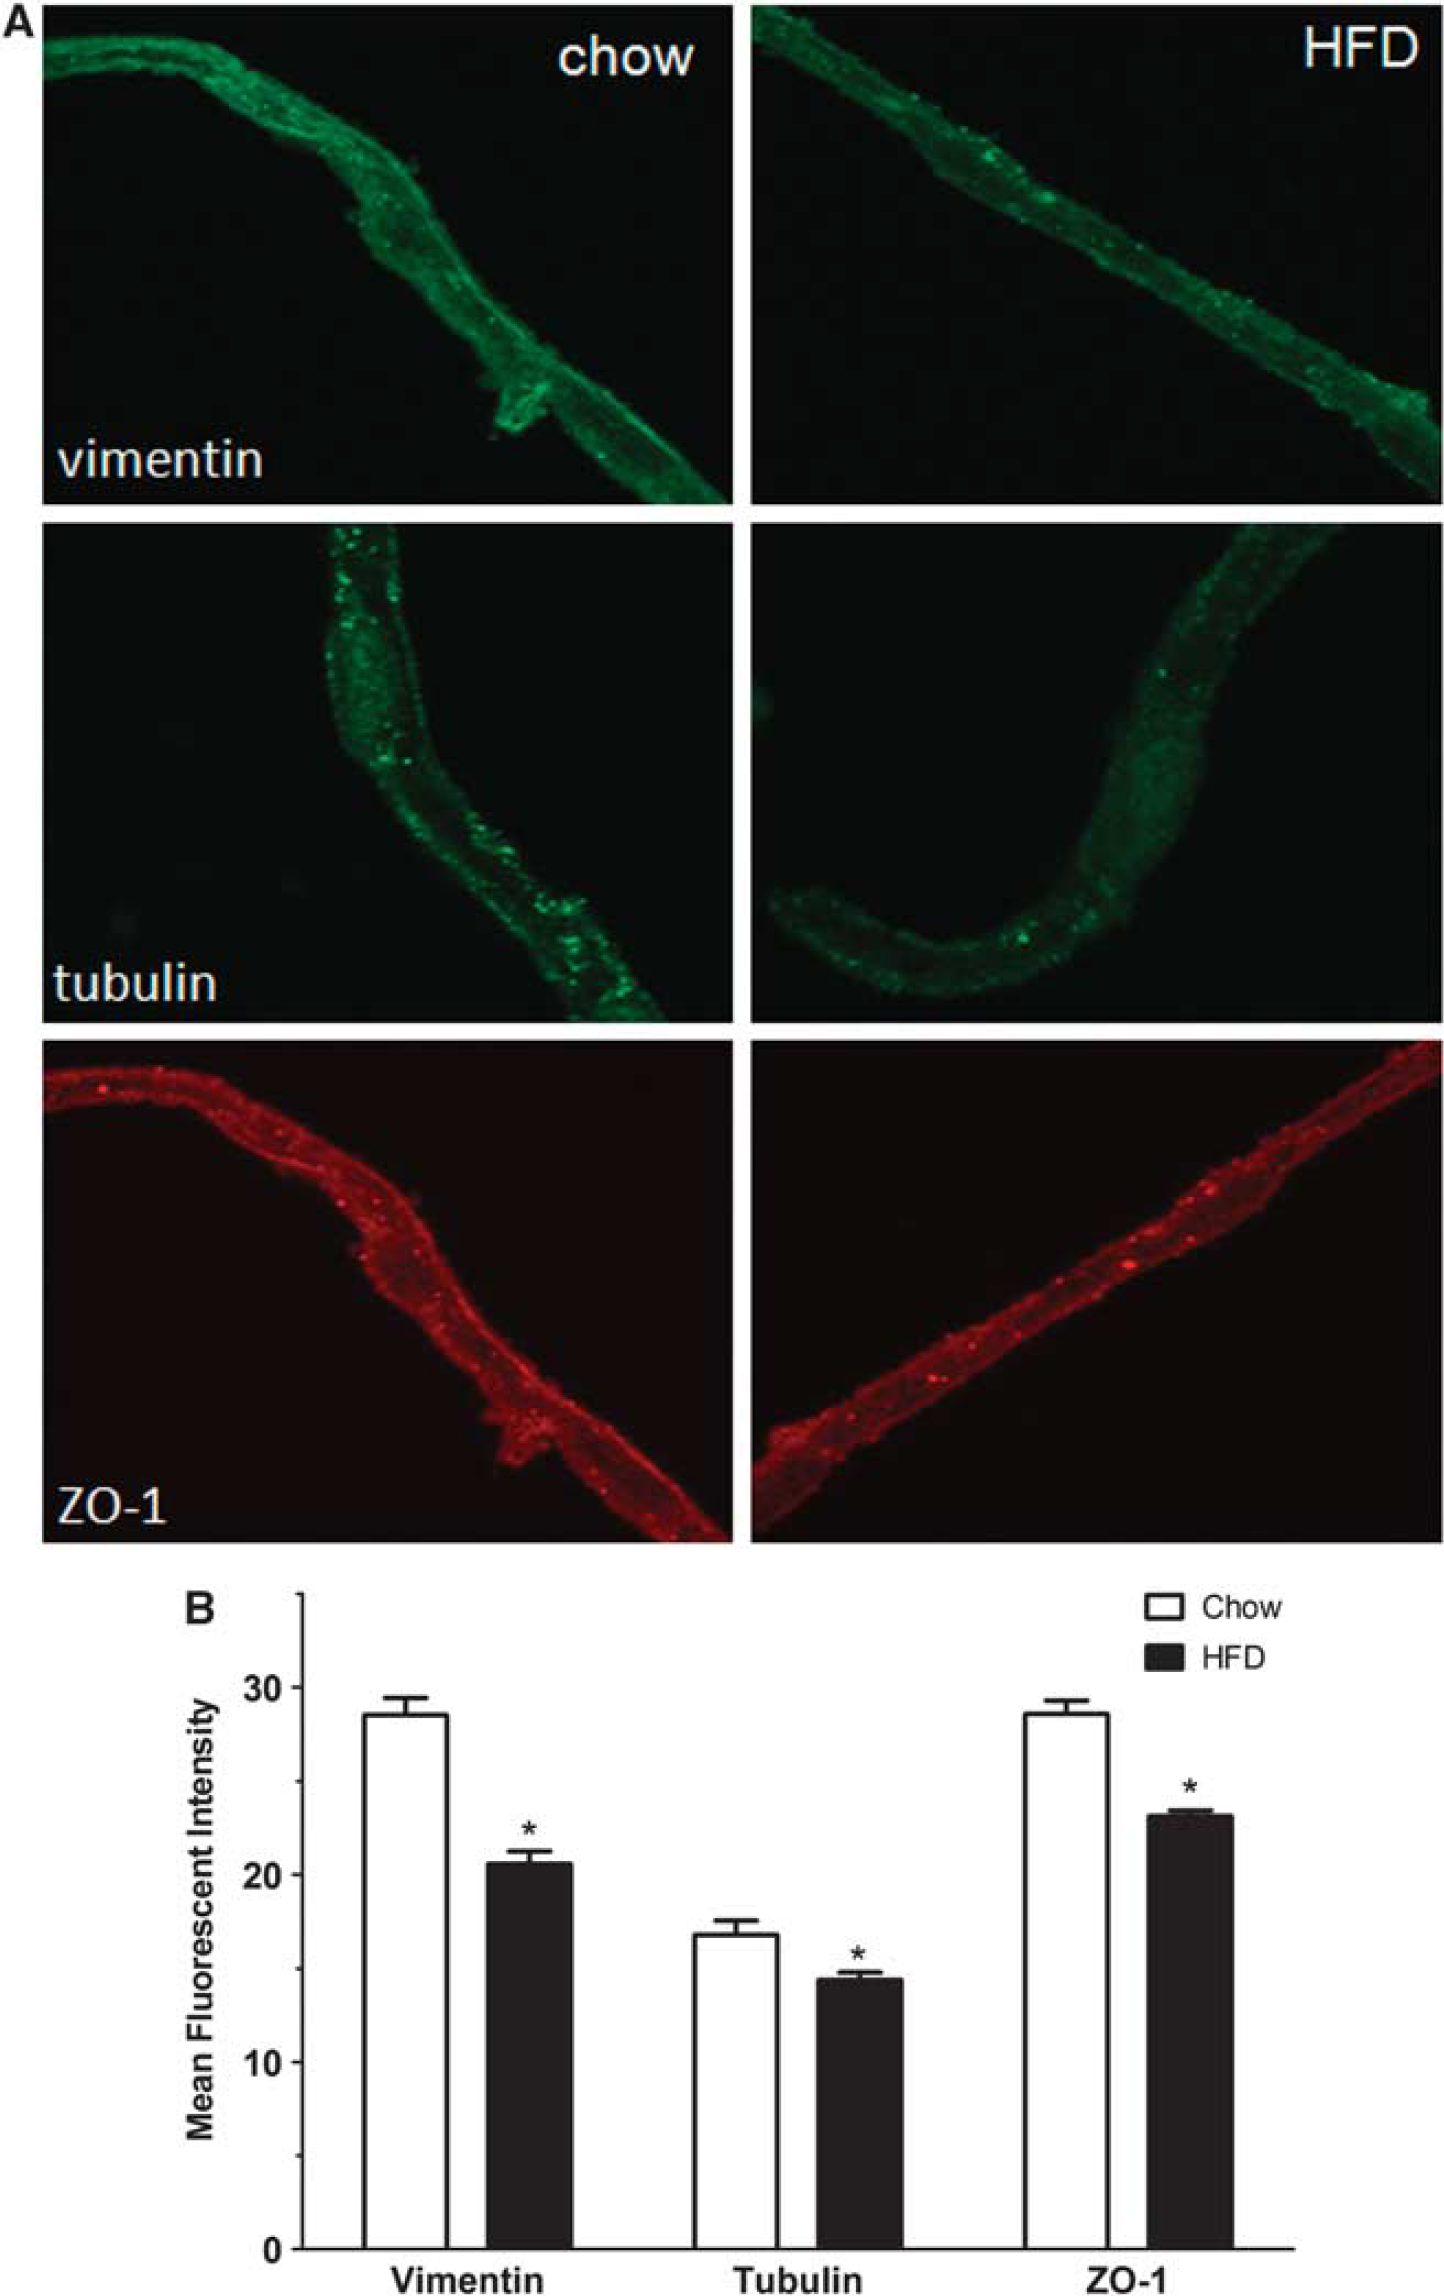
Immunofluorescent staining of isolated microvessels from control and diet-induced obesity (DIO) mice. (
DISCUSSION
We identified 47 downregulated proteins and 2 upregulated proteins in cerebral microvessels of mice fed with a HFD for 2 months. Diet-induced obesity has been shown to differentially regulate protein expression in rat liver, 20 human cerebrospinal fluid, 21 and adipose tissue in culture. 22 Proteomics analysis has identified secretory factors associated with adipogenesis in human adipose stromal vascular fraction cells and differentiated adipocytes. 23 Although proteomic methods have been used to characterize drug transporters and receptors at the BBB,11, 24, 25, 26 the changes of BBB proteomes after DIO have not been shown previously. The proteins identified in our study are involved in a variety of cellular functions, cytoskeleton stability, stress response, vesicular transport, and energy metabolism (Table 3). The results differ from previous studies showing bidirectional changes of protein expression in the liver and heart in which the directions of up- and downregulation after HFD are more evenly divided.27, 28
At the BBB, it appears that most proteins showed downregulation while only 2 out of 49 proteins were upregulated. Although the upregulated hnRNP proteins suggest a compensatory increase in mRNA processing and transport discussed later in the discussion, the predominant decrease of protein expression indicates that DIO suppresses the metabolic activity of cerebral microvessels. Consistently, ischemic preconditioning has been recently shown to downregulate the majority of 28 proteins from the cerebral cortex, suggesting that metabolic downregulation is a general feature in response to brief (7 minutes) ischemia. 29 Diet-induced obesity induces a chronic inflammatory state; hypometabolism at the level of the BBB might reflect a compensatory change in response to altered energy metabolism and it may underlie cerebral dysfunction in obesity.
Among the BBB-associated enzymes downregulated in response to 2 months of HFD, ATP synthase subunit-β is an enzyme critically involved in energy metabolism. High-fat diet decreases the mRNA for ATP synthase subunit-β in the muscle, 30 and this is the first time that its reduction at the level of the BBB has been shown. Propionyl-CoA carboxylase is involved in lipogenesis in the liver; 31 its reduction in the BBB microvessels from the DIO mice suggests a decreased activity of the Kreb's cycle and mitochondrial metabolism.
Obesity is associated with reorganization of the cytoskeleton. 32 Vimentin and tubulin are important components of the cytoskeleton. With regard to nutrient transport and energy metabolism, vimentin controls the transport of low-density lipoprotein-derived cholesterol from the lysosome to the site of esterification. 33 Vimentin type cIFs (vim+) human SW-13 adrenal tumor cells store more lipoprotein than the human SW-13 cells lacking the cIF system (vim−) as a result of a block of transport of low-density lipoprotein-derived cholesterol inside the cells. Thus, the reduction of vimentin at the BBB might impair membrane fluidity and nutrient transport in the DIO mice. Tubulin is also involved in BBB transport and tight junction complex functions. Concerning obesity, neuron-specific β-tubulin influences cell proliferation and adult neurogenesis. 34 The mRNA of tubulin is decreased when euploid cells are differentiated into mature adipose cells. 35 The decrease of tubulin in cerebral microvessels might therefore be an indicator of impaired BBB function.
Heat shock 70 kDa protein was also downregulated in cerebral microvessels in response to a HFD. Heat shock 70 kDa protein is a ubiquitous stress-inducible cellular protein and has important intracellular functions, including folding of nascent polypeptide chains, translocation of proteins across membranes, intracellular vesicle trafficking and sorting, uncoating of clathrin-coated vesicles, signal transduction, and nuclear transport.36, 37 In the periphery, decreased heat shock 70 kDa protein results in muscle atrophy. 38 In the brain, heat shock 70 kDa protein is attenuated in the cortex after ischemic conditioning as well as permanent ischemia in rat stroke models. 29 Downregulation of heat shock 70 kDa protein at the BBB may be associated with dampened energy metabolism in obesity.
Heterogeneous nuclear ribonucleoprotein A1 and hnRNP-A2B1 were the only two upregulated proteins after HFD identified by comparative proteomics. These proteins belong to the heterogeneous nuclear ribonucleoprotein family and are involved in mRNA splicing and transport. Heterogeneous nuclear ribonucleoprotein A1 and d-A2B1 participate in the normal functioning of the muscle, bone, brain, and motor neurons. 39 Downregulation of hnRNP-C, another subtype, as well as vimentin, has been seen in the placenta from obese women. 40 Although only two upregulated proteins were identified in this study, we only analyzed cerebral microvascular proteins 2 months after HFD. The reduction of metabolic activity of the BBB is probably a dynamic process; we cannot rule out the possibility that upregulation of more proteins occurs early during the HFD challenge. Circulating adipokines and other metabolic factors might serve as driving factors for the hypometabolic state of the BBB in sustained obesity.
In summary, we identified by comparative proteomics 47 downregulated proteins and 2 upregulated proteins from enriched cerebral microvessels from mice after 2 months of HFD challenge, and validated the key findings by qPCR, WB, and immunofluorescent staining in isolated microvessels from different preparations of the samples. The results suggest that DIO selectively suppressed enzymatic activities and a few transporters and cytoskeletal proteins in cerebral microvessels composing the BBB. The finding of a hypometabolic state of the BBB in mice with sustained obesity provides novel mechanistic insight into how obesity affects CNS functions by involvement of the vast regulatory interface of the BBB.
The study conforms to guidelines specified by ARRIVE (Animal Research: Reporting In Vivo Experiments).
Footnotes
The authors declare no conflict of interest.
ACKNOWLEDGMENTS
We thank Dr Indu Kheterpul and the PBRC Proteomics Core for service support.