
Abstract
Relatively few epidemiological studies have utilized Random Forests (RF), possibly because the time series data often encountered in this discipline are perceived as unsuitable for supervised learning methods. We show RF can be used for such data, and demonstrate an example examining which social activities influence pertussis. Results are compared with regression with ARIMA errors modelling. Pertussis continues to be perceived as a childhood condition, despite recent incidence increases in older ages. COVID-19 provided a unique situation; social restrictions were implemented and the number of pertussis cases declined. This meant the influence of different activities on transmission could be gauged. Data detailing restrictions was used from the Oxford 'COVID-19 Government Response Tracker' (OxCGRT). The number of cases of pertussis and OxGCRT variables were lagged then embedded into a matrix, before being fitted into a RF regression model. Based on VIMP, this identified ‘international travel’ ‘public events’ and ‘workplace’ as the most important variables, suggesting adult based activities may be of most importance. An ARIMA(1,0,1), using OxCGRT categories as external regressors, similarly indicated that adult social activities better accounted for the number of cases of pertussis.
Introduction
Random Forests are an ensemble decision-tree based machine learning method. Although more commonly used for classification, they can also perform regression. 1 As a machine learning method, RF work well with datasets in which the number of variables is large in relation to the number of observations. 2 This strength has not been fully realised in epidemiology. RF is a supervised learning method; for it to function effectively original data requires some reference values allowing comparison. A univariate time series, because it is comprised of only a single set of data, does not provide such reference points. Therefore some initial data transformation is required. 1 This complication may be hindering their widespread use by those unsure how to proceed with such transformation. Without a transformation it is impossible to set reference values. Here, an example examining which social activities may be driving pertussis cases numbers is provided to illustrate how to handle such datasets for RF regression. Given the ubiquity of time series datasets in epidemiology, we hope that illustrating how to process such data for use with RF facilitates further research.
Pertussis, commonly known as 'whooping name' due to the characteristic cough experienced by those affected, is a highly contagious respiratory condition that has made an unwelcome comeback in recent decades.3–5 Studies suggest that infection in adolescents and adults is of increasing importance. 4 Pertussis is under-reported and often goes undiagnosed in these age groups.5–7 Despite this, pertussis continues to be generally perceived as a disease of infants and children.8,9 We aim to identify the social activities that drive pertussis incidence. Do these reflect infection in children or adults?
Data on social activity was used from the Oxford 'COVID-19 Government Response Tracker' (OxCGRT) which provides indexed values indicating the severity of societal restrictions implemented by governments worldwide to hinder COVID-19 transmission. 10 The extent of regulations on various aspects of social and economic life are categorized.
Can RF be used with this dataset to determine which activities may be most important in influencing the transmission of infectious diseases such as pertussis? The OxGCRT dataset poses challenges; there are numerous variables and data is categorical in nature. However, this provides an ideal opportunity to illustrate how RF can be used to study such time-series’ and compare this machine learning method with the ability of traditionally and commonly used Autoregressive Integrated Moving Average modelling (ARIMA) 11 at identifying the important variables.
Various methods exist for processing data to make it suitable for such supervised methods. One method suggested for use for forecasting involves log transformation, differencing, and lagging of the original time series. 12 Another potential method is to use time delay embedding, where short sections of data and there lags are embedded within a matrix. This method has been implemented in dynamic empirical modelling 13 and neural networking. 14 However, despite the underlying principles of these different methods being well known in data science circles they have yet to be gain wide use in epidemiology.
Methods
Data
OxCGRT data was downloaded for Germany on 24 April 2022. Corresponding data on weekly number of pertussis cases was downloaded from the Robert Koch Institute 15 Survstat database on the same date. The period examined covered 1 January 2020 to 18 April 2022. We selected it as it covered the imposition of social restrictions and the subsequent steep decline in pertussis case numbers. This provides a unique opportunity to assess the influence on the incidence on pertussis during a period when social activities were being curtailed.
Data was plotted and visually examined (S1, S2, S3). OxCGRT values on the final day of each calendar week were used. Categories indicative of daily social life were used as variables in analyses; ‘gatherings’, ‘internal movement’, ‘international travel’, ‘public event’, ‘public transport’, ‘schools’, ‘stay-at-home’ and ‘workplace’. A ‘public event’ is an organized or licensed gathering, while a ‘mass gathering’ is unorganized. Data was split into training (to 12 September 2021), and testing datasets (19 September 2021, to 18 April 2022). Lags of each time series were produced with this being embedded within a matrix. This was then run through a RF.
Random forest regression
Tuning to ascertain the optimal parameters for modelling indicated that a RF with a node size of two and the terminal node size (MTRY) of four resulted in least Out-of-Bag errors. A RF model was established using the RF SRC package in R4.0.0. 16 Using the training dataset, lagged weekly OxCGRT variables and lagged number of pertussis cases were used as regressors, pertussis case numbers as the response. The number of trees used was set to 50. In total 63 variables were thus integrated into the model (9 original variables, plus lagged values for each). The average number of terminal nodes was 23.1.
Important variables
These were identified principally on the basis of the VIMP index, which is a measure of variable importance based on the forecasting accuracy of the variable, and is an established method of variable selection. 17 The VIMP index using the default setting (Breiman 1 -Cutler permutation VIMP) was used. The Mean Minimum Depth (MMD) of each variable in the forest was also recorded; this is the average layer in which a variable first appears in decision trees. 10
ARIMA comparison
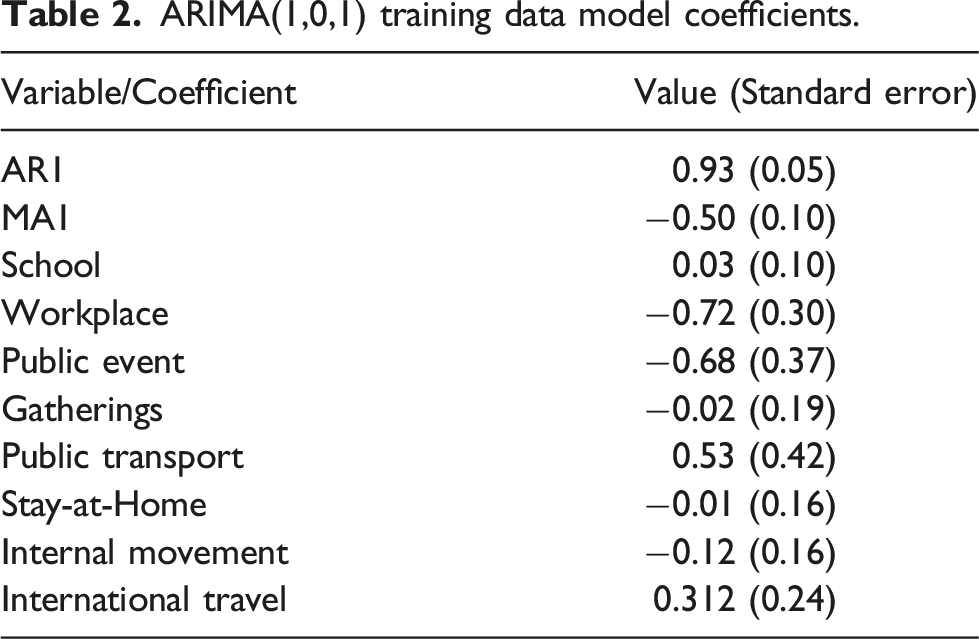
For comparison, ARIMA modelling was performed. Modelling was performed using the ‘forecast’ package following the method outlined by Hyndman and Athanasopoulos 18 (2018). ACF and PACF plots of the number of pertussis cases were examined to estimate model parameters. OxCGRT variables were added as external regressors. Initial model fitting was performed with the training dataset applying a Box Cox transformation with a selected lambda value of 0.09 based on the method of Guerrero 19 (1993). Residuals were plotted and examined. A Ljung-Box test suggested that the fit was good (Q2 = 7.47, p = 0.05). From the ARIMA fit, single variable coefficients were recorded; as they are measured on the same scale (0 to 4) those of greatest influence have the largest absolute value and can be compared directly. An indication of the level of variability of the variables can be seen through examination of associated plots (S2).
Results
Number of pertussis cases and restrictions: Restrictions on the categories examined began to be imposed in the spring of 2020 (S1). There was a notable decline in the number of pertussis cases in the spring of 2020 (S2). In the weeks prior to the implementation of COVID-19 restrictions reported number of pertussis cases peaked at 232 in Week 6. Thereafter they declined, reaching 100 for the last time in week 15. Subsequently they remained below 50 cases per week, and stabilised typically in the low to mid teens. The number of pertussis cases can be compared with previous years (S3).
RF regression
RF regression explained 92% of the variance; the performance error was 149.1. VIMP against MMD showed high correlation
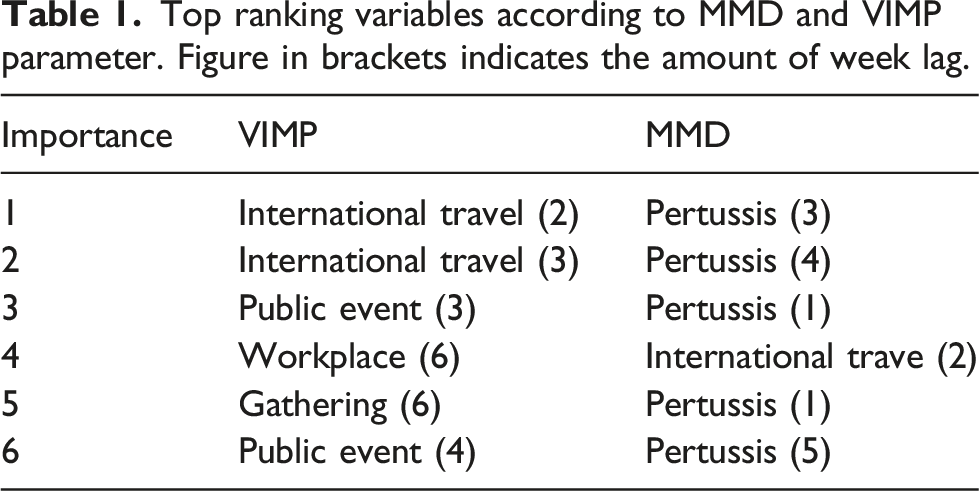
Important variables
Top ranking variables according to MMD and VIMP parameter. Figure in brackets indicates the amount of week lag.
Comparison with ARIMA
ARIMA(1,0,1) training data model coefficients.
Discussion
The objective here was to demonstrate how data can be processed for use by supervised machine learning methods such as RF. Here, an example illustrating how to process data to permit its use by such methods is shown. ARIMA is used as a benchmark against which the performance of RF is assessed.
Due to the COVID-19 pandemic, the situation in 2020 was unique. There was a rapid implementation of restrictions on a range of social activities. Allied to this was a dramatic decline in the number of pertussis cases. This situation provided a unique opportunity to assess which social activities were driving the number of pertussis cases, and identify which social factors were of importance during this decline. Here, RF regression was chosen to investigate this, and a method is presented which illustrates how data can be transformed for use in such supervised machine learning methods. Methods for handling time series data so that they can be used with RF exist,12–14 but have been little used to examine epidemiological problems.
Pertussis and social activity
The restrictions intended at stemming COVID-19 had a secondary effect on pertussis. Pertussis continues to be perceived as a condition of infant and childhood, however increases in incidence occurring since the 1990s have been mainly attributed to infection in adults. 4 The results presented here further support the importance of infection in adults; adult activities ranked most highly in both RF and ARIMA modelling with school activity not ranking highly in any model. Categories ranking highly in VIMP included ‘international travel’ and ‘workplace’; these are more obvious candidates as activities involving close social contact amongst adults and potentially affecting infectious disease transmission. ‘International transport’ ranked highly, probably reflecting mobility patterns generally, and the known importance of transportation in disease transmission. This supports previous modelling which found that age specific mixing was important in pertussis transmission. 20
Community and social interactions have long been known to influence disease dynamics.21,22 An association between disease occurrence and activity within those categories examined here is well established; public transport,23,24 workplace, 25 gatherings, 26 schools.27,28 Particularly relevant currently are studies examining activity and COVID-19 transmission and incidence.29–31
Limitations
We emphasize that the methods used here show only an association and no causative link between each activity and pertussis. Another issue is correlation between categories. However, as shown here, the differences between categories were sufficient for regression analyses to differentiate between variables. RF copes well with correlation between predictor variables. 32
The period studied was unusual in many respects due to COVID-19 restrictions, with the number of pertussis cases being initially high then dropping considerably. However, this period was examined exactly in order to test the ability of RF at identifying variables and to assess its modelling ability during such time. Examination of data over other periods of times indicated that adult activities were consistently most important in determining pertussis numbers. Should pertussis numbers increase following a relaxation of restrictions in the future, comparison with the results found here would be most interesting. Results from RF may vary each time it is implemented. However, successive runs with this dataset consistently placed the same activities as top most ranking variables, showing the consistency of this method.
The nature of the data used here may mean that regression with ARIMA errors is not ideal in this instance; there were numerous variables, but a limited number of data points. However, it was nevertheless used here as it remains a commonly used method of time series regression. It provided useful comparison with the RF. The ARIMA identified adult activities as being of greatest influence, thus provided some confirmation of the results. Further use of ARIMA could examine whether use of subsections of the data may improve fitting. The RF model proved effective at determining which variables were influencing pertussis case numbers. It provides another option for those performing such tasks where the number of variables being examined is large.
Potential of RF
More important than its implications for pertussis, this work demonstrates how time series data can be used in RF regression. RF modelling fitted data better, and had better predictive performance, than more commonly used ARIMA modelling. Despite their apparent effectiveness, relatively few studies have utilized RF for epidemiological research. Most of these have examined influenza. A study principally examining time lagging found that Machine Learning models, including RF, had lower MAPE scores than autoregressive models. 33 Another, influenza modelling study using support vector machine, artificial neural-network, and random-forest time series models, found that RF model fitted data best, but that neural network models were best at outbreak detection. 34 Other conditions where RF has been compared to other modelling techniques include Avian influenza 35 and Dengue Fever, 36 both demonstrating the superiority of RF.
An advantage of RF is that the VIMP index allows easy identifying of variables of potential influence. This index, based on prediction error, provides a possibly better measure of variable importance regardless of whether the model chosen is correct or not. 32 Identifying those variables of interest is traditionally performed on the basis of p-values with defined cut-off points of significance. 32 This somewhat arbitrary method can result in important variables not being recognized.
Data scientists utilize RF modelling with much more complex datasets than the one used here. The example we provide contained less than 20 original variables. Datasets with many dozens of variables can occur. However, for the purposes of illustration this datasets was ideal, plus it permitted the chance to attempt to study a distinct research question.
Conclusion
With appropriate data transformation RF may prove capable tools for time series regression tasks. Here RF regression with data on COVID-19 restriction severity identified activities which are predominately adult mobility as being of more importance in determining the number of pertussis cases than activities indicative of social activity by children, such as school attendance. Further study as to the validity of this technique would be pertinent.
Supplemental Material
Supplemental Material - Examining how social activities influence pertussis. An application of random forest regression
Supplemental Material for Examining how social activities influence pertussis. An application of random forest regression by Mihály Sulyok and Mark D. Walker in Research Methods in Medicine & Health Sciences.
Footnotes
Declaration of Conflicting Interests
The author(s) declared no potential conflicts of interest with respect to the research, authorship, and/or publication of this article.
Funding
The author(s) received no financial support for the research, authorship, and/or publication of this article.
Data availability statement
The datasets were derived from sources in the public domain: Robert Koch Institute Survstat: www.rki.de/EN/Content/infections/epidemiology/SurvStat/survstat_node.html and Oxford Covid-19 Government Response Tracker: ![]()
Supplemental Material
Supplemental material for this article is available online.
References
Supplementary Material
Please find the following supplemental material available below.
For Open Access articles published under a Creative Commons License, all supplemental material carries the same license as the article it is associated with.
For non-Open Access articles published, all supplemental material carries a non-exclusive license, and permission requests for re-use of supplemental material or any part of supplemental material shall be sent directly to the copyright owner as specified in the copyright notice associated with the article.