
Abstract
Two participants completing a psychometric scale may leave wildly different responses yet attain the same mean score. Moreover, the mean score often does not represent the bulk of participants’ responses, which may be skewed, kurtotic, or bimodal. Even so, researchers in psychological science often aggregate item scores using an unweighted mean or a sum score, thereby neglecting a substantial amount of information. In the present contribution, we explore whether other summary statistics of a scale (e.g., the standard deviation, the median, or the kurtosis) can capture and leverage some of this neglected information to improve prediction of a broad range of outcome measures: life satisfaction, mental health, self-esteem, counterproductive work behavior, and social value orientation. Overall, across 32 psychometric scales and three data sets (total N = 8,376), we show that the mean is the strongest predictor of all five outcomes considered, with little to no additional variance explained by other summary statistics. These results provide justification for the current practice of relying on the mean score but hopefully inspire future research to explore the predictive power of other summary statistics for relevant outcomes. For this purpose, we provide a tutorial and example code for R.
When a participant completes a 10-item scale, they provide 10 data points. For example, a participant’s scores on 10 Extraversion items may be: 3, 3, 3, 3, 3, 3, 3, 3, 4, 4. These data points are traditionally aggregated into an unweighted mean (or, equivalently, a sum) to represent the overall level of Extraversion of the participant. In the previous example, the mean is 3.2, indicating a medium level of Extraversion (see Donnellan et al., 2006). Another participant may have answered 1, 1, 1, 1, 3, 5, 5, 5, 5, 5 to the same items. Once again, we find a mean of 3.2, a medium score. But this time, the specific responses are very different than in our first example; the second participant left almost only extreme responses, sometimes expressing high Extraversion and sometimes expressing low Extraversion. Despite the substantial differences in responses, taking a mean score treats both participants as equally extraverted.
As the example shows, the mean score of participants’ responses may miss out on some information about the participants’ specific responses, which may somehow reflect narrower aspects of traits. In this article, we attempt to capture and use some of this neglected information by applying a variety of other summary statistics beyond the mean, such as the standard deviation and the kurtosis of participants’ responses, to predict various outcomes in the context of health, well-being, and unethical decision-making. Across three data sets involving 32 psychometric scales, five outcome variables, and a total sample size of 8,376, we document that (a) participant scores are often skewed, bimodal, and/or contain substantial outliers, arguably rendering the mean a poor indicator of central tendency in the first place; (b) despite this, the mean attains the highest test–retest and interrater reliability, followed by other measures of central tendency (e.g., the median), while measures of dispersion (e.g., standard deviation) and shape (e.g., kurtosis) have lower reliability; and (c) across the five outcome variables, the mean explains the most variance, and other summary statistics predict only a small fraction of unique variance beyond it, if any.
The Mean Misses Out on Information
The opening example was not pure fantasy; in fact, it comes from two panelists from a social science panel study (the Dutch Longitudinal Internet Studies for the Social Sciences [LISS] panel; see below for details), responding to a Big Five personality measure (Fig. 1). Evidently, the mean thus misses out on some information in participants’ specific item responses. But is the neglected information useful for predicting other constructs? Some research suggests it is, showing that characteristics of participants’ responding are linked to cognitive biases, response styles, and cognitive flexibility. Larger variance in reaction-time measures, for instance, has been shown to be related to Neuroticism, spawning the hypothesis that Neuroticism may reflect “mental noise” (Robinson & Tamir, 2005). More internally consistent self-descriptions, in turn, have been linked to self-concept clarity (Campbell et al., 1996). Finally, research leveraging the standard deviation of responses and the use of scale endpoints has found ties to simplistic thinking, inattentive versus conscientious responding, and flexible attribution style (Marjanovic et al., 2015; Moore & Fresco, 2007; Naemi et al., 2009; on the importance of variability in psychology, see also Mestdagh et al., 2018). By contrast, other research documents the superiority of the mean: Dejonckheere et al. (2019) recently investigated nine different ways of describing time series of affect measurements. The conclusion was that none of them outperformed the mean in predicting well-being.

Distribution of responses from six participants on a 10-item Extraversion scale with choices ranging from 1 (very inaccurate) to 5 (very accurate). Data are from the Dutch Longitudinal Internet Studies for the Social Sciences, 2021.
Nonetheless, many characteristics of participants’ specific responses remain essentially uninvestigated. By and large, the calculation of a mean score has been taken for granted, and the consequences of this pervasive practice remain untested. If responses carry meaning beyond their mean, the current practice of using the mean virtually indiscriminately may not be fully leveraging the predictive power of the data (for a like-minded investigation into overall treatment effects, see also Wiedermann et al., 2022).
“Assumptions” of the Mean Are Often Violated
Descriptive statistics, such as means and standard deviations, have unclear meanings when applied to Likert scale responses . . . to describe the data, means are often of limited value unless the data follow a classic normal distribution. (Sullivan & Artino, 2013, pp. 541–542)
There is another reason to suspect that the mean may miss out on information. The mean works best for symmetric distributions with a single peak in the center. But as we have seen, participants’ responses may yield all sorts of not very “neat” distributions; a response distribution may be bimodal, skewed, and affected by outliers (Fig. 1). In such cases, the mean is a poor indicator of central tendency (Rousselet & Wilcox, 2020), that is, it may not capture where the bulk of the responses lie (see Participant 6 in Fig. 1). We investigated this issue using data from 5,358 Dutch LISS panelists, responding to a 50-item questionnaire of the Big Five personality dimensions derived from the International Personality Item Pool (IPIP; Goldberg, 1999). As shown in Figure 2, the results reveal that the distribution of a participant’s responses to items from the same scale often is anything but “neat.” In the left panel, the figure shows that a substantial portion of participants have a response distribution with a skew smaller than −1 or larger than 1. The panel in the middle shows that a significant number of participants have a bimodality above 0.56—the typical value used to classify bimodal distributions (Pfister et al., 2013). The right panel reveals that some response distributions contain z values as low as −2.5 or high as 2.5, indicating that at least one response of the respective participant was different from the rest (i.e., an “outlier”). Crucially, in cases such as these characterized by skew, bimodality, and the presence of outliers, the mean may not only miss out on information about the measured construct; it may entirely misrepresent how the participant typically responded.
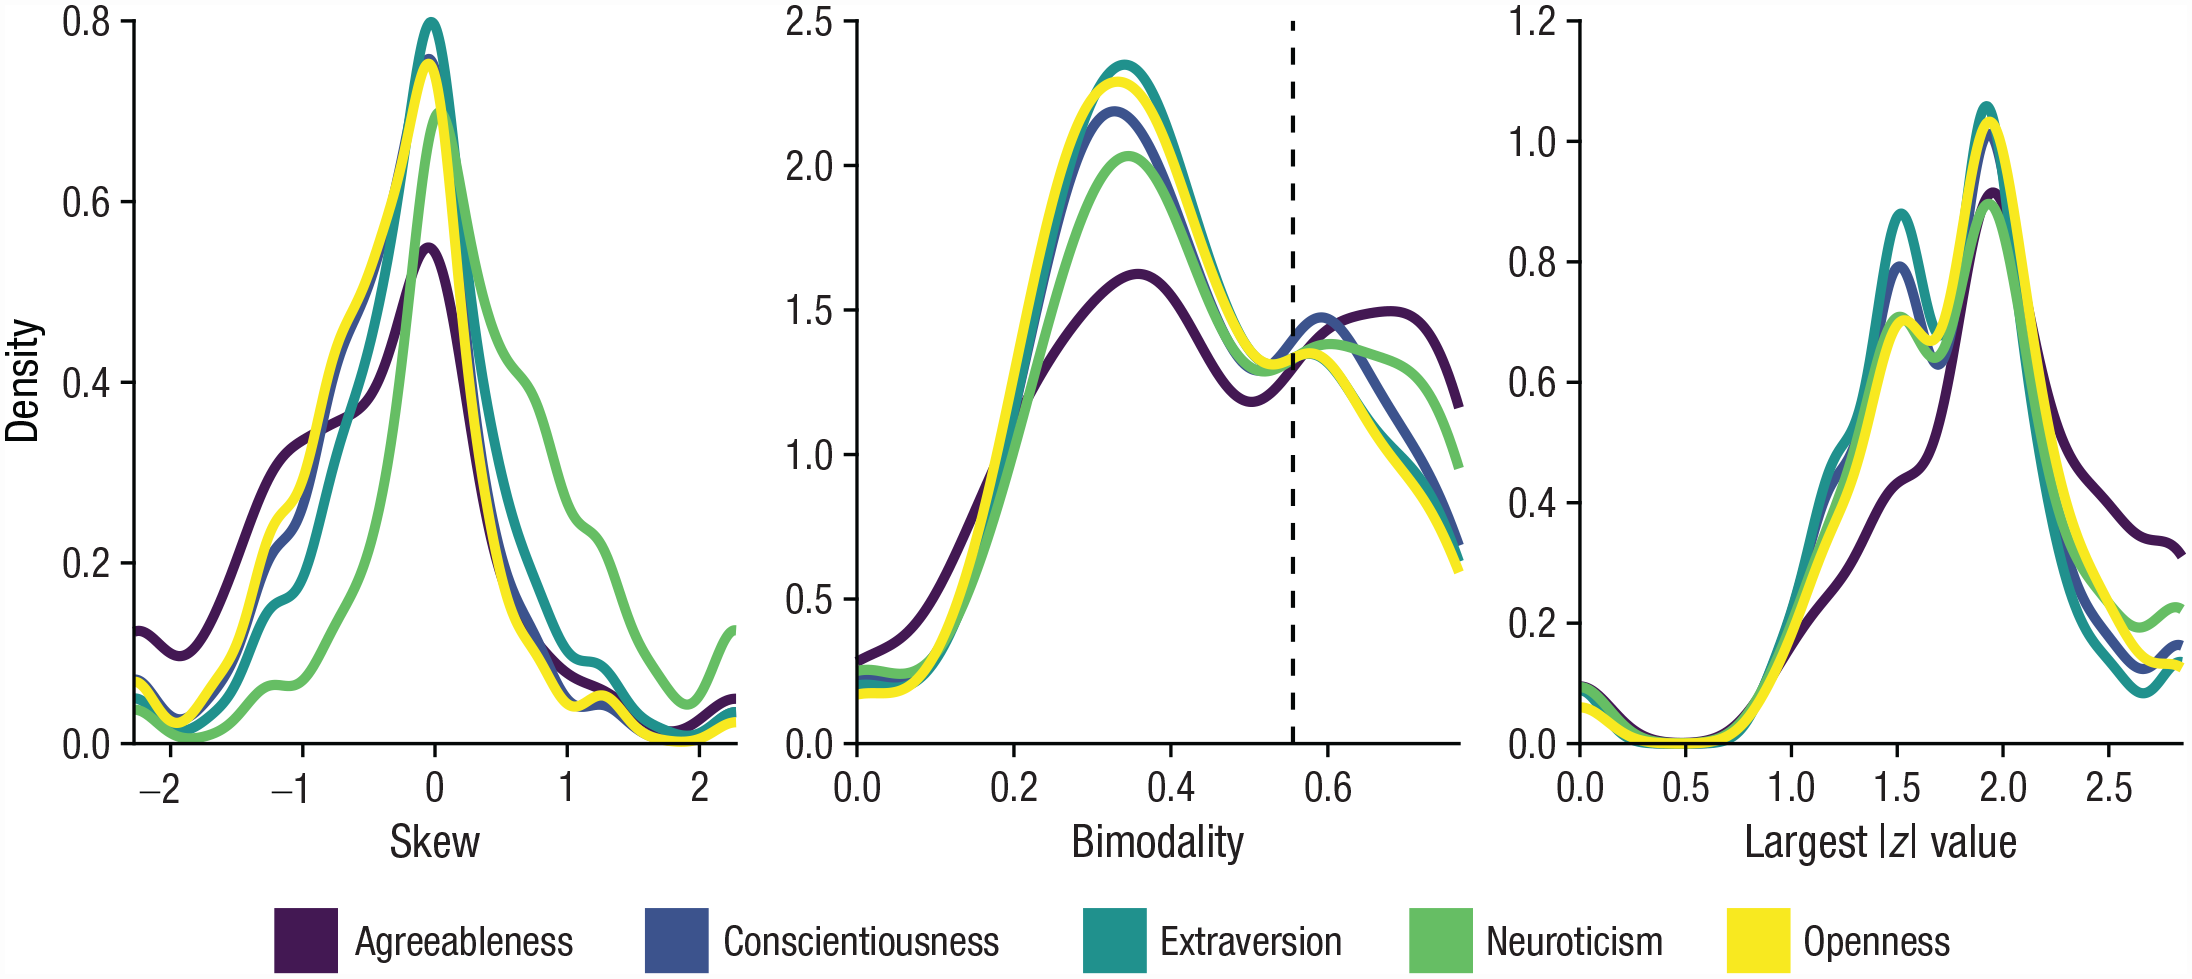
Distributions of skew, bimodality, and the largest absolute z value in responses to items measuring the Big Five using the International Personality Item Pool. The “density” represents a smoothed-over version of a histogram. Data are from the Dutch Longitudinal Internet Studies for the Social Sciences, 2021. N = 5,358.
Alternative Approaches to Multi-item Scales
A plethora of techniques to analyze multi-item scales have been developed, many of which attempt to address the issues outlined above. Here, we briefly review some of the most prominent of these techniques. One approach is structural equation modeling (Bollen, 1989), which combines scale items into latent factors that are construed as unobserved common causes of the responses to each item (Borsboom et al., 2003). The analyst can choose to specify more or less complex underlying structures (e.g., with multiple latent factors, higher-order factors, or multiply determined items; Moshagen, 2023) to describe the relations between items. Although structural equation modeling can delineate multiple sources of interitem correlation, it does not explicitly take characteristics such as the spread or shape of item responses into account, and thus it potentially neglects the same information as the mean.
A second approach is to use a mixture model (e.g., latent profile analysis; Bartholomew et al., 2011), which identifies subpopulations of participants that tend to share a particular pattern of item responses, taking both the mean, spread, and shape of responses into account (Asendorpf, 2015). Contrary to other approaches, mixture modeling entails a person-centered perspective that focuses on uncovering personality typologies rather than estimating sample-level aggregates of variables (Bergman & Andersson, 2010). This method is particularly apt at investigating complex cross-item interactions and intraindividual dynamics (Bauer & Shanahan, 2007; Muthén & Muthén, 2000) but is less appropriate if the research question pertains to the relationship between constructs (Howard & Hoffman, 2018).
Finally, an approach that has recently gained traction is to not combine item responses at all but instead treat each item as a separate predictor in a multivariate model (Mõttus et al., 2019). Such item-level analyses can be powerful in terms of prediction, as has been shown for a variety of different outcomes (e.g., Speer at al., 2022; Seeboth & Mõttus, 2018), but they come at the cost of lower reliability that must be offset by a larger sample size to obtain the same precision (Revelle et al., 2021). Notwithstanding the alternative approaches, calculating a mean score remains a parsimonious, simple, and widespread practice in psychology and the social sciences (Widaman & Revelle, 2023), and we take it as the point of departure for the present investigation.
Overview of the Present Research
In this investigation, we tested the predictive power of the mean compared with alternative ways of describing a participant’s responses to a multiitem scale. In addition, we examined whether any such alternatives to the mean can be measured reliably. We made use of three separate cases, involving 32 psychometric scales, five outcome variables, and a total sample size of 8,376 (see Table 1). The scales were selected to cover a wide variety of concepts, including basic personality, dark personality, psychopathology, affect, and identity. The outcomes—life satisfaction, mental health, social value orientation (SVO), counterproductive work behavior (CWB), and self-esteem—were likewise selected to span a broad range of criteria with relevance for different fields of study, such as well-being, mental health, work, and prosocial behavior. Given the vastness of the psychometric literature, however, we do not claim to cover all relevant scales and outcomes, although we sought to include a broad variety of well-established scales.
Overview of Data Sets and Measures

Note: IPIP = International Personality Item Pool; MHI-5 = Mental Health Inventory–5, a subset of the 36-Item Short Form Survey; NARQ = Narcissistic Admiration and Rivalry Questionnaire; PANAS = Positive and Negative Affect Schedule; PID-5 = The Personality Inventory for DSM-5; SAQ = Self-Attributes Questionnaire; SSIS = Short Sadistic Impulse Scale; SWLS = Satisfaction With Life Scale.
The social value orientation measure was incentivized with money.
Case 1: LISS
The LISS panel is a representative sample of Dutch individuals who participate in monthly surveys covering health, socioeconomics, political views, values, and personality. The panel is based on a true probability sample of households drawn from the population register. For the current purpose, we used life satisfaction and mental health as outcomes to be predicted by the available personality scales. The data are available to researchers who sign a data statement. More information about the LISS panel can be found at www.lissdata.nl.
Case 2: Prosocial Personality Project
The Prosocial Personality Project (PPP) is a large-scale project containing various measures tapping into prosociality and related constructs. The data were collected online over multiple measurement occasions via a panel provider in Germany. For the current purpose, we use SVO and CWB as the outcomes to be predicted by a selection of broad and more specific personality traits. The data are shared on OSF (https://osf.io/r46uw/) along with a detailed documentation of the PPP (https://osf.io/m2abp/).
Case 3: Personality Interaction Laboratory Study
The Personality Interaction Laboratory Study (PILS) is a laboratory-based study on the development of personality and social relationships. The data come from German students and include observations of behavior and personality measures obtained via both self-report and acquaintance report. For the current purpose, we used self-esteem as the outcome to be predicted by the (other) available personality scales. 1 The data are available on request to the curators (see https://osf.io/q5zwp/). More information about the PILS was reported by Geukes et al. (2019).
To capture information beyond the mean, we used 11 additional, common ways of describing a distribution: the median, the mode (because some response distributions are bimodal, we calculate the largest and smallest modes, respectively), the standard deviation, the interquartile range, the range, the skew, the kurtosis, and the bimodality coefficient (skewness squared divided by kurtosis; Pfister et al., 2013). We also count the number of times a participant selected the maximum option of a scale (e.g., strongly agree, very accurate) and the number of times they selected the minimum option of a scale (e.g., strongly disagree, very inaccurate). 2 Interested readers may refer to Appendix A for a tutorial and example R code on how to produce such summary statistics. In the following, we report a selection of our results while providing the full results on OSF (https://osf.io/r46uw/).
The Mean Is the Most Reliable Statistic
An instrument that does not yield reliable scores does not permit valid interpretations. (Cook & Beckman, 2006, p. 166.e12)
A predictor that cannot be measured consistently is, regardless of any other property, a useless predictor. Thus, we began by examining the reliability of the different summary statistics before attempting to apply them in prediction. Figure 3 shows a variety of reliability coefficients for the summary statistics under scrutiny. Figure 3a depicts 1-year test–retest correlations of each summary statistic taken from Case 1 (LISS). As is apparent, the mean is clearly the most reliable statistic, with a test–retest correlation of r = .77 aggregated across scales. Other measures of central tendency (i.e., median and mode) show acceptable test–retest reliability around r = .60 and r = .70, respectively. 3 So, too, do the measures of extreme responses (i.e., number of strongly agree and number of strongly disagree). Except for the interquartile range, the measures of dispersion (i.e., the standard deviation, range) lie in the rs = .40 to .50 range—below acceptable test–retest reliability but still demonstrating some level of stability. Finally, the measures of distribution shape (i.e., the skew and kurtosis) show poor test-retest reliabilities of rs = .20 to .30.

Results from various reliability analyses. (a) Test–retest correlations across 1 year. Data are from the Dutch Longitudinal Internet Studies for the Social Sciences, 2020–2021, N = 4,856. (b) Test–retest correlations across 14 months. Data are from the Prosocial Personality Project, N = 971. (c) Interrater agreement correlations (self vs. acquaintance). Data are from the Personality Interaction Laboratory Study, N = 311. The x-axis is ordered such that the overall (i.e., average) correlation descends from left to right.
Why do measures of central tendency attain higher test–retest reliability than measures of spread and distribution shape? A possible explanation is that there are simply too few items in the scales to reliably capture the shape of the response distribution (each scale shown in Fig. 3a contains about 10 items). Indeed, this reasoning is supported by an analysis of the Dark Factor of Personality (the D factor; Moshagen et al., 2020) as contained in Case 2 (PPP). The D factor is typically measured with 70 items, but the scale has also been validated in medium-length (35 items) and short-form versions (16 items; Moshagen et al., 2020). As is apparent in Figure 3b, the mean score attains good test–retest reliability in all three versions of the scale. However, the measures of spread and shape are substantially more reliable in the 70-item version compared with the 16-item version (mean r = .57 vs. r = .39).
So far, our investigation has been limited to test–retest reliability. Another form of reliability may be obtained through observer reports, asking one or several acquaintances of a participant to perform a rating about the participant and correlating the obtained scores with the participant’s own. Such interrater agreement is shown in Figure 3c for Case 3 of our investigation (PILS). Although the results are less clear than for test–retest reliability in Cases 1 and 2 (Figs. 3a and 3b), the general pattern of mean > central tendency > spread > shape is still apparent. Overall, our findings suggest that the mean beats all other summary statistics in terms of test-retest and interrater reliability. Nonetheless, some of the other statistics are also reliable and may thus still be useful for predicting variance in outcome measures above and beyond the mean. We turn to this issue next.
The Mean Is the Best Predictor
A predictor is useful to the extent that it can account for variation in some outcome of interest. Commonly, one is interested in the unique predictive capability of a predictor, that is, the extent to which it predicts an outcome in and of itself and not through a relation with another variable. The summary statistics under scrutiny here are usually substantially correlated. In the extreme, the mean and median tend to correlate highly at around r ≥ .90. Thus, to compare the predictive power of different summary statistics, it is informative to take their partial correlation, partialing out the shared variance with all other summary statistics (of the same scale). Such partial correlations are shown in Figure 4. Figure 4a contains the results for Case 1, in which we used the mean score on life satisfaction as our outcome to be predicted by the Big Five, self-esteem, and positive and negative affect. As is apparent, the mean of the scales is the best unique predictor of life satisfaction, with partial correlations ranging from prs = .06 to .16 (depending on which scale is used as predictor), whereas all other summary statistics lie in the vicinity of pr = .03 (the only exception is Big Five Agreeableness, which shows low correlations with life satisfaction for all summary statistics considered). Figures 4b and 4c, showing results for outcomes from the two other cases—counterproductive work behavior and self-esteem—confirm this conclusion. The pattern remains consistent for the remaining two outcomes, too (i.e., mental health and SVO; all results are available on OSF). The mean thus appears to be the superior unique predictor among all summary statistics considered. 4

Results from various partial correlation analyses. For each estimate, all other summary statistics of the same scale are partialed out. (a) Correlations with life satisfaction. Data are from the Dutch Longitudinal Internet Studies for the Social Sciences, 2021, N = 5,358. (b) Correlations with counterproductive work behavior. Data are from the Prosocial Personality Project, N = 2,252. (c) Correlations with self-esteem. Data are from the Personality Interaction Laboratory Study, N = 311. The x-axis is ordered such that the overall (i.e., average) correlation descends from left to right.
Despite being worse partial correlates than the mean, the other summary statistics may still be useful predictors when modeled in conjunction with the mean. That is, they may provide incremental validity beyond the mean. This is typically tested in a stepwise regression procedure whereby predictors are entered one at a time and any improvement in model performance is taken as indication of incremental validity (e.g., Watkins & Glutting, 2000). One problem with this procedure is that adding more predictors to a model—even adding noise—always improves the performance of the model, at least if the model is evaluated on the same data that it is fitted on (Rocca & Yarkoni, 2021). This is because increasing the size of the model (by adding predictors) allows the model to predict the outcome variable “too closely” by picking up on statistical relations that are just random noise. As a remedy, it is recommended to fit the model on one part of the data set and then evaluate it on another part (a procedure known as “cross-validation”; James et al., 2013). Because the same noise is not present in both parts of the data set, the model is punished, not rewarded, for picking up the noise.
Figure 5 shows a series of stepwise regressions taken from Case 1 for illustration (for analyses on the other cases, showing the same pattern of results, see OSF). The outcome is mental health, and each figure represents a particular predictor, that is, a psychometric scale (i.e., Big Five and self-esteem). For each scale, summary statistics were added one at a time, starting with the strongest partial correlate of the outcome (typically, the mean) and continuing with the second strongest partial correlate and so forth. For example, for the Extraversion scale (in the middle of the upper row), the first predictor entered was the mean score, followed by the number of strongly agree responses, the mode, and so on. With each added predictor, the model attains a higher R2 when evaluated in-sample (black dots), but the cross-validated performance (white dots) peaks in the mean-only model and drops off steadily when adding other summary statistics as predictors. Although there are sometimes increases in R2 following the addition of another summary statistic (e.g., the interquartile range of Neuroticism or the range of Agreeableness in Fig. 5), these increases are typically miniscule and, thus, negligible. This pattern was largely consistent across scales and outcomes including Cases 2 and 3 (for details, see OSF). 5 All in all, the mean by far does most of the predictive work.

Series of stepwise regressions predicting mental health from a variety of summary statistics and scales. Predictors were added in the order of their partial correlation, starting with the largest value. Error bars indicate ±1 SE. CV = cross-validation. Data are from the Dutch Longitudinal Internet Studies for the Social Sciences, 2021. N = 5,358.
Letting the Data Speak
One may take issue with the fact that the above analyses are still somewhat contrived. For example, it would have been possible to enter the predictors in a different order, and one may thereby have arrived at slightly different conclusions. To settle any such doubts, we fit a series of regularized regressions. Regularized regressions, such as the least absolute shrinkage and selection operator (lasso), attempt to fit a linear model that includes only an optimal subset of predictors, ignoring those predictors that do not improve the model (James et al., 2013). To arrive at this subset of predictors, all potential predictors are first entered into the model. Then, one chooses a model complexity that yields the best predictions as determined via cross-validation. We did so using six different variants of regularized regression (i.e., lasso, elastic net, adaptive lasso, relaxed lasso, smoothly clipped absolute deviation [SCAD], and minimax concave penalty [MCP]). 6
In addition, we reran each of these analyses, this time entering only means into the model. Thus, we were able to compare the performance of a linear model constrained to means with a linear model having access to all summary statistics. As displayed in Figure 6, the mean-only models attained only slightly lower R2 values than the full models, indicating that the models rely almost fully on the means for their predictions. Indeed, in some cases, the mean-only models slightly outperformed the full models. 7 Thus, even when using a completely exploratory approach, we arrive at the same conclusion as before: that the mean suffices to capture the predictive utility of a participant’s responses to a scale.

Results from a series of regularized regression analyses, showing the performance of these models compared against regularized regressions fitted only to mean scores. Error bars indicate ±1 SE. (a) The outcome is life satisfaction. Data are from the Dutch Longitudinal Internet Studies for the Social Sciences (LISS), 2021. N = 5,358. (b) The outcome is mental health. Data are from the LISS, 2021. N = 5,102. (c) The outcome is social value orientation. Data are from the Prosocial Personality Project (PPP). N = 2,707. (d) The outcome is counterproductive work behavior. Data are from the PPP. N = 2,252. (e) The outcome is self-esteem. Data are from the Personality Interaction Laboratory Study. N = 311.
Finally, one might object that the importance of summary statistics other than the mean becomes apparent only through nonlinear relations and complex interactions between different summary statistics. For example, a large standard deviation in responses to a scale may reflect “noisy” (i.e., unclear) self-perception and attenuate the relationship between the mean score of those responses and another variable. To test this, we applied random forests (Breiman, 2001). Random forests work by fitting decision trees (e.g., “If X1 is above 2.0 and X2 is below 1.5, predict that y equals 3.2”) on bootstrap samples of the data. A random forest often contains around 500 to 5,000 trees, each of which produces a separate prediction that is averaged to yield an overall prediction. This makes the model extremely flexible and able to capture complex patterns in the data. 8 Following the same approach as before, we fitted one model to all the summary statistics and one model to just the means. 9 For Cases 1 and 2, corresponding to Figures 6a through 6d, the model trained on all summary statistics, compared with the model trained only on means, yielded ΔR2 = .007, ΔR2 = −.002, ΔR2 = −.004, and ΔR2 = −.005, respectively. 10 By implication, even when applying nonlinear models with interactions, the mean is sufficient for obtaining good predictions.
Why Is the Mean the Best Predictor?
Despite the abundance of responses disobeying the “assumptions” of the mean, the mean emerges as the best predictor—but why? Part of an explanation is given in the analysis of reliability. Because the mean attained higher test–retest and interrater reliability than the other summary statistics, its correlations are subject to less attenuation, thus making it a stronger predictor (Muchinsky, 1996). In addition, summary statistics other than the mean may conflate different constructs. A small standard deviation in Neuroticism could, for instance, also reflect intolerance of ambiguity (Naemi et al., 2009). Following this logic, relations with summary statistics other than the mean may be more prone to confounding by other personality processes, which could result in less predictive power.
Finally, part of predictive power of the mean may stem from the choice of outcome. In the analyses presented here—and in accordance with common practice in psychology—we predicted the “overall level” of the outcome, calculating a mean score when appropriate. Thus, the mean may have outperformed the other summary statistics because the outcome was itself a mean score (or otherwise reflected the “overall level” of the outcome as in the SVO angle; Murphy et al., 2011). This notion finds some support in our data: Figure 7 shows the correlation between Extraversion and Neuroticism in Case 1, depending on whether item responses were combined using the mean or the standard deviation. As shown, the standard deviation–standard deviation and mean–mean correlations were much stronger than the mean–standard deviation or standard deviation–mean correlations (this “cross-over pattern” recurred 22 of 28 scale pairs in Case 1; for details, see OSF). When the goal is to predict the standard deviation of responses for an outcome, the mean is thus sometimes outperformed by the standard deviation of responses for the predictor. These results suggest that the performance of the mean is tied to the choice of outcome. Consequently, our findings may be specific to outcomes that reflect the mean or “overall level” of a phenomenon and may therefore not generalize to outcomes calculated with another summary statistic (e.g., the standard deviation).
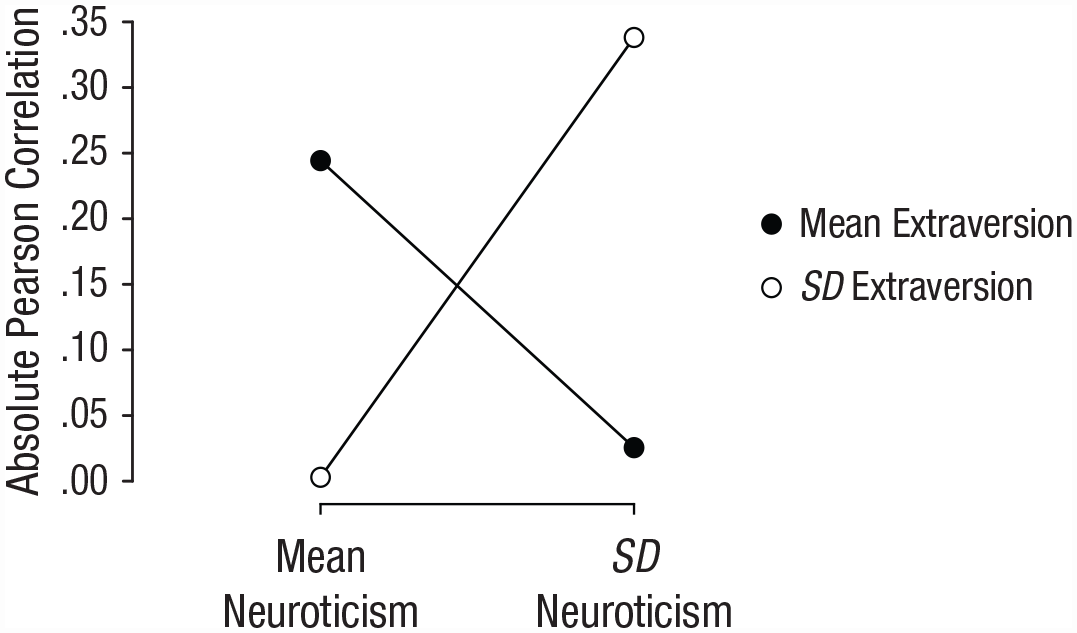
Correlations between Neuroticism and Extraversion, depending on whether item responses were combined using the mean or the standard deviation. Data are from the Longitudinal Internet Studies for the Social Sciences, 2021. N = 5,358.
Limitations
Before concluding, a couple of limitations need to be acknowledged. First, we considered only three separate cases, spanning 32 scales. Given that there are thousands of scales, it is conceivable that, say, the standard deviation or the kurtosis are important predictors in certain instances that we did not consider here. However, we intentionally selected a considerable variety of well-established scales (e.g., Big Five, HEXACO) that are used in different research areas. Thus, it is at least unlikely that our results are misrepresentative of the bigger picture. That said, it is our hope that the present work opens an avenue for future research to look at existing data in a new light.
Second, the present analyses were limited to Dutch and German samples, both from WEIRD (Western, educated, industrialized, rich, and democratic) populations (Henrich et al., 2010). Given that even mean scores of established scales may vary wildly in reliability across cultures (e.g., Laajaj et al., 2019), so too may other summary statistics. Even so, our goal was to evaluate the common practice in mainstream psychology. Thus, WEIRD samples served our purposes best because they remain the object of most research.
Third, the analyses are limited to scales with at least nine items and multiple (usually five) response options. It is thus unclear whether our results generalize to scales with fewer items or response options. Note that our analyses may not even be appropriate in such cases because the reliability of the summary statistics may be too low (see our reliability analyses) or because the summary statistics cannot be calculated.
Finally, because the present contribution uses real data, we do not know which qualities of the data-generating mechanism explain our results. In other words, our work is mute on the exact statistical conditions that lead to the mean emerging as the strongest predictor and the possible conditions under which the mean might be outperformed by other summary statistics. Future work could complement ours by using simulation to study the predictive power of different summary statistics under different data-generating mechanisms. Of particular interest is the choice of outcome, for instance, whether the outcome reflects the “overall level” of a phenomenon or its variability.
Conclusion
By and large, our results affirm that the dominant practice in psychological research of computing mean scores is the optimal way to summarize participants’ responses to a scale. Across a variety of well-established scales, outcomes, and commonly used summary statistics, we consistently found the mean to be the most reliable and predictive measure. Nonetheless, the mean was not the only viable statistic, and ultimately, whether to use the mean or some other summary statistic is a methodological choice. Optimally, researchers should be cognizant of alternatives to the mean and choose the summary statistic that serves their purpose best. If, for instance, one works with mental-health scales in which a low score on any item can convey a great deal, the mean may be less interesting than the number of strongly disagree responses. Insofar as the goal is to predict the “overall level” of an outcome, psychologists may rest assured that their hitherto used scale scores are sufficient. Nevertheless, a world of vast possibilities lies beyond the mean—surely, a little curiosity is aroused.
Footnotes
Appendix A
To calculate a variety of summary statistics of a given scale, one can make use of the custom function
If one needs to summarize many scales at once, the
Acknowledgements
We thank Sergio Pirla for his help and insightful discussions.
Transparency
Action Editor: Pamela Davis-Kean
Editor: David A. Sbarra
Author Contribution(s)