
Abstract
People can easily extract and encode statistical information from their environment. However, research has primarily focused on conditional statistical learning (i.e., the ability to learn joint and conditional relationships between stimuli) and has largely neglected distributional statistical learning (i.e., the ability to learn the frequency and variability of distributions). For example, learning that “E” is more common in the English alphabet than “Z.” In this article, we investigate how distributional learning can be measured by exploring the relationship between, and psychometric properties of, four different measures of distributional learning—from the ability to discriminate relative frequencies to the ability to estimate frequencies. We identified moderate relationships between four distributional learning measures and these tasks accounted for a substantial portion of the variance in performance across tasks (44.3%). A measure of divergent validity (intrinsic motivation) did not significantly correlate with any statistical learning measure and accounted for a separate portion of the variance across tasks. Our results suggest that distributional statistical learning encompasses the ability to discriminate between relative frequencies and estimating them.
One way that people process the overload of sensory information from their environment is to extract patterns and regularities. The ability to do so—known as statistical learning—is thought to contribute to many basic perceptual and cognitive processes, such as categorisation and language acquisition (Siegelman & Frost, 2015). Individuals can extract many different forms of statistical regularities—from relationships between stimuli (e.g., A co-occurs with B in time or space; i.e., conditional statistical learning) to the frequency and variability of stimuli in the environment (e.g., C occurs more often than D; i.e., distributional statistical learning; Siegelman et al., 2017; Thiessen & Erickson, 2013; Zacks & Hasher, 2002). While these statistical learning processes are interrelated (Growns et al., 2020), the bulk of contemporary statistical learning research has focused on conditional learning (see Frost et al., 2019 for review) and has largely overlooked distributional learning. Given that distributional learning theoretically encompasses many abilities—from discriminating relative frequencies to estimating them (Hasher & Zacks, 1984)—it is important to explore exactly what comprises this construct.
Research has revealed striking similarities between distributional and conditional learning. As with conditional learning: distributional learning occurs from an early age (Antell & Keating, 1983; Kirkham et al., 2002; Starkey & Cooper, 1980); with limited intention or awareness (Attneave, 1953; Coren & Porac, 1977; Turk-Browne et al., 2005); and explicit instructions do not necessarily “increase” learning (Arciuli et al., 2014; Bertels, Destrebecqz, & Franco, 2015; Flexser & Bower, 1975; Harris et al., 1980). Yet there are also some inconsistencies between the two forms of learning. Unlike conditional learning, some studies have shown that distributional learning varies little between individuals (Goldstein et al., 1983; Siegelman et al., 2017; Siegelman & Frost, 2015; Zacks et al., 1982) and typically is not affected by age (Campbell et al., 2012; Hasher & Chromiak, 1977; Hasher & Zacks, 1979).
More recent distributional learning research has largely focused on the role of distributional learning in language and object acquisition. For example, exposure to bimodal distributions of sounds (e.g., sounds from distribution of “da” to “ta”) or objects (e.g., faces morphed along a “continuum”) typically facilitate later discrimination of these stimuli, compared to exposure to a unimodal distribution where stimuli occur more frequently in the “middle” of the distribution (Altvater-Mackensen et al., 2017; Escudero & Williams, 2014; Junge et al., 2018; Maye et al., 2002, 2008; Yoshida et al., 2010). Individuals can also learn more complex distributional information—such as language-like Zipfian distributions where select words are more frequent than others (Kurumada et al., 2013)—which are implicated in language and category acquisition (Hendrickson & Perfors, 2019; Schuler et al., 2017). While the role of distributional learning in language and object acquisition is becoming clearer, much less is known about how or even how well we can measure distributional learning.
Distributional learning can be measured in several ways: from discriminating or ranking relative frequencies to directly estimating them (Hasher & Zacks, 1984). Yet these different distributional learning measures have not been compared or studied in parallel. We, therefore, don’t know whether these measures tap into one unified ability to communicate learned distributional information, or whether individuals have separate skills in communicating different forms of distributional information. Individuals are typically able to discriminate between relative statistical frequencies (e.g., “Are white cars more common than red cars?”; Growns et al., 2020; Growns & Martire, 2020), but are typically poor at precisely estimating probabilities and judging the base rates of events (e.g., “What percentage of cars are red?”; Bar-Hillel, 1980; Brenner et al., 1996; Lee & Danileiko, 2014; Martire et al., 2018; Mattijssen et al., 2020; Zhang & Maloney, 2012).
The ability to learn distributions and probabilities in the environment has been measured using both discrimination and estimation tasks. Yet research investigating individual differences in these tasks is only just beginning to emerge. For example, Zhou et al. (2024) demonstrated that individual differences in distributional learning could be elicited by both tasks categorising distributional information and reproducing learned distributional information. Both measures demonstrated above-chance performance suggesting that they are appropriate measures of distributional statistical learning. Yet limited research has investigated how individual differences in these measures are associated with one another.
There is also a limited understanding of how well distributional learning can be measured. Recent research has shown that two-alternate forced-choice (2AFC) of both conditional and distributional statistical learning measures are less reliable and stable than more complex and difficult measures, such as measures with more trials or choices (Arnon, 2020; Christiansen, 2019; Isbilen et al., 2020, 2022; Kidd et al., 2020, 2023; Siegelman et al., 2017; Siegelman & Frost, 2015; Streiner, 2003). Limited reliability increases measurement error and hinders the ability to study individual differences and variability in statistical learning (Siegelman et al., 2017). It is possible that 2AFC distributional learning measures have the same limitations. Indeed, many early distributional learning studies utilised 2AFC distributional learning measures (e.g., Goldstein et al., 1983; Zacks et al., 1982)—specifically those that failed to observe individual and age differences in distributional learning (Goldstein et al., 1983; Hasher & Chromiak, 1977; Hasher & Zacks, 1979; Zacks et al., 1982). 2AFC may also have lower reliability than more complex and difficult measures. Yet few studies have explored this issue or attempted to develop more difficult distributional learning measures.
Our capacity to understand statistical learning and its role in cognitive functioning is limited until we establish how and how well we can measure it. Distributional and conditional statistical learning are believed to involve separate, but interrelated, memory processes (Thiessen & Erickson, 2013; Thiessen et al., 2013). Specifically, distributional learning is thought to involve integration processes where a central tendency and variability surrounding this is stored in memory, while conditional learning entails extraction processes where discrete units (e.g., words) are stored in memory (Thiessen et al., 2013). Prominent mathematical theories also suggest that distributional information may be critical for determining diagnostic value (Bruce & Tsotsos, 2009; Busey et al., 2016; Growns & Martire, 2020a, 2020b; Growns, Mattijssen, et al., 2022; Growns, Towler, et al., 2022). Distributional learning could therefore also play a role in visual identification tasks, such as disease detection in radiology or forensic comparison tasks. Yet our limited understanding of the best methods for measuring distributional learning hinders our ability to empirically explore these possibilities.
In this article, we examine the association between, and psychometric properties of, four different measures of distributional learning. If these distributional learning skills are related to one unified ability to communicate learned distributional information, we would expect to see significant associations between all measures. Conversely, if they measure separate aspects, we would not necessarily expect significant associations. We also explored the relationship between these measures and a measure of divergent validity: intrinsic motivation (the Intrinsic Motivation Inventory; McAuley et al., 1989).
Method
This experiment examined the relationships between and psychometric properties of four different measures of distributional statistical learning. We adapted a validated distributional learning task from the literature to explore this (Growns et al., 2020).
Design and ethics approval
We examined the relationship between and psychometric properties of four distributional learning measures completed by participants within-subjects in a randomised order: discrimination judgements, rank-order judgements, unbounded frequency estimates, and bounded frequency estimates. The study pre-registration data and analysis scripts can be found at https://osf.io/p43u8.
This study was approved by the Arizona State University Institutional Review Board (Approval No. 11471). Written consent was obtained from all participants upon commencing the experiment.
Participants
Participants were 112 individuals recruited from Prolific Academic based on our pre-registered a priori power analysis to detect a correlation of r = .03 with 90% power. Participants were compensated $6.50 for participation in a 60-min study. Participants were required to have normal or corrected-to-normal vision, live in the United States, have an approval rating of 95 +%, and completed at least 5 previous submissions on Prolific to participate in the study. Participants were excluded if they did not pass a pre-registered attention-check 1 question threshold of at least three (out of five) correct responses (n = 11). Participants in the final sample (N = 101) were 34.9 years of age (SD = 12.7, min = 18, max = 72) and the majority reported they were female (63.4%; male = 33.7%; gender diverse = 3.0%).
Materials
Apparatus
Participants completed the experiment using Qualtrics (2005)—an online survey platform. Participants were instructed to adjust the zoom on their monitors so they could see all images fully and to only take breaks when prompted (e.g., between two blocks).
Stimuli
Participants completed four different tasks in a randomised order where they first completed an exposure phase where they viewed 60 pattern exemplars and then a test phase containing one distributional learning measure. Participants completed each exposure and test phase using stimuli with different base patterns and different shapes in each task (see Figure 1).
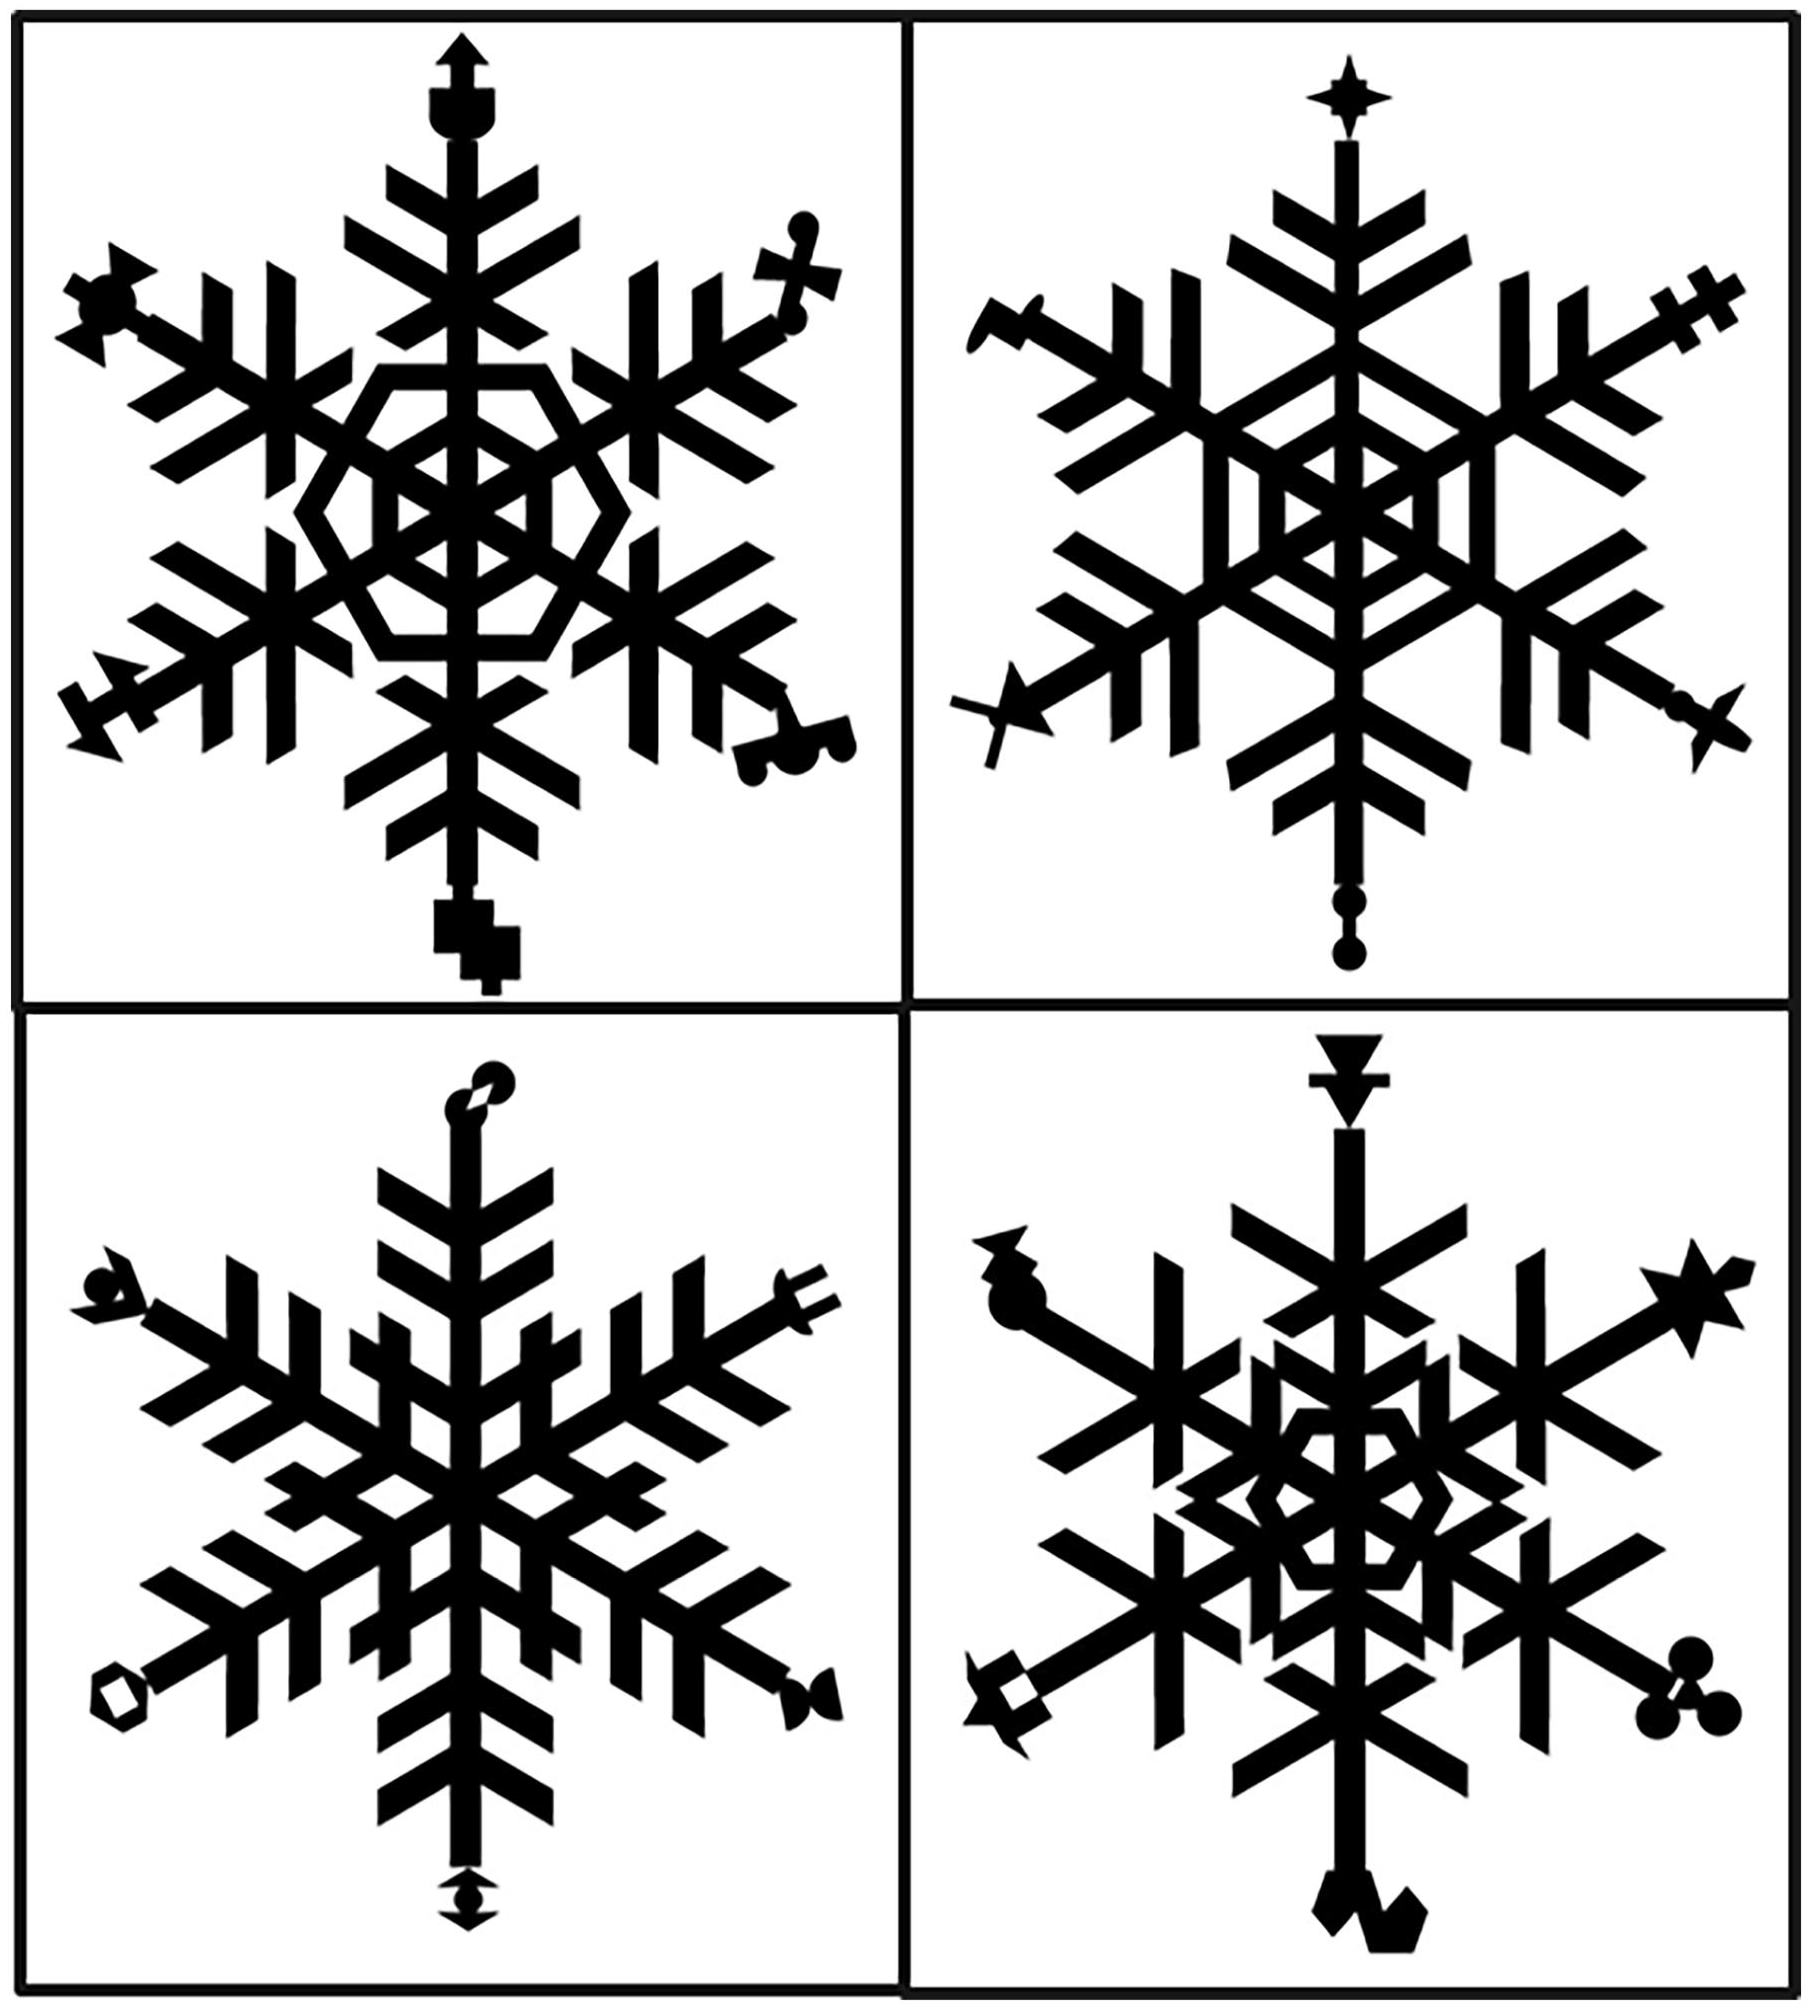
Example stimuli used in each distributional learning task adapted from Siegelman et al. (2017).
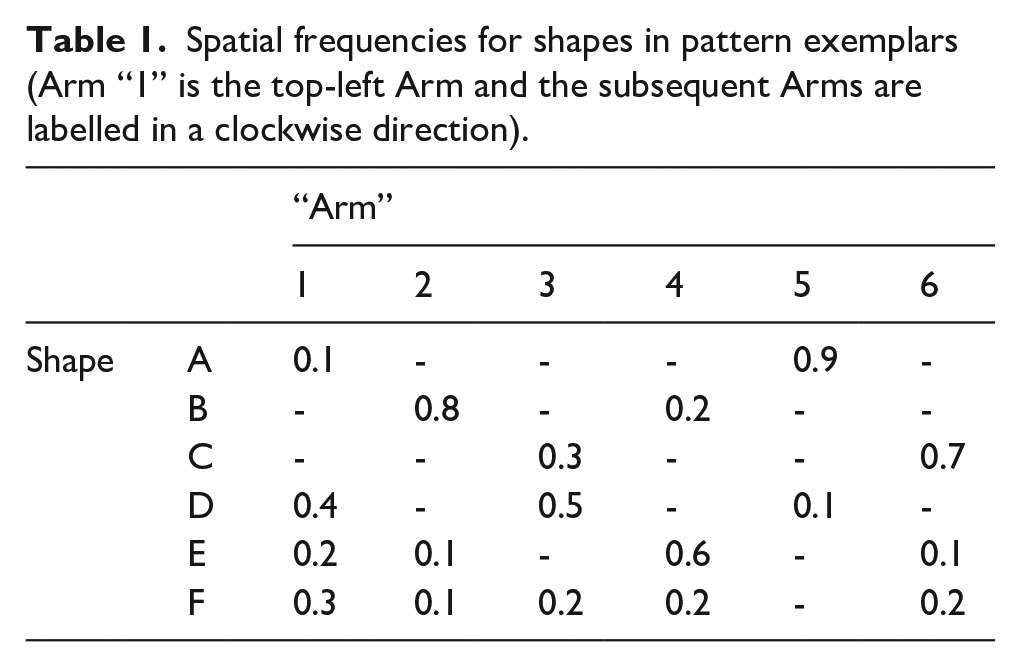
In each exposure phase, participants viewed 60 pattern exemplars manipulated to contain 6 different shapes that appeared with different frequencies on different “arms” of the base pattern (see Figure 1). Base patterns differed in each task to differentiate the tasks from one another. Shapes occurred in different spatial locations as described in Table 1. Each task consisted of stimuli that utilised the distributional frequencies in Table 1 with different shapes assigned to each number (see Figure 1).
Spatial frequencies for shapes in pattern exemplars (Arm “1” is the top-left Arm and the subsequent Arms are labelled in a clockwise direction).
Dependent measures
Participants completed all distributional learning tasks in a randomised order to account for any order effects between measures. Trials within each task in the test phase were completed in a set order to minimise error variance (Mollon et al., 2017). Trials in each test phase were also comprised of different “arms” depending on the exemplar set they originated from (see Figure 1). For example, the “arms” depicted in Figure 2 are from the exemplar set in the bottom left panel of Figure 1.
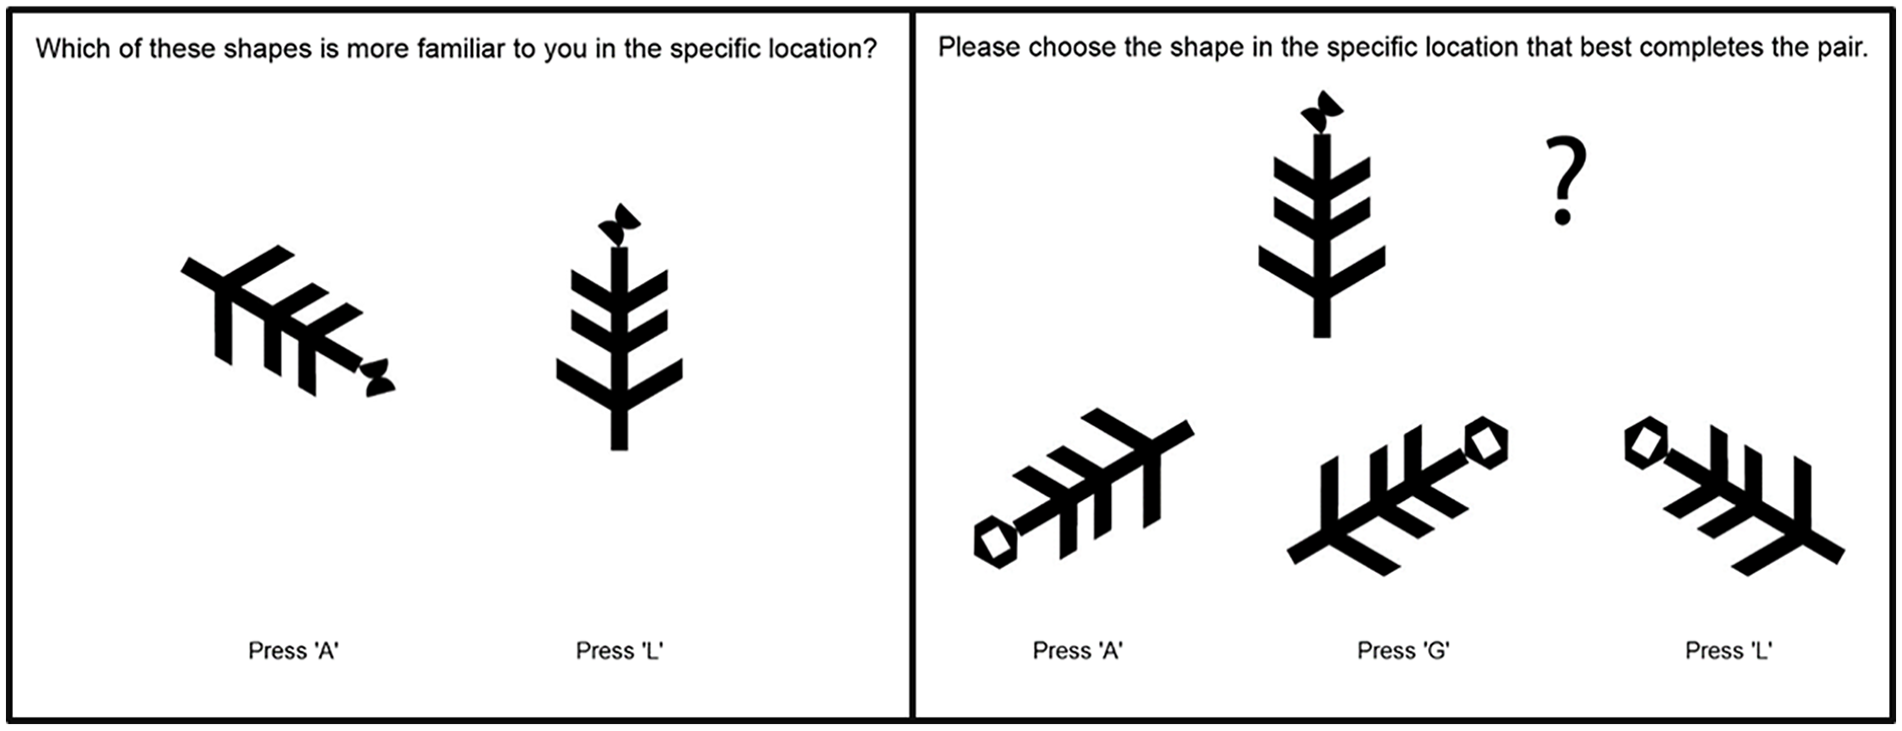
Examples of 2AFC pattern recognition (left panel) and MAFC pattern completion (right panel) discrimination judgement trials. In this example, the feature in the left panel and at the top in the right panel is Shape B from Table 1, and the feature at the bottom of the right panel is Shape F. Thus the correct answer for this trial is Press L (Arm 2) in the left panel and Press L (Arm 1) in the right panel as these are the locations each shape appeared in more.
Discrimination judgements
Participants completed 38 discrimination judgement trials of two types: pattern recognition (n = 20) or pattern completion (n = 18). On pattern recognition trials, participants were asked which shape in a specific location was more familiar to them out of an array of two, three, or four shapes (i.e., N-AFC trials; see Figure 2 left panel). On pattern completion trials, participants were asked to “choose the shape in the specific location that best completes the pair” from an array of two, three, or four of the same shape in different locations (see Figure 2 right panel). For all trials, the target was the most common location for the shape (e.g., Shape 1 [0.9] on Arm 5) and foils were the less common locations (e.g., Shape 1 [0.1] on Arm 1). The correct answer could be determined by knowing the most frequent location for a shape. Chance performance in this task was 15.67 trials or 40.45% accuracy.
Rank discrimination judgements
Participants completed 25 rank judgement trials where they were asked to rank two, three, or four exemplars of the same shape appearing in different locations from most to least familiar. Participants were required to click and drag each shape into boxes from “most familiar” (top box) to “least familiar” (bottom box) with “second” or “third most familiar” boxes in between as necessary. Trials were designed so that there was always a correct rank answer (e.g., Arm 1—Arm 3—Arm 2 would be a correct rank order for shape 6; see Table 1).
Performance in this task was measured by calculating the total position violations in each trial and then normalising this by the absolute rank difference given the number of images in that trial. The absolute rank difference was the highest possible total number of position violations in any trial given the number of images calculated as (n^2 + n)/2—ceil(n/2) where n is the number of images). For example, if 1-2-3 was the correct rank, then accuracy would be 0.5 for a predicted rank of 2-1-3 (2 position violations/absolute rank difference of 4) and 1 for a predicted rank of 3-2-1 (4 position violations/absolute rank difference of 4). Performance was then summed across all 25 trials so that higher scores indicate more rank violations and poorer performance. Chance performance in this task was a score of 7 or 28%.
Bounded frequency estimates
Participants were again shown each shape in each of its previous locations and were asked “What percentage of the time did this shape occur in this specific location in the images that you saw?” Participants provided estimates on a scale from 0 to 100% that was restricted to provide a minimum value of 0 and a maximum value of 100.
Performance was calculated by subtracting the true frequency for the shape in that spatial location from the estimated frequency for each shape, taking the absolute value for each score then averaging across all 18 individual scores (see Table 1).
Unbounded frequency estimates
Participants were shown each shape in each of its previous locations and were asked “What number of times did you see this shape in this specific location out of what number of patterns?” Participants responded by providing two estimates: A) the number of times they saw the shape in the specific location (“X”; B) the number of shape images they saw (“Y”). No bounds were restricted to participants” numerical estimates, but their responses were constrained such that the second value (B) had to be greater than or equal to the first value (A).
Performance was calculated by multiplying the provided estimates (X/Y) and true (A/B) ratios by 100, then subtracting the true ratio from the estimated ratio and taking the absolute value of each score. Performance was then averaged over all 18 scores (see Table 1).
Intrinsic motivation
Participants completed a measure of their intrinsic motivation and subjective experience during the experiment: the Intrinsic Motivation Inventory (McAuley et al., 1989). They completed three sub-scales of the inventory: the effort, enjoyment, and perceived competence sub-scales. Participants answered questions on a 7-point Likert-type scale from “Not At All True” to “Very True.” They answered questions such as: “I put a lot of effort into this” (effort sub-scale); “I enjoyed doing this activity very much” (enjoyment sub-scale); and “I am satisfied with my performance in this task” (perceived competence sub-scale). A full list of the questions can be found at https://selfdeterminationtheory.org/intrinsic-motivation-inventory/.
Intrinsic motivation scores were calculated by averaging participants’ Likert-type-scale responses on the effort, enjoyment, and perceived competence inventory sub-scales (including reverse-scoring the items that required reverse-scoring according to the coding instructions).
Procedure
Participants completed four tasks in a randomised order where they first completed an exposure phase of 60 exemplars (3-s duration and 200-ms interstimulus-interval) and then a test phase containing one distributional learning measure. They were instructed to pay attention to the stimuli as they would be asked some questions about them afterward. After completing all four distributional learning tasks, they then completed the three Intrinsic Motivation sub-scales. Upon completion, they provided brief demographic information and then viewed a debrief screen.
Results
Descriptive statistics and psychometric properties
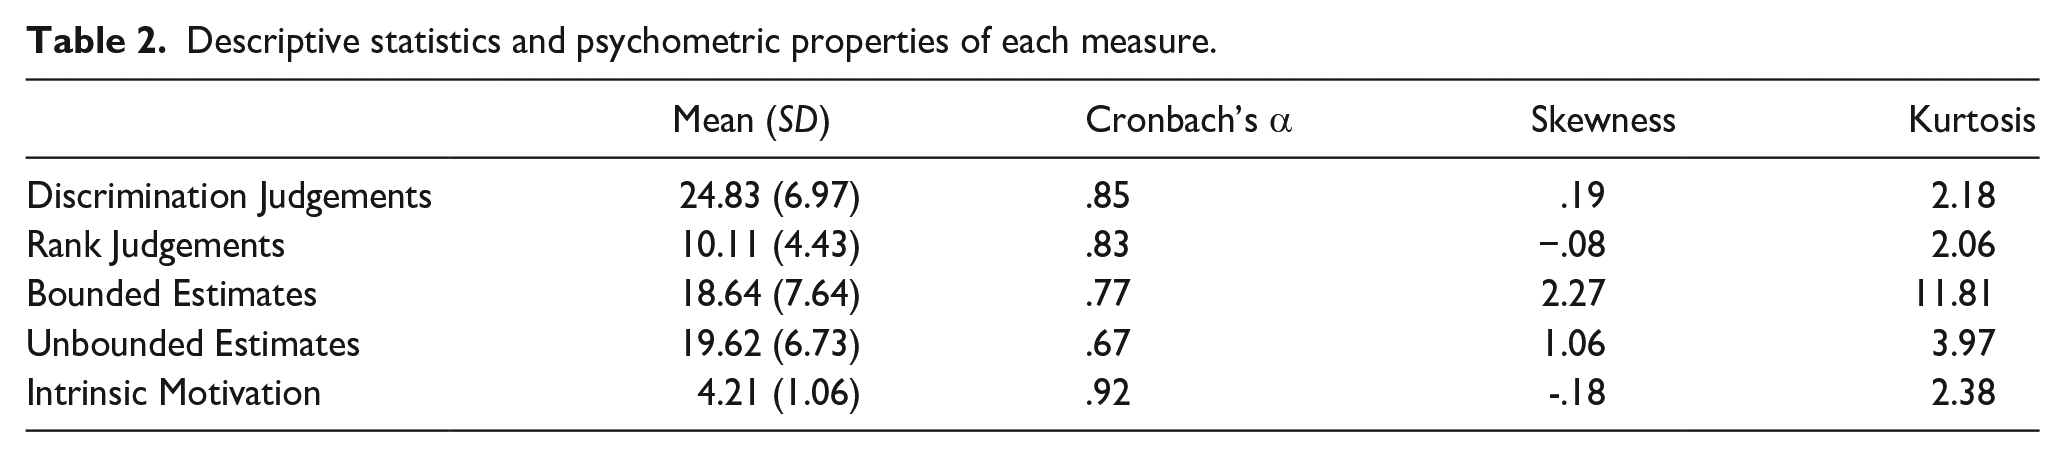
Descriptive statistics and psychometric properties of each measure can be seen in Table 2. Discrimination, t(100) = 13.20, p < .001, d = 1.31, and rank judgements, t(100) = 7.05, p < .001, d = .70, were significantly above chance. Bounded and unbounded estimation error was also relatively low and within the range of previous research (Growns & Martire, 2020a; Mattijssen et al., 2020). Note that lower estimation error indicates better performance. These results suggest that individuals learned the distributional information they viewed. All measures displayed psychometric properties close to or above recommended psychometric values (> .8; Siegelman et al., 2017; Streiner, 2003; see Table 2). The skewness of two measures (bounded and unbounded estimates) was highly positively skewed. 2
Descriptive statistics and psychometric properties of each measure.
Correlational analyses
We used the core stats and BayesFactor packages in R (Morey et al., 2018) to investigate correlations between all measures. Discrimination judgement accuracy, rank judgement error, bounded estimation error, and unbounded estimation error all significantly correlated with one another and there was strong evidence for the presence of all correlations between these measures compared to the alternative hypothesis of the absence of a correlation (see Figure 3 and Table 1 in the online Supplementary Material for detailed statistics; Wetzels et al., 2011).
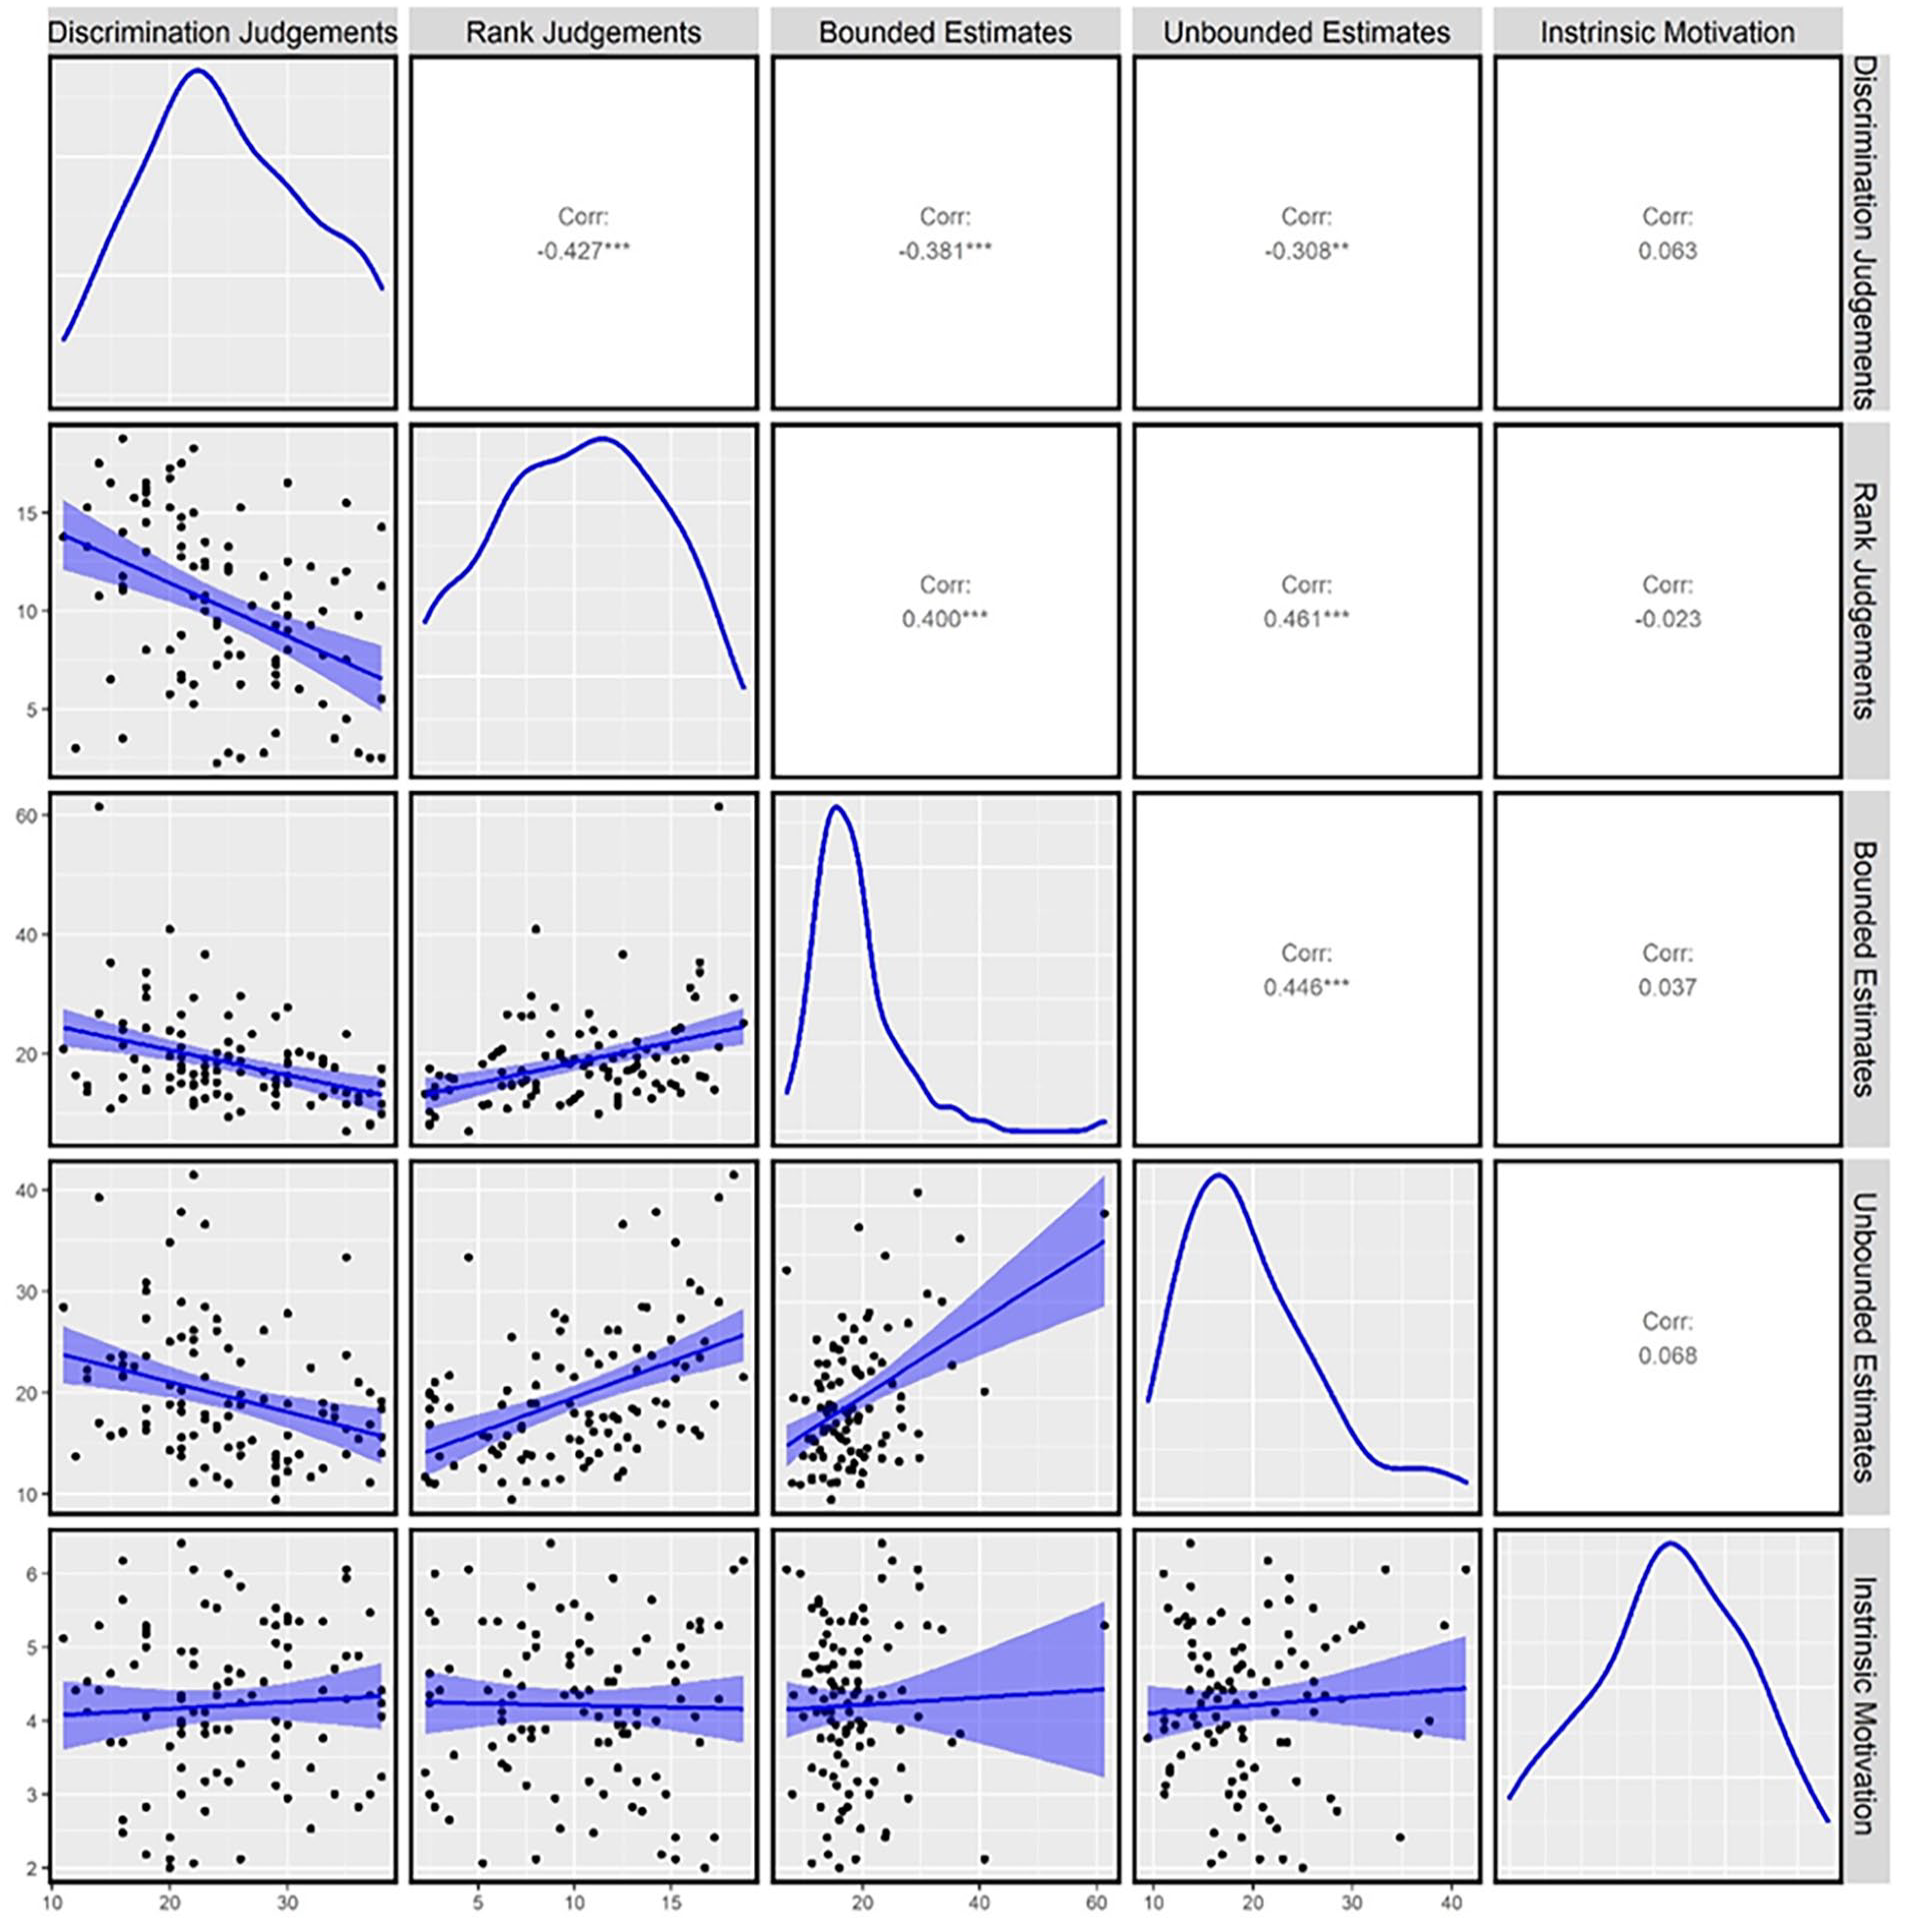
Distributions and correlations between all measures: raw data and correlations displayed with 95% confidence interval bands in lower left boxes, distributions of each measure in each diagonal box and Pearson correlations in upper right boxes, and p values are represented as: *** denotes < .001, ** denotes < .01, and * denotes < . 05.
Intrinsic motivation scores did not significantly correlate with any distributional learning measure, and there was anecdotal evidence for the absence of all correlations. This suggests that discrimination and rank judgements, and bounded and unbounded estimation, are all related—but unrelated to intrinsic motivation.
Principal component analysis
We further explored the similarities and differences in variance accounted for by each of the five tasks (four distributional learning tasks and intrinsic motivation scores) with a Principal Component Analysis (PCA) using the prcomp function from the core stats package in R. We retained all components with an eigenvalue above one (Guttman, 1954). The PCA identified two components that explained 64.91% of the variance in performance across all tasks. The loadings of all tasks on both components and the proportion of variance explained by each component can be seen in Table 3.
Results of Principle Component Analysis (PCA): Loadings matrix and percentage of variance explained.
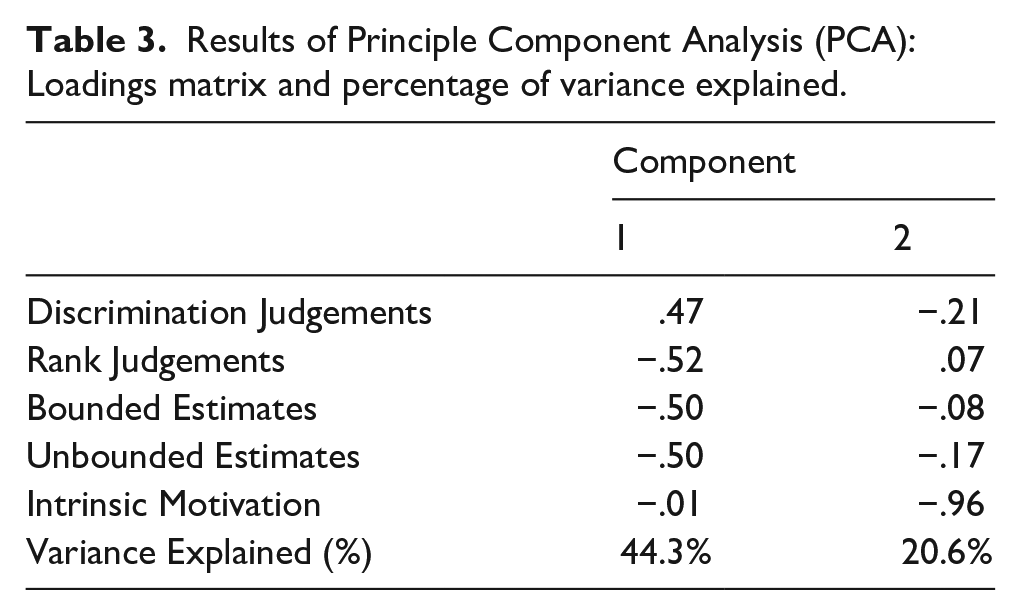
The first component explained a substantial portion of the variance in task performance across all five tasks (44.3%). All distributional learning measures—but not intrinsic motivation scores—strongly loaded onto this component indicating that this component captures the variance these tasks share. 3 The second component also explained a substantial amount of observed variance (20.6%). Only intrinsic motivation scores loaded onto this component.
Discussion
This paper provides an empirical investigation of how and how well distributional statistical learning can be measured using different distributional learning tasks. We explored the associations between and psychometric properties of four methods for measuring distributional learning: discrimination judgements, rank judgements, bounded estimation, and unbounded estimation.
The results of the present study suggest that different distributional learning measures tap into a generalised ability to learn distributional statistical information. We found strong evidence of relationships between measures of the ability to discriminate between relative frequencies (discrimination and rank judgements) and estimate frequencies (bounded and unbounded frequency estimates). This suggests that better “discriminators” are also better “estimators.” These measures also accounted for a substantial portion of the variance in performance across all tasks (four distributional learning measures and intrinsic motivation) and loaded similarly onto the same component in the PCA. The combined correlational and PCA results suggest that these distributional learning measures all tap into a related ability. This ability may relate to the learning and communication of different forms of distributional information. Notably, this relationship could not be attributed to intrinsic motivation—which did not significantly correlate with any distributional learning measure, and loaded onto a separate component in the PCA.
Our measures of distributional learning also showed similar reliability and internal consistency to contemporary measures of both distributional (Isbilen et al., 2022; Kidd et al., 2020) and conditional learning (Siegelman et al., 2017). Similar to earlier 2AFC conditional learning measures, the 2AFC distributional learning measures used in previous research may also have had limited reliability and thus hindered the ability to capture individual differences and variability. This could explain some of the contradictions between early and contemporary findings in distributional statistical learning research (Campbell et al., 2012; Goldstein et al., 1983; Hasher & Chromiak, 1977; Hasher & Zacks, 1979; Siegelman et al., 2017; Zacks et al., 1982). It also highlights the importance of using reliable measures of statistical learning—particularly when investigating individual differences (Siegelman et al., 2017). Our results broadly expand the conceptualisation of statistical learning as a theoretical construct. Distributional learning has been theorised to involve storing central tendency and variability of distributions in memory (Thiessen et al., 2013). Our results expand this conceptualisation to demonstrate that distributional learning encompasses not only the ability to learn distributional variability—but also involves the ability to explicitly recall and estimate this information. To our knowledge, this is the first empirical evidence that distributional statistical learning encompasses these many facets—from discriminating relative frequencies to estimating them (Hasher & Zacks, 1984). Importantly, given that distributional and conditional statistical learning are interrelated abilities (Growns et al., 2020), it is possible that conditional statistical learning could also encompass the ability to estimate conditional probabilities—an important avenue for future research.
It is nevertheless worth noting that some of the shared variance across tasks may be due to individual differences in other cognitive processes, such as attention or memory. Human memory is comprised of separate recognition and recall systems (Haist et al., 1992). The measures in this paper tap into both systems: discrimination and rank judgements reflect the ability to recognise differences in frequency, while frequency estimates are the ability to recall these frequencies. Yet our data cannot determine the specific role of encoding and broader memory ability in statistical learning. Statistical learning may be inextricably linked with other sensory and memory processes and thus unable to be disentangled from one another (see Frost et al., 2015). It will be important for future research to continue to investigate the potential role of other cognitive processes in statistical learning, particularly by including unrelated memory measures.
Statistical learning itself is theorised to be both implicit and explicit in nature (Arciuli et al., 2014; Batterink et al., 2019; Batterink, Reber, Neville, & Paller, 2015; Batterink, Reber, & Paller, 2015; Bertels, Boursain, et al., 2015). Many studies have shown that people can passively learn statistical regularities—even without being instructed to do so or when performing an unrelated cover task (Fiser & Aslin, 2001, 2002; Turk-Browne et al., 2005; Turk-Browne & Scholl, 2009). This has led many to suggest that statistical learning occurs “involuntarily” and “without intent or awareness” (Fiser & Aslin, 2001; Turk-Browne et al., 2005).
Yet recent meta-analytic research reveals that explicit instructions to learn statistical regularities enhance statistical learning consistently across age, modality, domains, and paradigms (Ren et al., 2024). Together, this research suggests that statistical learning can occur both intentionally and incidentally (Batterink, Reber, Neville, & Paller, 2015; Ren et al., 2024). While our results do not provide direct evidence of whether distributional statistical learning is acquired implicitly or explicitly, they contribute to the growing evidence of the complex multifaceted nature of statistical learning that can be elicited via many different methods.
In this article, we examined the quality and associations between different measures of distributional statistical learning. We found that distributional learning is an interplay between the ability to discriminate between relative frequencies and to provide frequency estimates. These results expand our knowledge about statistical knowledge more broadly and will assist future research exploring statistical learning and its role in various aspects of human cognition.
Supplemental Material
sj-docx-1-qjp-10.1177_17470218241293235 – Supplemental material for Individual differences in distributional statistical learning: Better frequency “discriminators” are better “estimators”
Supplemental material, sj-docx-1-qjp-10.1177_17470218241293235 for Individual differences in distributional statistical learning: Better frequency “discriminators” are better “estimators” by Bethany Growns, Kristy A Martire and Erwin J A T Mattijssen in Quarterly Journal of Experimental Psychology
Footnotes
Declaration of conflicting interests
The author(s) declared no potential conflicts of interest with respect to the research, authorship, and/or publication of this article.
Funding
The author(s) disclosed receipt of the following financial support for the research, authorship, and/or publication of this article: This work was supported by funding from the National Science Foundation (Grant No. 1823741).
Ethics approval
This study was approved by the Arizona State University Institutional Review Board (Approval No. 11471).
Consent to participate
Informed consent was obtained from all individual participants included in the study.
Consent to publish
Patients signed informed consent regarding publishing their data.
Data accessibility statement
Supplementary material
The supplementary material is available at qjep.sagepub.com.
Notes
References
Supplementary Material
Please find the following supplemental material available below.
For Open Access articles published under a Creative Commons License, all supplemental material carries the same license as the article it is associated with.
For non-Open Access articles published, all supplemental material carries a non-exclusive license, and permission requests for re-use of supplemental material or any part of supplemental material shall be sent directly to the copyright owner as specified in the copyright notice associated with the article.