
Abstract
Given significant concerns about fairness and bias in the use of artificial intelligence (AI) and machine learning (ML) for psychological assessment, we provide a conceptual framework for investigating and mitigating machine-learning measurement bias (MLMB) from a psychometric perspective. MLMB is defined as differential functioning of the trained ML model between subgroups. MLMB manifests empirically when a trained ML model produces different predicted score levels for different subgroups (e.g., race, gender) despite them having the same ground-truth levels for the underlying construct of interest (e.g., personality) and/or when the model yields differential predictive accuracies across the subgroups. Because the development of ML models involves both data and algorithms, both biased data and algorithm-training bias are potential sources of MLMB. Data bias can occur in the form of nonequivalence between subgroups in the ground truth, platform-based construct, behavioral expression, and/or feature computing. Algorithm-training bias can occur when algorithms are developed with nonequivalence in the relation between extracted features and ground truth (i.e., algorithm features are differentially used, weighted, or transformed between subgroups). We explain how these potential sources of bias may manifest during ML model development and share initial ideas for mitigating them, including recognizing that new statistical and algorithmic procedures need to be developed. We also discuss how this framework clarifies MLMB but does not reduce the complexity of the issue.
Keywords
With the growing pervasiveness of artificial intelligence (AI) and machine learning (ML) applications throughout society, concerns have intensified over systematic inequalities and unfairness that such applications may create or perpetuate. Multiple examples of bias have emerged across fields and applications of algorithms in society. In the business space, an AI tool for résumé screening developed by Amazon favored men over women (Dastin, 2018). In the health care space, a popular algorithm used to identify patients with health care needs generated differential risk scores for Black patients compared with White patients (i.e., sicker Black patients are assigned risk scores equivalent to healthier White patients), which can cause disparities in health care access (Obermeyer et al., 2019). In the context of surveillance and security, facial-recognition technology has been shown to be less accurate for darker-skinned females than lighter-skinned males (Buolamwini & Gebru, 2018; Najibi, 2020), which can contribute to greater racial inequities, such as differential rates of false indictments.
In psychology and related fields, there has been a surge of research using AI and ML to automate and/or guide assessments and decisions about people (i.e., ML-based psychological assessment, or ML measurement), which are also increasingly incorporated into practice (Adjerid & Kelley, 2018; Harlow & Oswald, 2016; Woo, Tay, & Proctor, 2020). Researchers have investigated the validity of social media data for inferring personality (Kosinski et al., 2013; Park et al., 2015) and depression (De Choudhury, Gamon, et al., 2013), video data for capturing emotion (Dhall et al., 2015), college applications for prospectively predicting graduation (Hutt et al., 2019), and narrative comments for estimating job-performance ratings (Speer, 2018). In industry, organizations are increasingly adopting ML measures to assess applicants’ psychological attributes and aid, or even replace, human judgments (e.g., Campion et al., 2016).
Across these domains, significant concerns have been raised about potential bias, unfairness, and discrimination, which are largely untested (Oswald et al., 2020). Failure to adequately address measurement bias in ML measurements can have far-reaching effects because ML measurements are often used to guide, or even automate, high-stake decisions with real-life consequences. For example, using biased automated assessments of job interviews may disproportionately exclude underrepresented (gender/racial) minorities from a job or occupation (Booth et al., 2021). In other instances, ML measurements are increasingly applied to clinical and medical diagnosis (Hosseinifard et al., 2013; Kononenko, 2001), and biased ML measurements can lead to inequalities in the provision of mental-health care.
One significant barrier to systematic research on the topic of ML bias (also referred to as algorithmic bias) is the lack of methodological guidelines for defining and empirically investigating ML bias in its full complexity. Given its prevalence in psychology, our article focuses on issues of bias in ML measurements in which ML is used to infer (i.e., assess or measure) individuals’ psychological attributes and experiences such as knowledge, skills, abilities, personality, attitudes, and emotions. Thus, our goal is to provide an integrative conceptual framework for investigating and mitigating measurement bias in ML measurements. Within this framework, we define what ML measurement bias (MLMB) is, describe how it can manifest in ML measurements, and delineate key sources of MLMB to inspire strategies for mitigating bias. In doing so, we draw connections to the existing psychological literature on measurement bias.
Our article is structured as follows: (a) We describe how ML models are typically constructed in psychology; (b) we describe measurement bias and, by extension, MLMB and how it empirically manifests in psychological assessment; and (c) we delineate the possible sources of MLMB (biases in data and algorithms) and offer possible directions for testing and mitigating these sources of MLMB. Researchers familiar with ML may wish to skip straight to the section, Defining and Examining MLMB. Our goal is to explicate overarching conceptual issues (rather than statistical issues and procedures) and address growing concerns about ML bias and fairness by developing a framework for researchers and practitioners—in psychology and beyond—to identify and address MLMB.
Fundamentals of Traditional ML for Psychological Applications
This section introduces ML and key terms typically used for ML measurement (see Table 1 for terms and definitions). Arthur Samuel (1959) coined the term machine learning, which referred to computers, or machines, learning how to achieve a specific output using the input data provided. Simply put, ML entails the learning of a computational model (a computer program) from data rather than being explicitly programmed by humans. Although ML is distinct from pattern recognition, it can be applied to learn patterns in the data (Anzai, 1992). There are two characteristics of ML. First, learning occurs because machines or computers can improve their predicted outputs over time as more data are provided. Second, learning in this context is a functional one, which means that there is traditionally less concern about explaining how learning occurs—instead, increasing the accuracy of predicted outputs is evidence of learning. Thus, ML is often thought of as advancing prediction rather than explanation in psychological science (Yarkoni & Westfall, 2017), although more recent advances also point to the importance of explanatory ML models (Gilpin et al., 2018).
Machine Learning Terminologies
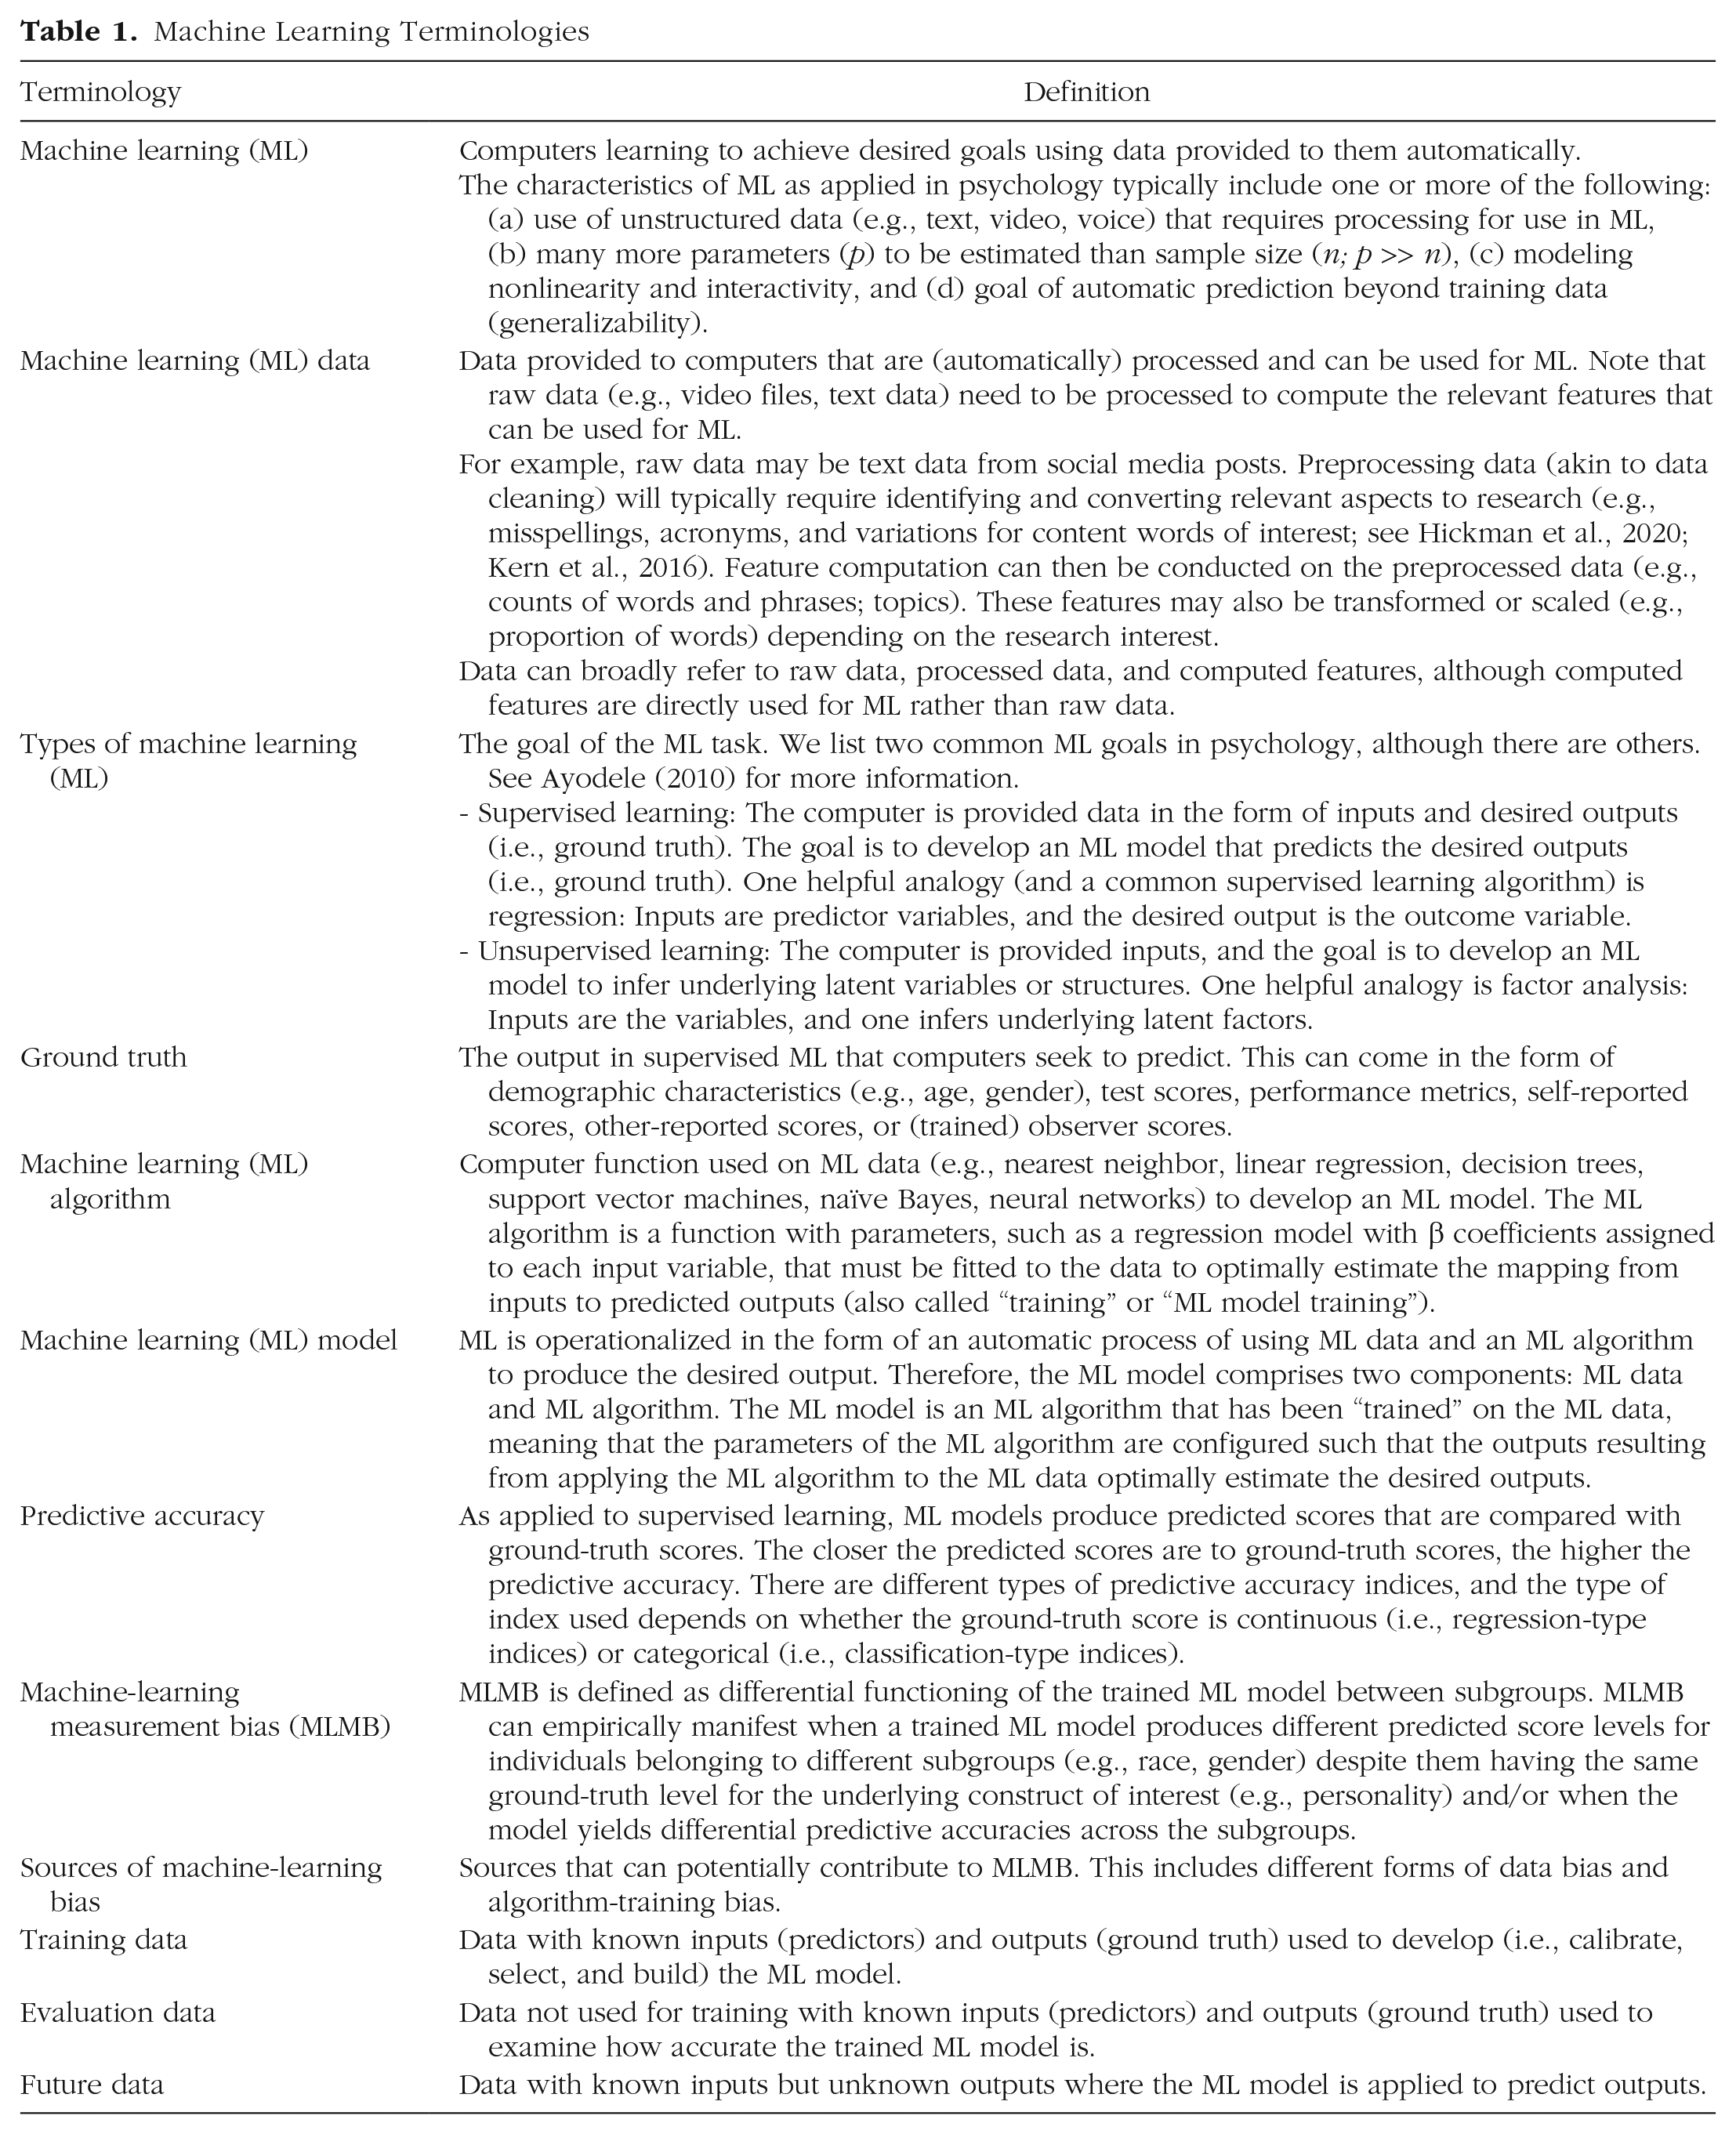
There are multiple ML approaches (see Ayodele, 2010), but for our article, we focus on what psychologists and social sciences have heavily used: supervised ML (see “Types of ML” in Table 1). In supervised ML, computers are provided examples of inputs and outputs, and algorithms are trained to develop models of the relationship between them, as illustrated in Figure 1. The goal is to automatically predict the outputs from the given inputs. Therefore, even simple logistic and linear regressions between predictor variables (i.e., inputs) and outcomes (i.e., outputs) can serve as useful ML algorithms (D’Mello et al., 2020). Often, psychologists use “ML” to refer to computers learning the relation between inputs and outputs in a single time period rather than creating a continuous learning system that improves over time (as traditionally envisioned; Samuel, 1959). When seeking to evaluate the ML model, researchers apply the trained ML model to new, previously unseen evaluation data. The ML model predicts outputs (i.e., ML predictions) that are compared with the known outputs—the higher the convergence (e.g., Pearson’s or Spearman’s rank-order correlation for continuous variables; accuracy, precision, recall, and/or F-1 scores for discrete variables) between ML predictions and known outputs, the greater the predictive accuracy.
Simplified process of machine-learning modeling.
The application of ML in psychology can be further understood in terms of the characteristics of the data it is typically used to handle. This is also presented in Table 1 in our definition of ML.
Inputs
ML is typically used in psychological research when one uses information gleaned from newer forms of data beyond surveys (e.g., text, video, voice; Woo, Tay, Jebb, et al., 2020). These newer forms of data are usually included as inputs to predict outputs—for example, using social media language (inputs) to predict personality (Park et al., 2015) or life satisfaction (outputs; Schwartz, Eichstaedt, Kern, Dziurzynski, Lucas, et al., 2013) or using video data (inputs) to predict personality (outputs; Hickman et al., 2019, 2021). Unlike typical numeric data from quantitative surveys, which are organized into rows (values) and columns (variables), these alternate forms of data (e.g., text, video, voice) are often referred to as unstructured data (however, this term is a misnomer because these data sources do have structure, e.g., pixels in an image). Nevertheless, such data typically require additional computer processing to transform them into inputs to train the ML model (Chen & Wojcik, 2016). For example, computer programs can process and transform natural language text into many quantitative features (e.g., word counts, phrase counts) for analysis (Kern et al., 2016). See the “Machine-Learning Data” portion of Table 1.
In addition, the newer forms of data are often not designed and curated for a particular research purpose but are captured as part of a technological ecosystem. These “organic data” can nevertheless be applied to assess a psychological construct or address a research question. For example, emails, text messages, or social media activity are not designed to assess personality but can contain information about personality. In this context, ML may be viewed as a sieve designed to pick out relevant information from organic data. In contrast, “designed data” (see Groves, 2011), such as surveys, interviews, and assessments, are developed with the goal of obtaining specific types of information as part of the research design, for example, the use of Likert-type personality questions to assess personality.
In addition, ML is usually employed when psychology researchers are seeking to create a model from substantially more inputs (i.e., predictors) than what is typically handled with standard statistical techniques. For example, when one uses ordinary least squares regression, one needs to have enough sample size (n) for a set of input predictors to uniquely estimate the regression parameters (p). In other words, the number of parameters (p) needs to be smaller than the sample size (n; Faraway, 2014). In ML, there are often many more parameters to be estimated than the sample size (i.e., p >> n; e.g., Joel et al., 2020; Sheetal et al., 2020). Algorithms can handle p >> n and include methods to address overfitting when there are many predictors (Putka et al., 2018). Many ML algorithms can also model nonlinear relationships between predictors and outcomes and capture multiple levels of interactivity among predictors (for an illustration, see D’Mello et al., 2018). Because of this, ML techniques can be useful with many predictors (i.e., p >> n scenario) even when using traditional surveys (vs. text, video, voice). However, we note that the highly multidimentional nature of organic data often creates a scenario in which one has many predictors. For example, analyzing social media text data in terms of counts of single words can lead to many predictors because of the wide variety of words each individual uses. Likewise, video data are inherently multimodal because they contain nonverbal, paraverbal, and verbal information.
Algorithms
ML algorithms essentially learn computational models (computer programs) from data. These models are designed for generalizability in that they aim to jointly optimize both fitting to the data (model fit) and generalizing to new data (model generalizability). The computational model can take on many forms, such as an equation, a set of rules, a table of probabilities, a decision tree, a forest of decision trees, or a neural network. For example, a simple algorithm may take the form of a linear regression equation that psychologists are familiar with:

in which i = 1, . . . n; yi denotes the output of interest, such as personality trait scores; β0 denotes the regression intercept; β p denotes the feature weights; xp denotes the features, such as social media text features, used as input predictors; and ei denotes the error term.
ML algorithms can go beyond the traditional linear modeling techniques (e.g., linear classification models) by modeling nonlinearity (e.g., random forest, support vector machines, and neural networks; for more information on ML algorithms, see the Glossary in the Appendix in the Supplemental Material available online). In other words, researchers can move beyond the assumptions of a linear relationship between inputs and output. For example, some ML algorithms can distinguish between clusters of data points arranged in the form of a target, with a bullseye (Class A) and a surrounding ring (Class B), in two-dimensional space by performing nonlinear transformations of the data (D’Mello et al., 2018). Linear classification models would fail in this case because no line separates Classes A and B. Several ML algorithms (e.g., decision trees) also inherently capture interactivity among predictors (e.g., high pitch predicts high extraversion but only when accompanied with loud speech—here, the interaction is between pitch and loudness). Although our discussions are focused on traditional ML models, we refer interested readers to the Appendix in the Supplemental Material for information about deep neural-learning models.
Outputs
Another characteristic of ML is that researchers often use ML models to automatically predict outputs in new data. With supervised ML, researchers first provide training data with inputs and outputs to “train” ML algorithms. Once the trained ML models are created, they can be used to predict outputs (i.e., outcomes) from new input data. The outputs are typically psychological constructs of interest. For example, Park et al. (2015) trained an ML algorithm on the Facebook posts (i.e., social media language as inputs) of more than 60,000 users to predict their self-reported personality (i.e., personality as output). This ML model can then be used to automatically predict personality from Facebook users’ language (i.e., inputs; Park et al., 2015). These outputs used for training and evaluating the ML models are referred to as ground truth in ML parlance. For instance, in the case of personality, ground truth typically comes from self-reports (e.g., self-reported personality) or observer scores (e.g., observer-rated personality judged from social media posts). The ground truth can also come from other sources, such as demographics (e.g., age, gender; Kosinski et al., 2013) or standardized test scores. Another term for ground truth is “labeled data.” For consistency with past work in psychology, we use the term “ground truth” (Tay et al., 2020).
In another example, which focuses on measuring health-related outputs, an ML algorithm may be trained using the occurrences and frequency of Google Searches of flu-related terms to predict flu trends within the United States (Ginsberg et al., 2009; Santillana et al., 2014). Ground truth in such a case would be localized flu statistics reported by the Centers for Disease Control and Prevention over time. Once the ML algorithm is trained, the goal is to automatically predict flu trends from recent frequencies of Google search terms related to the flu. An advantage of such an approach is that one can quickly obtain predicted flu statistics over time based on recent Google searches much faster than a manual collection of flu statistics.
Furthermore, an ML algorithm can be trained to forecast future trends using past longitudinal data (e.g., called “forecasting,” which uses time-series analysis; Jebb et al., 2015). For example, ML algorithms have been applied to predict future COVID-19 trends; these algorithms rely on COVID-19 statistics collected across the world as ground-truth inputs (Wang et al., 2020). Therefore, the inputs are past COVID-19 statistics, and the outputs are near-future COVID-19 statistics. The ground truth for evaluating the accuracy of these predicted outputs would be future, retrospectively collected COVID-19 statistics. Likewise, forecasting with ML algorithms can be applied to psychological constructs.
At this juncture, we note that ground truth does not necessarily represent objective truth, and the goal is not to engender philosophical discussions of what truth is. Researchers should view the term “ground truth” as data that are provided to ML models to predict. It has all the limitations of regular data, whether it be reliability or validity issues. To the extent that the ground truth is fallible, ML algorithms trained to predict such ground truth will provide fallible predictions (Tay et al., 2020). This is not to say that ML models should be dismissed because ground truth will never be perfect. Rather, the same types of critical evaluations applied to the typical statistical modeling of fallible outcomes in psychological research will need to be applied to ML models. For example, when using ordinary least squares regression to predict personality scores, researchers appraise how personality scores were obtained and whether they were measured in a reliable and valid manner; the same concerns apply to ML models.
Summary
In short, supervised ML is typically applied in psychology—and beyond—when one or more of the following occur: (a) use of unstructured and/or organic data, (b) having many predictors resulting in p >> n, (c) modeling nonlinearity and interactivity, and (d) a goal of automatic prediction beyond training data (i.e., generalizability). This is summarized in Figure 1. Note that just as for traditional assessments, it is helpful to recognize that ML algorithms can exhibit measurement bias when trained on fallible inputs and outputs, and the algorithms may also be inadequate for capturing the relationship between inputs and outputs across subgroups, both of which can cause MLMB.
Defining and Examining MLMB
To understand what MLMB is, we seek to first clarify that it is distinct from fairness. In the broad field of AI and ML, the term “fairness” is often used in concert with or even interchangeably with “bias” (e.g., Chouldechova & Roth, 2020). However, for clarity of communication and productive discussions moving forward, it is helpful to construe fairness as a broader concept that goes beyond measurement bias and MLMB. According to the Standards for Educational and Psychological Testing (American Psychological Association [APA] et al., 2014) and the “Principles for the Validation and Use of Personnel Selection Procedures” (2018), adopted as a policy statement of the APA, fairness is a social concept. In this vein, there are multiple meanings of fairness: (a) equal group outcomes, (b) equitable treatment of all in the measurement procedure, (c) comparable access to constructs measured in a procedure, and (d) lack of measurement bias and predictive bias. Note that it does not consider the first notion of fairness—equal group outcomes (wherein subgroups obtain the same average scores)—as relevant to measurement bias. ML-based personality assessment (or prediction) may be picking up on genuine differences between subgroups. For example, regarding personality, self-reports of extraversion, agreeableness, and neuroticism are generally higher in women than men (Weisberg et al., 2011). Nevertheless, relying on these ML models for assessment to select individuals, such as recruiting students for college or hiring employees for work, may lead to adverse impact—selecting people from one subgroup disproportionately more than another subgroup (e.g., Hutt et al., 2019). This can be regarded as unfair in terms of a lack of equal outcomes between subgroups and therefore should be scrutinized to determine whether the construct used for selection may perpetuate inequality. In other words, one should consider whether the construct used to select individuals is fair—and this is arguably independent of the assessment procedure or the trained ML models. This concept is distinct from measurement bias, which is concerned with whether assessment instruments and, by extension, trained ML models accurately reflect genuine subgroup differences or similarities or are biased because they include systematic error that magnifies or diminishes such differences or similarities.
In the following sections, we first discuss how measurement bias is defined and investigated in the psychometrics literature. Then, we extend measurement bias to ML-based assessments, and we propose how MLMB may be defined and empirically examined (for a summary, see Table 2). 1
Comparison Between Traditional Measurement Bias and Machine-Learning Measurement Bias

Note: CFA = confirmatory factor analysis; IRT = item response theory; ML = machine learning.
Measurement bias
Within the psychological-measurement literature, the context of measurement bias is evaluating potential bias in psychological measures (e.g., personality measures, skill assessments, cognitive tests). Measurement bias is distinct from sociocognitive bias, which is found in human cognitive errors in judgments or attributions (e.g., West & Kenny, 2011) or human preference for the ingroup and prejudices against outgroups (e.g., Brewer, 1979).
Psychological measures are assumed to be imperfect operationalizations or proxies of constructs (e.g., personality, social skills, emotional intelligence) that are not directly observable. Therefore, in typical measurement models, constructs (as latent variables) are visualized as circles, and assessment items (as observed variables or indicators) are visualized as boxes. Observed scores for the assessment usually rely on an aggregation of assessment items or indicators, and latent scores are typically inferred from confirmatory factor analysis (CFA; Brown, 2006) or item response theory (IRT; Drasgow & Hulin, 1990) models.
In this context, measurement bias is defined as a differential relationship between the latent score (i.e., psychological construct score) and the predicted observed score (i.e., predicted score derived from CFA or IRT), or differential functioning of the measurement tool, across subgroups (e.g., males vs. females; Drasgow, 1984). In the presence of differential functioning, the measurement model can produce different predicted (i.e., observed) score levels for individuals belonging to different subgroups despite them having the same latent (i.e., true) score level. As an example of this, Figure 2 Case 1 depicts predicted observed scores higher for Subgroup 1 compared with Subgroup 2 across all levels of the latent score. This form of measurement bias (known as noncompensatory measurement bias) can lead to different predicted score distributions between two subgroups despite equivalent latent score distributions. Specifically, Subgroup 1 has a higher mean level in the predicted score than Subgroup 2 even though there are no mean-level differences in the latent scores. 2

Measurement bias (MB) and machine-learning measurement bias (MLMB). MB and MLMB Case 1 represents a noncompensatory bias that creates different predicted subgroup distributions despite the same underlying subgroup distributions. MB and MLMB Case 2 represents a compensatory bias that creates equivalent predicted subgroup distributions even though there is measurement bias.
Another example of differential functioning is illustrated in Figure 2 Case 2, which depicts different predicted slopes between Subgroup 1 compared with Subgroup 2 in which the same latent score leads to different predicted observed scores (except for where the lines cross). This form of measurement bias (known as compensatory measurement bias) can lead to the same predicted mean-level score distributions despite the presence of measurement bias. However, the predicted score variance of Subgroup 1 is larger than Subgroup 2 despite them having the same latent score variance. 3
MLMB
One definition of measurement is the numeric scaling of individuals along a theoretical continuum (Nunnally & Bernstein, 1994). Both CFA and IRT are measurement models that formally represent this in linking the observed numeric scores to the latent variable (i.e., construct) continuum. When applied to psychological assessments, ML can be regarded as a type of measurement model: It assigns ML-predicted numerical scores to individuals, which aligns individuals along a construct continuum according to their input data. However, unlike CFA and IRT models, the construct continuum is proxied using the ground-truth score, which itself is an observed score. CFA and IRT models seek to optimize the measure’s function relating the latent score to the observed score (shown in Fig. 2). The ML models, on the other hand, seek to optimize the scoring algorithm’s function by using input data (e.g., text, videos) to predict the output ground-truth data. Therefore, although ML measurement models are analogous to CFA and IRT measurement models, they represent a fundamentally different type of measurement approach.
That said, in discussing MLMB, we focus on the relationships between the ground-truth score and the predicted ML score (illustrated in Fig. 2). This is because we are seeking to evaluate whether the predicted ML score accurately reflects genuine subgroup differences (or similarities) in the ground truth or are biased because they magnify or diminish such differences (or similarities). MLMB occurs when there is a differential relationship between the ground-truth score (i.e., the observed score produced by the assessment—or the score ML model seeks to predict) and the ML-predicted score across subgroups. In addition, the focus of MLMB is on trained ML models, in other words, ML models that have been developed for assessing individuals.
MLMB is defined as differential functioning of the trained ML model between subgroups. MLMB manifests empirically when a trained ML model produces different predicted score levels for individuals belonging to different subgroups (e.g., race, gender) despite them having the same ground-truth level for the underlying construct of interest (e.g., personality) and/or when the model yields differential predictive accuracies across subgroups.
Different subgroup predictions for equivalent ground-truth levels between subgroups
The examples shown in the right half of Figure 2 parallel what was described for traditional measurement bias except that the types of scores being modeled are different. In Case 1 in Figure 2, the ML model predicts a higher score for Subgroup 1 compared with Subgroup 2 across all levels of the ground-truth score. In other words, individuals in different subgroups who have the same observed score systematically receive different ML-predicted scores. Overall, MLMB leads to a higher predicted mean level for Subgroup 1 despite equivalent ground-truth score distributions. In Case 2 in Figure 2, the ML model differentially predicts scores for Subgroup 1 and Subgroup 2 (except for where the lines cross). Overall, MLMB leads to a larger predicted score variance in Subgroup 1 compared with Subgroup 2 despite equivalent observed score distributions.
Differential model accuracy between subgroups
Another way that MLMB can manifest is in terms of differential accuracy—or an ML model that is not equally accurate across subgroups. A visual way to think about this is that the prediction line between the ML-predicted scores and the ground-truth score for Subgroup 1 does not fit as well for Subgroup 2. Consider in Figure 2 Case 1 that the intercept is higher for Subgroup 1 than Subgroup 2 and in Figure 2 Case 2 that both the slopes and intercepts differ between Subgroup 1 and Subgroup 2. Traditional procedures for testing measurement bias typically rely on CFA or IRT model-fit statistics to evaluate whether the measurement models function similarly well for each subgroup (Cheung & Rensvold, 2002; Tay et al., 2015). For example, one can examine whether model-data fit improves substantially when separate models are specified across two subgroups compared with a common model, which would indicate that the measurement models are fundamentally different and, hence, that measurement bias exists.
Within ML, the notion of model functioning, or model-data fit, is tied to predictive accuracy: Are the ML model outputs equally accurate between subgroups (i.e., are the differences in the levels of convergence between predicted scores and ground-truth scores similar between subgroups)? As discussed previously and shown in Figure 1, ML algorithms are trained with inputs and outputs (i.e., ground truth), and ML predictive accuracy is evaluated in terms of how well predicted outputs match the ground truth. There are multiple metrics for evaluating the predictive accuracy of categorical outcomes (e.g., accuracy, precision, recall, F1, area under the receiver operating characteristic curve; Kobayashi et al., 2018) and continuous outcomes (e.g., correlation, R2, mean squared error; Putka et al., 2018), and any of these could be used to evaluate differential accuracy between subgroups of interest. One can use a variety of metrics to evaluate whether ML predictive accuracies differ between subgroups—which would be evidence of MLMB. This is represented in Figure 1 when the ML model is operationally evaluated between two subgroups.
Empirical investigations of MLMB
Translating the conceptual meaning of MLMB to its empirical manifestation requires careful consideration of the level of analysis and a recognition of the strengths and weaknesses of various methodological approaches. Regarding different subgroup predictions for equivalent ground-truth level, one can examine whether MLMB occurs at a specific range of ground-truth scores or on the overall distribution (i.e., means, variances, skewness). Regarding differential model accuracy between subgroups, one can examine whether MLMB occurs at the predictive accuracy level; one can also explicitly create a (regression) model to examine whether the relationship between ground-truth scores and ML-predicted scores significantly differs between subgroups. We briefly describe each of the four strategies below.
Ground-truth score level
To assess MLMB, one can sample individuals from different subgroups with the same ground-truth score levels and score them using the trained ML model. If the trained ML model produces different predicted subgroup scores, MLMB exists. With this approach, it is important to assess multiple ground-truth levels because certain levels may not reveal different subgroup predicted scores (e.g., Fig. 2 Case 2, in which the subgroup lines cross). A limitation of this approach is that one needs sufficient sample sizes at each ground-truth level between subgroups. Practically, this method would often entail binning individuals into different ground-truth score levels; categorizing a continuous ground-truth variable may not be statistically ideal.
Ground-truth distribution level
Another way to assess MLMB is by obtaining subgroup samples with the same ground-truth distributional properties (e.g., mean and variance). Conceptually, if there is no MLMB, the trained ML model should produce equivalent predicted score distributions between subgroups (e.g., mean and variance). An advantage of this approach (as opposed to the first approach described above) is that one can infer whether the effects of MLMB translate to overall measurement bias across subgroups. For example, how might MLMB affect the mean-level inference between subgroups? At the same time, one challenge with this approach is that obtaining sufficient subgroup samples with the same ground-truth distributions can be difficult because one has to recruit matched samples (i.e., matched-group designs) or create statistically matched samples from a larger sample. Another issue is that matching may reduce the representativeness of the samples. 4 Furthermore, at this point, it is not known how well these different operational procedures can create truly equivalent ground-truth distributions.
At the ground-truth distribution level, an alternative to matching subgroup samples on their ground-truth distributions is to examine whether the ML-predicted scores accurately reflect the raw unmatched observed ground-truth subgroup distributions. MLMB occurs to the extent that the ML predictions systematically enlarge or reduce the extant subgroup ground-truth distributional differences (e.g., ML-predicted scores exhibit larger subgroup mean differences than ground-truth scores). An advantage of this approach is that it does not require matching subgroup samples on ground-truth distributions. A potential downside is that differences in ML predictions cannot be straightforwardly interpreted as evidence of MLMB but needs to be compared with extant ground-truth distributional differences.
A general limitation of assessing MLMB at the distributional level is that the subgroup ground-truth differences may be accurately recovered in terms of the ML-predicted scores despite the presence of MLMB. For example, ML-predicted scores show no subgroup mean-level differences in Figure 2 Case 2 because of the compensatory nature of MLMB across the ground-truth continuum. In other words, detecting subgroup distributional differences in ML-predicted scores when none is expected based on equivalent subgroup ground-truth distributions would indicate MLMB; but detecting no subgroup distributional differences in ML-predicted scores are insufficient for stating that there is no MLMB.
Predictive accuracy
In terms of model functioning, one can assess MLMB by examining whether the ML model is equally accurate across subgroups. Researchers can use one or more predictive accuracy metrics and compare subgroups. An advantage of this approach is that it does not require equivalent subgroup ground-truth distributions. That said, we need to be aware that subgroup differences in ground-truth distributions can affect the magnitude of these predictive accuracy metrics. For example, range restriction (a methodological artifact) on a subgroup’s ground-truth distribution can attenuate correlation estimates (see Sackett & Yang, 2000). More research is needed to understand how different predictive accuracy estimates can be affected by different subgroup sample sizes and distributions and ways to correct them.
Modeling ground-truth scores and ML-predicted scores
Differential model functioning can also be examined by applying a (regression) model between the ground-truth scores and ML-predicted scores to determine whether the models between subgroups are significantly different, for example, applying a regression model to determine whether a common regression line fits both groups equally well or there needs to be two separate regression lines (as shown in Fig. 2). Moderated multiple regression is typically conducted in assessing predictive bias 5 of psychological assessment (i.e., is there a differential relationship between psychological assessment scores and a criterion of interest such as cognitive ability test and academic performance; Bonaccio et al., 2012). Similar to the predictive-accuracy approach, this approach does not require equivalent subgroup ground-truth distributions. However, we also note that methodological artifacts (e.g., subgroup sample sizes, range restriction, subgroup means) can alter the statistical inferences (Aguinis et al., 2016; Aguinis & Stone-Romero, 1997).
Additional remarks
The next section illustrates the possible sources of MLMB and corresponding mitigation strategies. The goal is to help researchers concretely understand the possible causes of MLMB and how to identify them empirically. Although MLMB can empirically manifest in multiple ways, we have chosen to focus our discussion on a scenario in which there is ground-truth distributional equivalence (e.g., equivalent mean levels and variances) between subgroups of interest. In the presence of equivalent ground-truth distributions across subgroups, MLMB can be manifested (thus empirically tested) in two ways. First is different subgroup predictions for equivalent ground-truth level. When comparing ML-predicted scores between subgroups with the same ground-truth mean levels, any mean difference that emerges would indicate MLMB. In other words, MLMB is manifested in subgroup mean-level differences. Second is differential model functioning between subgroups. When comparing differences in model functioning, simplifying it to the case in which there is ground-truth distributional equivalence could reduce the possible methodological confounds when assessing predictive accuracy. For example, if both subgroups have similar ground-truth score variances, it is unlikely that differences in predictive accuracy are a result of a difference in their variance—where smaller variances can lead to smaller correlations because of range restriction (Sackett & Yang, 2000). In this case, MLMB is manifested in differential predictive accuracies between subgroups.
This approach and operationalization are straightforward and illustrate the potential sources of MLMB and mitigation strategies. Note that we do not claim that this is the only or best approach; it is simply one of many approaches, which we chose for simplicity in presentation and for reducing possible confounds.
Identifying MLMB Sources and Mitigating MLMB in Psychological Assessment
Beyond defining and operationalizing MLMB to identify its presence, it is important to understand why it occurs: What are the potential sources of measurement bias in ML models? By identifying the possible sources of MLMB, one can determine possible ways to mitigate bias. In this section, we elaborate on both the potential sources of MLMB and possible mitigation strategies. First, we expand the Brunswik (1956) lens model, which is typically used by psychologists to understand the workings of interpersonal perception (Hall et al., 2013; Hinds & Joinson, 2019) and also used in social signal processing (Mehu & Scherer, 2012). Then, we contextualize the sources of MLMB—and present potential tests and mitigation strategies—through this framework.
Expanding the Brunswik lens model for ML models
We use the example of ML for personality prediction as a foundation for understanding sources of MLMB in psychological assessment. A growing number of ML applications involve personality prediction (e.g., Azucar et al., 2018; Gladstone et al., 2019; Hickman et al., 2021; Tay et al., 2020). This schematic is applicable to other psychological constructs of interest, including emotions (De Choudhury, Counts, & Horvitz, 2013), values (Kern et al., 2019), and well-being (Schwartz, Eichstaedt, Kern, Dziurzynski, Lucas, et al., 2013).
ML approaches have implicitly or explicitly invoked the Brunswik (1956) lens model for connecting behavioral observations to the underlying psychological construct—in this example, personality (Hall et al., 2013; Hinds & Joinson, 2019). Fundamentally, the Brunswik lens model posits that individual differences manifest in behavioral cues (e.g., written text, voice, location, nonverbals) that are used by observers to infer the latent trait. This is represented by treating ML models as “observers” of the trait via behavioral cues, as shown in Figure 3. Although this representation is useful, delineating and identifying the sources of MLMB require expanding the model by including additional aspects of supervised ML algorithms.

The Brunswik lens model: linking machine-learning model to behavioral cues.
First, the construct measured by the input data (e.g., video data, social media data) used to train the ML model is often circumscribed and contextualized—by virtue of the method used to capture the data—compared with the broader construct of interest. This is because the platform or procedures used to measure behavior and assess the construct via ML constrain the psychological phenomenon to a specific domain or context (Tay et al., 2020). By way of analogy, self-report personality scales have been developed both to assess one’s typical, in-general personality and to assess one’s workplace personality (Shaffer & Postlethwaite, 2012). Likewise, using social media data to assess personality emphasizes online personality (vs. offline personality; Marriott & Buchanan, 2014) and using video interviews in the context of a high-stakes selection are likely to engender self-presentation that colors personality (Paulhus et al., 2013). Thus, we depict the contextualized, platform-based personality construct as overlapping with but partially distinct from the broader personality construct in Figure 4.

Expanding the Brunswik lens model to identify the sources of machine-learning measurement bias: an illustration using personality as the focal construct. Areas highlighted in blue represent possible sources of machine-learning measurement bias; “platform-based personality”: the personality construct measured by input data (e.g., online personality assessed by social media data) used in machine-learning models to predict self-report personality.
Second, the ground truth used to assess the personality construct may not match the platform-based personality construct. In our example, self-reported personality may reflect offline personality rather than online personality. Practically, personality measures contextualized to the situation of interest exhibit stronger relationships with situation-specific behavior than noncontextualized measures of personality (Shaffer & Postlethwaite, 2012). In other cases, other reports of personality (e.g., from roommates, colleagues, family) in everyday life may be used as ground truth, and these ratings would similarly not match the platform-based personality construct. Platform-based personality may be directly assessed (and used as ground truth instead) via domain-specific personality measures (e.g., self-report of social media personality) or observer ratings of personality based on platform activity (e.g., by trained raters of social media profiles). We note that there may be theoretical disagreement on whether there is actually a platform-based personality construct. Although it could be empirically examined (e.g., assessing similarities between general self-report personality and platform-based personality) for each context, the more important point is that researchers need to be mindful of whether the construct at hand generalizes to the platform from which the data are derived.
Third, the use of behavioral cues (e.g., verbal, paraverbal, and nonverbal behaviors) by ML models is mediated by features that are computed and processed from behavioral data. For example, verbal behavior on social media can be converted to features in multiple ways (Hickman et al., 2020), including by counting words in a priori dictionaries (e.g., as in linguistic inquiry and word count; Pennebaker et al., 2015), counting the occurrence of words, and counting the occurrence of two- and three-word phrases (see Kern et al., 2016). In automated interviews, computers extract a discrete set of nonverbal behaviors such as facial-action units (Ekman & Friesen, 1978), which can be scored based on their activation, the intensity of their activation, and/or the co-occurrence of their activation with the activation of other facial-action units (Bosch & D’Mello, 2019). Therefore, behaviors may map onto one or more features, as illustrated in Figure 4.
Finally, although ML models are generally depicted as observers of behavioral cues and even represented as such (e.g., Hinds & Joinson, 2019), the algorithms used to develop ML models use these behavioral cues to maximize the prediction of a fallible ground-truth measure. In other words, supervised ML algorithms do not directly recognize personality from behavioral cues. Instead, they are trained to use, weight, combine, and transform behavioral cues—as operationalized in computed features—to maximize the prediction of ground-truth scores. We depict this in Figure 4 as an arrow linking the ML model to ground-truth scores.
Identifying and mitigating potential sources of MLMB
Using the expanded Brunswik lens model in Figure 4, we can now elaborate on the potential sources of MLMB. What might cause ML models to produce different subgroup score predictions despite equivalent ground-truth levels? What are the reasons ML models function differently between subgroups? These potential sources of measurement bias may occur during ML model training and need to be unpacked to determine what might be causing MLMB.
As presented earlier, it is helpful to recognize that ML models (as seen in Table 1) have two components: ML data and ML algorithms. Correspondingly, there are two broad potential sources of MLMB during the ML model creation: data bias and algorithm-training bias. We define data bias as nonequivalence in the trait-relevant information content of ML data (i.e., ground truth, platform-based construct, behavioral expression, and feature computing) between subgroups. We define algorithm-training bias as algorithms developed with nonequivalence in the relation between extracted features and ground truth (i.e., algorithm features are differentially used, weighted, or transformed between subgroups).
Note that we view these potential sources of MLMB as underlying measurement biases themselves. In other words, biases in data and algorithm training lead to differential ML model functioning. Identifying and understanding the potential sources of MLMB—and the underlying biases—is necessary for mitigating MLMB. In Table 3 and the following, we examine potential sources of MLMB, discuss how these may manifest (i.e., leading to differences in predicted means or to differential predictive accuracies), and, hence, suggest ways to test for each potential source of MLMB and possible directions for mitigating these sources of bias.
Summary of Potential Sources of Machine-Learning Bias: Identification, Testing, and Mitigation Strategy

Note: ML = machine learning.
Data Bias Source 1: ground truth in training data
A potential source of data bias is in the ground-truth scores used during ML model training. As shown in Figure 4, the ground truth typically uses observed data as a proxy for the latent trait. In other words, researchers use a traditional personality scale score, such as the mini-IPIP (Donnellan et al., 2006), as ground truth to train ML models. From a psychological measurement perspective, we recognize that these measures are imperfect assessments of the latent trait. 6 Therefore, this source of bias occurs when the measure exhibits traditional measurement bias—or when it provides different scores to individuals belonging to different subgroups (e.g., gender, race) with the same latent trait scores. This potential source of bias can also occur when the measure provides different interval scores to individuals belonging to different subgroups even when the latent trait intervals are equivalent. In other words, an increase in one unit on the scale has different meanings between subgroups. This is well established in the measurement literature as measurement bias (Drasgow, 1984). The former type of bias (differences in predicted mean levels) is analogous to intercept differences (between the latent trait and the observed score). In contrast, the latter type of bias (differences in predictive accuracies) is analogous to slope differences (between the latent trait and the observed score, as illustrated in Fig. 2; Vandenberg & Lance, 2000).
In short, this source of bias occurs when the ground-truth measure exhibits traditional measurement bias. Given the same standing on the latent personality trait, individuals may have different scores because of their subgroup membership. For example, men and women may use personality scales differently—even though men have the same latent conscientiousness score levels as women, they score higher on measured conscientiousness because the scale content asks about behaviors more frequently enacted and endorsed by men.
One way to test for ground-truth equivalence is to conduct measurement-bias tests on the personality instruments used as ground truth (Tay et al., 2015; Vandenberg & Lance, 2000). When there is a measurement bias, mitigation strategies include using measurement models that are partially equivalent or excluding scale items that do not display measurement equivalence (Byrne & van de Vijver, 2010). If it is not possible to test for measurement bias, one can rely on past research and use personality scales that are known to be free from measurement bias across subgroups of interest. For example, past research has found gender measurement equivalence on the Mini-IPIP and the Big Five Inventory (Ock et al., 2020).
Beyond measurement bias in self-report instruments, bias can also occur in ground truth when one uses observer reports. This can occur either because of traditional measurement bias, as described above for self-report instruments, or because of sociocognitive biases that occur among observers and cause them to provide scores that favor one subgroup compared with another (differences in predicted mean levels) despite the subgroups having the same trait distribution. It can also manifest in observers providing different interval scores to individuals belonging to different subgroups even when the latent trait intervals are equivalent (i.e., differences in predictive accuracies). To mitigate possible sociocognitive biases, standardization (e.g., rater training, ensuring the same rating procedures, using similar frames of reference) and aggregation across multiple diverse raters should be considered (e.g., Aguinis et al., 2009; Bing et al., 2004).
Another possible reason for bias is that the ML model was not trained on an equivalent ground-truth distribution between subgroups. One way of thinking about this is in terms of the representation of subgroups on which the ML model is trained. For example, if the ML model is trained only on White individuals, likely the predictive accuracies will not generalize to other races, which results in differences in predictive accuracies (i.e., MLMB). However, this is an empirical question that will need to be examined for each ML model because it may be the case that the ML model works equally well for different subgroups even when there is little to no representation for one or more groups in the original training data. However, if MLMB is found, one possible reason may be a lack of representation for one or more subgroups in the data used to train the ML model in the first place.
Beyond subgroup representation in the ML training sample, subgroups may not have similar ground-truth distributions in the training data even when there is no measurement bias in the scale used. For example, it may be the case that MLMB occurs because even when men and women are equally represented in the sample used to train the ML model, the sample of men has a higher level of conscientiousness compared with the sample of women. This can result in the ML model inadvertently using gender (and gender-related features) as a proxy for the latent trait and providing higher scores to men on conscientiousness compared with women (differences in predicted mean levels) even when evaluated with subgroup-representative samples (e.g., Barocas & Selbst, 2016). Likewise, this can potentially occur when despite equivalent ground-truth means, the ground-truth variance is larger in men compared with women. This may result in the ML model inadvertently using more outcome-behavior relationships among men to predict conscientiousness compared with women, which results in lower predictive accuracy among women compared with men (differences in predictive accuracies). To mitigate this, researchers can not only seek to use the same numbers of individuals for subgroups of interest (i.e., subgroup representation) but also to match subgroups of interest on ground-truth distributions during ML training. 7
Ground-truth matching to probe sources of MLMB
One operational approach presented here is to have equivalent ground-truth distributions (e.g., mean, variance, skewness) in the training sample to ensure that the effects of specific sources of bias are isolated. For example, under the condition that ground-truth personality scores are matched for White and Black individuals, observing behavioral differences between these groups on social media platforms can reveal a different source of bias (i.e., lack of behavioral expression equivalence). Therefore, for the purposes of testing other possible sources of bias, we present the case in which subgroup samples are matched on the desired outputs (i.e., ground-truth variable)—such as personality traits—as shown in Figure 1.
From Figure 4, we note that there are cascading effects of bias in the case of ML-based psychological measurement: ground → truth platform-based construct → behavioral expression → feature computing → feature use → prediction utility. In this approach, to detect a potential source of MLMB at each stage, it is helpful to have ground-truth distributions matched and also to show that a potential source of MLMB has been resolved in the prior stages. For example, one can assess that there is no bias in the ground truth before assessing potential bias in the next stage of platform-based construct. If there is bias in the ground truth, one can seek to mitigate it and then assess potential bias in the next stage of platform-based construct. The accuracy of detecting potential bias at a specific stage would likely depend on the successful resolution of prior stages. This is summarized in Table 3 and discussed in the following.
Data Bias Source 2: platform-based construct
Even with the same average levels of ground-truth personality (as assessed by general personality scales), platform-based personality may still have different average levels because it fundamentally depends on how subgroups use the platform. For example, the phenomenon of Black Twitter, on which Black Americans “perform their identities through displays of cultural competence and knowledge” (Florini, 2013, p. 223; e.g., using the Twitter platform as a social critique based on the shared identities of Black Americans) suggests that there is a greater level of display of Black identity on Twitter compared with White identity. This may result in differential levels of, say, platform-based extraversion between Black and White individuals even though ground-truth levels of self-reported extraversion (in general contexts) are similar. Furthermore, there may be subgroup differences in the extent to which the ground-truth personality construct is related to the platform-based personality construct. For example, the use of self-reported personality scores reflective of the ground-truth construct may be differentially related to LinkedIn work personality between younger and older individuals. Compared with other major social media platforms, LinkedIn is used more by older working adults (Pew Research Center, 2018). Younger individuals may not have a career-based identity (and work-related personality) as firmly developed compared with older working individuals (Kim & Kang, 2017). This can result in differences in the relation between the ground-truth construct (i.e., self-reported personality) and the platform-based personality construct (i.e., LinkedIn work personality) for different age groups.
At the mean level, one way to assess platform-based bias is to examine whether there are mean-level differences for subgroups on platform-based personality scores even when ground-truth scores distributions are kept equal. In other words, are there differences between subgroups on platform-based personality scores? At the predictive accuracy level, one can assess the relationship between scores on the ground-truth personality construct and the platform-based personality construct for the subgroups of interest. Basically, we are examining whether there are predictive differences between subgroups on ground-truth personality scores and platform-based personality scores. A lack of difference between subgroups may be indicative of equivalence. In both cases, to test whether bias is present, it would require creating a way to assess platform-based personality, which could be achieved by having individuals self-report their platform-based personality or having observers judge individuals’ personalities on the platform.
A proposed mitigation strategy is to reduce the discrepancy between the ground-truth personality construct and the platform-based personality construct. The latter can be obtained by using personality measures contextualized for the platform (e.g., social media, interview) or having observers rate personality as expressed on the platform itself (e.g., rating personality from social media posts or profiles; Back et al., 2010). In other words, although general personality and platform-based personality constructs are distinct entities, one can ensure that ML models are trained on ground-truth scores that are closer to platform-based personality constructs. One direct possibility is to rely on only platform-based personality construct scores as the ground truth to remove this possible bias. Doing so removes the inferential gap (which contributes to possible bias) between platform-based personality (e.g., online personality) and the ground-truth personality measure. However, the same concerns in the Data Bias 1: Ground Truth section apply to platform-based personality scores (now used as ground truth). Note that this may not be a good mitigation strategy if the goal of the ML model is to predict self-report personality as assessed by general personality scales.
Data Bias Source 3: behavioral expression
For the same level of the platform-based personality construct, behaviors may not manifest similarly across subgroups. There may be subgroup differences in the quantity and type of behavioral expressions for the same level of a construct. For instance, women are more emotionally expressive than men (despite similar levels of reported emotions; Kring & Gordon, 1998), and groups differ in their use of language and slang to express similar ideas (Schwartz, Eichstaedt, Kern, Dziurzynski, Lucas, et al., 2013). Furthermore, behaviors related to platform-based personality may differ across subgroups. For example, there may be a stronger association between platform-based extraversion and verbal behaviors on Twitter for Black individuals, compared with White individuals, if they view it primarily as an outlet for identity expression (Florini, 2013).
If one assumes that the ground-truth personality distribution is the same between subgroups and there is no platform-based construct bias, one way of assessing bias in behavioral expression equivalence is to examine whether there are differences in the mean levels of behavioral expressions. Because it is important not to confound computer-extracted features with behavioral expressions, the focus should be on using human raters to examine base rates of behaviors (realistically, this can be done only for a small subset of behaviors because humans may not be able to judge large numbers of behaviors reliably). For example, past reviews found that in the interview context, in which ML is increasingly applied (Hickman et al., 2019), females smile and nod more than males (Frauendorfer & Mast, 2015). Significant differences when ground-truth distributions are matched would suggest behavioral expression bias. Bias can also be manifested at the level of predictive differences: Platform-based personality scores correlate differently with behaviors between subgroups. For example, online honesty-humility levels may be differentially related to politeness behaviors on social media between Chinese people compared with Americans because of differences in how politeness is expressed (Li et al., 2020). If bias is detected, one mitigation strategy could be to exclude specific behaviors—or a set of behaviors (e.g., nonverbal behaviors)—that are shown to be biased. 8
Data Bias Source 4: feature computing
Expressed behaviors do not necessarily correspond one-to-one to the ML features that are processed and extracted from those behaviors. Even with equivalent behavioral expressions, processing and extracting features may not lead to equivalent levels of features between subgroups. This is because the feature computing and conversion procedures may not apply similarly across groups. For example, the use of slang and dialects may differ across groups on social media (Florini, 2013), and not all text-mining processes are equally sensitive to such idiosyncrasies. Another barrier to achieving group parity in features is that subgroup differences in terms of access to reliable or quality technology (e.g., microphone, video camera, Internet speed) can lead to missing data and differences in the features extracted (cf. Kayhan et al., 2018). For instance, in video data, individuals who have a slow Internet connection (e.g., video lags) may have more unreliable feature computations encoded compared with others who enact the same behaviors but have a fast Internet connection. These same issues can also affect the relation between behavioral units and features that lead to bias across subgroups.
In some cases, the feature computation step itself relies on prior ML models, which themselves may be biased. For example, facial-action units (e.g., a smile or an eye blink) are widely used as predictors in a range of ML applications (Bartlett et al., 2014; Bosch & D’Mello, 2019). Extracting these features from images entails the use of ML models, such as OpenFace (Baltru et al., 2016), which could itself be biased and thereby propagate bias. Bias propagation can stack up rapidly. Consider an ML pipeline in which speech is transcribed using a pretrained speech recognizer (which is an ML model) and then submitted to another pretrained ML model to compute sentiment scores (e.g., positive tone; Zhang et al., 2018), which are subsequently used as features for training an ML model to predict personality. It is widely known that automatic speech-recognition algorithms are less precise for dialects relative to the majority group speech, or what is considered codified “standard” speech (Vergyri et al., 2010), which results in one source of bias, which is then compounded when submitted to the sentiment ML model and, ultimately, to the personality models. Feature computing bias may also occur in the absence of ML models in the processing pipeline. For example, assume that pretrained dictionaries, such as the linguistic inquiry and word count program (Pennebaker et al., 2001) or the Affective Norms for English Words (ANEW; Bradley & Lang, 1999), are used to measure sentiment in lieu of an ML model. Because these dictionary-based approaches rely on normative ratings for development or validation, any potential bias in the raters (ANEW raters were undergraduates in an introductory psychology course at one university so are not a representative sample) would propagate into the sentiment scores and then to the subsequent ML models that use the sentiment scores as features.
At the mean level, feature computing bias can manifest in significant feature differences even with the same level of behaviors being expressed between subgroups, assuming a lack of bias in the earlier stages (i.e., ground-truth distribution; lack of platform-based construct bias). At the predictive accuracy level, feature computing bias can occur when there are different levels of association between behaviors and computed features between subgroups of interest. One possible way to assess this is by coding key behaviors using observers (e.g., smiles, pauses in speech) and then correlating it with features that were derived from the behaviors. If differences between subgroups are found, a mitigation strategy could be to exclude features that show bias.
Algorithm Training Bias Source 1: differential feature use
Even when there is no data bias, there can still be MLMB attributable to the ML algorithm training such that different features (among all features included in the input data) are used to predict desired outputs across subgroups. This may arise because of human subjective decisions or errors that could introduce bias in the trained algorithms. In psychological assessment, this is akin to the choice of using different measurement models for subgroups (e.g., the scoring for Subgroup A uses different scale items than Subgroup B), which would be regarded as bias in psychological assessment (Vandenberg & Lance, 2000). For example, consider a simple case in which different ML algorithms were developed for each subgroup; these different ML algorithms may use different combinations of features to predict the desired outputs across subgroups. Extending the example of Equation 1, one uses different input predictors (e.g., different social media text features) between subgroups in which Subgroup 1 may use x1 and x2 as predictors, whereas Subgroup 2 may use x3 and x4.
One way of examining differential feature use is to see whether a different list of features is being applied for different subgroups. For example, consider the use of two different ML models for different subgroups such that one subgroup uses only verbal features for predicting personality, whereas another subgroup uses only facial features for predicting personality. The idea is to examine whether different subsets of features are used for each subgroup, which leads to the question of whether the algorithms trained are equivalent between subgroups. For interested readers, this is analogous to a lack of configural invariance within the measurement-bias literature (Vandenberg & Lance, 2000). The mitigation strategy is to train an algorithm such that there is a common set of features being used and combined between subgroups.
Algorithm Training Bias Source 2: differential feature weighting and transformations
Even when training an ML algorithm between subgroups such that the same set of features is used and combined, bias can occur because researchers allow the trained algorithm to weight features differently between subgroups. Within psychological assessment, using different measurement models that weight scale items differently for subgroups (i.e., while using the same scale items, the scoring of Subgroup A weights scale items differently from Subgroup B) is another form of bias (Vandenberg & Lance, 2000). Extending the example of Equation 1, one may be using different subgroup intercepts (β0) and/or feature weights (β1, β2, . . . βp) such that Subgroup 1 has different intercepts and/or feature weights from Subgroup 2. The mitigation strategy would be to ensure that the trained algorithms are not providing different feature weights to different subgroups.
In addition, it is also possible for researchers to apply different types of transformations to features (e.g., log transformation, normalization) that are subgroup-specific, or the same type of transformation but with a different mathematical function between subgroups. For example, when researchers normalize features for men and women separately before model training, if the training data for men and women have different means and variances on the features, the transformations are mathematically different between gender subgroups (Booth et al., 2021). Different subgroup transformations are regarded as a type of algorithm-training bias within the MLMB framework.
When different sets of features are used or when they are weighted or transformed differently between subgroups, this could result in differences in predicted mean levels or differences in predictive accuracy between subgroups despite them having the same ground-truth distributions. However, we note that even if there are no resultant consequential differences (e.g., differences on predicted mean levels and/or predictive accuracies), from the perspective of psychological assessment, the trained algorithm—from a traditional psychometric perspective—is regarded as measurement biased because it is using different yardsticks (i.e., different ML models) for assessing different subgroups.
Despite this, we note that it is not uncommon to apply different ML models to different subgroups to maximize predictive accuracy for each subgroup, and there is a tension between maximizing predictive accuracy and MLMB. Another related tension is whether one is concerned primarily about the consequential differences (i.e., to what extent the ML algorithm distorts ground-truth subgroup differences in its predictions) compared with the equivalence of ML models between subgroups. For example, researchers may create different ML models to mitigate the consequential differences of biased data. These key issues are elaborated on in our Discussion section.
Assessing data biases through differential use and weighting in ML algorithms
Because the identification and mitigation approaches for data bias are likely not perfect, it is possible that biased data (e.g., biased features) are still included in the training of the ML algorithm. For example, some features may be inherently biased against women because the computed features are based on prior ML models that did not use representative data for women; these features may have “slipped through the cracks” even with the proposed mitigation strategies and were still included in ML training. Therefore, during the ML training process, one may find that certain features are not equally predictive between subgroups. For example, computed features for nonverbal behaviors may be less accurate for Black individuals than White individuals because of biased feature computations; in turn, features for nonverbal behavior will likely be less predictive for Black individuals than White individuals.
Thus, it is also possible to use ML algorithms to evaluate for specific biases in the data. One can apply the same ML algorithm for different subgroups and use a feature ablation approach (i.e., exclude specific features or sets of features in the ML algorithm; e.g., Girshick et al., 2014) to examine its impact on ML-predicted scores. Feature ablation approaches identify potentially biased features when excluding specific features in the model reduces the discrepancy between subgroup-predicted mean levels or subgroup-predictive accuracies. In other words, these features may be biased because they lead to increased discrepancies between subgroups, whereas excluding them reduces these discrepancies.
Discussion
This article provides an integrative framework for understanding what MLMB is, how it manifests, where it might originate, and what can be done to mitigate it. Although we focus on delineating specific elements of MLMB investigations and associated mitigation strategies in the context of ML-based psychological assessments, many of these concepts apply to other types of ML applications. In this section, we first describe how our current framework goes beyond current bias frameworks within the computer-science literature. Next, we discuss how our proposed framework brings greater clarity to the complex issues surrounding MLMB, which highlights several important tensions: maximizing predictive accuracy compared with minimizing MLMB, the equivalence of ML algorithms compared with consequential equivalence, and sample representativeness compared with matched samples. Finally, we offer some practical guidelines for using this framework to evaluate MLMB.
Comparison with frameworks in computer science
Our MLMB framework has some distinctions from and similarities with current frameworks of evaluating MLMB (sometimes termed “fairness” in the computer-science literature; Gajane & Pechenizkiy, 2018). Regarding distinctions, one method for evaluating bias (“individual fairness”; Dwork et al., 2012) is one in which models are considered unbiased when they produce similar predictions for similar individuals. Note that the similarity of individuals is based on the similarity of individuals in their input ML data regardless of subgroup membership. By contrast, the MLMB framework explicitly evaluates measurement bias based directly on known subgroup membership (e.g., age, sex, race, religion) as typically assessed in psychology. Whether ML is biased against a known subgroup is also one of the chief concerns rooted in antidiscrimination laws (e.g., Civil Rights Act of 1964; race, color, religion, sex, national origin) that is addressed through this framework.
Another approach (i.e., fairness through unawareness) emphasizes the exclusion of any protected variables (e.g., race, gender, ethnicity, nationality) within the models so that they are “blinded” to possible differences (Gajane & Pechenizkiy, 2018). This is potentially problematic given that researchers may be unaware of potential biases in all the types of data included in the first place and that input data included in the model could serve as close proxies of these protected variables (Barocas & Selbst, 2016). Instead, the MLMB framework enables researchers to explicitly examine and test for possible sources of data and algorithm-training bias.
Regarding similarities, MLMB has conceptual similarity to evaluating the generalizability of ML models to different sociodemographic subgroups; the goal is to understand whether ML models applied to one sociodemographic group produce similarly accurate predictions to another group (Hutt et al., 2019). When there is no MLMB, we expect that it will be conceptually analogous to “counterfactual fairness” (Kusner et al., 2017), in which the ML models should yield similar predicted scores when individuals are treated as their counterpart (e.g., counterfactually treating males as females should not affect the scores). The MLMB framework specifically notes that this should be the case in which the same ground-truth score should yield the same predicted ML score regardless of group membership (i.e., counterfactually treating individuals as members of other groups).
Note that the focus of these prior mentioned frameworks emphasizes how models should be designed and tested for bias and less on the potential sources of MLMB. Furthermore, when some sources of MLMB are mentioned, they are not systematically developed within a holistic methodological framework (e.g., developed instead within a legal framework; Barocas & Selbst, 2016; Kleinberg et al., 2018). The MLMB framework goes beyond subgroup differences in outputs and predictive accuracies to explicate the possible underlying sources that can cause a lack of equivalence in ML model functioning between subgroups.
Maximizing predictive accuracy compared with addressing MLMB
The proposed mitigation strategies for addressing MLMB might reduce the predictive accuracies for one subgroup to reach equivalence to another subgroup (Barocas & Selbst, 2016). For example, a mitigation strategy that removes features that are more predictive for one subgroup compared with another to achieve predictive equivalence may reduce the predictive accuracy for subgroups to the lowest common denominator (i.e., the subgroup with the lowest predictive accuracy). This creates a tension between maximizing predictive accuracy and ensuring that the ML model is equivalently predictive between subgroups (i.e., no MLMB). This is analogous to the trade-off between equity (i.e., ML fairness; lack of MLMB) and efficiency (i.e., ML performance) discussed in economics and ethics (Le Grand, 1990).
Although we do not have a solution to this tension, we believe that it is important to highlight this issue to advance future methodological and conceptual work. Methodologically, we note that the stepwise mitigation strategies are meant not only as practical procedures but also as illustrative tools to showcase how sources of MLMB can be identified and addressed. We are not beholden to these approaches and believe that future work will need to move away from stepwise strategies to simultaneous estimations that optimize multiple tasks (Dwork et al., 2012)—for example, enhancing predictive accuracy for all subgroups while also reducing predictive accuracy differences among them. More research is now implementing multiobjective optimization. For example, within the personnel selection context, Pareto-optimization techniques have been developed to optimize predictor weights to maximize both performance and diversity of selected individuals (De Corte et al., 2007; Song et al., 2017). In ML, adversarial learning in neural networks strives toward a similar effect (Calmon et al., 2017). In other words, we can train ML measurement models to both maximize predictive accuracy and minimize MLMB.
Conceptually, one may ask whether there is truly a tension between maximizing predictive accuracy compared with addressing MLMB. In computer science, it is not uncommon to include subgroup membership information to maximize predictive accuracy (e.g., Kleinberg et al., 2018). In such cases, different sets of features are (implicitly) used for each subgroup so that it is possible to achieve high predictive accuracies that are relatively similar across subgroups. Yet this raises the question of whether the ML measurement is truly equivalent between subgroups. From a psychometric perspective, if features are viewed as assessment items, we would regard assessments that use different items for different subgroups as inherently biased because they are not assessing the same psychological construct between subgroups. If ML models are using different features to achieve similarly high levels of prediction (e.g., tone of voice for men vs. facial features for women to predict video interview performance), one can similarly regard it as a case of measurement bias because members of different groups are not being evaluated based on the same set of standards (i.e., using different yardsticks across groups).
This issue is further complicated in the ML context because even different computed features may represent the same psychological construct for different subgroups. For example, men and women tend to use different words and linguistic expressions on social media (Schwartz, Eichstaedt, Kern, Dziurzynski, Ramones, et al., 2013); the same personality dimensions may manifest as different language-usage patterns for men and women. Training separate ML models for each subgroup to pick up on these different uses of language between subgroups may lead to different ML models.
Note that our definition of MLMB still stands across all of the aforementioned scenarios: Differences in predicted mean scores across subgroups (given the same ground-truth mean levels) or differential predictive accuracy between subgroups can serve as empirical manifestations for MLMB. However, a lack of differential predicted mean levels or predictive accuracy is only prima facie evidence that the ML model is unbiased. It is possible that two entirely different models are being used to predict the same psychological attribute for different subgroups. A conceptual question is whether these computed features are similarly tapping into the same psychological construct. This requires a level of interpretability in the ML models being used and a clear conceptual rationale for what might constitute qualitatively distinct features resulting in nonequivalence (e.g., verbal behavioral features used for White people vs. nonverbal behavioral features used for Black people).
In general, this tension is related to validity concerns. As we mentioned earlier in the article, the topic of construct validity in ML measurement goes beyond issues of predictive accuracy and MLMB. At the same time, it is also important to recognize that MLMB investigations not only provide evidence for (or against) ML measurement’s generalizability (e.g., whether ML models apply equally well between subgroups) but also provide content-related validity evidence (e.g., Do computed features capture the desired construct content?) and predictive validity evidence (e.g., Do ML scores predict important outcomes?). These issues of measurement validation are relevant whenever ML models are used in a psychological context (and beyond; Tay et al., 2020; Yarkoni & Westfall, 2017). For example, ground-truth measures that are unreliable or have questionable validity can cause problems for the ML model (Jacobucci & Grimm, 2020) and create generalizability and replicability concerns (Loken & Gelman, 2017).
Equivalence of ML algorithms compared with consequential equivalence
Related to the above discussion is whether the MLMB framework should define algorithm-training bias as nonequivalence of algorithms (i.e., using different features; weighting and/or transforming features differently) between subgroups. It is understandable within a traditional assessment context that the use of different measurement models (e.g., using different test items or different weighting schemes for test items) between subgroups would be viewed as measurement biased. However, ML models frequently rely on organic and naturalistic behavioral data (Xu et al., 2020), which are arguably quite different from curated assessment items. 9 Unlike curated data from assessment items, it is challenging to fully overcome data bias with organic data, and using different ML algorithms between subgroups itself can be a way to mitigate data bias to achieve consequential equivalence (e.g., same predicted mean levels for the same ground-truth level and similar predictive accuracies).
We recognize that this argument holds merit. At the same time, including the aspect of algorithm-training bias within the MLMB framework is helpful because researchers will need to seriously consider this issue and justify when they believe differences in ML algorithms are warranted to achieve consequential equivalence. For example, using qualitatively different features (i.e., verbal features for White individuals vs. facial features for Black individuals) between subgroups to predict personality may be regarded as more problematic and biased compared with using qualitatively similar features (i.e., different language features between White and Black individuals but these different features represent different variations of the same root word or meaning) to achieve consequential equivalence.
More importantly, algorithm-training bias—and data bias—needs to be distinguished from consequential equivalence. In other words, the occurrence of MLMB is distinct from its consequences. In general, MLMB may not always translate into large effects in terms of consequential differences; one can find nonzero subgroup differences when examining different empirical manifestations of MLMB, but these differences may not necessarily be meaningful. For example, with very large sample sizes typically used in ML research, it is likely that one will find statistically significant differences. Still, these may not translate into large differences between subgroups on mean levels and/or predictive accuracy. Along these lines, it is also important to consider the practical effects for which the ML model is applied (e.g., Are there different selection or treatment rates between subgroups as a consequence of using ML-based predictions?). This can inform whether nonequivalence of ML algorithms should be treated as a significant source of bias that disadvantages a subgroup. Indeed, in traditional measurement bias, it is known that statistically significant differences in measurement models between subgroups do not necessarily translate into practical effects (e.g., the occurrence of measurement bias may translate into small practical effects if subgroup selection rates are similar for the same latent trait level; Stark et al., 2004). Moving forward, we hope that the field can recognize that MLMB (and data bias or algorithm-training bias) is distinct from consequential or practical effects. Future work should seek to identify the statistical (e.g., the strength of effect size), social (e.g., the domain and context of life), and practical (i.e., type of outcome the ML predictions affect) criteria for evaluating when MLMB has significant adverse effects.
Sample representativeness compared with matched samples
It is often discussed within extant MLMB frameworks that training sample representativeness is important for reducing MLMB (Barocas & Selbst, 2016; Kleinberg et al., 2018). There are several important points for clarification. First, when evaluating whether an already trained ML model is biased, we are less concerned about training sample representativeness (which should occur as a starting point) than distributional equivalence between subgroups in the evaluation data (e.g., same mean levels on an attribute). This is because we seek to determine whether the ML model advantages a subgroup of individuals compared with another, which is easier to examine under the condition of subgroup equivalence.
Second, when training an ML model, the notion of a representative sample for which one seeks to generalize can be challenging to define and practically obtain. One needs to determine the scope of representativeness (i.e., world, country, specific segment). In other words, what is the population that one seeks to justifiably represent? For example, in building an ML model to measure psychological attributes for personnel selection, it can be challenging to determine whether the population would be (a) the current demographic of workers within the organization, (b) the current demographic of the local community, (c) the current demographic of the nation, or (d) the demographic of applicants with adequate qualifications (which may not be immediately known). Moreover, there is a tension between what we term “desired representativeness” (ideal/aspirational representation of different subgroups) and “realized representativeness” (current representation of different subgroups). Representing the general population (in the current state) will tend to underrepresent minorities relative to majority group members, which may cause an ML model to disproportionately focus on the majority group’s input-output relationships. For example, when Amazon trained its automated résumé screening tool, it used the realized representativeness of computer programmers in its workforce (mainly men), which caused biased results (Dastin, 2018). On the other hand, obtaining a representative sample with desired representativeness as a goal can also be problematic because of the subjectivity it introduces (e.g., How does one decide on the ideal percentage of Asian individuals in computer science?). Conversely, our suggestion of using equivalent distributions for training ML may be more straightforward because there is perfect parity for the subgroups of interest. Arguably, this may also be a form of desired representativeness.
Third, it is unknown whether sample representativeness is preferred for training ML models when seeking to address MLMB. This is especially true when there are existing inequalities or if subgroups are vastly different on the attributes of interest. For example, a concern is that differences between underrepresented minorities have lower scores than a majority group on standardized test scores may lead to increasing the chance that ML models inadvertently and indirectly use demographic information to make predictions for standardized test scores (i.e., introducing MLMB). In this case, representativeness could lead to biases against specific subgroups. It may be better to use samples that have subgroups with equivalent samples (i.e., equivalent trait distributions and numbers), regardless of sample representativeness (with respect to the population of interest), to train the ML model if the ultimate goal is to reduce MLMB. Note that there may not necessarily be a trade-off between representativeness and matched samples depending on the subpopulations of interest (i.e., there already exist similar distributions on the attribute of interest for subpopulations).
Finally, our approach for operationally matching subgroup ground-truth distributions to evaluate MLMB stems largely from a lack of ML procedures that account for different subgroup ground-truth distributions in developing predictive models. In traditional measurement-bias research, matched sample distributions between subgroups are typically not required to estimate the differences in subgroup lines shown in Figure 2. For example, using CFA or IRT, simultaneous estimation can be done that accounts for different subgroup latent-score distributions; the procedure often treats the referent subgroup latent distribution as normally distributed and freely estimates the mean and variance of the other subgroup. However, given the novelty of this domain, we currently do not have similar procedures developed for investigating MLMB. Furthermore, we believe that simplifying the case for when one has matched subgroup ground-truth distributions can help readers better understand the meaning of MLMB, the sources of MLMB, and mitigation strategies.
ML models for psychological assessment compared with other uses
One concern that may arise is that we are advocating that ML models throughout psychological research should always be the same across subgroups (e.g., using and weighting features in the same manner). This is not the case. Our proposal is that in ML models explicitly used for psychological assessment, it is essential that the MLMB framework be considered and applied before being used in practice for decision-making or making claims about subgroup differences. In this context, in which bias and fairness of scoring individuals and subgroups are critical, we need to evaluate the ML models for measurement bias and apply these standards to ensure that ML models function equivalently between subgroups of interest.
However, there are also many other uses of ML models beyond psychological assessment. In such contexts, applying the MLMB framework may not be relevant, for example, training different ML models for each subgroup to describe (and understand) how men and women with equivalent personality levels may express different verbal and nonverbal behaviors. It is akin to using traditional measurement models (e.g., CFA and IRT) to examine how subgroups may differ in their responses to a measurement tool. For example, such an approach has been advocated and applied to better understand cultural differences in scale responding (Cheung & Rensvold, 2000; Tay et al., 2010).
Practical guidelines for evaluating ML models and applications
For researchers and practitioners who use ML models, it is helpful to have practical guidance on evaluating trained ML models for MLMB using this framework. Here, we highlight at least four ways to do this.
Foremost, because this framework examines MLMB in specific subgroups, it is important to determine whether the trained ML model has been evaluated on the subgroups of interest. For instance, although facial recognition had high levels of accuracy in general, data sets used for evaluating accuracy contained mostly lighter-skinned individuals. Aligned with this framework, Buolamwini and Gebru (2018) proposed a balanced sample of both gender and skin type to evaluate MLMB (termed “bias” in their article). They found that the trained ML models had high accuracies for lighter-skinned men but comparatively low accuracies for darker-skinned women. This example shows that when using a trained ML model, especially when using it to score and compare different subgroups, it is important to determine whether the ML model functions similarly across the different subgroups of interest. To evaluate for possible MLMB in trained ML models, we recommend using similar sample sizes and ground-truth characteristics for the subgroups. Researchers can evaluate this in the technical reports of the trained ML models or evaluate MLMB in specific subgroups of interest.
Second, one should consider whether the ML model was trained on data that have similar sample characteristics across subgroups. A lack of equivalence in the subgroup samples during ML model training can cause MLMB. For instance, using predominantly men samples to train Amazon’s résumé screener may have led to MLMB such that men were selected at a higher rate than women (Dastin, 2018). Training the ML model on a sample in which men were more qualified than women can cause the ML model to inadvertently or indirectly use gender as a proxy for qualification.
Third, one should consider whether the platform data inputs (e.g., social media, Internet searches) from which the ML model is trained may be used by subgroups differently, which leads to a greater likelihood of MLMB. For instance, because Black Americans use African American Vernacular English on Twitter and White Americans do not, it has been found that ML models can “systematically classify content aligned with the African American English (AAE) dialect as harmful at a higher rate than content aligned with White English (WE)” (Ball-Burack et al., 2021, p. 116).
Fourth, as a consumer of ML-based products, it is important to ask and investigate whether the trained ML models differ across subgroups. From a psychometric perspective, this can evidence MLMB because different measures are being used to assess different subgroups of individuals. For example, subgroup norming of features in ML models (i.e., z-scoring ML features separately for each subgroup) is common in computer-science applications. Past research using gender norming of ML features in the context of automated interviews did not find that it substantially reduced MLMB (Booth et al., 2021). More importantly, when ML models are used in the context of selection, one should recognize that subgroup norming (on race, sex, etc.) is prohibited according to the law (i.e., Civil Rights Act of 1991); subgroup norming of features in ML models likely falls within this prohibition.
Closing remarks
In establishing this framework for MLMB, we are not proposing that all forms of bias in ML applications (e.g., whether certain psychological assessments used as ML ground truth are biased criteria or valid criteria in the first place; the validity of using and interpreting ML models of psychological assessment) are now eminently solvable. Discussions on what criteria one is using in ML applications and whether they are valid, biased, or unfair against specific subgroups (e.g., cognitive ability; personality) will need to occur, but they also fall beyond the scope of the current article. More recent work has discussed validity issues when collecting, analyzing, and processing organic data (e.g., social media data, mobile sensing; Xu et al., 2020) used in ML models but also more broadly in psychological research. Moreover, evaluating the validity of whether trained ML models accurately assess constructs and claims of what they assess (e.g., claiming ML models built on the ground truth of observer reports of personality assess personality as typically understood as self-reported personality) have also begun (Tay et al., 2020). We believe that these are issues the entire field of psychological assessment needs to grapple with and not merely ML-based psychological assessments.
We are focused narrowly on measurement bias, drawing on the psychometrics literature and its many decades of experience and established standards. It is in this realm of application that we seek to clarify what a specific form of bias (i.e., measurement bias) means and ways it may manifest, delineate the possible sources of bias, and provide initial ideas on mitigating them. In other words, the simplifying assumption is that the ground-truth construct selected is warranted—and the question lies more in whether the assessment of the underlying construct has measurement bias (see Table 3). Even within this specific arena, although we have sought to simplify the presentation to highlight the key ideas (e.g., using two-group comparisons; using matched ground-truth distributions), the issue of MLMB is highly complex and challenging (see Table 3). As noted, and also depicted in Figure 4, there are multiple layers to how sources of measurement bias can emerge and cascade throughout the ML-measurement process. Moreover, establishing a lack of MLMB between two subgroups of interest does not necessarily generalize to other types of subgroupings. Despite these challenges, addressing bias and, hence, fairness is critical; developing a framework to investigate and address MLMB is essential to advance this cause. We also believe that providing relevant terminology and a framework that clarifies the different sources and issues in MLMB can be helpful even if it does not reduce the complexity of addressing MLMB. And indeed, this framework serves to highlight the different tensions and issues that exist in assessing and mitigating MLMB.
The goal of this article is to provide an integrative framework for investigating and mitigating MLMB. What do we mean by MLMB? How does it empirically manifest? Where in the process of creating ML models might MLMB be introduced? When researchers find MLMB, what can be done? The MLMB framework enables researchers to examine different sources of data and algorithm-training biases and provides suggested mitigation strategies. Our goal is not to provide or identify specific statistical tests, which is beyond the scope of the article. We believe that this is only the beginning, and more work is required to further develop new methodological approaches to examine MLMB. Using this framework, one can develop new statistical and algorithmic indices and procedures. In addition, researchers will need to assess the practical effects of MLMB—beyond the statistical significance of MLMB—to understand its real-world impact. We hope that this framework will serve as foundational conceptual grounding for future work and discussions on MLMB.
Supplemental Material
sj-docx-1-amp-10.1177_25152459211061337 – Supplemental material for A Conceptual Framework for Investigating and Mitigating Machine-Learning Measurement Bias (MLMB) in Psychological Assessment
Supplemental material, sj-docx-1-amp-10.1177_25152459211061337 for A Conceptual Framework for Investigating and Mitigating Machine-Learning Measurement Bias (MLMB) in Psychological Assessment by Louis Tay, Sang Eun Woo, Louis Hickman, Brandon M. Booth and Sidney D’Mello in Advances in Methods and Practices in Psychological Science