
Abstract
In psychological science, ego-centered social networks are assessed to investigate the patterning and development of social relationships. In this approach, a focal individual is typically asked to report the people they interact with in specific contexts and to provide additional information on those interaction partners and the relationships with them. Although ego-centered social networks hold considerable promise for investigating various interesting questions from psychology and beyond, their implementation can be challenging. This tutorial provides researchers with detailed instructions on how to set up a study involving ego-centered social networks online using the open-source software formr. By including a fully functional study template for the assessment of social networks and extensions to this design, we hope to equip researchers from different backgrounds with the tools necessary to collect social-network data tailored to their research needs.
The investigation of social networks, which describe the interactions and relationships among finite sets of individuals, is a research tool that can prove valuable for researchers from various fields of psychology and beyond. Whereas more traditional survey approaches often focus on individuals only, the social-network approach aims to investigate the behavior and attitudes of individuals in relation to their social relationships and interactions, thus acknowledging the important role social contexts often play for individual-level outcomes. One way of studying social networks is the assessment of ego-centered networks. In such an assessment, a number of interaction partners, as well as attributes of the interaction partners and the relationships with them, are self-reported by a focal individual (Marsden, 1990). 1 The investigation of ego-centered social networks can be used to examine questions that would not be available via survey approaches that focus on individuals only. In particular, looking at ego-centered networks makes it possible to learn more about the patterning of individuals’ social relationships and about how these relationships may change over time or across life transitions. In addition, researchers can investigate how relationships affect the behavior and attitudes of individuals and, vice versa, how relationships are affected by the characteristics of the individuals involved. The breadth of the questions previously tackled by employing ego-centered social networks demonstrates the value of this tool for different fields of psychology and relationship science in particular. Examples of previous research in which ego-centered networks were employed include investigations into how people’s social networks are associated with characteristics such as their personality or gender (e.g., Armstrong & Kammrath, 2014; Asendorpf & Wilpers, 1998; Rapp et al., 2019; Zhu et al., 2013), how social networks are related to outcomes such as mental and physical health or health-related behaviors (e.g., Aschbrenner et al., 2018; Marquez et al., 2018; Meisel et al., 2013; Ueno, 2005; Wyngaerden et al., 2019), and how social networks affect or are affected by life events such as residential mobility or the transition to parenthood (e.g., Bost et al., 2002; Greischel et al., 2016, 2018; Keim et al., 2009; Lois, 2016; Zimmermann & Neyer, 2013). For more detailed descriptions of previous studies having employed ego-centered social networks, see Table A1 in the Appendix. For a more exhaustive discussion of the strengths and limitations of the (ego-centered) social-network approach in general, see Marsden (1990), Wasserman and Faust (1994), and Perry et al. (2018).
The typical procedure used to assess ego-centered social networks via self-report includes the use of so-called name generators and name interpreters (Marsden, 1990). Name generators usually are (a series of) questions or situational prompts that are supposed to guide participants in coming to think of the people constituting the network in question. Name interpreters, on the other hand, are additional questions that are usually asked to obtain more information about the people listed as network members (e.g., age or gender) and about the relationships to those people (e.g., contact frequency, duration, or intensity).
Although this procedure can successfully be used in face-to-face or telephone interviews (e.g., Burt, 1984; Kogovšek & Ferligoj, 2005), there are several advantages of assessing ego-centered social networks via online surveys. In general, using online surveys allows researchers to reach out to large, potentially diverse, and/or specialized samples (Kraut et al., 2004). Furthermore, because participants do not need to come into the lab and be instructed or supervised by a human experimenter, the cost and effort of conducting research may be reduced, and participants’ experience of anonymity may be facilitated. Finally, and of particular importance for the assessment of social networks itself, online implementations are flexible in the sense that they allow for an adaptation of instructions or questions based on earlier responses. This is especially useful given that the procedure of using name generators followed by name interpreters requires the latter to be adapted to the number of people listed as network members and/or to their names and attributes.
A number of studies have already been conducted using online implementations of ego-centered social networks (e.g., Armstrong & Kammrath, 2014; Borschel et al., 2019; Greischel et al., 2016, 2018; Zimmermann & Neyer, 2013). However, setting up the assessment of social networks from scratch might pose a challenge to researchers. Features such as name interpreters being contingent on the number and type of people listed as the network involve some complexity that may be difficult to implement. Therefore, the aim of this tutorial is to provide detailed instructions on how to assess ego-centered social networks online using the open-source software formr (Arslan et al., 2019). By this, we hope to enable researchers from all backgrounds to employ the valuable method of ego-centered social-network assessments.
Although there are different tools available that allow for the online assessment of social networks (e.g., specialized graphical network tools such as EgoNet, EgoWeb 2.0, Graphical Ego-Centered Network Survey Interface [GENSI], Network Canvas, VennMaker; general survey tools such as Qualtrics), each with its own strengths and research questions most suitable for, we decided to base our tutorial on formr for several reasons. First, formr is free open-source software that makes it possible to easily share reproducible study setups. In contrast to software in which access to the software itself or to reproducible study setups might not be available to everyone, this allows for a better evaluation and replication of scientific methods and ensures transparency. Second, formr is readily integrated with the programming language R. This allows researchers familiar with R to use their favorite packages to enable complex features in formr (e.g., plotting graphs on the basis of participants’ responses, which can be used to monitor a study’s progress or to provide feedback to participants; or even using analyses of participants’ social media feeds to determine what kind of questions they will be presented with, for instance to ask questions about people with whom they frequently interacted on Twitter).
Regarding ego-centered social networks in particular, formr may be a good choice because it allows for the incorporation of all kinds of functions needed to implement basic as well as more complex network assessments. Whereas some of these functions are directly built into the formr interface, others can be enabled because of formr’s integration with the R ecosystem of packages. For one thing, using formr makes it possible to easily assess more information about the people listed as network members (e.g., by allowing to make name interpreters contingent on the previously listed network or to loop through the same survey page for all of the network members). For another thing, it allows one to create personalized (graphical) feedback based on participants’ responses (e.g., about the size and composition of their social network or about how characteristics of focal participants and the network members influence certain assessed variables). This sort of feedback has proven to be an excellent way to incentivize participants throughout extensive studies and, when provided as examples in advertisements along with the study description, to also effectively motivate people to participate in the first place. Moreover, using formr allows for the assessment of networks in the context of experience sampling or other longitudinal designs (including the possibility to send out personalized reminders to focal participants) and for an additional assessment of the people who were listed as network members (including the possibility to create peer links for focal participants to pass on to their network members). It is even possible to incorporate other existing JavaScript-based social-network assessment tools in formr (e.g., graphical tools such as GENSI; Stark & Krosnick, 2017). To sum up, even the most sophisticated designs involving social networks can be implemented in formr, making it a useful tool for the investigation of a wide range of different networks and research questions.
It would lie beyond the scope of our tutorial to explain all of these options in detail; therefore, our focus in the following will be to explain how to build up a more basic network assessment in formr, including looped and network-contingent name interpreters as well as a network-based feedback. However, we will briefly discuss some examples of more complex designs that could in the future be implemented in formr in the Discussion section, and for readers familiar with JavaScript, at the end of the tutorial section, we also include an example of how the graphical tool GENSI (Stark & Krosnick, 2017) can be incorporated in formr.
Disclosures
All materials used in this tutorial have been made publicly available via the OSF and can be accessed at https://osf.io/sgkwz/.
Tutorial: Assessing Ego-Centered Social Networks in formr
Sample study and information about formr
Sample study
To guide you through the process of building up a study capturing ego-centered social networks in formr, we have created a sample study designed to assess social support networks. We use this study to guide you through the different steps of implementation and, at the same time, provide you with a template you can later use as a starting point to create your own social-network study.
In our sample study, we sought to answer the following research questions: How are people’s personalities related to aspects of their support network (e.g., the size of the network, the amount of contact to the members of the network, and the experienced closeness to those members)? And does the degree of similarity between a person’s own personality and the network members’ personalities predict the amount of contact and experienced closeness? These research questions represent fairly typical examples of questions that are especially suited for the ego-centered network approach and would not be readily available by employing other approaches. That is, by focusing on the interaction between people’s characteristics and their relationships, the investigation of these questions requires researchers to move beyond the assessment of individuals in isolation. Because support networks constitute a specific and subjective subset of people’s broad social networks, insight can best be gained by asking for supportive peers from the perspective of the focal individual. To get at these research questions, in our sample study, we assessed information about the focal participant and their personality, the people in the focal participant’s support network, the amount of contact and experienced closeness to the network members, and the personalities of the network members.
In the following, we explain how we gathered these kinds of data using formr in our template study. In particular, we focus on the assessment of the network itself and ways of collecting more information about the people listed there by referring back to data provided by participants earlier in the course of the study. With this, we aim to equip you with the basic tools needed to implement social-network assessments in formr and enable you to adapt our templates to your own research needs. Before we do so, let us give you a brief introduction to the formr framework.
About formr
Formr is a noncommercial, online, open-source survey framework (Arslan et al., 2019) that allows for the implementation of simple cross-sectional surveys as well as more complex study designs such as longitudinal, dyadic, or experience-sampling studies. A freely usable version of formr is accessible at formr.org, hosted at the University of Goettingen, but self-hosting the software is possible, too.
Formr consists of three main components. The first component is the survey framework, which allows you to specify the information to be gathered in your study in so-called item tables. Item tables are spreadsheets of different possible file formats (e.g., Excel files, Google Sheets), which make up your survey when being uploaded to formr’s survey framework. The second component is the study control framework, which allows you to specify the overall design of your study in a so-called run. As part of the study design, the study control framework allows you to set up automated invitation or reminder e-mails and personalized feedback. Using formr necessarily includes using the study control framework (i.e., a run), although it is possible to use the study control framework without using the survey framework, for example when another data collection module is used instead. 2 The third main component of formr is a utility R package (Arslan, 2018). As mentioned before, you can enable complex features in formr by executing R code in the survey spreadsheets as well as in the study control framework (i.e., the run). 3 The utility R package includes helper functions to organize and analyze data collected with formr (during and after the collection).
For further information on formr, see Arslan et al. (2019), the documentation section on the formr website (https://formr.org/), and the formr Wiki on GitHub (https://github.com/rubenarslan/formr.org/wiki). In addition, for a cheat sheet explaining all formr-related terms we use in this tutorial, see Table A2 in the Appendix.
Steps of implementation
Let us now look at the different steps of building up a fully functional study for the assessment of ego-centered social networks in formr. We start off by discussing some questions you might want to consider before implementing your study and by showing you how to create your own formr account. Next, we explain how to set up a basic ego-centered network study in formr using the survey and study control frameworks as well as how to test and finally run the study. As add-ons, we also discuss how to implement personalized feedback and how to incorporate the graphical network tool GENSI (Stark & Krosnick, 2017). Note that to create feedback in formr, the use of the programming language R is required; therefore, some basic experience with R will be beneficial—although not necessary—for understanding this part of our tutorial. Likewise, incorporating GENSI requires the use of JavaScript, for which reason this particular section will appeal mostly to readers with previous knowledge of JavaScript. Importantly, however, understanding and reproducing the remaining (and most central) sections of our tutorial will not require any previous knowledge of formr or any programming language.
Considerations in advance
Before starting to implement your social networks study in formr, there are a few questions you should consider. Note that all considerations addressed in this section are again summarized in Table A3 in the Appendix (together with some more considerations pertaining to problems that are specific to the ego-centered network approach, which are addressed in the Discussion section).
First, you should ask yourself what kind of ego-centered social network you want to assess. Put differently, which kinds of social interactions are of interest to you? Five types of (partly overlapping) ego-centered social networks have been distinguished in the literature: networks of close associates (i.e., networks of people important to the focal person), exchange networks (i.e., networks of the people providing material or symbolic support as well as people who provide criticism or refuse to provide support), interactive networks (i.e., the people interacted with in certain contexts or during a certain period of time), role-relation networks (i.e., networks defined by social roles), and global networks (i.e., all people one knows; Milardo, 1992; van Sonderen et al., 1990). In addition, you could also be interested in studying members of people’s networks with certain characteristics who do not make up any of these network types (e.g., specific networks such as all people one knows who play a musical instrument). To provide you with some guidance on applications and research questions related to different kinds of networks, Table A1 in the Appendix lists examples of studies that targeted each of the network types described above. In our sample study, we aimed to assess a typical subtype of exchange networks (Milardo, 1992): the people our focal participants would ask for support in different situations.
A second consideration is how you would like to guide your participants in the creation of their networks. As mentioned before, one way of doing so is using name generators (i.e., questions or prompts that instruct participants to list the people constituting the network in question). For example, if you wanted to assess a broad interaction network, you could list different life contexts (e.g., university, work, recreational activities) and ask for the people typically interacted with in these contexts (Bidart & Charbonneau, 2011). If you were interested in a narrower network, you could ask about the people who affect participants’ attitudes, behaviors, or well-being the most (McCallister & Fischer, 1978). Deciding on which name generators to use is a highly important step in planning your study because the name generators will determine the characteristics and the number of people that your participants are going to list as their network. Therefore, you should make sure that the type and number of name generators you choose corresponds to the network you want to assess. In our sample study, to assess support networks, we provided participants with a set of situations that could require the support of others and asked which people they would typically ask for help in these situations. For further examples of name generators that have previously been used in the literature (as well as the kinds of networks they may elicit), see Table A1 in the Appendix.
Third, you will need to specify how many people your participants will be allowed to list as their network. For a first orientation, you may want to consult previous studies that have employed ego-centered networks for typical as well as maximum network sizes (again, you may refer to Table A1 in the Appendix for a quick overview of the network sizes elicited in a selection of previous studies). Another way to approach this would be to pilot your method of assessing your network of interest (including your name generators) in a small sample of face-to-face interviews. By piloting your social-network assessment with people closely mirroring the population you want to target with your larger online study, you should get a good handle on what might constitute an appropriate maximum network size. In any case, you should make sure that the number of people who can be listed fits the number of people your instructions or name generators make your participants think of. In addition, depending on the depth of information you want to gather about each of the network members afterward, you may or may not have to restrict yourself to having participants list fewer (maybe only the most important) network members. However, you should keep in mind that forcing participants to omit important network members or to list people less important to their network by adopting arbitrary upper or lower boundaries may lead to misleading or artificial results. For our sample study, we decided to let participants list a maximum of 12 people they would turn to when in need of support. As an alternative to setting an upper limit on the number of network members that can be listed, you could also draw a random selection of all listed network members for further in-depth information collection (e.g., Golinelli et al., 2010).
This leads us to a fourth important consideration: What kind of additional information on the network members do you want to gather and with which measures? As mentioned before, such additional questions about the network members are referred to as name interpreters. For our sample study, apart from having our participants rate their own personalities, we decided to ask them about how they perceive the personalities of the people in their network and about the amount of contact and experienced closeness to those people. Again, and complementing what we outlined above, if you allow a lot of people to be listed, you may have to cut down on the amount of additional information being collected.
Finally, you may want to think about how to keep your participants motivated throughout your study. Social-network assessments can place a heavy burden on participants, especially if participants are required to answer the same set of questions over and over again for a large number of network members. One way to motivate participants to engage in and work through an extensive network assessment might be by rewarding participants with personalized feedback based on data gathered during the course of study upon completion of the assessment. In our sample study, we decided to provide participants with graphical feedback on their Big Five personality traits and their social network. In particular, participants also received graphical feedback about how they perceive their own personality compared with how they perceive the personalities of their network members and how the time they have known their network members is related to how close they feel to them.
Step 1: creating a formr account
Now, let us get started with the implementation in formr. As mentioned before, all formr-related terms used in this tutorial are explained in Table A2 in the Appendix; you can refer to this table in case you have trouble understanding any of the terms. To create your own studies in formr, you will first need to create a formr administrator account. To get an account on the public instance, go to https://formr.org/register. Upon successfully submitting your e-mail address and a password on this page, you should receive an e-mail asking you to confirm your e-mail address. As described in more detail on the registration page, you will need to send a short e-mail to one of the formr authors after registering. 4 After checking your e-mail and academic affiliation, the authors will then grant you administrator rights. You will now be able to log in with your new account and start setting up your own study.
Step 2: the survey spreadsheet
To get started with your first formr study, you will need to create a survey spreadsheet. The survey sheets for our sample study can be downloaded as Excel files from the “Spreadsheets” folder on the tutorial’s OSF page (https://osf.io/sgkwz/). Make sure to save the files under their preset names because we use these names to refer back to items in the spreadsheets (e.g., when creating adapted questions or feedback). If you change the file names, you will have to adjust each of these references according to the new names. As you can see, the spreadsheet folder on the OSF contains multiple spreadsheets; together, these spreadsheets make up a complete and fully functional survey when embedded in a run. In the following, we use these survey sheets for our tutorial. 5 Let us start with having a look at the survey spreadsheet defining the part of our sample study that contains the assessment of the social network (the survey spreadsheet named “networks_template_networks_part1”). To understand what we are going to achieve with this spreadsheet, see Figure 1, which shows what the page we are going to create with our spreadsheet will look like to participants.

First part of the formr user interface assessing the social network as produced by the survey spreadsheet “networks_template_network_part_1.” Fictional information about a person called Caroline was added as the first listing, and the “+” button has been clicked once for a second row of input fields to show up.
Table 1 depicts the survey spreadsheet corresponding to the interface you see above (“networks_template_network_part1”). The basic structure of a survey sheet is that it contains a number of columns with predefined names: In the type column, you specify what kind of item you are creating (e.g., plain text, text input, multiple-choice question), whereas you name your item in the name column, and you specify its exact wording in the label column. The class column is typically used to control your items’ visual appearance (e.g., by adjusting width or alignment of your text). 6
First Part of the Survey Worksheet of Spreadsheet “networks_template_network_part1”

Note: (. . .) = content of items abbreviated.
Creating a heading and instructions
As you can see in Figure 1, the network assessment page starts with a heading and the instruction to list names and other information about the people one would ask for support. To create items simply containing text for a heading and an instruction, in row 1 and 2 of Table 1, we define the item types as “note” in the type column and put our text into the label column.
Spontaneous retrieval of the social network
Figure 1 further shows that the instructions are followed by input fields, asking for the name and some further information about the first person listed by the participant. In the item names, we refer to the people listed as P1, P2, and so forth, depending on the order they were listed in. In Table 1, the input items for the first person are defined in rows 3 to 6. In row 3, we ask for the person’s name, which can be added into a text input field with a maximum of 50 characters allowed. To do so, we define the item type as “text 50” in the type column. In row 4, we ask about the person’s age, which can be added as a whole number between 12 and 99 (type: “number 12, 99, 1”). In row 5, the person’s sex is to be chosen from a selection of predefined choices (type: “select_one”). To define choices for your items, you have to navigate to the choices table of the survey spreadsheet. Your survey spreadsheet consists of two different worksheets, one labeled survey (this is the part of the spreadsheet we were looking at so far), and the other one labeled choices. You can navigate between the two worksheets by clicking on their respective tabs in the lower left corner of the spreadsheet. In the choices worksheet, you will find the choices table, where the name_list column contains the names of your choice lists, the choices’ names (or values) are set in the name column, and their labels are set in the label column. Have a look at Table 2 to see the choices worksheet of our survey spreadsheet “networks_template_network_part1.” For our sex item, we are using the choice list “sex_list.” To do so, we refer to this list in the survey table of our survey spreadsheet in the type column of row 5 (by putting “sex_list” after “select_one”). In row 6 of the survey table, we then define another item of the type “select_one” to ask for the relationship the participant has with the listed person. Here, we refer to the predefined choice list “relation_list” (as depicted in Table 2).
Choices Worksheet of Spreadsheet “networks_template_network_part1”

In our sample study, at this point, this is all we want to know about each person in the network. Thus, we continue with defining the same questions for the next person who is going to be listed (and whom we call P2, as mentioned earlier). To do so, we can copy rows 3 to 6 and insert them below, changing only the item names in the name column by replacing P1 with P2 for all items, as shown in rows 7 to 10 of Table 1. In our sample study, participants are allowed to list 12 people. We thus have to repeat this step another 10 times, always changing the P count in the item names by one, until we get 12 sets of questions. Because all of these questions follow the same logic, Table 1 shows only the items for the first two people listed.
Now, if we left the survey sheet like this, participants would see the four different questions 12 times upon entering the page. It would look nicer, however, if, as shown in Figure 1, the questions would show up only once for the very first network member to be listed and additional questions for more network members would appear only when participants in fact wanted to list more people. To enable this, we create a counter that increases its value by one if participants click a “+” button and decreases by one if participants click a “–” button. To do so, we add a new item of the type “number” and with the class “counter,” as done in the last row of Table 1 for the item named “counter_SN.” To specify the counting procedure so that for each click the counter will increase by one until it reaches the value of 12, we put “number 1, 12” into the type column. To set the starting point of the counter as one, we put “1” into the value column of this row. Now, our next step is to use the showif column to specify for which values of the counter the question items are to be shown. Because the questions about the first person to be listed are supposed to appear upon entering the page, we can leave the showif column for rows 3 to 6 in Table 1 empty. For the questions about the second person (rows 7–10) to show up only after the “+” button has been clicked once, we specify that these items are shown only if the value of the counter is bigger than one (because the counter starts at one, clicking it once makes its value become two) by putting “counter_SN > 1” in the showif column of these rows. Finally, we have to repeat this step for all other input items, always increasing the value after the “>” symbol by one for each new set of questions.
Cued retrieval of the social network
At this point of the study, the participants should have listed the people they spontaneously thought of after reading the first instructions. To make sure that all people relevant to the network in question have been listed, participants were further given name generators, as shown in Figure 2, unless they had already listed the maximum number of 12 people. This part of the survey is defined in the second half of the survey spreadsheet “networks_template_network_part1.” The name generators appeared to participants one after another, only after each previous checkbox had been ticked.

Second part of the formr user interface assessing the social network as produced by the survey spreadsheet “networks_template_network_part_1.”
Table 3 shows how the name generators and their instructions are produced in the second part of the survey spreadsheet “networks_template_network_part1.” Row 1 of Table 3 creates an instruction text, informing participants they will now be told about different situations and instructing them to add every new person these situations make them think of. The additional instructions and questions are supposed to be shown only if participants have not already listed 12 people; therefore, row 1 and all remaining rows include the condition “counter_SN < 12” in the showif column. By typing “check” into the type column of row 2, we create a checkbox called “prompt1.” For the first name generator to show up only after this first checkbox has been checked, we specify “prompt1 == 1” in the showif column of row 3. We are setting it as “1” because this equals the value of the item if the box has been checked (as compared to 0 if it has not been checked). The name generator will show up together with another checkbox item named “prompt2,” as specified in row 4 of Table 3. Again, this box has to be checked for the second name generator and its respective checkbox named “prompt3” to show up (that is why we put “prompt2 == 1” in the showif column of row 5 and 6 of Table 3), whereas the third name generator appears only after the checkbox of generator two has been checked (so we put “prompt3 == 1” in the showif column of row 8 and 9). Finally, the participants will be shown a final instruction, as specified in row 10 of Table 3, after the checkbox of the third name generator (i.e., “prompt4”) has been checked.
Second Part of the Survey Worksheet of Spreadsheet “networks_template_network_part1”
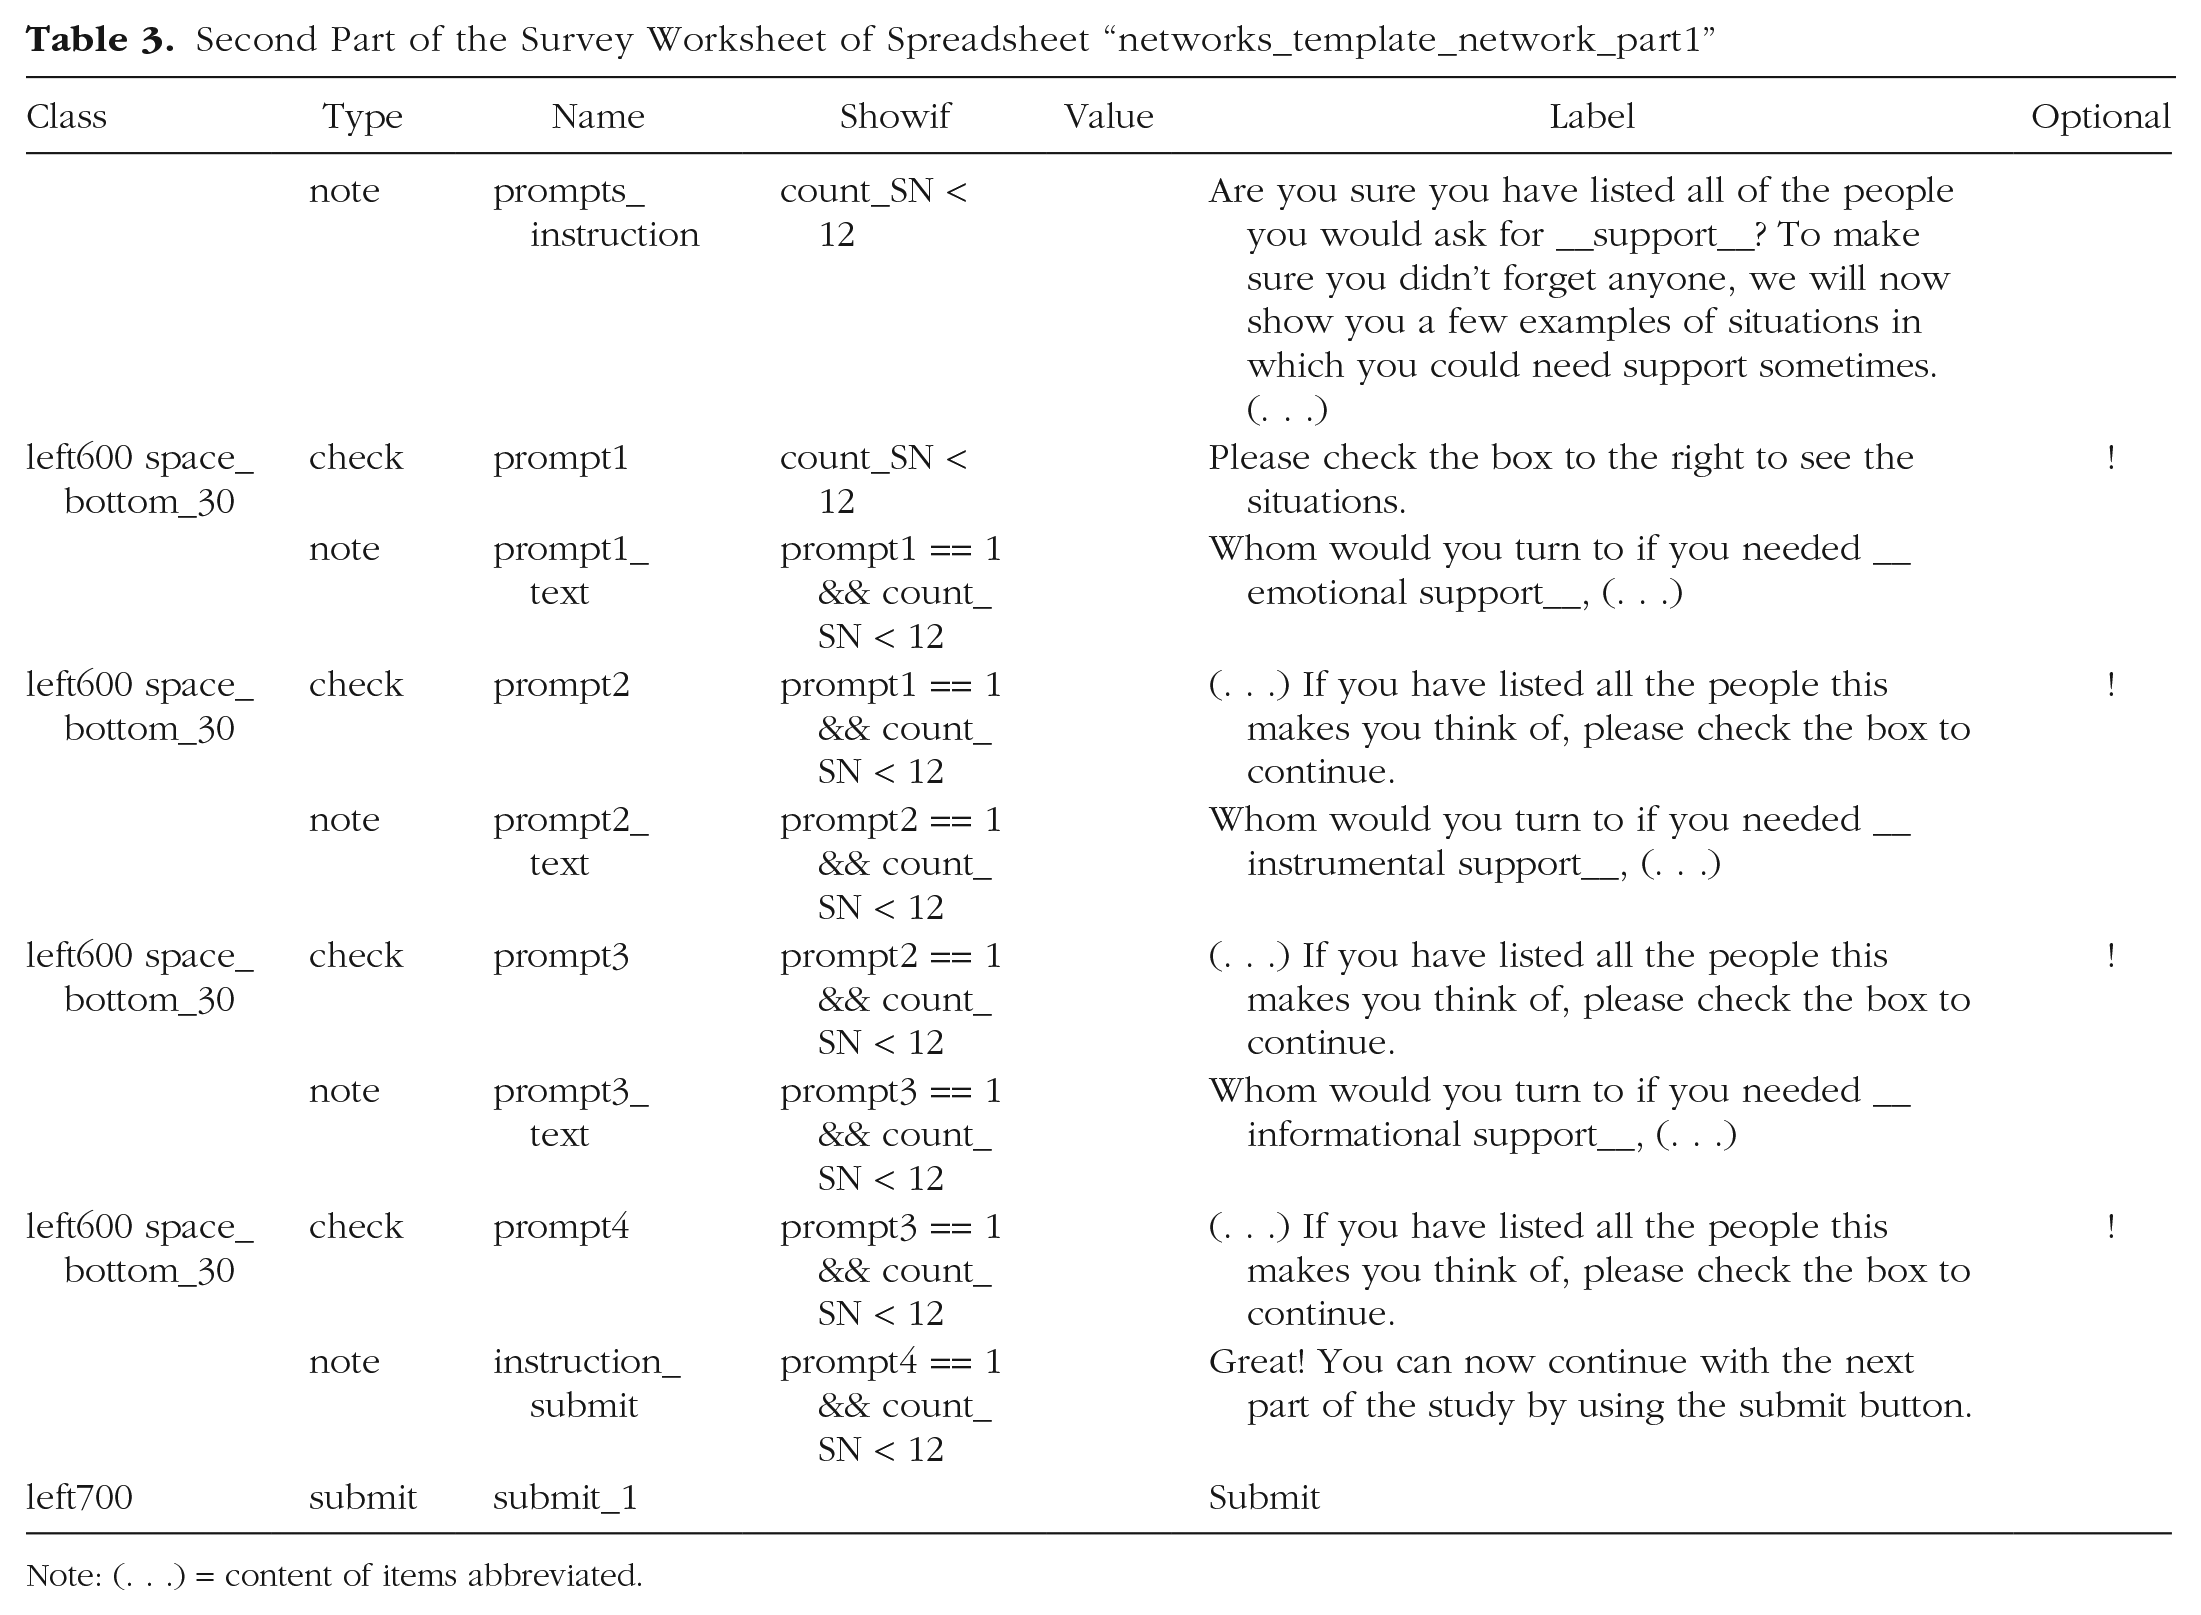
Note: (. . .) = content of items abbreviated.
Last but not least, the page also includes a submit button, which appears on the bottom of the page but can be clicked only after all mandatory questions have been answered. The submit button (type: “submit”) is defined in the last row of Table 3. In formr, multiple-choice items are mandatory by default, whereas checkboxes usually are not. Because we wanted our participants to have to go through the name generators before continuing to the next page, we specified for our checkboxes (rows 2, 4, 6, and 8 of Table 3) that we want these items to be mandatory as well by putting a “!” into the optional column of these items.
Referring back to the people listed in the network
Because you will most likely want to find out more about the network members listed by the participants, we also include a description of how to refer back to the network members in this tutorial. In our sample study, we wanted to ask participants additional questions about their relationship to the people in their network on a subsequent page. Specifically, we asked them to report how long they knew each member of their network, how much contact they had with each member, and how close they felt to them. The answer options to the last item were taken from the Inclusion of Other in the Self Scale by Aron et al. (1992). Here, one out of seven images of two circles, which depict the self and the person to which the amount of felt closeness is to be rated, is to be chosen as a response. 7 These further questions about the network members are specified in the spreadsheet named “networks_template_network_part2.” Figure 3 shows the user interface produced by this spreadsheet. To create this figure, we listed a fictional person called Caroline as a 36-year-old female friend on the previous page as part of the support network. The participant is asked for more information about Caroline. As you can see, we wanted not only the name of the person to be rated to show up but also their sex, age, and relation to the focal participant. This will be especially helpful for focal participants who used only shortcuts to name the network members and added a lot of people or people with similar names. 8

Formr user interface assessing further information about the social network members as produced by the survey spreadsheet “networks_template_network_part_2.” A fictional person called Caroline was listed as an example. The answer options for the closeness question are taken from the Inclusion of Other in the Self Scale (Aron et al., 1992).
Table 4 shows the spreadsheet “networks_template_network_part2” that creates the user interface depicted in Figure 3. To ask the participants further questions about the people listed in their network, we have to refer back to answers given earlier in the study and to items specified in a different spreadsheet. In general, there are different ways to achieve this. If you wanted to use adaptations only a few times, you could simply put the R code calculating your item of interest’s value (i.e., the code that will retrieve and print out the answers given by each participant to a certain item) right into the label column where you want your text to be adapted. 9 However, because we need to refer to the names and attributes (i.e., age, sex, relationship to focal person) of all people listed, we instead define new variables that calculate the relevant information for us at the beginning of our spreadsheet in order to later use these variable names as placeholders in our labels. Furthermore, we combine this approach with a loop: The same page (as in Fig. 3) will be repeatedly shown to participants for each person they have listed as their network members. For this to work, we define our new variables in a way that the first time the page is accessed, the name and information about the first person listed will be calculated, whereas the second time the page is shown, the name and information about the second person listed will be calculated, and so on. For such a loop to work correctly, we need to specify in the study’s run that participants are to be sent back to the respective survey page again and again until they have rated each one of the network members they had listed. We take a closer look at how to achieve this in the section describing how to set up the study’s run but first continue with looking at how to define our new variables that calculate each network member’s name, age, sex, and relationship to the focal person.
Survey Worksheet of Spreadsheet “networks_template_network_part2”

Note: (. . .) = content abbreviated.
To define our new variables, we created five items of the type “calculate” (see rows 2–6 in Table 4). In the name column, we define the names we want to use to refer to the calculated variables, whereas we put the R code used to calculate the variables in the value column. In row 2, we first define the variable “person,” where the command “nrow(networks_template_network_part2)” counts the rows of the result sheet of the survey “networks_template_network_part2” for each participant’s session. Therefore, the item “person” yields one when participants see the survey page for the first time, two when they see it for the second time, and so on. In row 3, the item “person_name” calculates the names of the network members. As the person variable counts up from one, the command “networks_template_network_part1[, paste0 (“name_P”, person)]” accesses the information stored in the items “name_P1,” “name_P2,” and so on in the sheet containing the results each participant gave in response to the items of the “networks_template_network_part1” survey sheet. Using the same logic, the respective network members’ age, sex, and relationship to the focal person are calculated in rows 3 to 6. 10 Having defined these new variables, we can now use them as placeholders in our labels, as done in the label column in rows 8 to 13. Note that when referring to calculated variables in the label column, we need to specify that we do not want plain text to be printed but that we are referring to a variable that needs to be calculated via R. We can achieve this by putting “`r `” around the name of the variable to be calculated (e.g., “`r person_name`” instead of “person_name”).
For the general instruction to be shown only once and to tailor the further instructions to whether the page is seen for the first time, we furthermore put the conditions “person == 1” (which makes items show up only once when the page is accessed for the first time) and “person != 1” (which makes items show up only for the following loops) into the showif column of the items in rows 7 to 9.
Step 3: survey upload
To upload one or more survey spreadsheets, you need to log into formr with your administrator account and choose “Create new Survey” on the formr admin page. Here, you can upload item tables as local Excel files, OpenDocument spreadsheets, and comma- or tab-separated value files or import them in the form of a Google Sheet. 11 In addition to allowing easy sharing of the item table for collaboration with others, Google Sheets will give you the advantage of allowing the synchronization of changes in the sheet with formr in one click, which simplifies debugging. When uploading an item table, your survey will be named after your file, whereas you can choose a name when importing a Google Sheet. Make sure to use meaningful survey names because these names will be used to refer to each surveys’ results in different places, and it will be difficult to change survey names once the study has started.
To recreate our study template, you need to upload our sample spreadsheets. In total, there are five sheets. So far, we have looked in detail at the two sheets assessing the social network and the relationships to the people in it. Furthermore, the template includes one spreadsheet with demographic questions and two sheets assessing the personality of the focal person and the personalities of the people in the network, respectively.
By uploading these sheets, you are creating five new surveys named after the spreadsheets’ file names. If you have uploaded our sample spreadsheets to Google Sheets, be sure to name them after their original file names. 12 After creating your surveys, you can navigate to their respective survey pages by clicking on the “Surveys” tab in the upper left corner of the admin pages. Among other things, on the survey pages, you can update your items by reuploading the item tables or resynchronizing the Google Sheets after making changes. In addition, you can use the preview to see what the survey will look like to your participants.
Step 4: setting up the study—the formr run
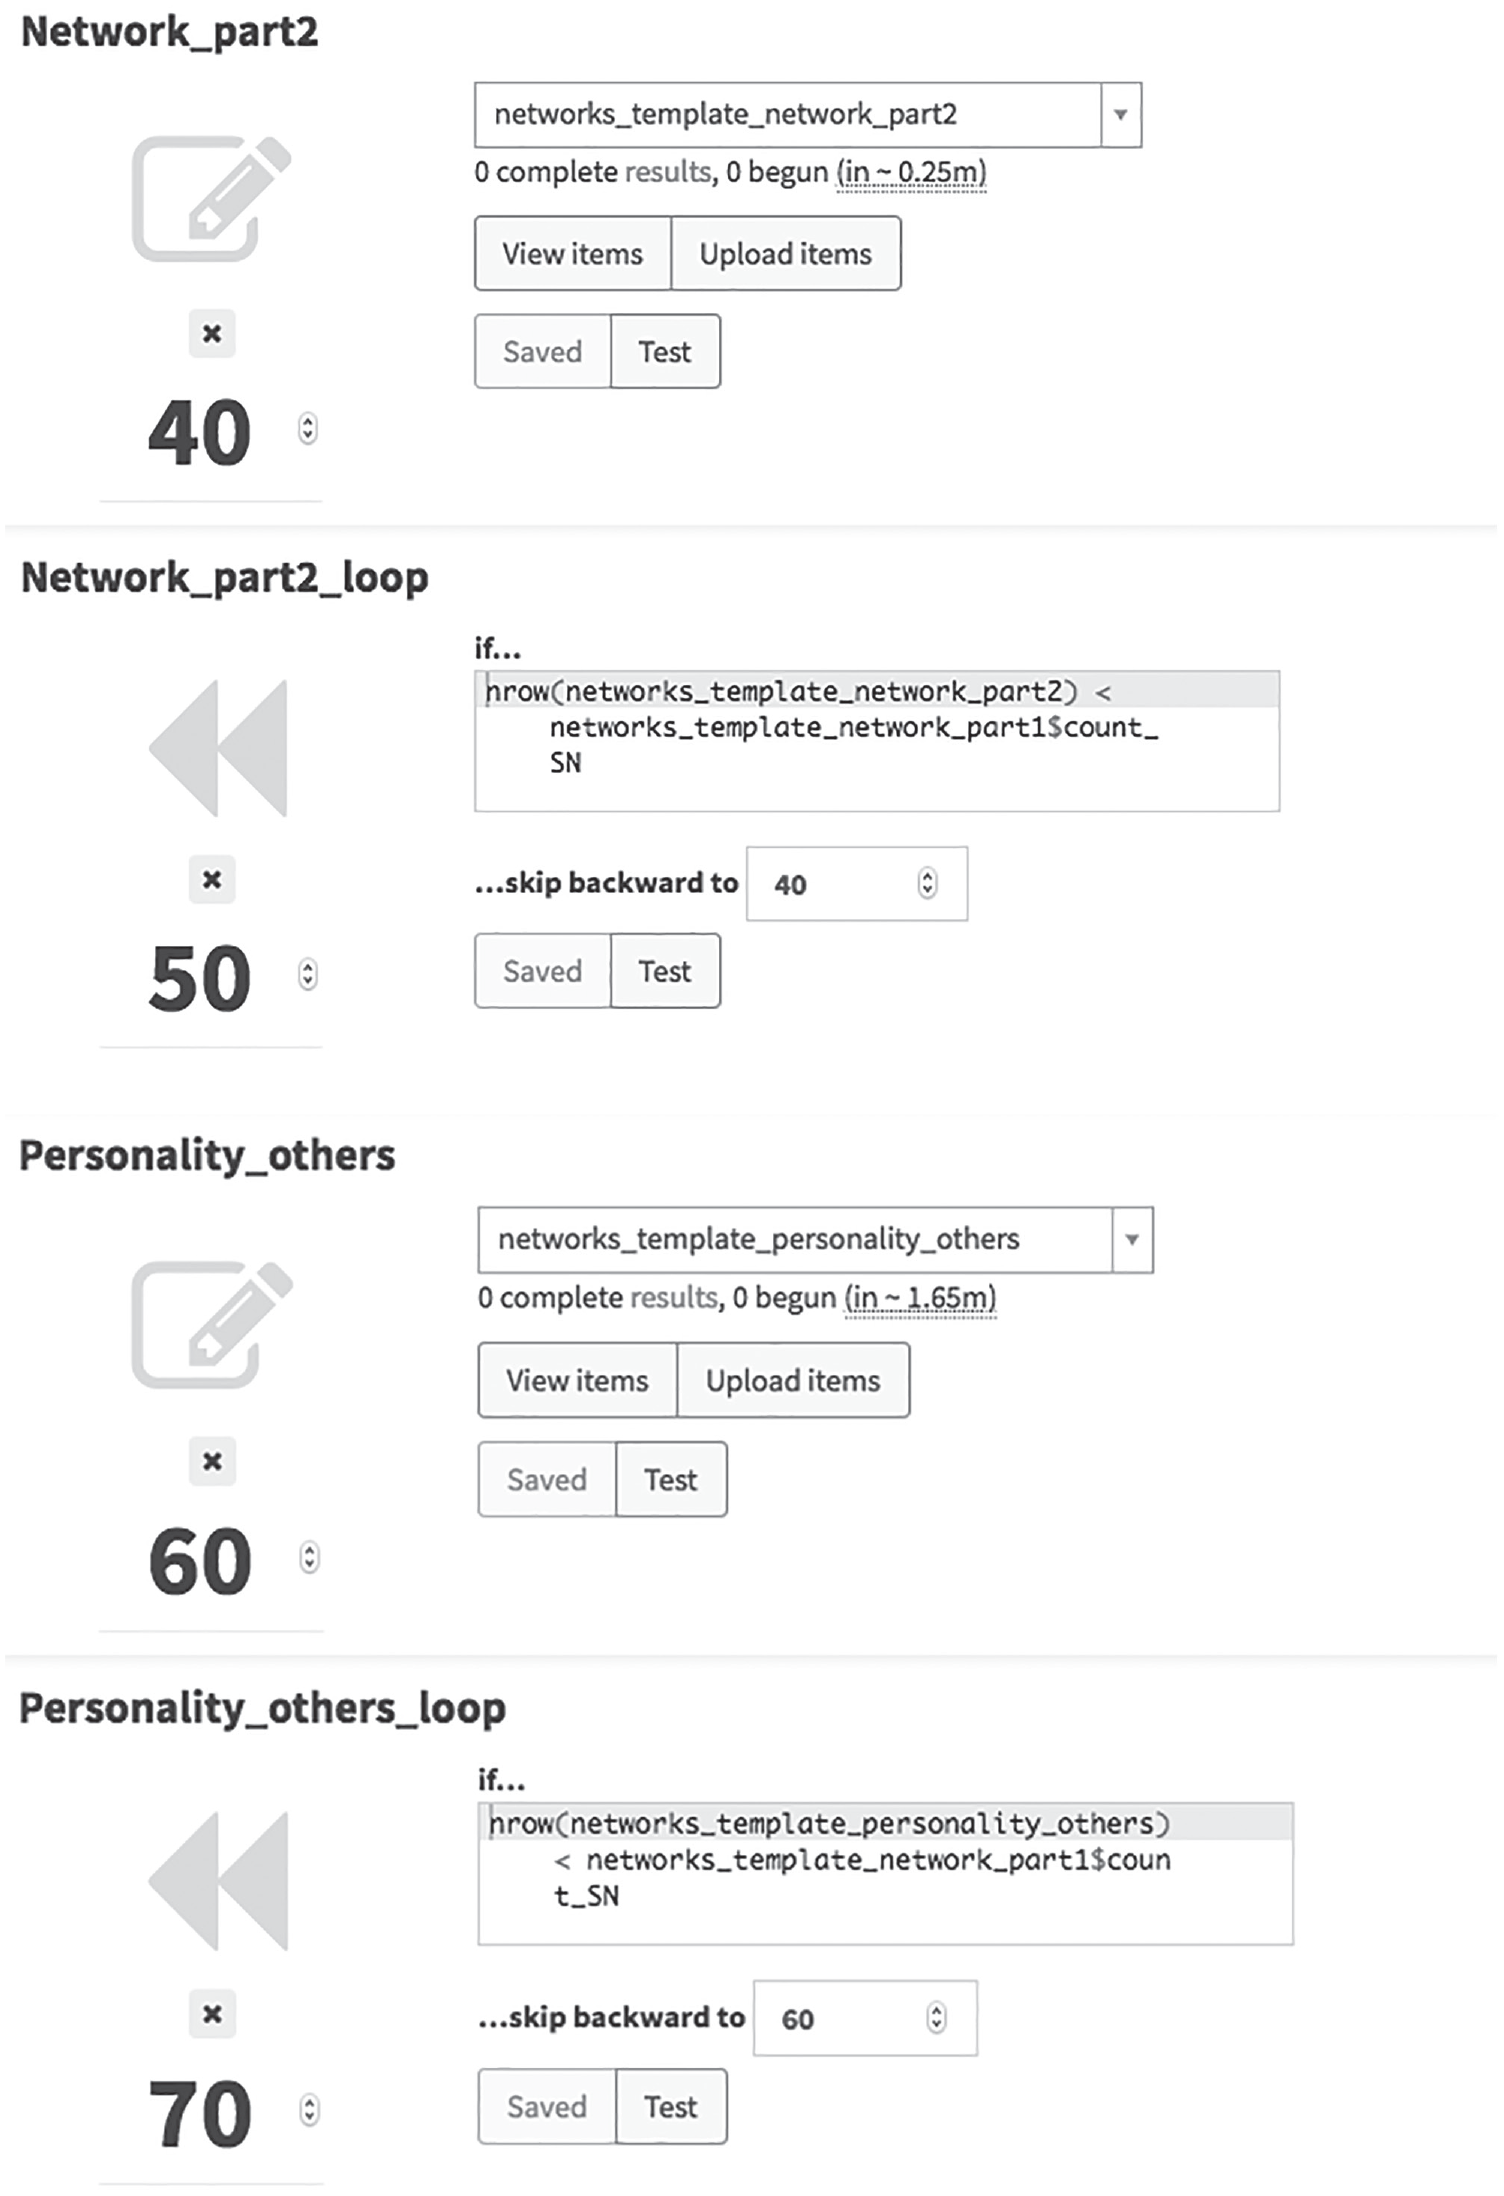
After uploading the spreadsheets that are going to make up your study, you need to bind these different elements together using the study control framework. This is done by creating a new run. To do so, select “Create Run” on the admin page and enter a meaningful name for your run. 13 The formr study control framework is built up as a simple programming environment, where you define the chronological order of your run modules (e.g., your different surveys) by using if conditions and GOTO statements. Figure 4 shows what the study control area looks like (when no modules have been added yet).
Screenshot of the study control (run) area.
As you can see from Figure 4, there is a toolbar depicted at the bottom of this page. The six rightmost symbols of this toolbar resemble a tape deck’s controls and represent the following modules, which allow you to control the chronology of your study: Skip Backward (Loop), Pause, Skip Forward (Jump), Waiting Time, Shuffle, and Stop. The Stop module is used to create a study’s end page, whereas you can make participants wait for a certain time by adding a Pause module or send out reminders by using the Waiting Time module. You can send your participants to different parts of your study by defining if statements for Skip Forward and Skip Backward modules, for example, if specific parts of your study should be shown only to people fulfilling certain criteria. Using the Shuffle module, you can randomly assign participants to different groups. The leftmost symbols in the toolbar allow you to add your different surveys as modules to the run (pencil symbol) or to make external calls (e.g., sending participants to another survey software, sending out text messages; arrow symbol) and send e-mails (letter symbol).
To build up our template study’s run, we need to create five separate Survey modules for each of our different survey pages, two Skip Backward modules to loop the survey pages asking for in-depth information about the relation to the network members and their personality, 14 and a Stop module for our end page. As you add new modules to your run, they will be positioned in the order they were added and given the numbers 10, 20, 30, and so forth. To change the position of a module after adding it to your run, change these numbers accordingly and save the new order by clicking “Reorder” in the upper left corner of the page (see Fig. 4).
Figure 5 shows an example of what the run modules for our sample study looked like (with modules 10, 20, 30, and 80 not being depicted). To build up our run, we start by just adding the survey sheets as new modules to our run (simplest in their chronological order, i.e., “networks_template_demography,” “networks_template_personality_self,” “networks_template_network_part1,” “networks_template_network_part2,” and “networks_template_personality_others”) by clicking on the pencil symbol and each time choosing the respective survey from the drop-down list. As mentioned before, Skip Backward modules (loops) are used to send participants back to certain positions in the run if certain conditions are met. In our sample study, we use such a loop to send our participants back to the survey page asking for additional information about the network members (“networks_template_network_part2”) as long as they had not yet provided more information about all of the people they had listed. This is the case as long as the number of rows in the respective results sheet is less than the number of people the participant has listed. Therefore, we create a new Skip Backward module by clicking on its symbol in the toolbar, and we put “nrow(networks_template_network_part2) < networks_template_network_part1$count_SN” into the Skip Backward module’s input field labeled “if . . . ” (see module 50 in Fig. 5). Furthermore, we have to specify that in this case, participants are to be sent back to the respective sheet (“networks_template_network_part2”). Because this sheet is contained in our survey module 40, we put “40” in the Skip Backward modules input field labeled “ . . . skip backward to” (again, see module 50 in Fig. 5). Using the same logic, we add another Skip Backward module to create a loop that sends participants back to the survey page asking about the network members’ personalities until all network members have been rated (see modules 60 and 70 in Fig. 5). If you add these two Skip Backward modules after adding the survey modules, note that you will have to manually reorder them as explained above for them to be correctly positioned in the run. To create a new end page in the form of a Stop module (which is a required feature for every run to end), you need to click on the square symbol in the tape-deck toolbar. On the end page, you could, for example, enter a debriefing for the participants who finished the study or, as in our sample study, create personalized feedback based on data provided by the participants. We will explain how to include feedback on the end page of the study in the next section.
Screenshots of a subset of the run modules of the sample study.
As mentioned earlier, formr allows for easy sharing of reproducible study materials. For example, this can be done by exporting runs as JSON files. These files include the whole structure of the run (and, if desired, also the survey spreadsheets) and can be used to share designs (and spreadsheets) with collaborators or other researchers interested in replicating your design. You can find the JSON files corresponding to our template study in the “Run Settings” folder of this project on the OSF (https://osf.io/sgkwz/). If you do not want to set up the run manually as described above, you can instead select “Import run” after creating a new run and, after downloading the JSON file from the OSF website, upload it here. Note that you will find two JSON files in the OSF folder: one including only the structure and settings of the run and another one additionally including the spreadsheets. If you import the former one, you will still have to add the survey spreadsheets manually to the modules; if you import the latter one, you will directly end up with a fully functional setup of the study.
Optional step: including feedback on the end page of the study
As mentioned earlier, our template study included a page on which participants were asked to rate their own personalities. For this purpose, we used the items of the Ten Item Personality Inventory (TIPI; Gosling et al., 2003). 15 Among other things, this allowed us to provide participants with a feedback of their personality in terms of the Big Five personality traits in comparison with the distribution of values in a reference sample. Figure 6 shows what the feedback looked like to the participants.

Big Five personality feedback as shown to participants on the sample study’s end page. Descriptions of the personality traits (not depicted here) were included to guide interpretation of the graph.
To create feedback appearing on the end page of our study, we have to execute R code in the feedback text field of our end page module in the study control area. Figure 7 shows the code used to create the personality feedback graph. As you can see, the code is preceded and followed by “```,” which indicates that we are now writing a new chunk of R code instead of writing just plain text. In the first line of the first paragraph, we are setting the size of the plots that are going to be created in this chunk. In lines 2 to 5, we are loading the packages that are required to transform the data into an adequate format for plotting (tidyr, dplyr) and to create a graphical representation of the feedback (ggplot2, ggrepel). In lines 6 and 7, we use the command “formr_post_process_results()” to retrieve the data entered in response to our survey spreadsheet called “networks_template_personality_self” and create a new data frame out of these results. The command leads R to automatically identify which items belong to the same scales of our measure and aggregate them into mean scale scores. For this to work, there are certain conventions you need to follow while naming your items. Each item name should consist of the scale name and the position of the item on the scale, with an “R” at the end for reversed items. For example, the two items belonging to the extraversion scale of the TIPI were named “tipi_self_extra1” and “tipi_self_extra2R” in our spreadsheet.

Code used to create personality feedback on the study’s end page.
Because R automatically identified and aggregated the scales for us, we can now continue with transforming these mean scale values according to means and distributions from a reference sample and bind them to our data frame as new variables, as depicted in lines 9 to 18 in Figure 7. In our example, the reference data were taken from Gosling et al. (2003). After doing so, we create a new long format data frame called “big5,” containing only the normed values of our five personality domains (with one row per domain), which we need to plot the data. This is done in lines 20 and 21 of Figure 7. Finally, in lines 23 to 34 in Figure 7, we are using ggplot2 to create a graphical representation of the normed values.
We also added some text around the plot that explains its meaning to participants on the survey end page. This was achieved by putting plain text into the feedback text field of the end page module on the run page.
In addition to this first feedback plot, participants also received graphical feedback about how the time they have known their network members is related to how close they feel to them and about how they perceive their own personality compared with how they perceive the personalities of their network members. Figures 8 and 9 show what these feedback plots looked like to participants. To see the code used to create the additional feedback graphics (including some explanatory comments), you can consult the study’s run settings (as specified in its respective JSON file, which can be found in the “Run Settings” folder of this project on the OSF; https://osf.io/sgkwz/).

Feedback about the relationship between perceived closeness to the network members and the years each network member is known. Fictional data were added for three network members.

Feedback about how the personalities of the network members are perceived in relation to how the focal participant perceives their own personality. Fictional data were added for three network members.
Step 5: testing the study
Testing and meticulous debugging are important steps when implementing a study, in particular if your study includes a more complex design such as assignment to conditions, questions that are adapted to previous answers, or personalized feedback. In formr, there are different ways of testing your study. You can test single surveys or a whole run by yourself by clicking “Test Survey” or “Test Run” in the respective “Testing & Management” tab of the survey and run pages. You can also create test links to let other people test your study or use the test links yourself. To do so, under the same tab, go to “Users” and click on “new test users,” which will make a new browser window pop up. Copy the link in the new window to retrieve the test link. If you or others test your study this way, a little bar, the so-called monkey bar, will appear on the bottom right corner of the page. Using the monkey mode allows you to test the study without filling out every single item by hand—the formr monkey is always at your service and will do it for you! The bar also allows you to enable the display of hidden items and debugging messages, to skip pauses, to navigate between different surveys and other modules, and to delete the test data for a previous module or a whole test user. When the testing mode is on, any errors in the R code will lead to the code and accompanying debugging messages to be shown. 16 If you choose to create “real users” on the “Users” page, you can create named users, for whom there will be neither the monkey bar nor any debugging messages shown when taking the survey.
If you want your study to be tested by other people, you need to remember to make it accessible for others. As depicted in Figure 4, the publicness settings of your study can also be found on the run page. You can choose between four options: You can make the study visible only to yourself, to people with an access code, to people with the study link, or to everyone (by selecting this last option, the study will show up publicly on https://formr.org/studies, too). For others to be able to test your study, you will need to at least set it to public for everyone with an access code, which is also the option we recommend for testing.
Step 6: running the study
After testing your study and making sure everything is working out as intended, you can finally run your study by choosing your desired publicness option (in case it is different from the option you used for testing).
You can see how many people participated in your study so far by looking at the “Users” page already mentioned above. Here, you can also see each user’s progress in the run, send them to different positions within the run, or delete their sessions. If you do not delete all the data after testing your study, you will find both test users and real users listed here. You can nevertheless easily identify test sessions by an “XXX” and animal names in their code 17 (unless you created new “real users” for testing and gave them different names).
The results of your study are stored separately for every survey. To look at the data, go to each survey page and select “Show Results” in the “Testing & Management” section. Here, you will find the results in wide format, where each row contains the data of one participant and the columns refer to the different items in your survey (with a few additional columns including information about the survey participation, e.g., the session ID [session] and when the survey was started [created] and finished [ended]). 18 To download the results, select “Export Results” in the “Testing & Management” section and choose your desired file format.
Optional extension: incorporating GENSI in formr
One strength of formr is that it permits extensive customization, including dynamic client-side programming using JavaScript. This makes it possible to use other existing software as modules in formr. For example, GENSI (Stark & Krosnick, 2017) can be used to elicit the names and relationships of social-network members. GENSI is a JavaScript-based module that allows participants to add their social-network members in a graph. Although GENSI can also be used to record demographic information and ratings, it especially excels at collecting network variables, such as recording who knows whom in a network, which can be recorded by drawing connections between nodes in the social network. Network information recorded using GENSI can then be used in the subsequent formr-based study to generate further questions and feedback. Figure 10 shows an example of what incorporating GENSI in formr can look like. Here, the names of the network members, their sex, and connections between the different network members can be added into a graphical network representation. By selecting the tab “+friend,” the network members’ names can be added as nodes to the network, and by clicking on the respective nodes, each network member’s sex can be indicated (the color of the node will change). 19 By selecting the tab “Connection,” connections between the different network members can be drawn by clicking on their respective nodes. If you continue to the next page afterward, you will be shown how all of this graphically retrieved information will be stored in formr. The code to create this example’s respective run is provided as a JSON file and can be found in the “GENSI Incorporation” folder of this project on the OSF (https://osf.io/sgkwz/).

Screenshot of sample implementation of the Graphical Ego-Centered Network Survey Interface (GENSI) in formr. Information about seven fictional network members was listed.
Discussion
In this tutorial, we demonstrated how to assess ego-centered social networks online using the open-source software formr (Arslan et al., 2019). When adequately used, assessing social networks can prove to be a valuable tool for the investigation of research questions relating to various fields of psychology and beyond. The online assessment of social networks allows researchers to reach out to large and diverse populations, to collect data fast and cost-effectively, and—an advantage of particular importance for the assessment of ego-centered social networks—to automatically adapt instructions or questions to participant’s earlier responses (Kraut et al., 2004). However, online assessments of social networks might be hard for researchers to implement.
Therefore, in this tutorial, we provided detailed instructions on how to set up, test, and finally run a study assessing ego-centered social networks using the open-source software formr. Advantages of using formr are that it is openly accessible and integrated with the programming language R, and that it readily entails all functions needed to assess basic as well as more sophisticated ego-centered social networks. To guide readers through our tutorial, we provided a template for a fully functional study assessing a basic ego-centered support network, which can easily be adapted for other research purposes; for readers familiar with R and JavaScript, we also discussed valuable extensions to the template’s design, such as the inclusion of personalized feedback and the incorporation of an existing JavaScript-based graphical social-network assessment tool.
Although assessing ego-centered social networks online has many advantages, there are limitations to it as well. Whereas some of these concern online data collections more broadly, other limitations pertain to ego-centered social networks in particular. Possible problems of online surveys include biased samples (e.g., it might be hard to reach elderly people), participant dropout and self-selection, lack of control over the environment in which the study is completed, and reduced possibility to assist participants when problems or difficulties in understanding the instructions occur. In addition, it may be hard to monitor the effects of the assessment on the participants. This can become problematic if sensitive subjects are directly investigated or more indirectly triggered by the content of the social network. Furthermore, online data collection makes it tempting to assess a large amount of data, yet the creation of overly long surveys may place a high burden on participants and even result in poor or missing data (e.g., Converse & Presser, 1986; Valente, 2002). These issues should be carefully considered by researchers who decide to assess social networks using online studies.
Concerning the assessment of ego-centered social networks itself, one should bear in mind that this assessment ultimately rests on self-reports of individuals and might thus be prone to the same biases (e.g., Eagle et al., 2009). For instance, participants might be unable to correctly recall all network members asked about in the instructions and/or be biased toward listing people they have stronger bonds with (Marsden, 1990). Where possible, such issues might be addressed by having participants report their interactions on a daily basis using diary designs (e.g., Holzleitner et al., 2019) or by additionally relying on objective measures such as mobile phone data (e.g., Eagle et al., 2009). In addition to the problems arising from the self-report nature of ego-centered networks, previous studies have shown that the way the network is asked about can heavily influence which people are considered to be part of the network and thereby the composition, size, and density of the reported network. This can threaten the validity of results if researchers are unaware of the effects of their particular method of eliciting the network of interest. For example, whether researchers use a single name generator or multiple name generators might influence whether participants come to think only of people they feel close to and frequently are in contact with or whether they will also list people they might not have thought of at first. Likewise, rather vague name generators (e.g., “people one discusses important matters with”) might not be interpreted in the same way by all participants (i.e., some participants might think of people they discuss personal matters with, whereas others might, rather, think of work-related issues; Bailey & Marsden, 1999) and thus lead to more subjectively defined networks compared with rather unambiguous name generators (e.g., “all people one talked to at work during the last three days”). In addition, whether name generators are based on behavioral or emotional content or the order in which name interpreters are administered (i.e., additional questions ordered by members of the network vs. ordered by the attributes to be rated) may also influence participants’ understanding of what they are to report on (Coromina & Coenders, 2006; Kogovšek & Ferligoj, 2005). Thus, researchers should give careful thought to how they are going to elicit their network of interest and to inquire further information from participants. One possible way to approach this is by extensively pretesting your method of assessing the network of interest (i.e., instructions, name generators, and name interpreters). Face-to-face interviews that precede major online data collections can be used to ensure that name generators and name interpreters work as intended. In addition, face-to-face pretesting might also help to address some of the problems arising from the online collection of data more generally because it can help to ensure that instructions are understandable and that participants do not experience any negative effects because of the assessment (Kraut et al., 2004).
Despite its possible problems, which should carefully be considered by researchers planning to implement this tool, the online assessment of ego-centered social networks also opens up a number of interesting avenues for future research. Whereas the template study used in our tutorial assesses concurrent networks in the context of a cross-sectional study, important extensions to this design can be implemented using formr in its current version. In a longitudinal design, for example, one could also use the tool to investigate how the composition of networks changes over time. Impressive examples of such designs, implemented in formr, can be found in Borschel et al. (2019) and in Greischel et al. (2016, 2018), who investigated how social relationships, identity, and personality change in young adults during times of residential and international mobility. Another longitudinal extension of the ego-centered social-network design implemented in formr was used by Holzleitner et al. (2019), who investigated whether women tend to avoid male kin during their fertile phase. Here, names were not elicited in name generators but through experience sampling of daily contact with people, in which frequently mentioned names were then rated in depth after the conclusion of the experience-sampling period. This approach can reduce the previously discussed problem of recall bias for social-network members but is, of course, not suited for all research questions. Apart from these examples, studies assessing social networks in such a longitudinal manner remain relatively sparse.
An additional promising avenue would be to move beyond self-reports of the focal person by recruiting the network members into an extended social-networks study. As mentioned before, the incorporation of peer reports may increase the validity of network data by reducing the need to solely rely on focal self-reports. In addition, having network members provide information about themselves or the relationship to the focal person allows for the investigation of a new range of interesting research questions; for instance, one might investigate how similarities or differences in self-reported personality influence the perceived quality of the relationships between a focal person and the focal person’s network members or which factors influence whether a focal person and the focal person’s network members agree on the quality of their relationship. However, researchers pondering such an extended social-networks study should bear in mind that successful recruitment of peers might require additional incentives. Depending on funding for the project, one might consider including peers into schemes for monetary compensation, lotteries, and the like. In formr, again, offering an interesting, personalized feedback to peers based on their own answers seems to be an especially viable way to increase cooperation.
Finally, in experimental studies, one could incorporate the generation of (different) networks as the core manipulation. For instance, a researcher interested in the malleability of self-presentation could instruct participants to generate either a professional network or a network of friends and then investigate whether and how this might change how participants present themselves (e.g., in the first case, participants might emphasize agentic traits, whereas communal traits might be accentuated in the latter). This way, even for researchers not usually concerned with networks themselves, the assessment of social networks might constitute an interesting tool that allows for the implementation of particularly creative study designs.
To sum up, when adequately used, assessing social networks online can prove valuable for investigating research questions relating to various fields of psychology. By providing this tutorial and by basing it on the open-source framework formr, we hope to democratize the ability of researchers from different backgrounds to collect social-network data and encourage scholars to make use of this fascinating design in their own research.
Footnotes
Appendix
Key Questions to Consider When Planning a Social Network Study (Summary of All Considerations Addressed in the Considerations in Advance and Discussion Sections)
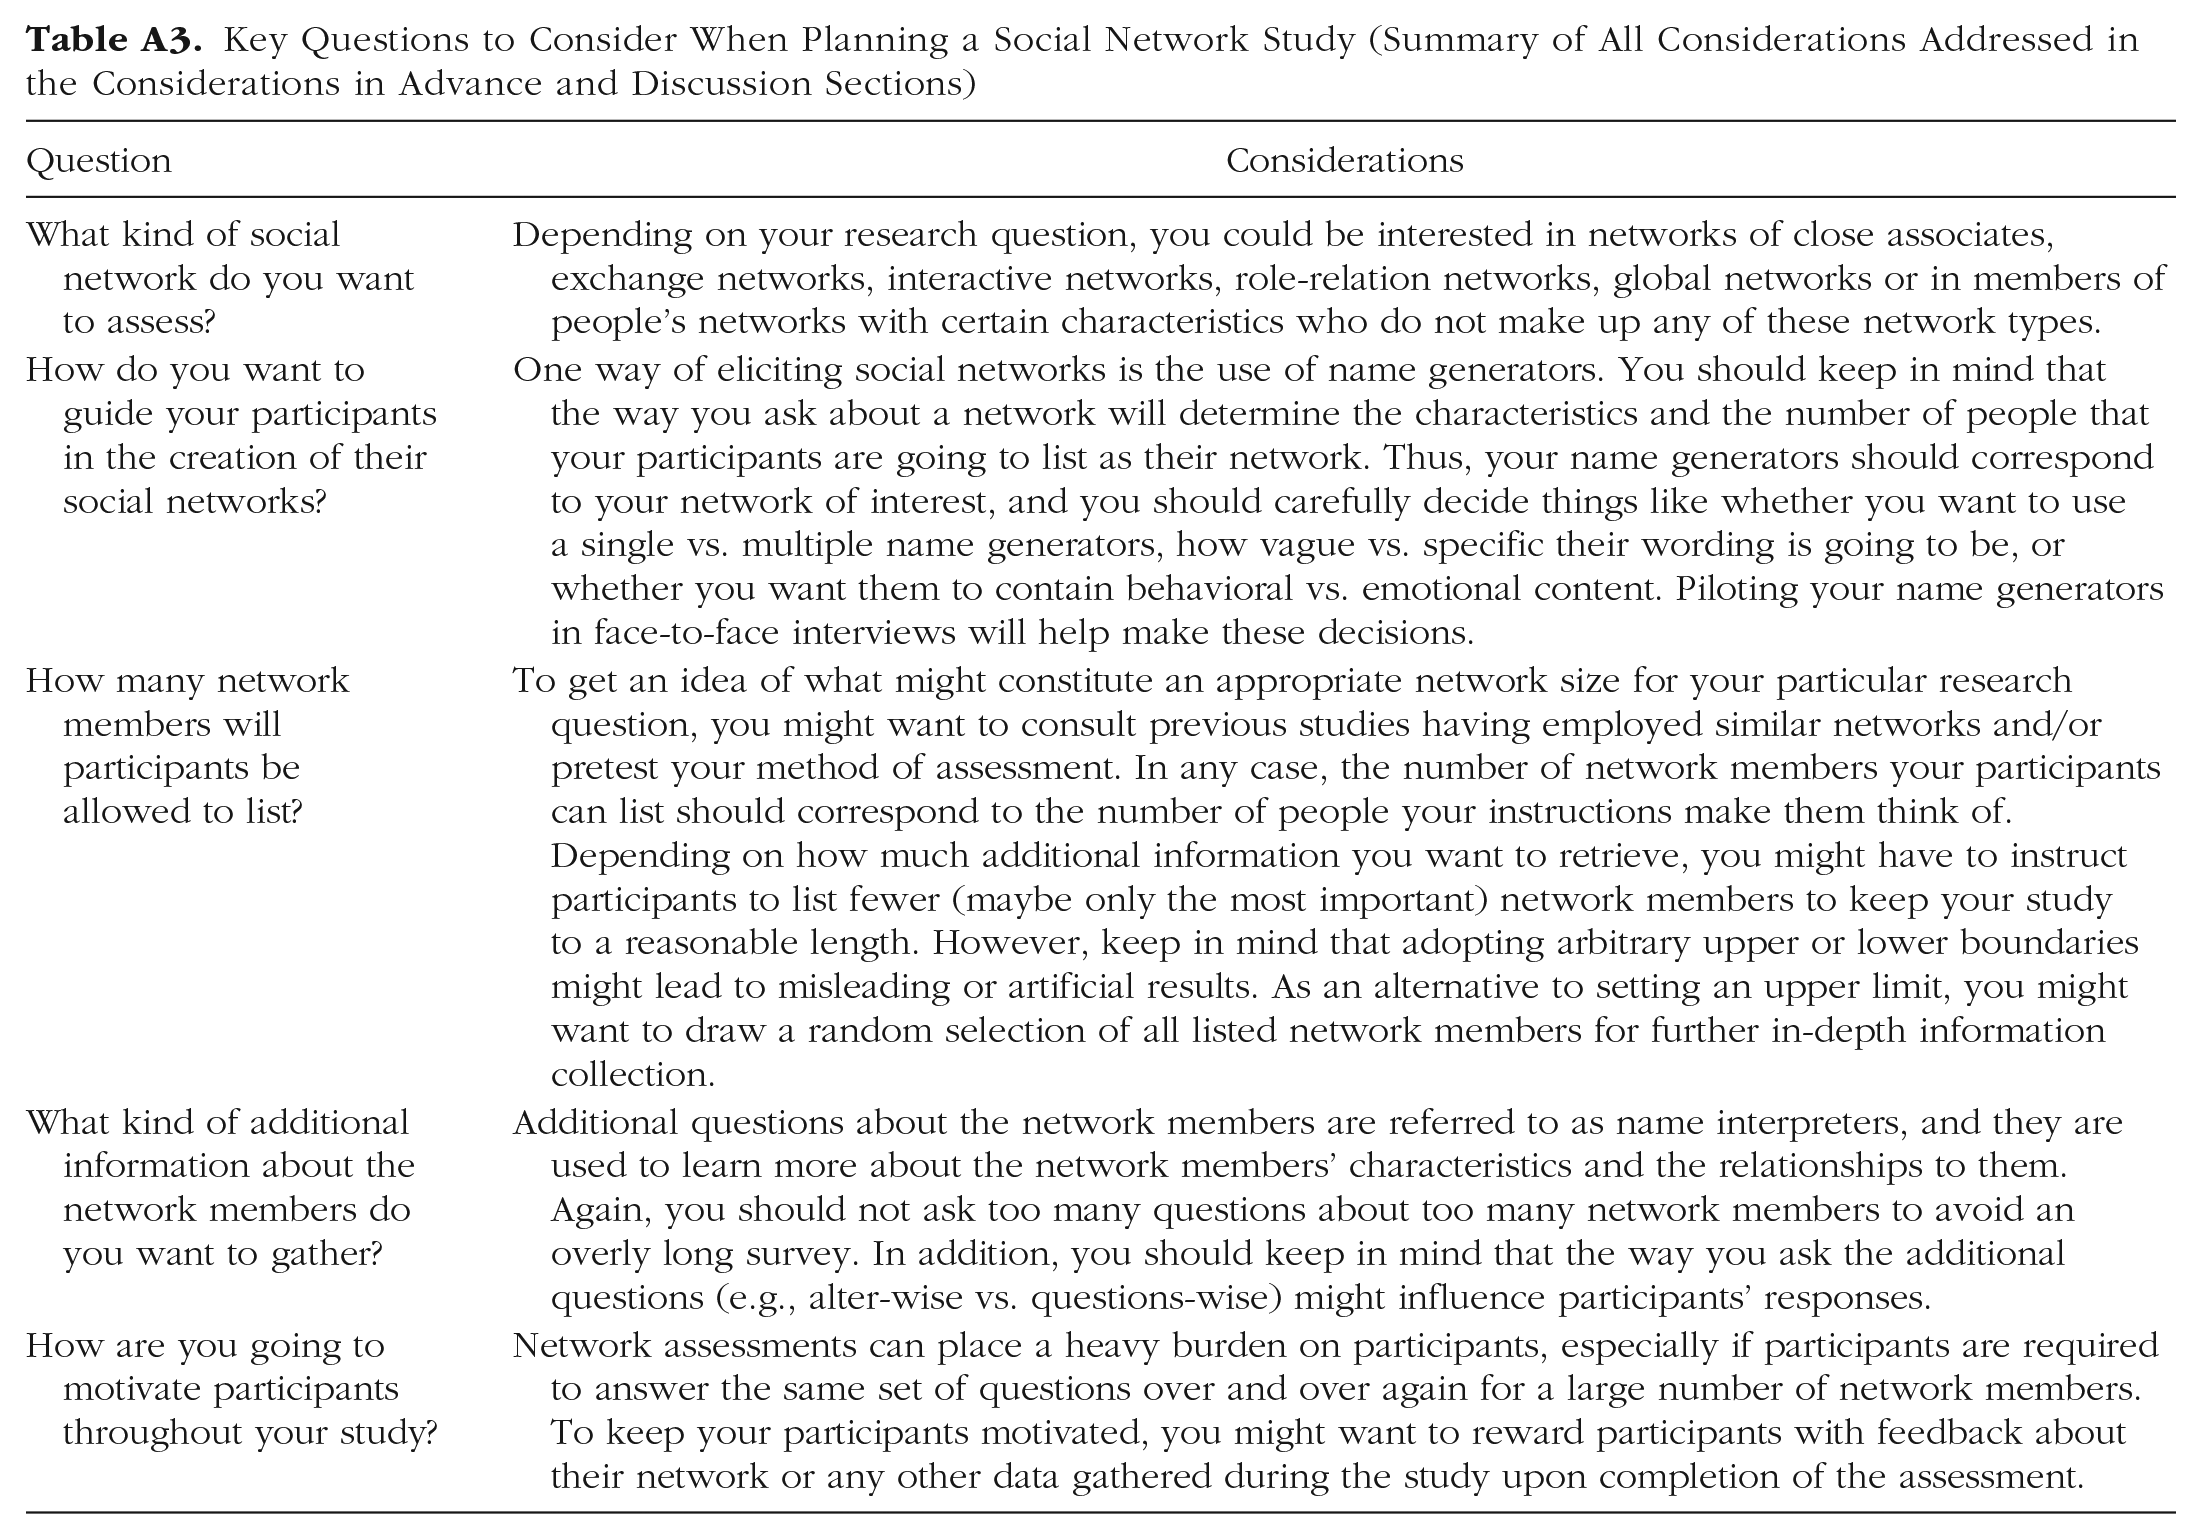
| Question | Considerations |
|---|---|
| What kind of social network do you want to assess? | Depending on your research question, you could be interested in networks of close associates, exchange networks, interactive networks, role-relation networks, global networks or in members of people’s networks with certain characteristics who do not make up any of these network types. |
| How do you want to guide your participants in the creation of their social networks? | One way of eliciting social networks is the use of name generators. You should keep in mind that the way you ask about a network will determine the characteristics and the number of people that your participants are going to list as their network. Thus, your name generators should correspond to your network of interest, and you should carefully decide things like whether you want to use a single vs. multiple name generators, how vague vs. specific their wording is going to be, or whether you want them to contain behavioral vs. emotional content. Piloting your name generators in face-to-face interviews will help make these decisions. |
| How many network members will participants be allowed to list? | To get an idea of what might constitute an appropriate network size for your particular research question, you might want to consult previous studies having employed similar networks and/or pretest your method of assessment. In any case, the number of network members your participants can list should correspond to the number of people your instructions make them think of. Depending on how much additional information you want to retrieve, you might have to instruct participants to list fewer (maybe only the most important) network members to keep your study to a reasonable length. However, keep in mind that adopting arbitrary upper or lower boundaries might lead to misleading or artificial results. As an alternative to setting an upper limit, you might want to draw a random selection of all listed network members for further in-depth information collection. |
| What kind of additional information about the network members do you want to gather? | Additional questions about the network members are referred to as name interpreters, and they are used to learn more about the network members’ characteristics and the relationships to them. Again, you should not ask too many questions about too many network members to avoid an overly long survey. In addition, you should keep in mind that the way you ask the additional questions (e.g., alter-wise vs. questions-wise) might influence participants’ responses. |
| How are you going to motivate participants throughout your study? | Network assessments can place a heavy burden on participants, especially if participants are required to answer the same set of questions over and over again for a large number of network members. To keep your participants motivated, you might want to reward participants with feedback about their network or any other data gathered during the study upon completion of the assessment. |
Acknowledgements
We thank Gert Stulp for sharing his extension of the Graphical Ego-Centered Network Survey Interface (GENSI). We also thank Antonio Amaddio and Felix Lappe for setting up the proof of concept for an implementation of GENSI in formr. Furthermore, we thank Isa Garbisch for testing the tutorial and providing feedback for its improvement.
Transparency
Action Editor: Frederick L. Oswald
Editor: Daniel J. Simons
Author Contributions
L. M. Reins wrote the first draft of the manuscript and created the online material for the tutorial. R. C. Arslan provided the code for the feedback graphics, helped with the online material, and provided critical revisions of the manuscript. T. M. Gerlach came up with the idea for the tutorial, gave advice regarding its conceptualization and input regarding the online materials, and provided critical revisions of the manuscript. All of the authors approved the final manuscript for submission.