
Abstract
A psychology article’s p values say a lot about how its studies were conducted and whether its results are likely to replicate. Examining p values across the entire literature can, in turn, shed light on the state of psychology overall and how it has changed since the start of the replication crisis. In the present research, I investigate strong (p < .01) and weak (.01 ≤ p < .05) p values reported across 240,355 empirical psychology articles from 2004 to 2024. Over this period and across every subdiscipline, the typical study has begun reporting markedly stronger p values. Nowadays, articles reporting strong p values are also more often published in top journals and receive more citations. Yet it also appears that robust research is still not correspondingly linked to career success given that researchers at the highest ranked universities tend to publish articles with the weakest p values. Investigating language usage suggests that two-thirds of this association can be explained by highly ranked universities preferring laborious, expensive, and subtle research topics even though these generally produce weaker results. Altogether, these findings point to the strength of most contemporary psychological research and suggest academic incentives have begun to promote such research. However, there remain key questions about the extent to which robustness is truly valued compared with other research aspects.
The replication crisis revealed that many of psychology’s seminal studies do not replicate (Doyen et al., 2012; Open Science Collaboration, 2015). These replication failures prompted many discussions of how questionable research practices produce nonreplicable findings (Francis, 2012; John et al., 2012; Simmons et al., 2011; Wagenmakers et al., 2011). Consequently, new scientific standards were proposed (Hales et al., 2019; Nosek & Lakens, 2014; Schimmack, 2012; Simmons et al., 2012; Van’t Veer & Giner-Sorolla, 2016). It has been a decade since the replication crisis reached widespread awareness. Has the subsequent push for replicability produced meaningful changes? I investigate this question and the current state of psychological science from different angles.
Key aspects of replicability can be studied by examining the strength of an article’s p values (Krawczyk, 2015; Lakens, 2015; Van Assen et al., 2015). For instance, it is problematic if an article frequently reports p values that barely fall under significance thresholds (.01 ≤ p ≤ .05). Even in a study with merely 50% power, most p values should fall under .01, and in studies with 80% power, just 26% of significant results should land in this .01 ≤ p ≤ .05 interval (per simulations). If such p values are instead commonplace, this points to questionable research practices (Simonsohn et al., 2014). One prior study of 103 replication attempts indeed found a 74% replication rate for findings reported at p ≤ .005 and a 28% replication rate for findings at .005 < p < .05 (Gordon et al., 2021). Hence, p values can be extremely informative.
In the present research, I track p values across the whole of psychology and how reported p values may have shifted since the replication crisis began. Prior meta-analyses have operated on smaller scales, focusing on narrower topics, restricted pools of journals, or limited time ranges (Boggero et al., 2017; Olsson-Collentine et al., 2019; Pritschet et al., 2016; Schimmack, 2020; Stuart et al., 2019; Vadillo et al., 2016; Youyou et al., 2023). I instead use an original data set that extends from 2004 to 2024 and is the largest of its kind, covering most of the nonpredatory psychology literature. This expansive size opens the door to new and more comprehensive inquiries.
Along with investigating how p values have changed over time, I leverage p values to inspect the value structure of academic psychology. Discussions of incentives are part and parcel of replication-crisis commentary (Asendorpf et al., 2013; Nosek et al., 2012, 2022). At the most basic level, loosening standards for replicability may increase the quantity of research output and its perceived innovativeness. Looser standards may produce articles that are published in higher ranked journals and accumulate more citations, which may ultimately allow authors to achieve more prestigious university positions. Alternatively, if academic psychology emphasizes robust results, the opposite may be the case such that even a researcher acting purely in self-interest would benefit from practicing replicable science. Creating this type of incentive structure has been described as an important end goal of the replicability movement (Nosek et al., 2022). Yet, it remains unclear where the field currently stands relative to this goal.
To shed light on these topics, my investigation focuses on the percentage of articles’ significant p values (ps < .05) that are “fragile” (.01 ≤ p < .05), narrowly crossing the typical threshold for significance. After validating that this percentage predicts replicability, I use this measure to investigate three sets of questions. First, since the replication crisis began, has psychology begun to publish statistically stronger results? Second, does contemporary psychology provide incentive for strong results—that is, do articles reporting strong p values find publication in higher impact journals and accrue more citations, and are its authors affiliated with top-ranked universities? Third, to contextualize findings on the first two questions, how may p-value strengths and these incentives relate to the research topics, hypotheses, and methodology used by different authors?
Method
Disclosures
The present research was not preregistered. The number of articles acquired was designed to be as large as possible while respecting publishers’ terms and conditions. Before collecting the full data set, some preliminary analyses were done using a subset of the data, which are not reported—for example, attempting to study researchers moving between universities or investigating national gross domestic product as a predictor of p values. Given the exploratory nature of the present research, a threshold of α = .001 was employed for analyses by default; this did not apply to tests that formally implemented multiple comparison correction, which used corrected p < .05. This research was exempt from approval by the local institutional review board.
Data collection
The original data-set generation procedure is shown in Figure 1 along with descriptive stats of the final data set. To generate an initial list of possibly usable articles, metadata were downloaded from Lens.org, which is a free online platform that attempts to compile information on all scholarly records. The database contained 643,571 records from psychology journals between 2004 and 2024 among publishers amenable to downloading full-text articles (Elsevier, SAGE Publications, Springer-Nature, Wiley, and Frontiers). The lower bound was 2004 because before then, few journals published web versions of full-text articles (PDFs were not included in this data set). This pool was pruned to 372,633 empirical articles by searching only for records containing a results section published in journals that regularly publish empirical articles. Of articles in this pool, at least one p value was extracted for 269,018 articles (72.2%). For the analysis, this pool was further pruned to 240,355 articles containing at least two significant p values because the focus was on significant results and because requiring two p values avoided articles simply mentioning a threshold offhand (e.g., “p < .05”). Citation counts were available for all articles, although journal reputation scores (see below) were not available for 16,796 articles, and no university affiliations were found for 79,298 articles. All incentives variables were available for 150,344 articles, spanning 384 journals and containing 16.8 p values on average (SD = 14.8, Mdn = 13). For additional details on data set collection and organization, see Section 1 of the Supplemental Material available online.
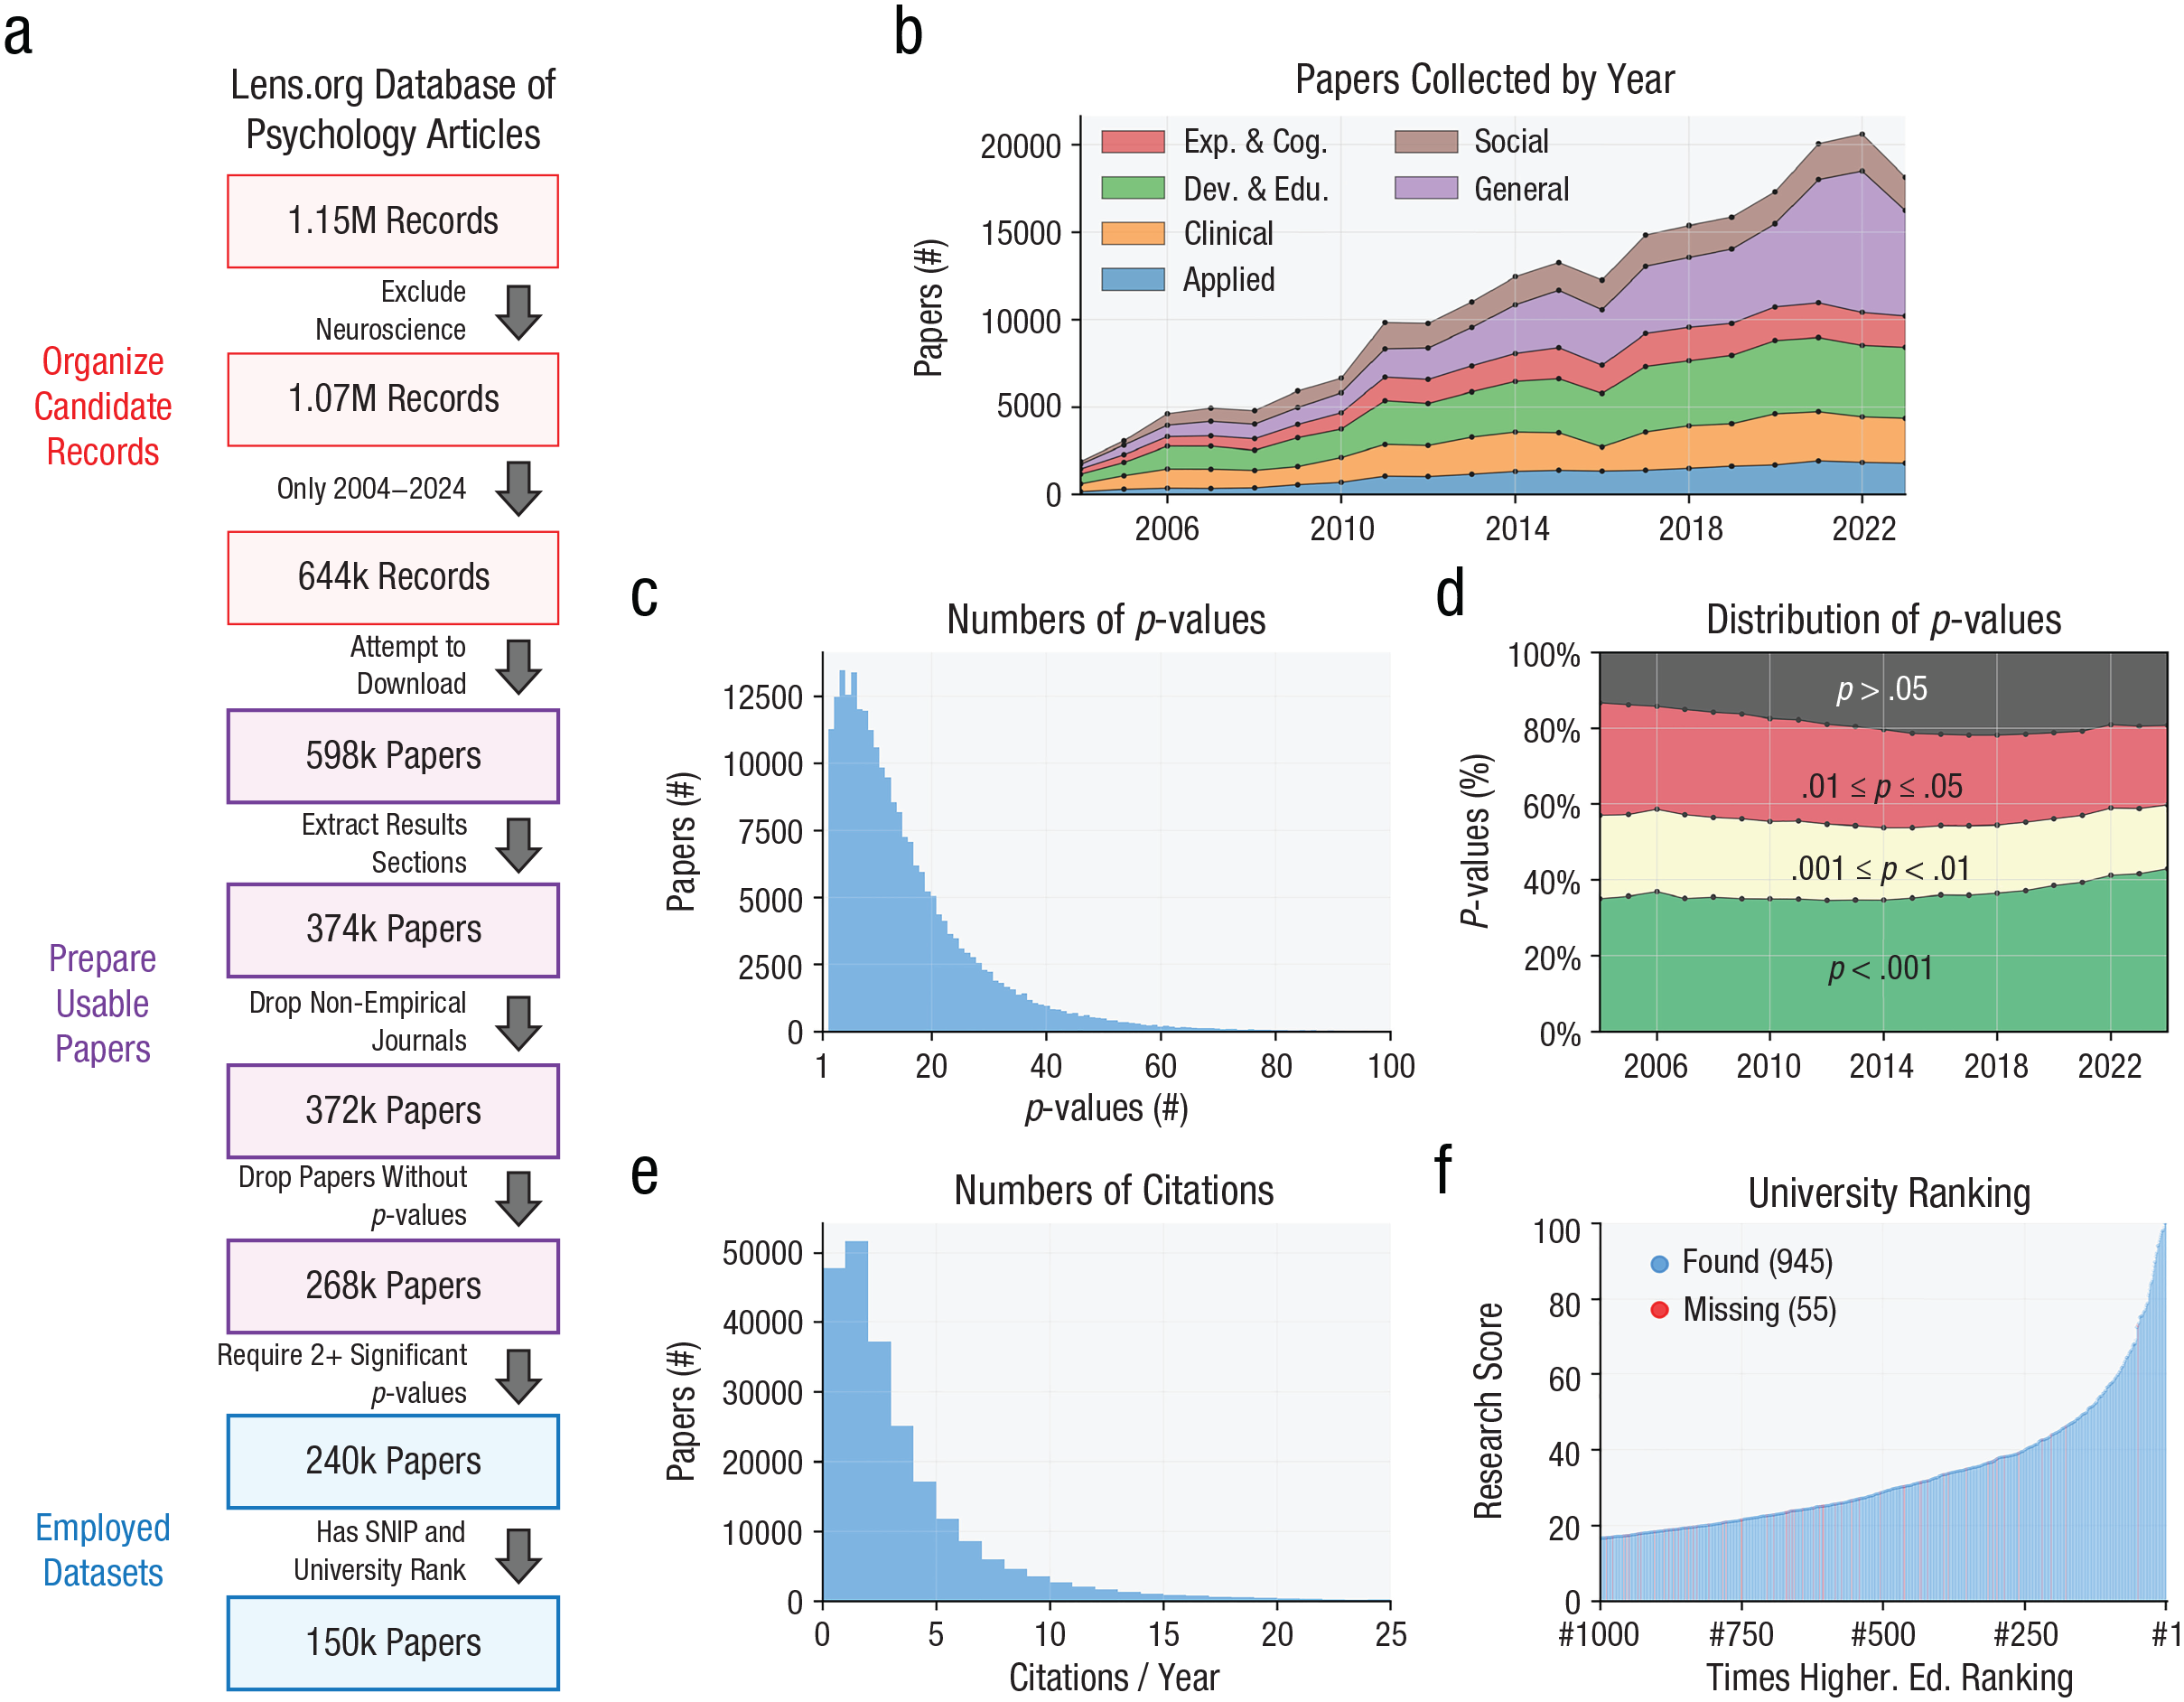
Summary of the organized data set. (a) Flow diagram showing how the final data set was built over several stages. (b) A stacked plot showing the number of articles collected each year from each psychology subject area; articles from journals with two or more areas contributed to both counts but were weighted proportionally because the primary aim is to report the overall number of articles; articles from 2024 were excluded because this year was collected only up to August. (c) A histogram of how many p values each article contained. (d) A breakdown of the percentage of p values each year falling in different p-value ranges. (e) A histogram of how many citations each article received per year since publication. (f) A plot of each university’s Times Higher Education ranking and its associated research score; universities were colored to denote ones that were found in the data set. Exp. & Cog. = experimental and cognitive psychology; Dev. & Edu. = developmental and educational psychology.
Analysis overview
Articles were downloaded as HTML/XML files. The articles were parsed, and p values were extracted. Variables related to incentives were gathered (journal reputation, citation counts, university ranking). After several validation tests were conducted, three main branches of analysis were done: (a) examining changes in psychological results over time by plotting temporal trends in p values and other variables; (b) examining the link between p values and each incentive variable; and (c) analyzing how these variables relate to research topics and methodology by tracking articles’ word usages. The organized data set (https://osf.io/mxs47/) and code (https://github.com/paulcbogdan/PsychChange) have been uploaded to public repositories.
p-value and statistic extraction
p-value extraction
After stripping articles down to their results sections (see Section 2 of the Supplemental Material), omitting captions, and removing formatting, p values were extracted with the following regular expression:
Details on the expression and its components are provided in Section 3 of the Supplemental Material. After p-value extraction, the proportion of significant p values falling in the fragile range was calculated for each article as the number of p values between .01 and .05 (.01 ≤ p < .05) divided by the number of p values under .05 (p < .05). The analysis focused only on p values reported with equal (“=”) or less than (“<” or “≤”) signs. “≤” was treated as “<.”
Statistic extraction
In addition to p values, measures describing other outputs of statistical tests were also extracted and assigned to nearby p values. The test-statistic extraction procedure is described in Section 4 of the Supplemental Material. Test statistics (t values, F values, χ2 scores, r values, and z scores) with complete degrees of freedom were extracted for 1,398,189 p values (35.8% of all p values), based on the 240,355 article pool.
The p-value survey
Because articles differed in how they reported p values, a survey was performed, and a taxonomy of reporting styles was developed. For instance, some articles followed the American Psychological Association (APA) style (reporting exact p values unless p < .001), some articles reported a mix of inequalities (e.g., “p < .05,” “p < .01,” and “p < .001”), and some other articles reported significance only as a binary (always “p < .05”). A survey of how many articles fell into these and other categories is described in Section 5 of the Supplemental Material. The only articles that are problematic for the present analyses are the 2.3% of articles that exclusively reported “p < .05” for significant results. For these articles, their fragile p-value percentages were recomputed based on the p values implied by nearby test statistics if available. For “p < .05” articles that did not report any test statistics, their fragile p-value percentage was set at 51%, which was the mean among the “p < .05” articles that reported test statistics. For elaboration on this and discussions of the mild degree of underreporting p values more generally, see Section 5 of the Supplemental Material. To ensure that the present conclusions do not hinge on reporting-style phenomena, tests were also done using p values implied from test statistics (Section 13 of the Supplemental Material).
The main analyses did not distinguish one- versus two-tailed analyses, but this matter is explored in Section 5.2 of the Supplemental Material; although in the main text I focus on significant results, trends related to insignificant results are described in Section 6 of the Supplemental Material.
Validation
Data-set validation was performed in three ways (Section 7 of the Supplemental Material). First, a relatively small pool of 40 articles marked as having at least one p value was manually inspected. In every case, the present approach identified every p value, while properly isolating results sections, ignoring figure/table captions, and accounting for different reporting styles. Second, extracted exact (“=”) p values were cross-checked with the p values implied from nearby test statistics, which produced a tight correlation (r = .97), verifying the accuracy of the p values at a wide scale. Third, data on 113 replication attempts were downloaded, and analyses were performed demonstrating that an article’s fragile p-value percentage strongly predicted its chance of replicating (63.7% cross-validated accuracy).
Incentive variables
Each article was assigned variables representing the three incentives of interest: (a) its journal’s yearly Source Normalized Impact Performance (SNIP), which is a score similar to a traditional impact factor but normalized by the number of citations typically received by articles in the same discipline (Moed, 2010); (b) a log-transformed and year-normalized citation score; and (c) the Times Higher Education 2024 World University Ranking research score assigned to the most commonly listed university on the article (frequency ties broken randomly). The collection and organization of these variables are described in Section 8 of the Supplemental Material. In addition, for the university-ranking measure, see Section 9 of the Supplemental Material for alternative ways of assigning one score to each article (e.g., averaging across schools); the main text conclusions do not change regardless of how this is done.
Multilevel regression analysis
Each article was submitted to three multilevel regressions that (a) used fragile p-value percentages to predict SNIP, (b) used fragile p-value percentages to predict citations while controlling for SNIP, or (c) used the authors’ university-ranking scores to predict fragile p-value percentages. The multilevel regressions’ structures are detailed in Section 10 of the Supplemental Material.
To investigate some of the factors that could bias the regression analysis, several further analyses were done probing other variables that may be relevant. These additional tests covered (a) whether it is more meaningful to examine the total number of fragile p values rather than the percentage, (b) whether authors’ ages could be a confound, (c) whether articles containing results sections but no p values could bias the analysis, and (d) whether articles using Bayesian or machine-learning methods could bias the analysis. These tests are all reported in Section 11 of the Supplemental Material, and none showed patterns challenging the conclusions below.
Language analysis
Text analyses were performed on the sentences preceding each reported p value (details on sentence extraction in Section 12.1 of the Supplemental Material). For each article, the analysis attempted to extract one sentence for each significant p value. Then, for the 2,500 most common words, articles were assigned normalized word-usage scores, computed by counting how many times a word appeared among the article’s sentences and dividing by the total number of words across all the article’s sentences. For each of the 2,500 most common words, a separate linear regression was fit predicting the word’s usage score based on the article’s fragile p-values percentage, for example, normed usage[“the”] ~ 1 + p fragile percentage.
The identification of 2,500 words and the regressions were done four times, separately for sentences reporting t values, F values, χ2 values, or r/β values (see the quantity of each in Section 12.2 of the Supplemental Material).
Using data associated with all p values, irrespective of nearby test statistics, further regressions were also tested that added the year, SNIP, citation, or ranking score as predictors, for example, normed usage[“the”] ~ 1 + p fragile percentage + ranking score.
Although not formally tested, overlapping associations between word usage and two other variables would notably point to statistical mediation (e.g., ranking → word → p values or ranking → p values → word); see Bogdan et al. (2024) for discussion and intuition on the close link between mediation, multivariate distributions, and overlapping in variable patterns.
Results
Fragile p values have declined over time
From before the replication crisis (2004–2011) to today (2024), the overall percentage of significant p values in the fragile range has dropped from 32% to nearly 26% (Fig. 2a). This almost matches the percentage of fragile p values expected from studies with 80% power (see the dashed lines in Fig. 2). A similar trend emerges if the focus is instead placed on the p values’ implied articles’ test statistics (Fig. 2b). Note, the fragile percentage for implied p values is usually 2% to 4% lower than the percentage calculated with reported p values. This partly reflects a selection effect as articles that do not report test statistics tend to put forth weaker findings (furthered probed in Section 13.2 of the Supplemental Material). Regardless, the patterns overall show fragile p-value rates markedly decreasing over time.

Changes in fragile p values over time. (a) The mean fragile p-value percentage for each subfield and year was calculated. Articles were assigned to specific subfields based on their journal’s Scopus classification. Articles in journals associated with two or more subfields contributed to each subfield’s plot (contributed in full, not weighed proportionally). A correction, subtracting 2.3% from the fragile p-value percentage, has been applied to account for articles underreporting the strength of results (e.g., reporting “p < .05” unnecessarily); see Section 5.1 of the Supplemental Material available online. The dashed line at 26% is a reference showing the fragile p-value rates expected from studies with 80% power and α = .05. (b) Mean fragile percentage, calculated using p values implied from nearby test statistics. Shaded regions represent ± 1 SE.
Examining the distribution of fragile p values more precisely suggests that these aggregate shifts derive from the average study reporting fewer fragile p values (Fig. 3); see how the density averages steadily shift leftward over time. However, as the right tails of Figure 3 show, there remain many studies publishing weak p values, suggesting that there have still been issues in eliminating the most problematic research. This deserves consideration despite the aggregate trend toward fewer fragile findings.

Year-wise ridge plots for different subfields. Each column is a series of density plots generated independently for each of the six psychology subfields. Each density plot represents the data for 2 years (e.g., “2004-” corresponds to 2004 and 2015). These year labels are placed at the average of each density plot.
The drop in fragile p values may be driven by increases in statistical power. The median sample size has increased over time (per results’ degrees of freedom; Fig. 4a), and larger samples predict lower p-value percentages (Spearman correlation: ρ = −.22, p < .0001). Effect sizes are also relevant to power, but their relationship to fragile p values is more ambiguous. Reported effect sizes have generally dropped over time (Fig. 4b), and this may reflect effect-size estimates becoming more accurate as larger samples are used; endorsing this idea, the median reported Cohen’s d is strongly negatively correlated with sample sizes (ρ = −.68, p < .0001). Hence, although one may expect weaker effect sizes to be tied to more fragile p-values, the actual association is fairly weak (ρ = −.13, p < .0001) due to the interplay with sample size. Nonetheless, the clearer sample-size trends make a strong case that increases in statistical power may partially underlie the move away from fragile results.
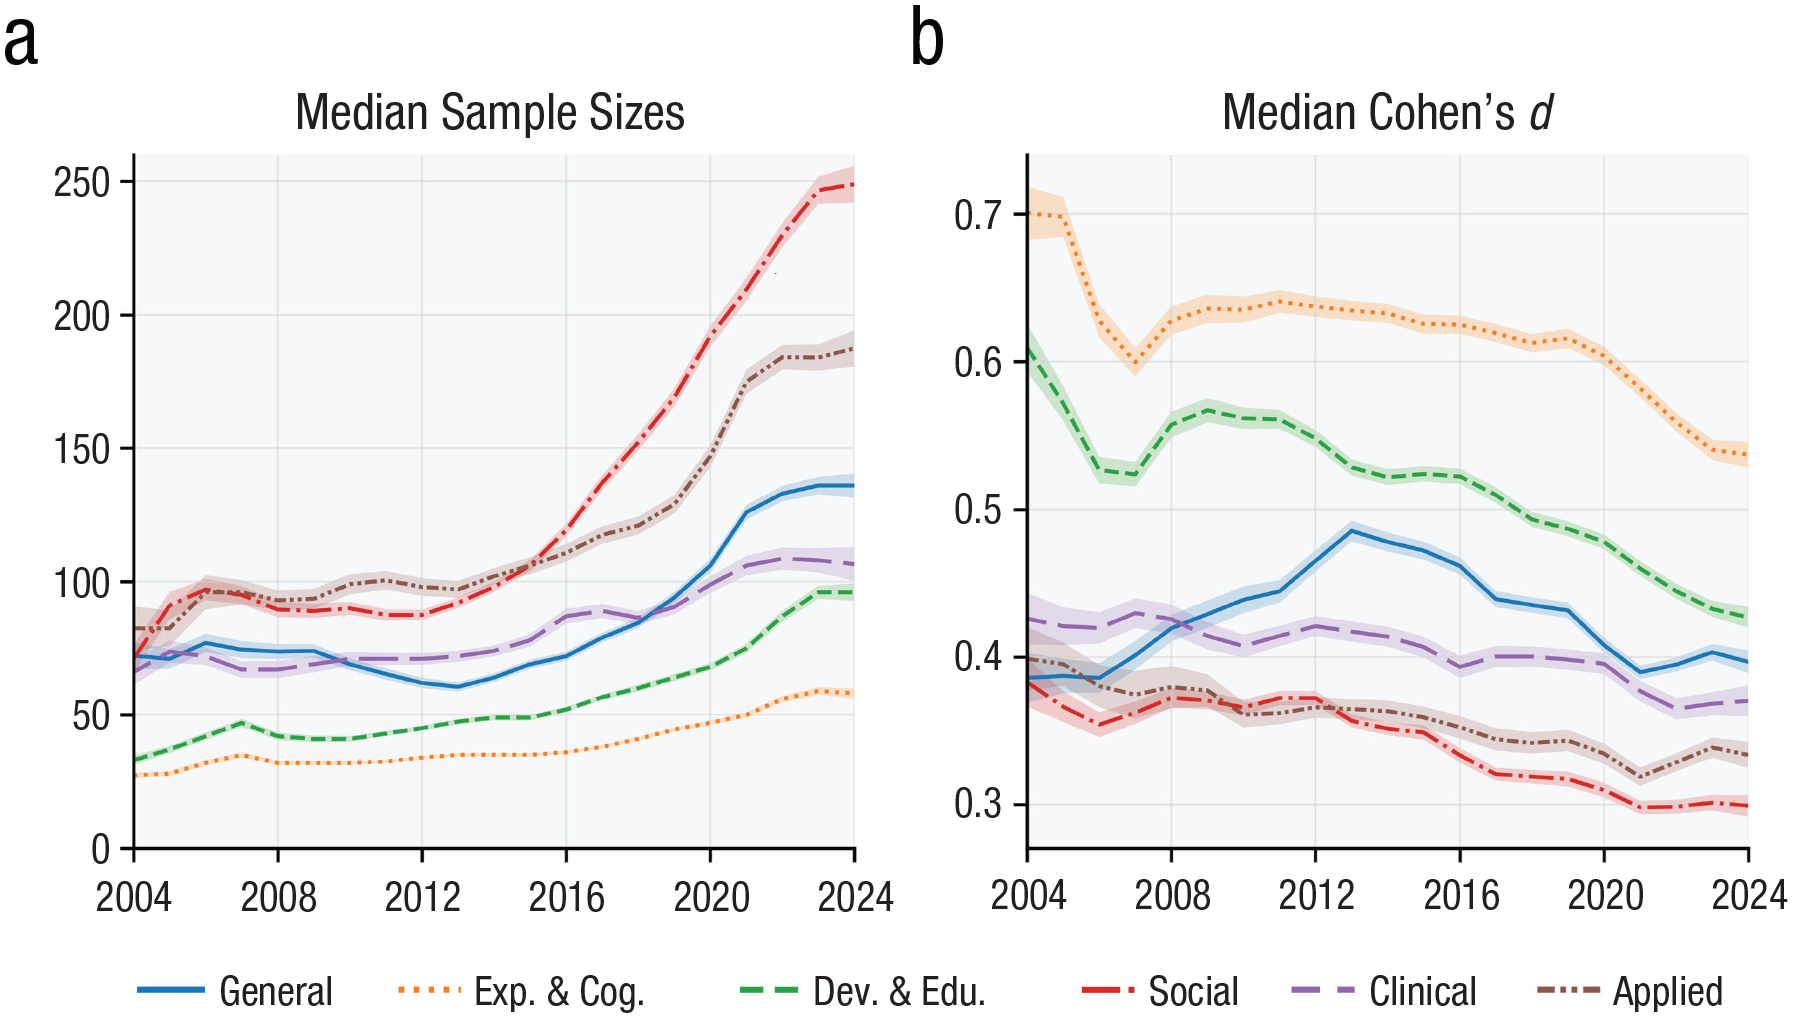
Changes in sample sizes and effect sizes over time. (a) Median of the median sample size used for studies’ t tests (55,342 articles), calculated from t-test degrees of freedom of significant results. (b) Median of the median Cohen’s d of studies’ significant t tests, calculated by dividing t values with the square root of the sample size. Shaded regions represent ± 1 SE.
Fragile p values and incentives
To assess the relationship between fragile p values and academic psychology’s incentives, multilevel regressions were tested linking each article’s fragile p-value percentage with (a) its journal’s SNIP/normalized impact factor, (b) the article’s log-transformed year-standardized citation count, and (c) the university rankings of its authors. The regressions also included interaction terms between each predictor × year to capture whether any relationship changed over time.
All three variables representing academic psychology’s incentives were linked to fragile p values in some way. Fragile p values did not significantly predict SNIP (β = −0.004, 95% confidence interval [CI] = [−0.009, 0.001], B = −0.009, p = .14; Fig. 5a) 1 but showed a significant fragile P Value × Year interaction effect on SNIP (β = −0.009, 95% CI = [−0.010, −0.008], B = −0.0039, p < .0001). In other words, more esteemed journals have historically published articles with weaker results, but nowadays, top journals mostly publish strong findings. On top of this journal effect, articles with fewer fragile p values also receive more citations (β = −0.036, 95% CI = [−0.044, −0.028], B = −0.13, p < .0001; Fig. 5b). Furthermore, an interaction with year suggests the inverse link between fragile p values and citations has grown since the start of the replication crisis (β = −0.011, 95% CI = [−0.016, −0.006], B = −0.008, p < .0001). These results point to important growth in the standards used to evaluate research. Yet bucking these optimistic trends, it is also the case that articles from higher ranked universities tend to have more fragile p values (β = 0.016, 95% CI = [0.009, 0.025], B = 0.00018, p = .0005; Fig. 5c), and a null interaction with year shows that this link between fragile p values and rankings has not significantly changed over time (β = −0.004, 95% CI = [−0.001, 0.010], B = −0.00001, p = .09). Hence, the findings on these three incentive variables altogether paint a mixed picture.
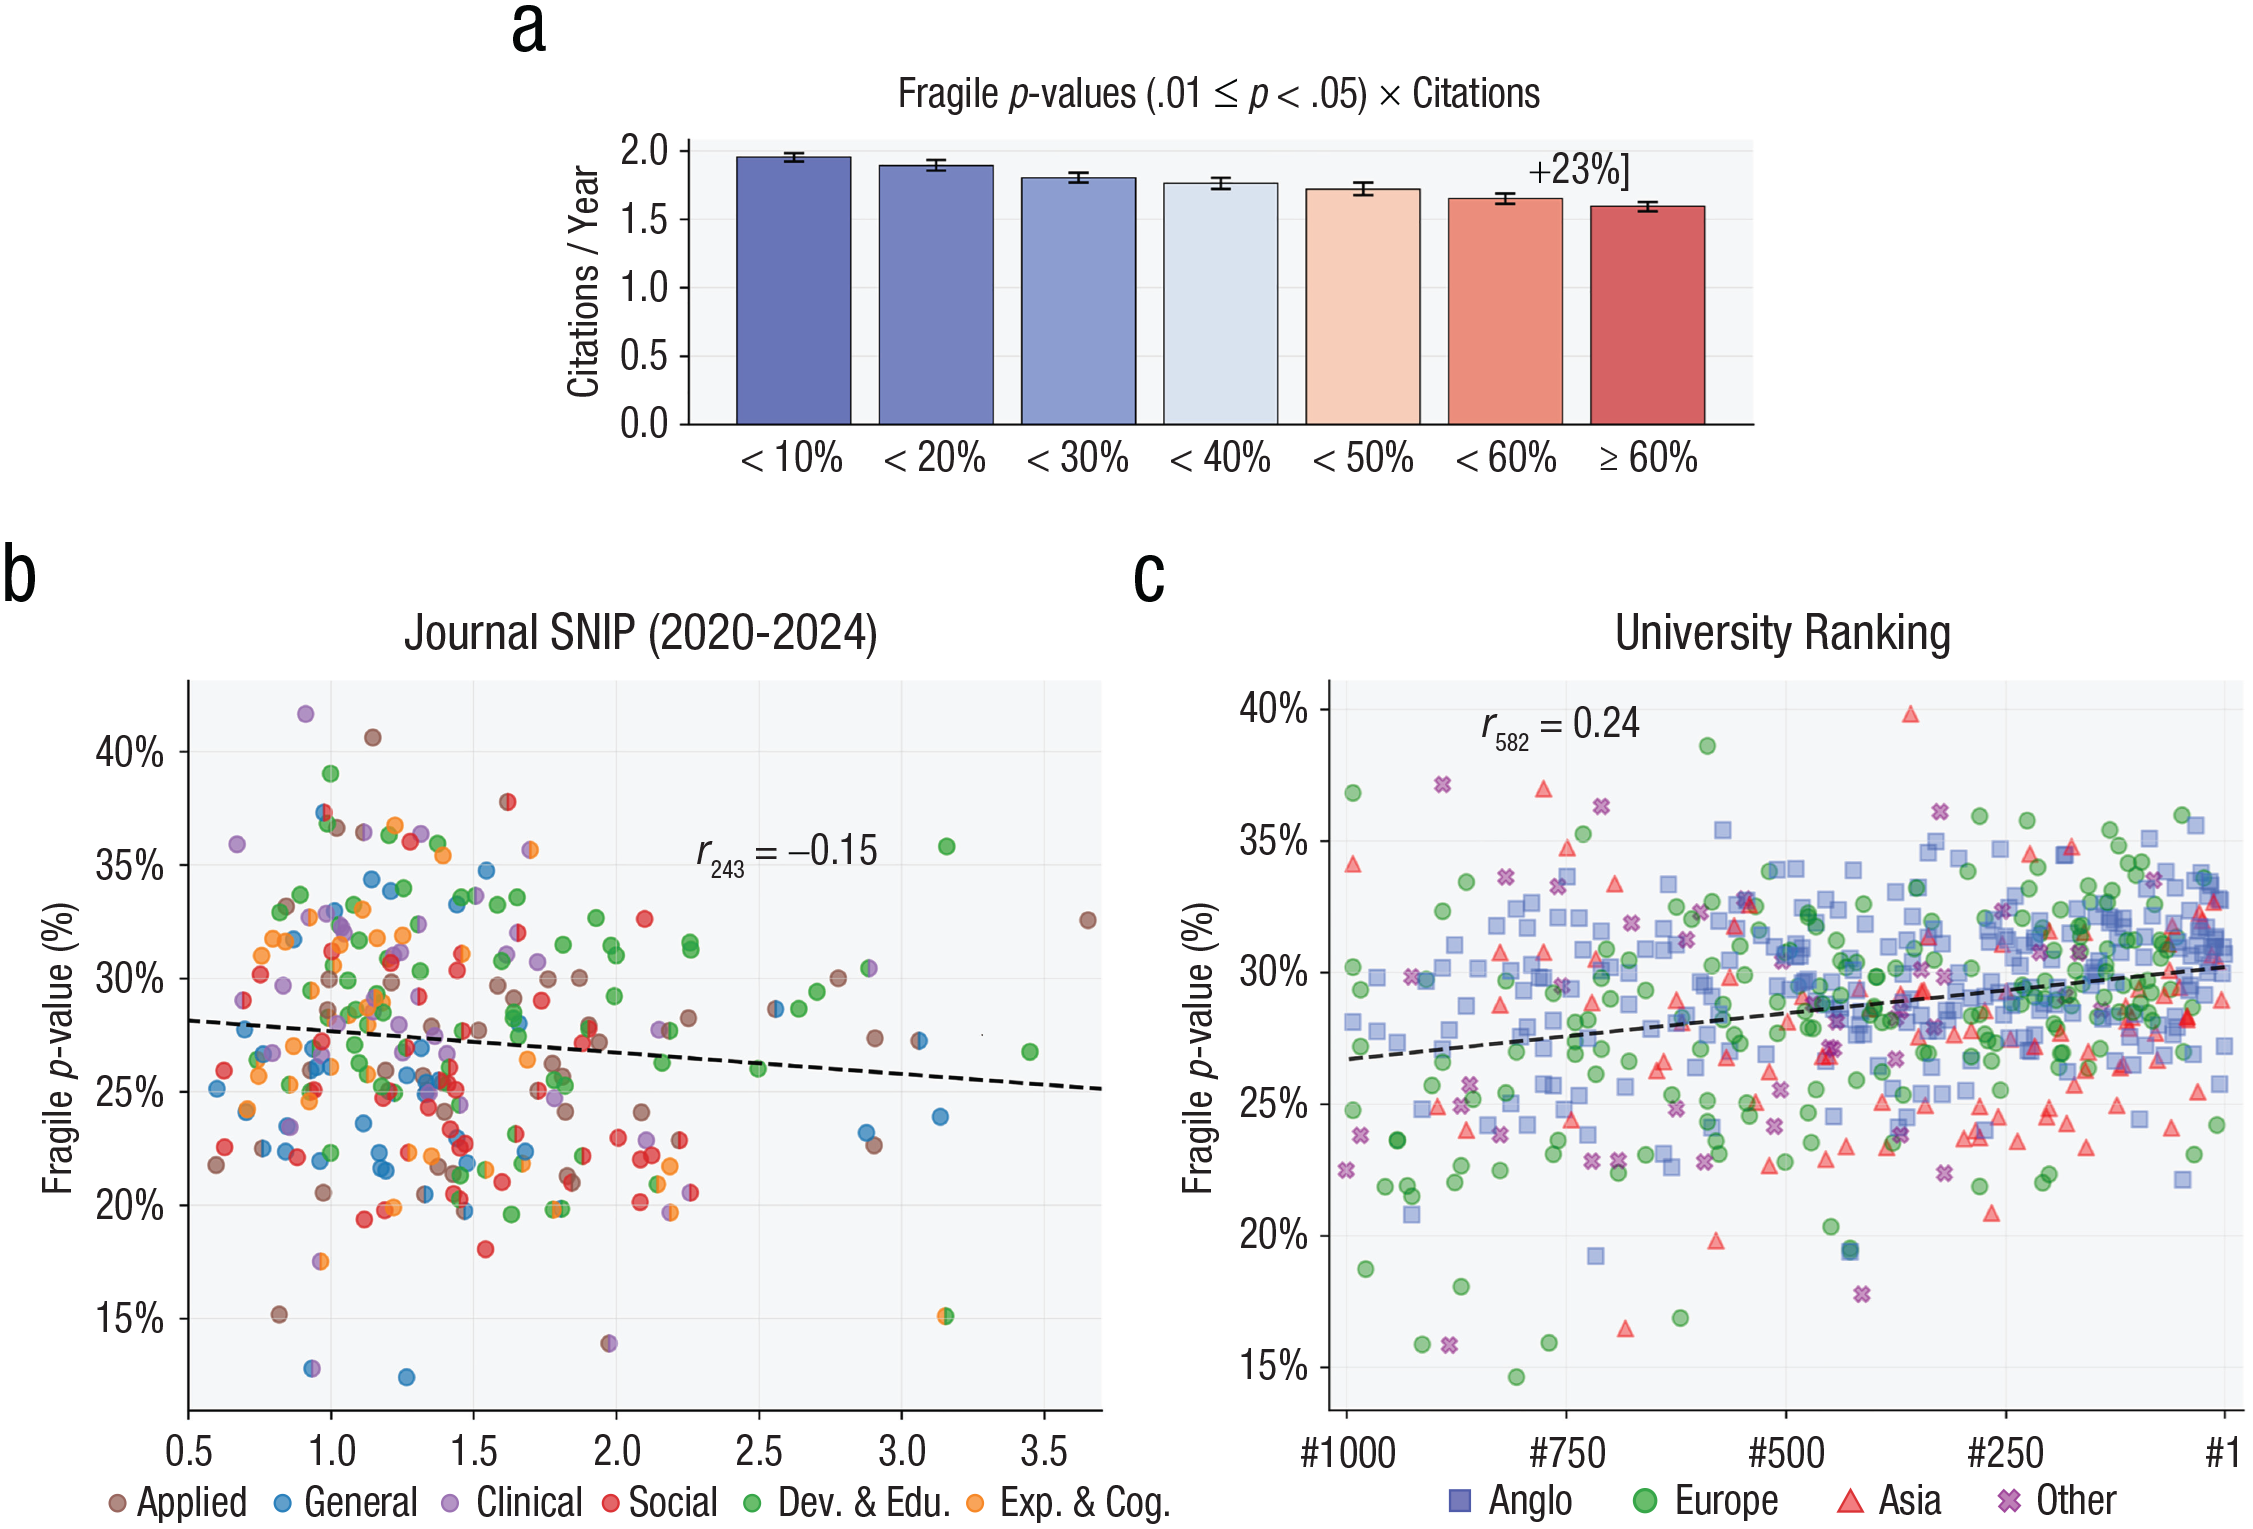
Links between p values and academic values/incentives. (a) Bars represent the citations per year received by recent articles (2020–2024), depending on their fragile p-value percentage. Although the main text analyses use a log-transformed and year-standardized measure of citations, these have been reverted here back to a more interpretable quantity (citations per year). This measure was averaged for each year and then averaged across years; Source Normalized Impact Performance (SNIP) was not controlled for. (b) Scatterplot represents each journal’s mean fragile p-value percentage and mean SNIP from 2020 to 2024. Journals with two areas are colored with both. Five journals had three or more areas, and for those, two areas were selected randomly. Journals with fewer than 10 articles with p values and journals with an unreliable fragile p-value percentage measure (SE > .04) were excluded. A Spearman correlation is reported. (c) Scatterplot represents each university’s mean fragile p-value percentage and its Times Higher Education 2024 ranking. The whole 2004 to 2024 period was used to ensure an adequate sample size, with the effect of year on fragile p values regressed out. Rankings are used for the x-axis rather than research score because rankings were expected to be more intuitive. Universities with fewer than 10 articles with p values or with an unreliable fragile p-value measure (SE > .04) were excluded. Dots are colored based on a university’s region. “Anglo” refers to the United States, United Kingdom, Canada, Australia, and New Zealand. This regional organization is designed to avoid overly small or large groups but may ignore heterogeneity within the divisions.
Topics and methodologies linked to fragile p values
The final analysis examined word usage to enhance the interpretation of the p-value findings thus far. Figure 6 shows the results of 10,000 independent regressions examining how articles’ fragile p-value percentages predict usages of 2,500 different words. For example, the red word “completer” in the bottom-left corner of Figure 6 indicates that articles including this word tend to frequently report fragile p values for their t tests (“completer” refers to clinical-intervention research). To cover a wide range of statistical approaches, this word analysis was done separately for results associated with different test statistics. This yielded many patterns. Words tied to often criticized psychological topics lay near the bottom of these lists, such as “[social] priming” and “genotype.” Topics for which data recruitment is expensive also stand out, particularly topics related to clinical, developmental, and/or biological psychology, such as “infant,” “ASD [autism spectrum disorder],” “intervention,” “pupil,” “cortisol,” “amplitude,” and “gyrus.” In addition, many words linked to weak p values reference analytic approaches offering low power or permitting many degrees of freedom: “between[-]groups [analysis],” “moderated,” “ANCOVA [analysis of covariance],” “left” versus “right” “hemisphere” differences, or “sex” effects. Among the predictors of strong p values, few words pertain to scientific topics but instead predominantly concern methods—for example, “multivariate,” “hierarchical,” “validity,” or “repeated measures.” Altogether, these results begin to illustrate the literature producing strong or weak p values.
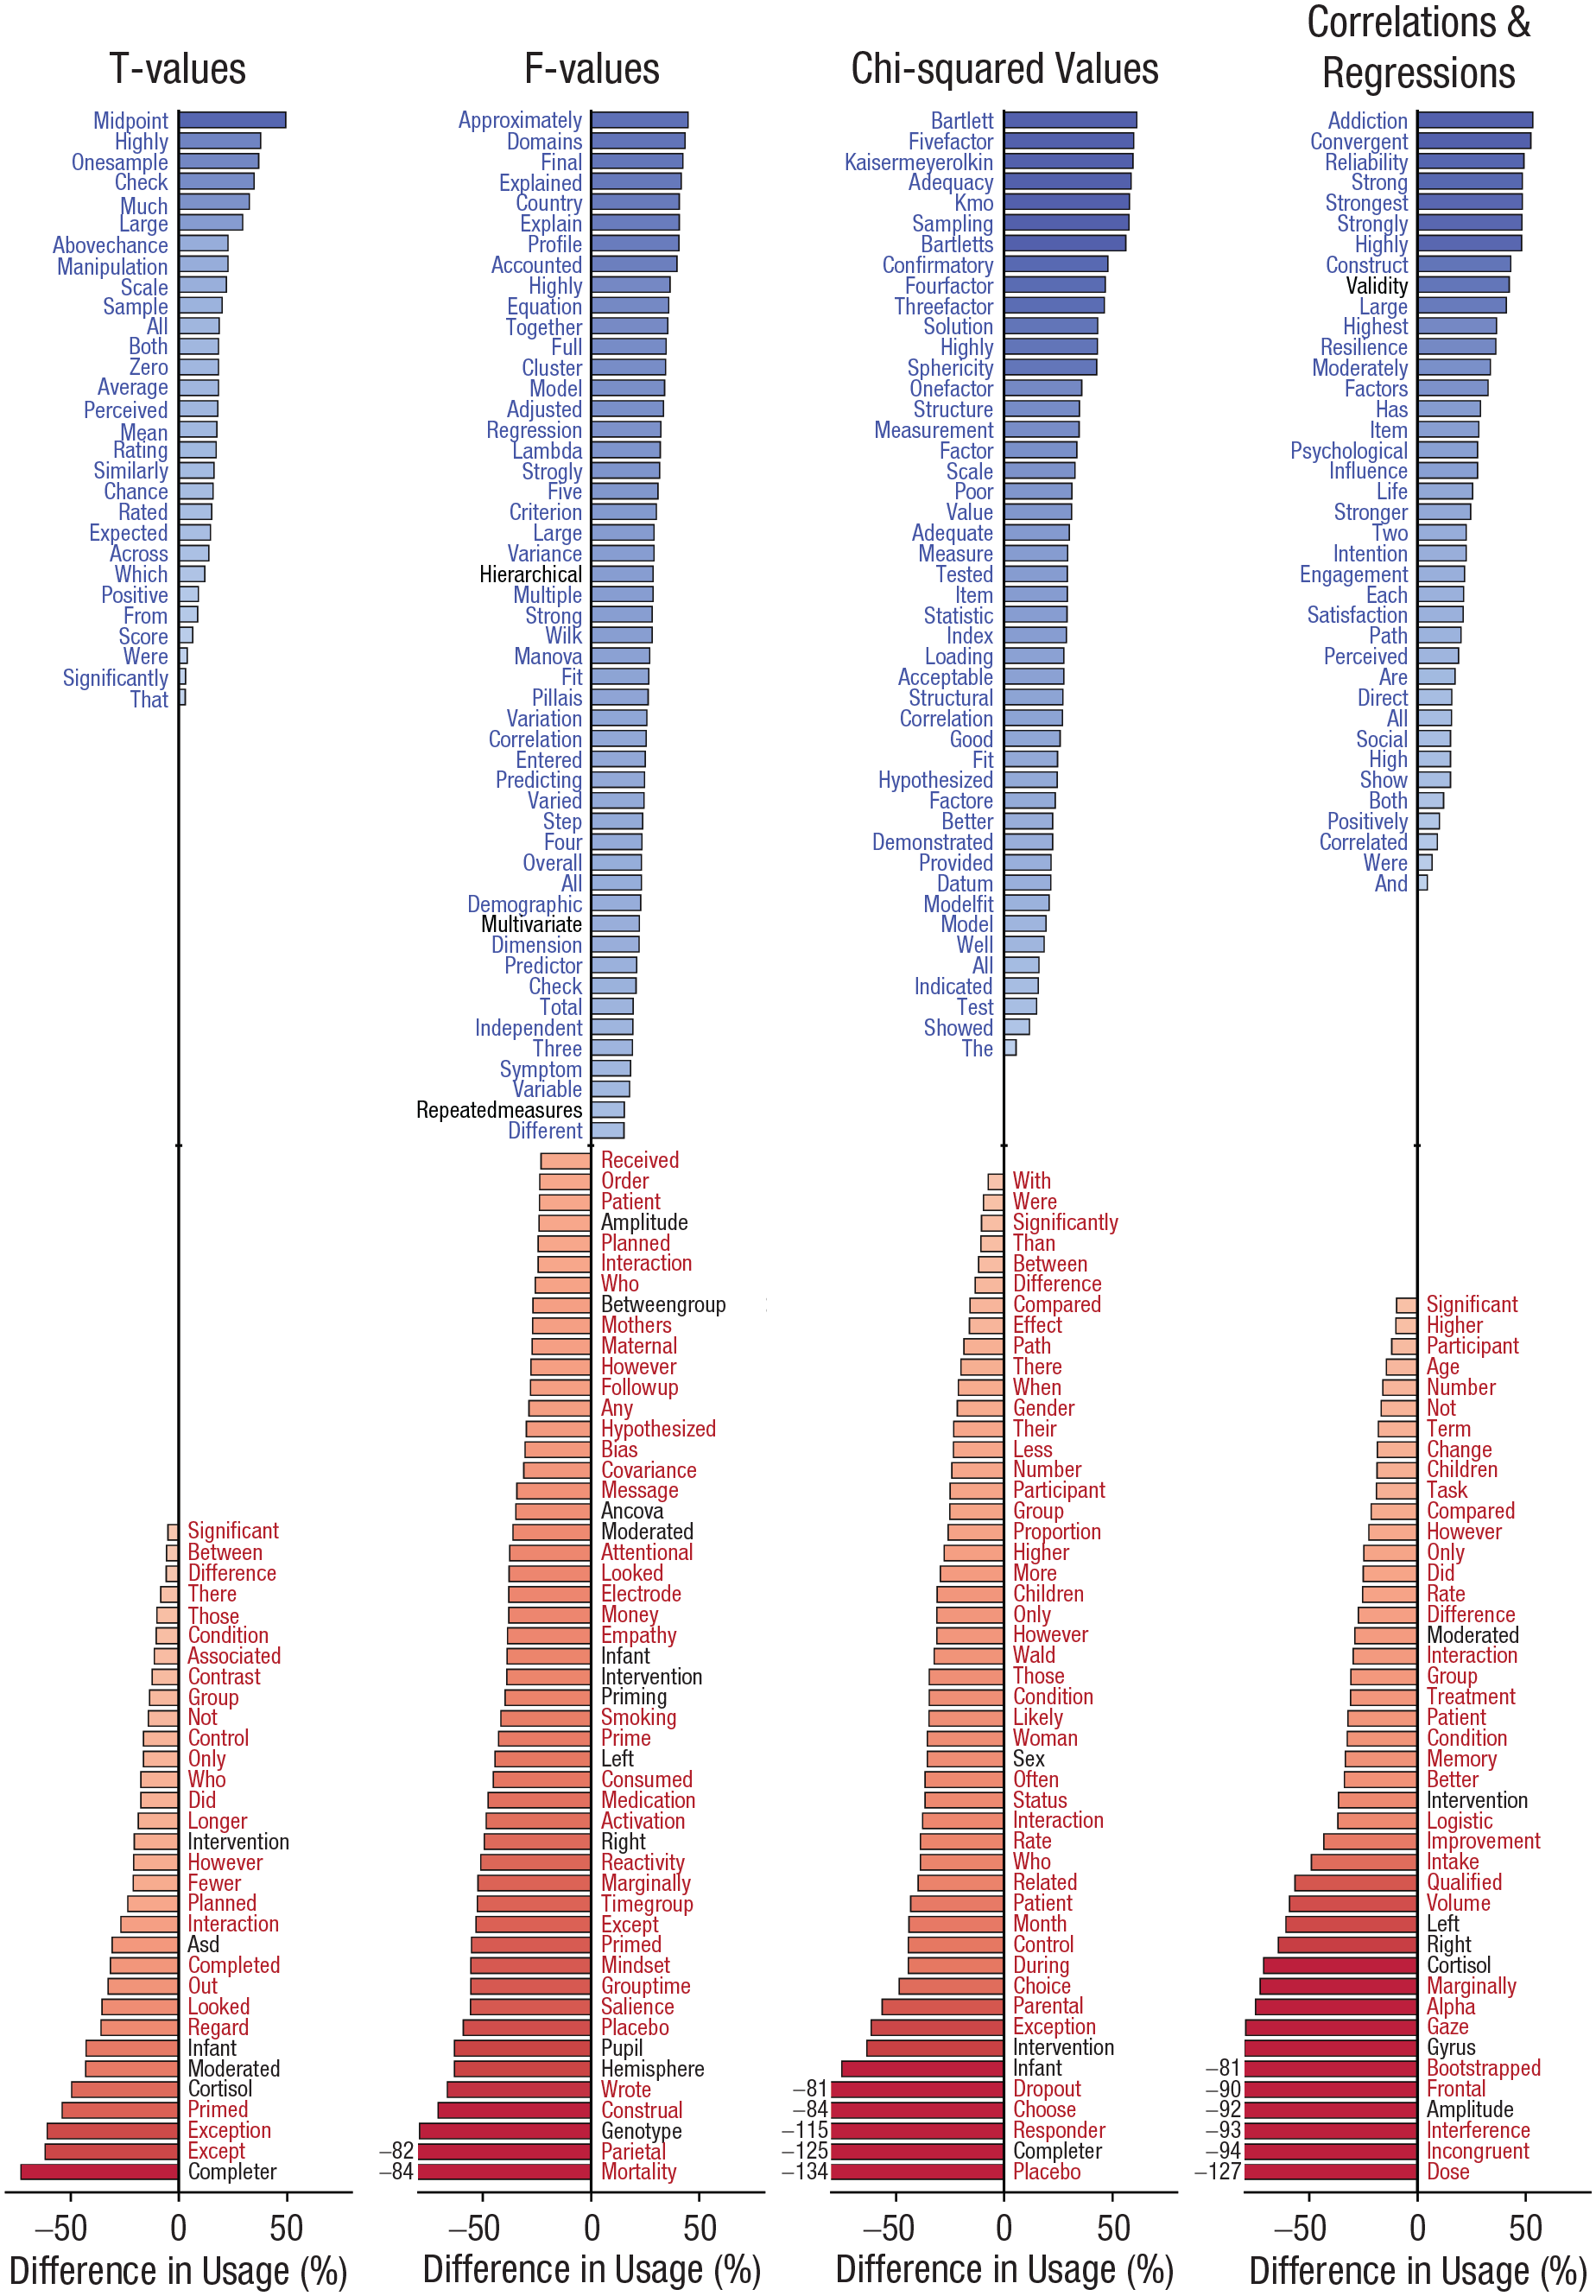
Words linked with strong (blue) or weak (red) p values. Across 2,500 words and four statistic types, 10,000 regressions were fit attempting to predict each word’s usage based on articles’ fragile p-value percentages. Bars represent the standardized coefficient of the fragile p-value predictor divided by a word’s baseline frequency. Every listed word was significant following correction at a family-wise error level (pFWE < .05) across families of 2,500 tests (correction applied separately for each test statistic). Correction used the Holm-Sidak method, which is similar to Bonferroni correction. Words mentioned in the main text (e.g., “completer”) are colored black in the figure for emphasis.
To shed light on the association between articles’ fragile p values and their authors’ universities’ rankings, further regressions were tested. Among the links to academic incentives shown earlier (Fig. 5), the link to university rankings deserves special focus because it implies a disconnect in which academic incentives do not promote strong results. To unpack this university effect, the analyses regressed each word’s usage on an article’s fragile p-value percentage along with its university ranking score (examining p values across t tests, F tests, etc.). Then, the conjunction was taken between words yielding positive associations with both predictors. These words are listed in Table 1—for example, the word “abstinence” here indicates that (a) this word is often used to describe results with fragile p values and (b) this word is also often used by authors from highly ranked universities. This analysis can also be performed with respect to negative associations and for other variables (year, citations, SNIP), and those overlaps are reported in Supplemental Tables S2 through 12 in the Supplemental Material. In the present section, the focus is solely on words linked to higher rates of fragile p values and higher ranking university articles.
Words Positively Associated With Fragile p Values and With Higher Ranked Universities

Note: For 2,500 words, 2,500 regressions were fit. Each regression attempted to predict one word’s usage based on the article’s fragile p-value percentage and the article’s university-ranking score (word usage ≈ 1 + fragile p-value percentage + ranking). Per the regression coefficients, every word listed here is both used significantly more by authors from highly ranked universities and positively associated with fragile p values. Because the analysis here requires overlaps in significance across the two predictors, the requirements for significance were loosened to use false-discovery-rate correction (pFDR < .05), unlike the family-wise correction used for Figure 6 (Benjamini & Hochberg, 1995).
Top institutions often study special populations, such as “HIV” patients, major depressive disorder (“MDD”) patients, “caregivers,” and smokers (“abstinence” and “smoking”). Along with being clinically oriented, top-ranked institutions emphasize biology, focusing on medication (“antidepressant”), hormones (“cortisol”), and neural “activation” or “tau.” In this type of research, achieving high statistical power can be challenging. Beyond biological and clinical psychology, Table 1 more generally suggests that top-ranked institutions are interested in expensive behavioral work and subtle mechanisms. For instance, the terms “day” and “week” emerge, which often refer to multisession studies. Such studies are difficult to run via online platforms and can be much more labor-intensive than single-session research. “Looked” is tied to eye-tracking research, which requires costly equipment. “Choose” and “money” point specifically to behavioral economics and decision-making research, which can be difficult to run online in a convincing manner. “Memory” research can be time-consuming because it often requires lengthy retention intervals. Memory effects may also be subtle, benefiting from the collection of many trials because hits/miss responses are effectively drawn from a probability distribution. Related to the interest in subtlety, highly ranked universities also show a preference for “priming” research and “implicit” mechanisms. By contrast, many of the words associated with low-ranked universities and few fragile p values stem from survey and correlational research (Supplemental Table S2 in the Supplemental Material). Such surveys come with their own limitations, but they can presumably be collected more widely and cheaply than the type of experimental work preferred by top institutions.
Altogether, these patterns suggest that the link between university rankings and weaker results can be explained as the pursuit of topics and methods in which statistical power is likely more limited. However, this conclusion alone may not be complete. For the final analysis, a nonmultilevel linear regression was performed regressing an article’s fragile p-value percentage on its university ranking while including usage levels of all 2,500 words as 2,500 covariates. The original link between fragile p values and rankings remains significant (β = 0.014, p < .0001). Compared with another nonmultilevel regression without the covariates, the link to rankings has dropped by two-thirds (reference: β = 0.039, p < .0001). Yet the continued existence of the pattern may suggest the association is only partly explained by the research topic and method employed.
Discussion
In the present research, I investigated reported p values in psychology articles from 2004 to 2024, putting forth three main conclusions. First, psychological research has begun to publish considerably stronger p values in recent years, pointing to the success of many replication-crisis efforts. Second, analyses linking p values to academic incentives show that contemporary articles reporting strong p values tend to find publication in more esteemed journals and receive more citations. However, there are also signs that robust research is still not linked to success given that top-ranked universities today tend to publish articles with weaker p values. Third, dissecting these patterns by analyzing language usage shows how some methods and topics consistently produce findings with fragile p values. The link between high-end universities publishing weak p values can be partially explained by top universities emphasizing studies that are resource-intensive, laborious, and linked to subtle effects. Along with these main results, readers are encouraged to see the extensive supplemental analyses, in which I put forth additional original findings (e.g., on p-value reporting styles, Section 5 of the Supplemental Material; insignificant p values, Section 6 of the Supplemental Material; and Bayesian or machine-learning analysis, Section 11 of the Supplemental Material). Possible interpretations and implications of the primary findings are discussed below.
The percentage of significant p values that are fragile (.01 < p < .05) has dropped from 32% before the replication crisis to just over 26% today (Fig. 2). This percentage nearly matches the level of fragile p values expected from studies with 80% power. Furthermore, as Sections 7.3 and 13.1 of the Supplemental Material show, lower rates of fragile p values significantly predict replicability. These decreases in the fragile p-value rates are evident across every psychological discipline. Although there remain very many articles that continue to report weak evidence (see Fig. 3 ridge plots), there overall appears to have been considerable progress in improving the strength of psychology’s findings since the replication crisis began.
Drops in fragile p values may be partially explained by many studies increasing their statistical power. Power is closely linked to sample size, and sample sizes began to rapidly rise around 2015 (Fig. 4a), which coincides with fragile p values decreasing precipitously. The expansion of sample sizes is likely intertwined with the rise of online recruitment platforms, such as Amazon Mechanical Turk or Prolific, which have made large sample sizes more widely accessible (Buhrmester et al., 2018). Effect sizes are another piece of statistical power, but the association here is more ambiguous. All else kept equal, smaller effect sizes will lead to lower statistical power. However, in practice, published studies with low power will report inflated effect sizes (Kühberger et al., 2014); see the strong negative correlation between sample sizes and effect sizes (Spearman ρ = −.68). Thus, decreases in effect sizes over time (Fig. 4b) may actually further endorse that statistical power is rising in psychological research. In contrast, prior studies have put forth that statistical power has remained low in the social/behavioral sciences from 1955 to 2015 (Smaldino & McElreath, 2016) and that the incentives for fast scientific discovery dissuade well-powered research (Tiokhin et al., 2021). The present patterns are instead more consistent with an emerging upward trajectory in statistical power.
These demonstrated improvements in psychological research will hopefully push back against the public distrust in science that has grown in recent years. Surveys show that 18% of laypeople report having heard of recent failures to replicate psychology studies, and up to 29% report awareness of such failures in other fields (Anvari & Lakens, 2018). A considerable minority of the public uses replication failures to justify distrust in scientific research (Anvari & Lakens, 2018), and experimental research concurs that informing people of replication failures dampens scientific trust (Hendriks et al., 2020). Ideally, the results here can serve as a springboard to communicate the rigor in much of contemporary psychology.
The present analyses also demonstrate that articles reporting stronger p values tend to be published in more esteemed journals. The nominal effects between fragile p values and journal SNIP may appear to be minor given that an upper echelon journal (2.5 SNIP, 95th percentile) shows just 2% lower rates of fragile p values than less esteemed journals (1.0 SNIP, 20th percentile; Fig. 5b). However, visual inspection of the scatterplot suggests that there is considerably more variability among lower journals. Whereas most high-SNIP journals predominantly publish strong results, at the lower end, there are journals with results of all sorts. Hence, although a line of best fit may not show a steep slope, top journals consistently appear to hold articles to a high standard. On top of this journal effect, articles reporting fewer fragile p values also tend to receive more citations. Articles reporting strong p values (less than 10% fragile) can expect to receive 22% more citations than articles reporting mostly weak p values (over 60% fragile; Fig. 5a). Although not illustrated, comparing articles with 10% versus 90% fragile p values further reveals a 30% gain. These are substantial boosts that exist for conducting seemingly more robust research.
The present findings on journal destinations and citations push back on some pessimistic conclusions put forth by earlier work. Examining replication outcomes and reported statistics, Dougherty and Horne (2022) and Gupta and Bosco (2023) suggested that journals with a higher impact factor tend to publish less robust findings. Investigating links to replication outcomes, Schafmeister (2021) and Serra-Garcia and Gneezy (2021) argued that successful replication and replicability do not impart any benefits to an article’s citations. However, unlike the present research, these four prior studies all focused on older articles (overwhelmingly before 2017). In addition, these prior studies examined smaller portions of the literature, whereas the present research better covers the entirety of psychological science and is thus most resilient to selection biases. With these changes, a brighter picture unfolds wherein robust results are nowadays published in higher SNIP journals and receive more citations.
All this being said, the final result linking fragile p values and university rankings adds nuance to the otherwise positive trends. Specifically, the number one globally ranked university will tend to publish articles with 3.5% more fragile p values than the university ranked 1,000 (Fig. 5c). This is a considerable fraction of the temporal trend from before the replication crisis to today. Furthermore, examining the CIs of the null Ranking × Year interaction suggests that this gap between high/low-ranking universities has minimally shifted since the replication crisis began, if at all (for a discussion of interpreting the absence of effects, see Lakens et al., 2018). The language analyses suggest that these patterns can be partly explained by high-ranking universities’ preferences for difficult research. This preference manifests as a focus on clinical and biological psychology along with tendencies to conduct behavioral studies involving costly equipment, multiple days of labor, and in-person data collection. These factors presumably limit sample sizes, and the large investments required may encourage questionable research practices.
The apparent link between university rankings and weaker findings begs questions about what exactly the psychology community should aspire for. Some of this difficult research may have great practical importance (e.g., medical value). Moreover, this type of “prestigious” experimental work may also have higher validity and causal power despite correlational work producing stronger p values (Table S2 in the Supplemental Material). If the type of research pursued by high-ranking institutions must be done but must also be conducted in a robust fashion, then what systematic changes are necessary? The present research will hopefully inform these types of policy and institutional questions.
Regarding limitations, the principal assumption is that the present approach does not introduce selection bias in a way that meaningfully confounds the link between fragile p values and other variables. Selection bias could operate in terms of which articles were included and which results in an article are extracted. The analyses extracted p values for 72% of articles containing a results section. This is a clear majority but leaves a meaningful minority, including qualitative articles, methodological articles, and articles using Bayesian statistics or machine learning. The results in Sections 11.4 and 11.5 of the Supplemental Material investigate such articles, showing no evidence of biases against the main conclusions. Nonetheless, these articles create some ambiguity. Selection bias may also occur in articles because the analyses ignore figures and tables. It is unclear whether this causes p-value fragility to be underestimated or overestimated. However, for most research areas, articles’ most central findings will presumably still be mentioned in the text. This would suggest that ignoring figures and tables may actually yield a more refined measure, although this cannot be said with certainty.
A final source of selection bias may stem from some journals not being included in the data set. In particular, the data set omitted journals of miscellaneous research (e.g., Science or the Proceedings of the National Academy of Sciences) to ensure that all of the articles covered here were specifically on psychological research. Because these journals have among the highest impact factors, their omission may have caused some selection bias. However, this is expected to be minor because these journals’ articles are a fairly small fraction of the psychology literature.
Supplemental Material
sj-docx-1-amp-10.1177_25152459251323480 – Supplemental material for One Decade Into the Replication Crisis, How Have Psychological Results Changed?
Supplemental material, sj-docx-1-amp-10.1177_25152459251323480 for One Decade Into the Replication Crisis, How Have Psychological Results Changed? by Paul C. Bogdan in Advances in Methods and Practices in Psychological Science
Footnotes
Acknowledgements
I thank Daniel Simons, Gregory Francis, Simon W. Davis, and Ulrich Schimmack for their feedback on an earlier version of this article. The data needed to reproduce the results has been deposited in a public repository (https://osf.io/mxs47/). The data set contains every variable calculated for each article along with article metadata (e.g., DOIs). The code used to collect the data and to produce the results has been uploaded to a public repository (![]() ). Note that this code can be readily adapted for fields beyond psychology. The present work did not require review by the local institutional review board because it uses only publicly available data.
). Note that this code can be readily adapted for fields beyond psychology. The present work did not require review by the local institutional review board because it uses only publicly available data.
Transparency
Action Editor: David A. Sbarra
Editor: David A. Sbarra
Author Contributions
Notes
References
Supplementary Material
Please find the following supplemental material available below.
For Open Access articles published under a Creative Commons License, all supplemental material carries the same license as the article it is associated with.
For non-Open Access articles published, all supplemental material carries a non-exclusive license, and permission requests for re-use of supplemental material or any part of supplemental material shall be sent directly to the copyright owner as specified in the copyright notice associated with the article.