
Abstract
Over time, groups can change in at least two important ways. First, they can display different trajectories (e.g., increases or decreases) on constructs of interest. Second, the configuration of group members’ responses within a group can change, such that the members become more or less similar to each other. Psychologists have historically been interested in understanding changes in groups over time; however, there is currently no comprehensive quantitative framework for studying and modeling group processes over time. We present a multilevel framework for such research—the multilevel group-process framework (MGPF). The MGPF builds on a statistical approach developed to capture whether individual members of a group develop a shared climate over time, but we extend the core ideas in two important ways. First, we describe how researchers can gain insights into group phenomena such as group leniency, group learning, groupthink, group extremity, group forming, group freezing, and group adjourning through modeling change in latent mean levels and consensus. Second, we present a sequence of model-testing steps that enable researchers to systematically study and contrast different group processes. We describe how the MGPF can lead to novel research questions and illustrate its use in two example data sets.
Keywords
Social psychologists (e.g., Lewin, 1947; Lewin, Station, & White, 1939), industrial-organizational psychologists (e.g., Ashforth, 1985), clinical psychologists (e.g., Corsini & Rosenberg, 1955), and researchers in other fields of psychology have long been interested in understanding changes in groups over time to gain insights into how groups function. Starting in the 1930s, numerous laboratory-based studies have found that groups act as powerful change agents: These studies have demonstrated that individuals often react to the presence of others, changing their perceptions, opinions, and behaviors (e.g., Sherif, 1935). Similarly, in applied settings, groups often have important effects, such as motivating employees (Mayo, 1933) and enhancing decision making (Kozlowski & Ilgen, 2006).
Throughout this article, we use the term group processes to refer to changes that groups experience over time. One obstacle to studying group processes in both laboratory and applied settings is the lack of a comprehensive quantitative framework for doing so. Quantitatively capturing group change is challenging for at least two reasons. First, change over time occurs simultaneously for individuals and groups, so group processes are inherently multilevel with a three-level structure (measurement occasions are nested in individuals, and individuals are nested in groups). Second, change in groups comprises at least two different kinds of effects. Specifically, change in perceptions and behaviors in group environments includes both a consensus element (consensus change; i.e., to what degree do group members come to share certain perceptions or converge in certain behaviors?) and a direction element (i.e., do certain perceptions or behaviors increase or decrease over time?).
Both consensus and direction effects are dynamic. Nonetheless, researchers in different domains have noted that psychologists know surprisingly little about how group effects evolve over time (Cronin, Weingart, & Todorova, 2011; Humphrey & Aime, 2014; Kozlowski, 2015; Kozlowski & Bell, 2013; Mohammed, Hamilton, & Lim, 2009). To date, group processes have been examined using qualitative data (Gehman, Trevino, & Garud, 2013), event-occurrence data (e.g., Chiu & Lehmann-Willenbrock, 2016), network data (e.g., Huisman & Snijders, 2003), and simulated data (e.g., Kozlowski, Chao, Grand, Braun, & Kuljanin, 2013). Unfortunately, researchers who collect common forms of multilevel data (individual responses over time, nested within groups) have had challenges trying to answer questions such as “Do interactions among group members change their perceptions and opinions?” or “Do interactions among group members lead to the emergence of consensus or to increased dissensus over time?” or “What types of individual-level and environmental predictors explain the formation of consensus and shifts in group members’ perceptions and opinions over time?”
In this article, we present a multilevel framework for studying group processes. This multilevel group-process framework (MGPF) is designed to allow researchers to jointly model consensus and directional change over time at the individual and group levels. Our article builds on earlier statistical work (Hedeker & Mermelstein, 2007; Hedeker, Mermelstein, & Demirtas, 2012; Kim & Seltzer, 2011; Rast, MacDonald, & Hofer, 2012; Raudenbush & Bryk, 1987) and a methodological approach recently developed in industrial-organizational psychology (Lang & Bliese, 2018; Lang, Bliese, & de Voogt, 2018) to study how individual members of a group develop consensus in attitudes or perceptions over time—a process referred to as climate emergence (Bliese, 2000; Kozlowski & Chao, 2012; Kozlowski et al., 2013). The purpose of the present article is to extend earlier approaches for studying climate emergence (Lang & Bliese, 2018; Lang et al., 2018) into a more general framework.
Our article makes two specific contributions. First, we conceptually describe how the MGPF can track group processes in longitudinal group data by including consensus change (as in earlier work on climate emergence) along with latent-mean change (slope) and slope variability. We then conceptually link these specific elements of group processes to a set of relevant group phenomena, including group leniency, group learning, groupthink, group extremity, group forming, group freezing, and group adjourning. These types of group phenomena play a central role in group research and theory, so the ability to test hypotheses about them using longitudinal multilevel models has the potential to significantly advance group research. Second, we describe a sequence of model-testing steps that allow researchers to systematically contrast and study different types of group process. We empirically demonstrate the use of the MGPF in (a) a freely available data set on group decision making in mock juries and (b) a large field data set of new recruits in the U.S. Army.
The Multilevel Group-Process Framework
Studies of group processes fundamentally involve integrating information from individuals and groups over time. The MGPF addresses this analytic challenge utilizing a three-tier multilevel structure. More specifically, the MGPF is a combination of a longitudinal growth model with measurement occasions nested within persons and a multilevel model with persons nested in groups.
Using the MGPF, researchers can model both (a) the degree to which perceptions or behaviors in groups show latent-mean change over time and (b) the degree to which groups display consensus (or divergence) and changes in consensus over time. Focusing on change in latent group means is fairly common in multilevel research, but several influential theories and research questions about group processes also revolve around the idea that consensus changes. For instance, the idea that unfreezing (loosening up) and refreezing (tightening) group climates is necessary during an organizational change process (Lewin, 1947) and the notion that groups go through several stages of development (Gersick, 1988; Tuckman & Jensen, 1977) are theories about change in consensus and divergence. Ultimately, though, the joint modeling of changes in both latent group means and consensus is important because both types of change are often present and combining them provides a rich foundation for developing and testing theories.
By jointly and systematically modeling both latent-mean change and consensus change, the MGPF builds on earlier methodological approaches that have focused on these two aspects of change in isolation. In practice, it is often important to model them jointly to understand group processes. The interpretation of intraclass correlation, type 1 (ICC1; Bliese, 2000) values for longitudinal group data provides a simple example illustrating why it is important to model latent mean-level change and consensus change jointly. The ICC1 is frequently used in the organizational-psychology literature to study consensus; however, ICC1 values estimated at particular points in time are affected by both between-groups and within-group variance. Therefore, change in the ICC1 over time can result either from an increase or decrease in consensus within the groups or from change in the between-groups variance associated with mean-level change. Accordingly, examining ICC1 values over time can lead to misleading conclusions regarding the emergence of consensus or divergence (for demonstrations of this point, see Lang & Bliese, 2018, and Lang et al., 2018).
Likewise, a fair amount of research has examined mean-level change without considering consensus. Implicitly, this approach assumes that levels of consensus remain unchanged over time. When consensus change is actually present, however, its omission in statistical models can lead to potential bias because multilevel models assume that the residual variance is homoscedastic (i.e., does not change over time; Bliese & Ployhart, 2002; Pinheiro & Bates, 2000; Singer & Willett, 2003). From the perspective of theory development and testing, though, failing to jointly model and understand consensus change implies that the dynamic nature of how group processes unfold over time is only partially captured.
Model specification
In the three-tier multilevel-modeling framework used by the MGPF, changes in direction are captured by examining familiar fixed-effects terms associated with time (e.g., Bliese & Ployhart, 2002; Bryk & Raudenbush, 1987; Singer & Willett, 2003). The emergence of consensus or increases in divergence are captured by explicitly modeling changes in heteroscedasticity in the error terms (i.e., changes in their variance) over time and by substantively interpreting changes in heteroscedasticity. Incorporating heteroscedasticity over time is fairly common practice but has commonly been framed as a violation of one of the assumptions of the multilevel growth model (Bliese & Ployhart, 2002; Singer & Willett, 2003). In contrast, the MGPF considers heteroscedasticity as a way to gain meaningful substantive insights into changes in shared group perceptions or behaviors and the emergence of group constructs. Building on the earlier work focused on the emergence of consensus (Lang & Bliese, 2018), the MGPF relies on the following multilevel model specification:


This specification explains the response Ytij at time t of person i in group j. Time is typically coded 0 at the start of the study and increases by 1 with each occasion.
The start of the study
Before researchers examine group processes, a first step is to examine the characteristics of the data at Time 0. The model specification used for the MGPF provides several informative insights at this step. Specifically, the model specification includes a common intercept, γ000, that captures the latent mean at the start of the study. The deviation of persons from this common intercept is given by r0ij, and the group-specific deviations are given by u00j. The variance of the person deviations is labeled τ, and the variance of the group deviations is labeled υ00. The common intercept and the group and person deviations capture how the group and individual perceptions or behaviors are positioned at the start of the study. When the variances of the group deviations (υ00) and person deviations (τ) are considerable, substantial multilevel heterogeneity exists. Commonly, it is reasonable to expect that the amount of variance at the group level (υ00) at the beginning of a study will be relatively small, particularly when the groups are newly formed and have not yet developed distinct climates. In contrast, the amount of variance at the person level (τ) is often relatively large because individuals tend to respond consistently over time (Bodner & Bliese, 2017).
Change and variability in perceptions or behaviors
After researchers have examined the characteristics of the data at the start of the study, the initial modeling steps in the MGPF provide insights into change and variability in the behavior or perception in question (latent-mean change and variability). The common slope captures how the dependent variable changes over time and is labeled γ100 in the model specification. As shown in Table 1, Step 1 in the MGPF tests whether the common slope, γ100, differs from zero and thus whether substantial latent-mean change occurs during the study.
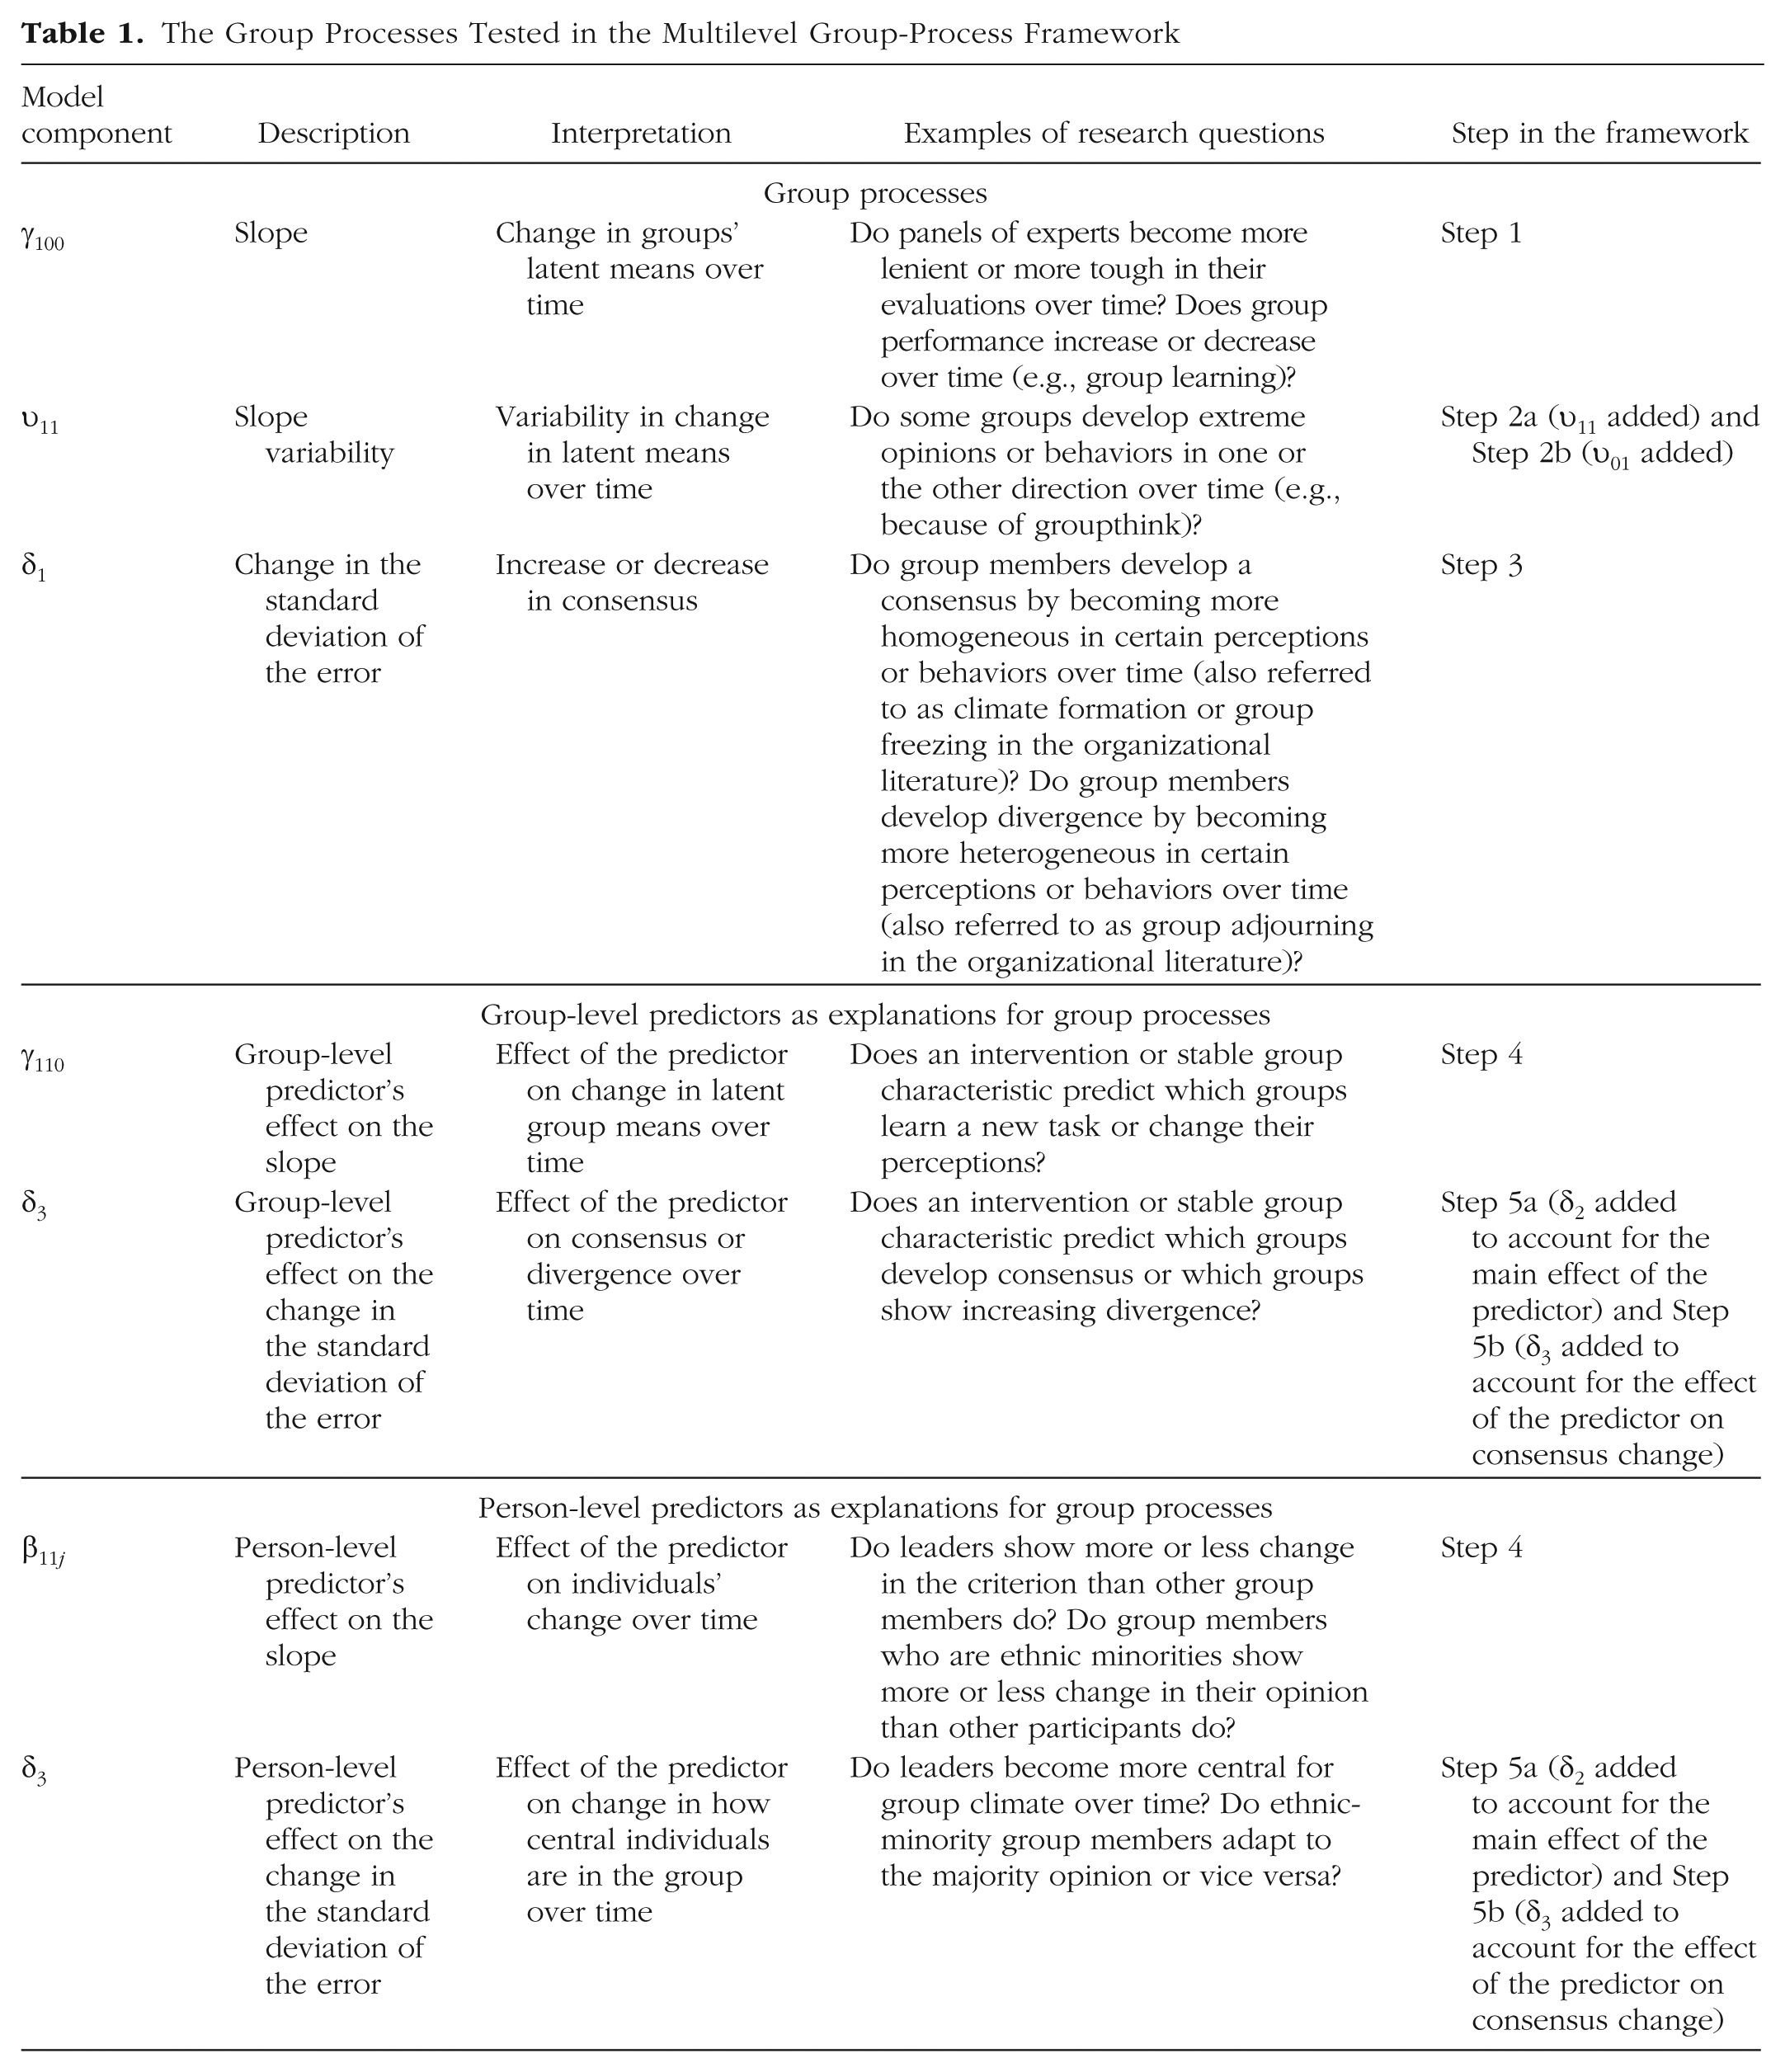
The Group Processes Tested in the Multilevel Group-Process Framework
Groups differ from the common slope with a group-specific slope deviation, u10j. The common slope and the group-specific slope deviation, u10j, capture the degree to which a particular group’s perceptions or behaviors shift over the course of the study. The variance of the slope deviations is labeled υ11, and because the common slope is the same for all groups, the variance in the slope deviations is also the slope variability. Step 2 tests whether the slope variability, υ11, between groups is substantial. In interpreting the results for Step 2, it is important to take into account the covariance, υ01, between the slope variance, υ11, and the intercept variance, υ00 (see the model specification). Especially when υ01 is negative, the actual variability in the slopes may be small. To make the interpretation of υ11 easier, we recommend routinely first fitting a model without υ01 (Step 2a) and then fitting a model with υ01 (Step 2b). In the former model, υ11 can be directly interpreted as the overall amount of slope variability (without paying attention to υ01), and the latter model then provides insights into the association between the group-level intercept and slope.
The common slope and variability in the slope are frequently of interest for group research because group environments have the potential to fundamentally change the trajectories of responses. For instance, jury members share observations about the prosecution’s case during the deliberation period. Presumably, this deliberation influences the overall views of the jurors so that the group becomes more (or less) favorable toward the defendant or prosecution (i.e., there is a significant common slope). Similarly, newly formed work groups might be expected to show increases in group-level constructs, such as cohesion, as group members interact and develop relationships and a distinct climate is formed (i.e., expected increase in the common slope). In both cases (opinion formation in juries and climate formation in work groups), there may also be substantial between-groups variability in the slope.
Change in consensus
The third step in the MGPF is to test for consensus change. As noted previously, such change can be captured through modeling change in the error variance over time. The model specification for the MGPF specifically accounts for this change through the expression σ2exp[2δ1time t ]. In this expression, σ2 is the error variance at the initial measurement occasion. Note that the MGPF model specification does not include a term for individual slope change in addition to the person intercept (τ). This ensures that change within the groups is fully captured by δ1 and can be interpreted in a way that is conceptually analogous to interpreting differences between ICC1 values estimated at different measurement points, but avoids the limitations of using the ICC1 (Lang & Bliese, 2018; Lang et al., 2018).
The δ1 term can be interpreted as the approximate linear percentage increase (when δ1 is positive) or decrease (when δ1 is negative) in the standard deviation of the errors (σ) with each unit increase in the time variable. For instance, if σ2 = 1.6, δ1 = −0.05, and time = 0, 1, 2, 3, the residual variance would be 1.6 (1.6 × exp[2 × −0.05 × 0]) at Time 0, 1.45 (1.6 × exp[2 × −0.05 × 1]) at Time 1, 1.31 (1.6 × exp[2 × −0.05 × 2]) at Time 2, and 1.19 (1.6 × exp[2 × −0.05 × 3]) at Time 3. The residual standard deviation would be 1.26 (√1.6) at Time 0, 1.20 (√1.45) at Time 1, 1.14 (√1.31) at Time 2, and 1.09 (√1.19) at Time 3, which corresponds roughly to a change pattern of three 5% decreases. Figure 1 illustrates this example.
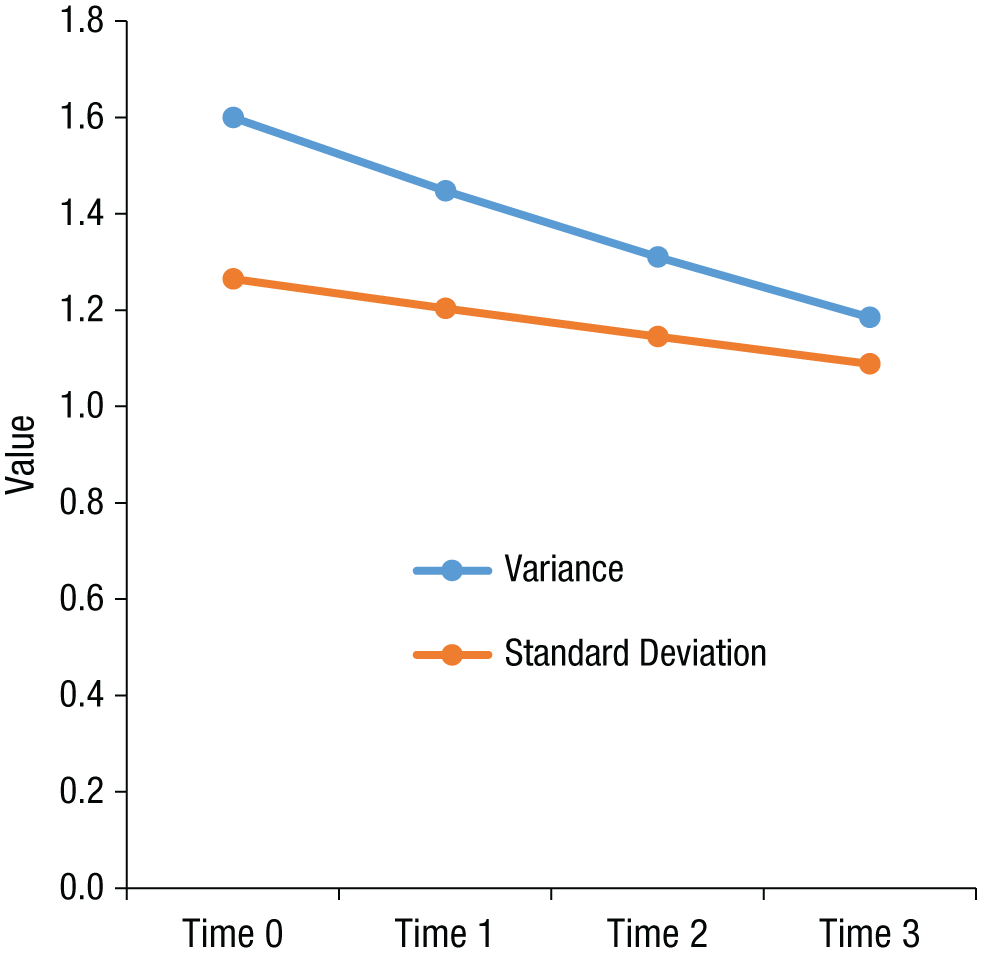
Illustration of how the multilevel group-process framework captures change in consensus over time. The graph shows the change in the residual standard deviation and variance from Time 0 through Time 3 when the variance is 1.6 at Time 0 and δ1 = −0.05.
Note that the exponential term is included in the model to ensure that the error variance always remains positive so that no model misspecifications can occur. Within the exponential term, an additional 2 is included to bring δ1 to the unit of the residual’s standard deviation (exp[2δ1time t ] is identical to exp[δ1time t ]2).
Although the model specification for δ1 may appear to be complex, the interpretation of δ1 values is relatively straightforward. For instance, a decrease in residual variances for cohesion ratings in a sample of groups (negative δ1) suggests that within groups, members are becoming more similar to each other in their perceptions of cohesion. In contrast, a positive δ1 for cohesion ratings suggest that subfactions within groups are responding differently over time such that one faction is reporting increases in perceived cohesion while another faction is reporting decreases. The idea of subfactions responding differently clearly has implications for understanding group processes and potentially group outcomes.
The upper part of Table 1 summarizes the basic change components in the proposed framework: the slope (γ100), the slope variability (υ11), and the consensus coefficient (δ1). As indicated by the examples in the table, many basic research questions concerning group processes can be expressed and tested using this framework.
Disclosures
This study involved an analysis of existing data rather than new data collection, and the empirical examples are intended to be demonstrations. The data for the first example are publicly available on the Web site of the Inter-university Consortium for Political and Social Research (Dann, Hans, & Kaye, 2006; https://doi.org/10.3886/ICPSR04356.v1). The data for the second example and all materials have been made publicly available via the Open Science Framework and can be accessed at https://osf.io/849kq.
Basic Examples
To illustrate the use of the MGPF, we present two examples with different types of group data sets. Our first example uses data from a mock-jury experiment (Dann, Hans, & Kaye, 2007). Detailed code for this example is provided in the appendix. The mock juries were recruited from a pool of available jurors who were not needed for jury duty and watched a hypothetical robbery trial (based on a true case). The jurors then deliberated in juries of eight to reach a verdict. Before the deliberation (Time 0), each juror provided his or her opinion on the case. Specifically, the jurors provided their personal verdicts (0 = not guilty, 1 = undecided, 2 = guilty), their confidence in their personal verdicts (scale from 0, not at all, to 10, very much), and their assessment of the likelihood that the defendant was guilty (scale from 0 to 100). After the deliberation (Time 1), the jury members again responded to these three questions about their personal opinions on the case. At the conclusion of the experiment (Time 2), each jury as a whole provided a final verdict (0 = not guilty, 1 = undecided, 2 = guilty), and each juror indicated the degree to which he or she agreed with the final verdict and was satisfied with the final verdict (scales from 1, not at all, to 5, very much). To analyze these data using the MGPF, we converted all the response scales to a common scale from 0 (not guilty) to 100 (guilty) using the POMP (percentage of maximum possible) method (Cohen, Cohen, Aiken, & West, 1999) and then took the average of the responses to all the items at each time point. (The match between the final verdict and each respondent’s personal verdict was taken into account during this conversion. E.g., a respondent who was very satisfied with a not-guilty verdict and a respondent who was very satisfied with a guilty verdict would be scored at opposite ends of the POMP scale.) The questions were combined such that The POMP method can be generalized to all types of metrics, and a POMP scale can be interpreted as indicating the range of possible scores. For instance, for a one-item 5-point Likert scale, a POMP score of 100 corresponds to strongly agree, and a POMP score of 0 corresponds to strongly disagree. Clearly, the fact that the scales used at the first two measurement occasions differed from the scales used at the third occasion is a limitation, as is the fact that Time 1 and Time 2 were not really spaced in time; nonetheless, these data illustrate typical group processes in a highly realistic experimental setup.
Figure 2 provides a graphic summary of the data set (note that the graphs include information on two predictors that we consider later in this article). Tables 2 and 3 present results from the MGPF analyses. Step 1 revealed that over time, the average opinion of jurors decreased significantly toward “less guilty” (γ100 = −7.37, p < .001; see also the estimate in the final model, in Table 3). This effect is in line with earlier findings suggesting that jury deliberations typically decrease judgments of guilt (Bornstein & Greene, 2011; MacCoun, 1989). However, Step 2 revealed that juries also varied significantly in the trajectories of their average latent means over time. Step 2a indicated that there was substantial slope variability, υ11 = 176.60, and including this parameter improved model fit significantly, χ2(1) = 288.58, p < .001. Step 2b indicated that the covariance between the slope variance and the intercept variance was also significant, χ2(1) = 13.69, p < .001; groups that started at a higher level in judgments of guilt also remained at a higher level in their judgments of guilt over the course of the study. The covariance estimate, υ01, was 78.76 in the Step 2b model and 82.60 in the final model (Table 3). The Step 2 analyses show that the slope of juries’ opinion change during the deliberation differed systematically among juries despite the fact that all the juries deliberated about the same case. Finally, Step 3 of the MGPF analysis revealed considerable evidence that juries reached consensus over time. The average personal opinion of the jurors moved closer to the latent means of their groups, δ1 = −0.33, χ2(1) = 86.03, p < .001, and the residual variance decreased from 642.80 to 171.71 over the course of the study. These Step 3 findings suggest that juries in this study did not reach their final verdicts simply by taking the average of the predeliberation opinions. Instead, the analysis suggests that group interactions shaped the decisions and enabled the juries to reach their final verdicts. Jurors appeared to change their personally held beliefs to arrive at group consensus.
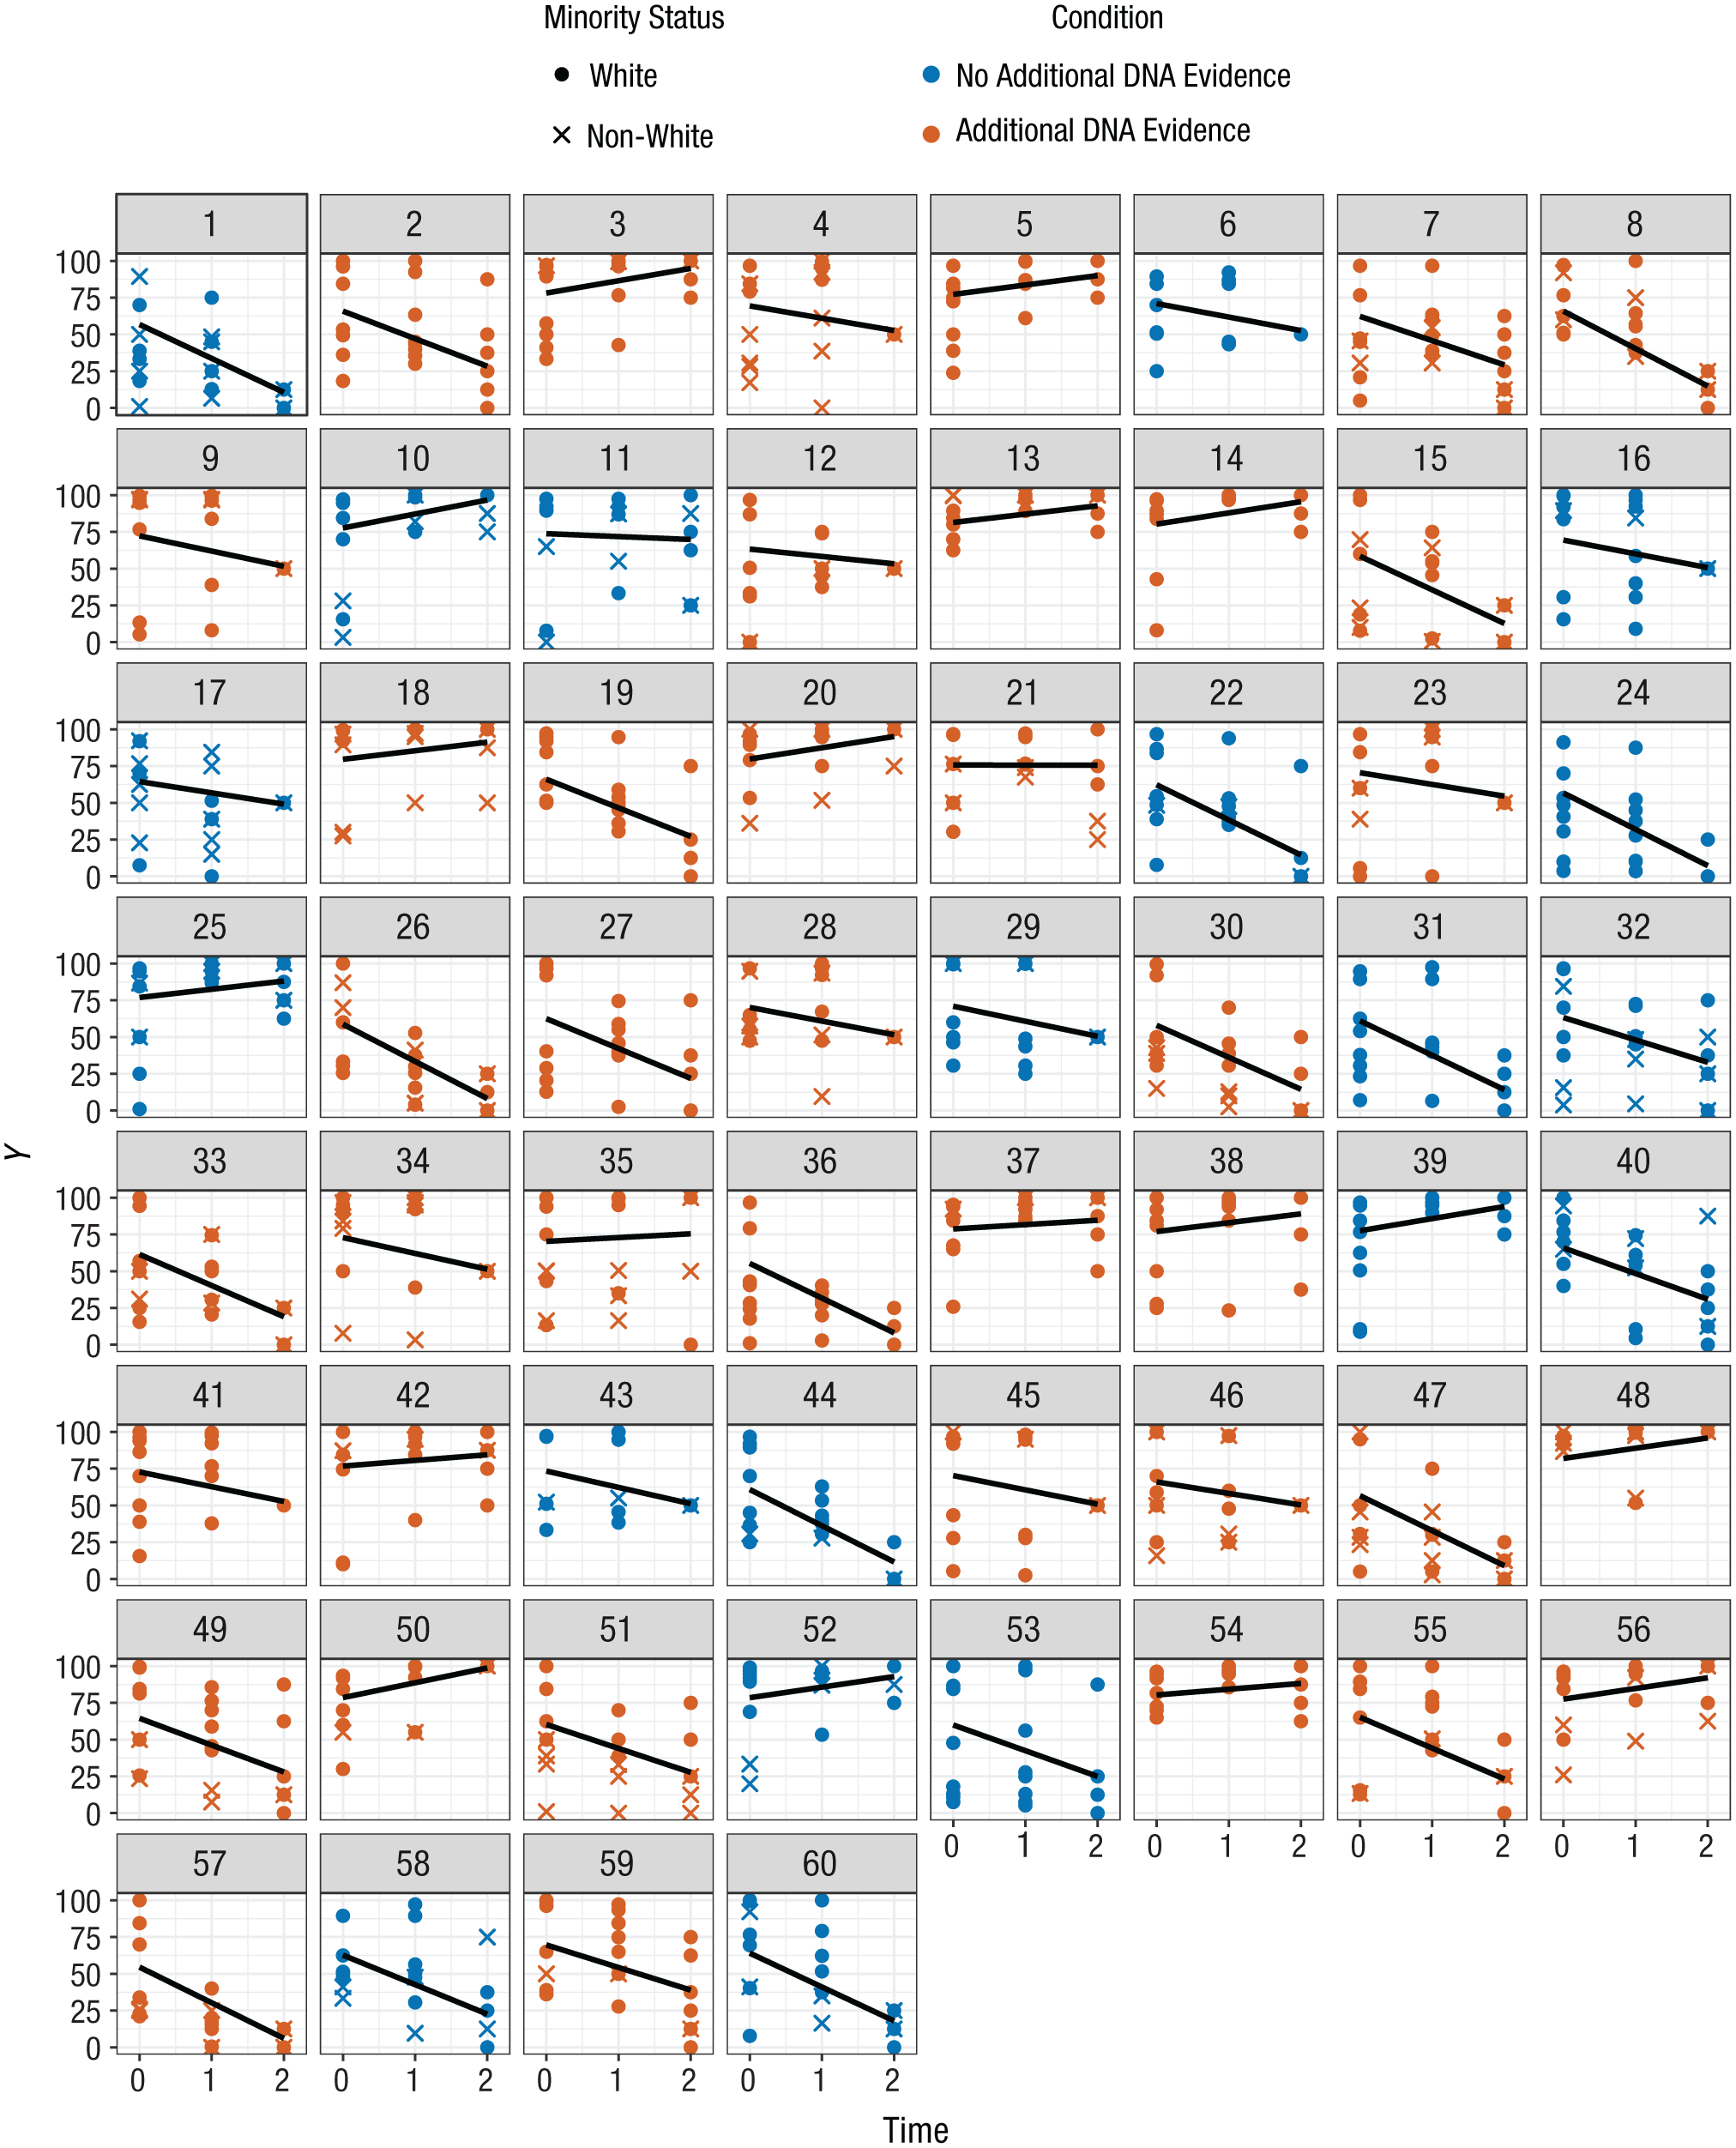
Change patterns in the jury data (Dann, Hans, & Kaye, 2006). Each graph shows the scores for members of a single jury as a function of time, as well as the linear trend in the data (from the multilevel group-process model). The color coding indicates which juries received additional information on DNA evidence. Ethnic majority/minority status of individual jurors is indicated as well.
Results for the Basic Modeling Steps in the Analyses of the Jury and the Basic-Training Data Sets
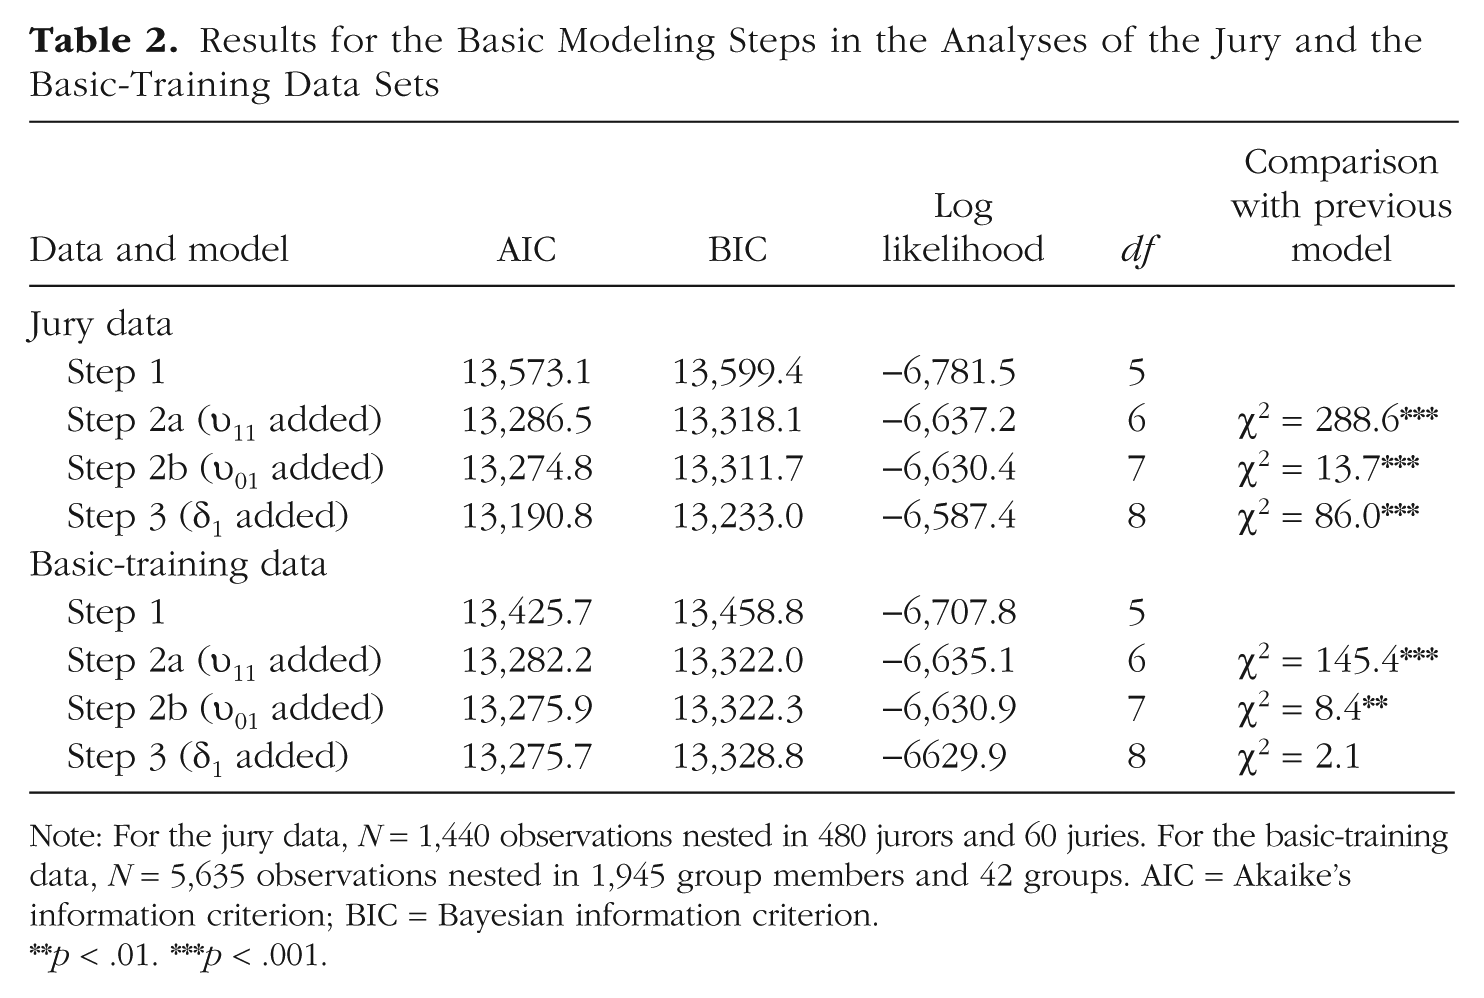
Note: For the jury data, N = 1,440 observations nested in 480 jurors and 60 juries. For the basic-training data, N = 5,635 observations nested in 1,945 group members and 42 groups. AIC = Akaike’s information criterion; BIC = Bayesian information criterion.
p < .01. ***p < .001.
Parameter Estimates for Step 3 in the Analyses of the Jury and the Basic-Training Data Sets
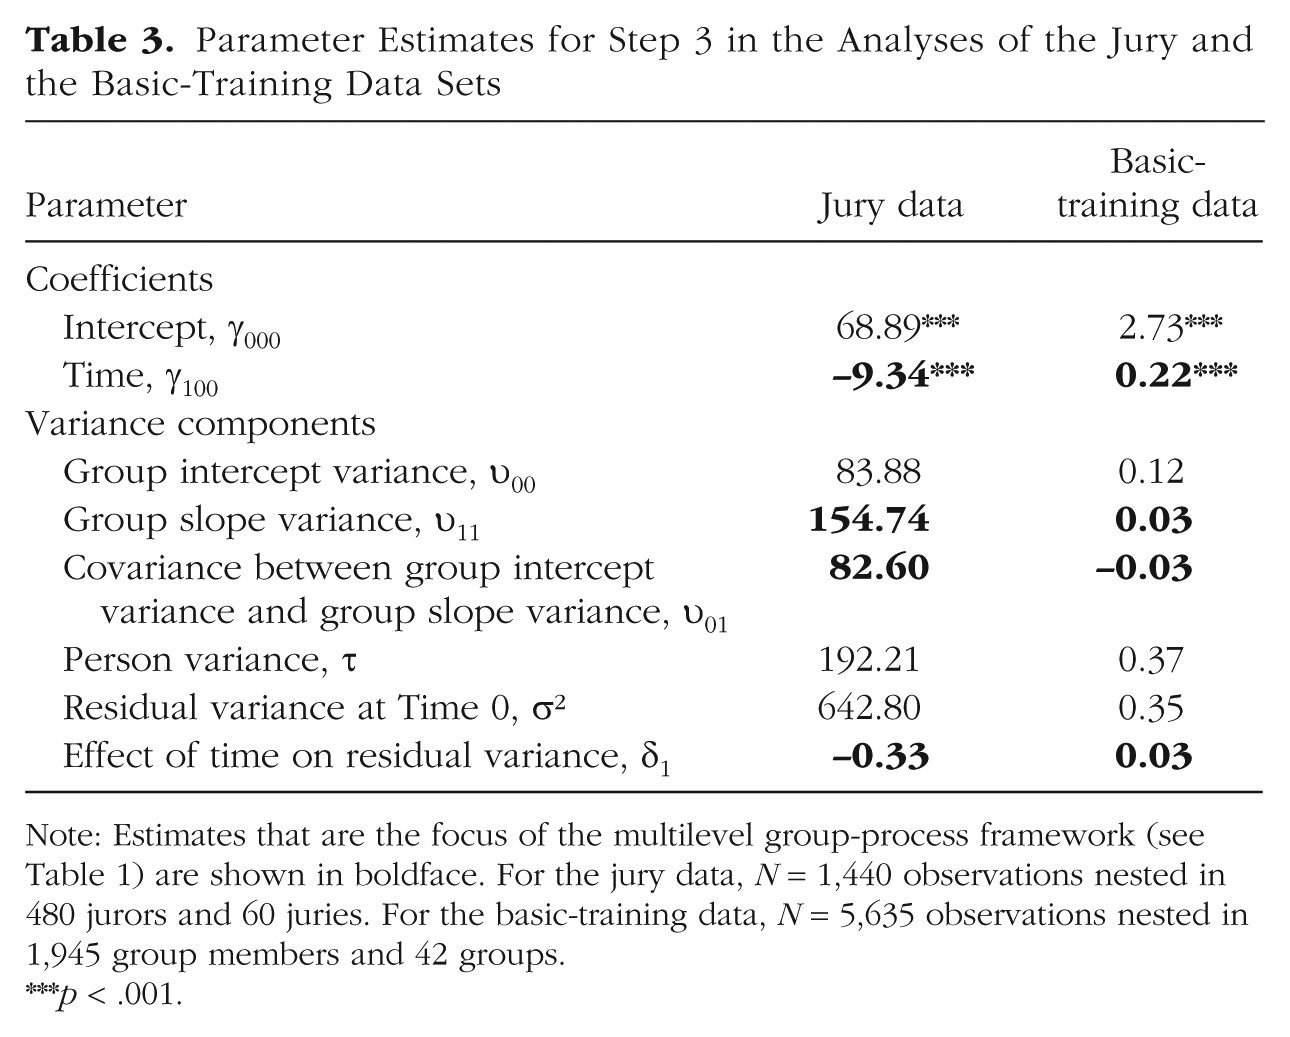
Note: Estimates that are the focus of the multilevel group-process framework (see Table 1) are shown in boldface. For the jury data, N = 1,440 observations nested in 480 jurors and 60 juries. For the basic-training data, N = 5,635 observations nested in 1,945 group members and 42 groups.
p < .001.
Our second example involves 1,945 new recruits in basic training in the U.S. Army. These recruits were members of 42 platoons and constitute a subset of the sample in a study by Adler et al. (2015). The data we analyzed differ from the full data set because we omitted respondents who provided only one rating over the three measurement occasions and we focused on just one of the outcome variables: cohesion. Cohesion was assessed at 3, 6, and 9 weeks into the 10-week basic-training course using a three-item cohesion measure (e.g., “The members of my platoon are cooperative with each other”; Britt, Dickinson, Moore, Castro, & Adler, 2007; Williams et al., 2016). Participants responded to the items on a 5-point Likert scale.
Tables 2 and 3 provide results from the MGPF analyses. Step 1 indicated that time had a main effect on cohesion (γ100 = 0.22, p < .001). Overall, the perceived level of cohesion increased across the groups. Results for Step 2 provided evidence of a significant amount of variance in the trajectory of perceived cohesion, υ11 = 0.03, χ2(1) = 145.45, p < .001 (Step 2a). These findings suggest that the perceived level of cohesion changed more in some groups than in others. The addition of the covariance term (Step 2b) revealed that the covariance was negative and significant, υ01 = −0.03, χ2(1) = 8.36, p < .01. Step 3 showed that the change in the residual variance (δ1) was positive, with a value of 0.03. However, a comparison of −2 log-likelihood values indicated that a model that included δ1 did not fit significantly better than a model that omitted this estimate, χ2(1) = 2.11, p = .15. The δ1 estimate was therefore not significant at the 95% confidence level, which suggests that the groups as a whole showed no discernible variance patterns. As we show later, however, the groups exhibited distinct variance patterns that were masked when we examined the groups as a whole.
Explaining Change Using Predictors
Thus far, we have included only time and the nesting structure as predictors. In many cases, however, researchers may also be interested in explaining group and individual processes over time. To do so, it is possible to add predictors at the group level or the person level in additional steps (Step 4 and Step 5; see Table 1). The predictors used in these steps can be dummy codes for experimental manipulations and values from dichotomous or continuous measures of stable characteristics.
Group-level predictors
A model that includes a group-level predictor can be written as follows (specifications for r0ij, u00j, and u10j are identical to those in the previous model specification and therefore not shown again):


In this model, several additional effects are included. The model accounts for the fact that a group-level predictor (pred j ) may explain baseline differences in the intercept (γ010). The effect of the predictor on the intercept is included primarily to make the test of the next effect possible, in Step 4 of the MGPF model: Step 4 tests a group-level effect of the predictor on the slope of the latent group means (γ110). The effect of the predictor on the slope indicates whether the predictor can explain differences in the slope between groups and will frequently be of interest to researchers. In particular, researchers may wish to test whether groups that received a particular intervention or that have a particular characteristic show a stronger increase or decrease in the criterion (Ytij) over time than other groups do. For instance, in the Army cohesion data, the 42 platoons differed significantly in their mean cohesion trajectories, so these differences could presumably be explained by some varying attribute of the groups.
Before the interaction between time and the predictor on consensus change can be examined, it is necessary to add the δ2 effect to the model (Step 5a). This effect accounts for potential differences in consensus between groups that are explained by the predictor. Step 5b then focuses on the δ3 effect, and tests whether the predictor explains the degree to which groups show increasing consensus or divergence over time. In other words, this step allows researchers to test whether a particular group characteristic is associated with the development of consensus. The middle portion of Table 1 summarizes how the contribution of group-level predictors to group processes can be tested using the MGPF.
Person-level predictors
Although group research typically focuses on group-level predictors, the MGPF can also incorporate person-level predictors instead of or in addition to group-level predictors. Person-level predictors may be relevant because they provide insights into how persons with different characteristics interact within their groups. For instance, person characteristics such as being a leader or being in an ethnic minority may be associated with differential change patterns. A model that incorporates a person-level predictor can be written as follows:


As in models including group-level predictors, Step 4 examines the degree to which the predictor can explain latent mean-level change (by adding β01j and β11j). Step 5 then proceeds and tests whether the predictor accounts for consensus change (by adding δ2 in Step 5a and δ3 in Step 5b). The interpretation of the effects of person-level predictors is somewhat different from the interpretation of the effects of group-level predictors, as person-level effects do not refer to the group as a whole, but rather refer to the position of individuals within their groups. Specifically, in the case of a person-level predictor, Step 4 and Step 5 test the degree to which the predictor is associated with individuals’ positions relative to the group-mean level. For instance, ethnic-minority group members may generally show less consensus with their groups (δ2), and this level of consensus may increase or decrease over time so that they become more or less consistent with other members of their group (as indicated by the value of δ3). Likewise, a reasonable assumption is that group leaders are generally more central than other group members (i.e., they show higher levels of consensus) and may typically also become more central in their groups over time.
The lowest portion of Table 1 summarizes how the contribution of individual-level predictors to group processes can be tested using the MGPF.
Examples of Explanatory Analyses
The jury data set
Tables 4 and 5 provide results of analyses of the jury data set in which we included explanatory predictors. The purpose of the original jury study was to evaluate whether the introduction of DNA evidence could improve the jury process. Therefore, 40 of the 60 juries received additional information about DNA evidence before and during their deliberation. For a basic test of whether this additional information altered the deliberation process, we added condition (0 = no DNA evidence provided, 1 = DNA evidence provided) as a group-level predictor. The model estimates in Table 5 indicate that condition was not associated with the intercept or with latent mean-level change (also see Fig. 2). However, the model estimate for δ2 in Table 5 and the comparisons for Step 5 in Table 4 indicate that the groups that received DNA evidence showed stronger consensus than the other groups, δ2 = −0.10, χ2(1) = 4.7, p < .05. DNA evidence thus generally increased agreement among the jurors across all three time points. The level of consensus did not change differently in the two conditions, as indicated by the nonsignificant interaction between condition and time, χ2(1) = 0.0. In summary, providing additional DNA information generally increased consensus, but did not accelerate the emergence of consensus in the juries over time.
Results for the Explanatory Modeling Steps in the Analyses of the Jury and the Basic-Training Data Sets
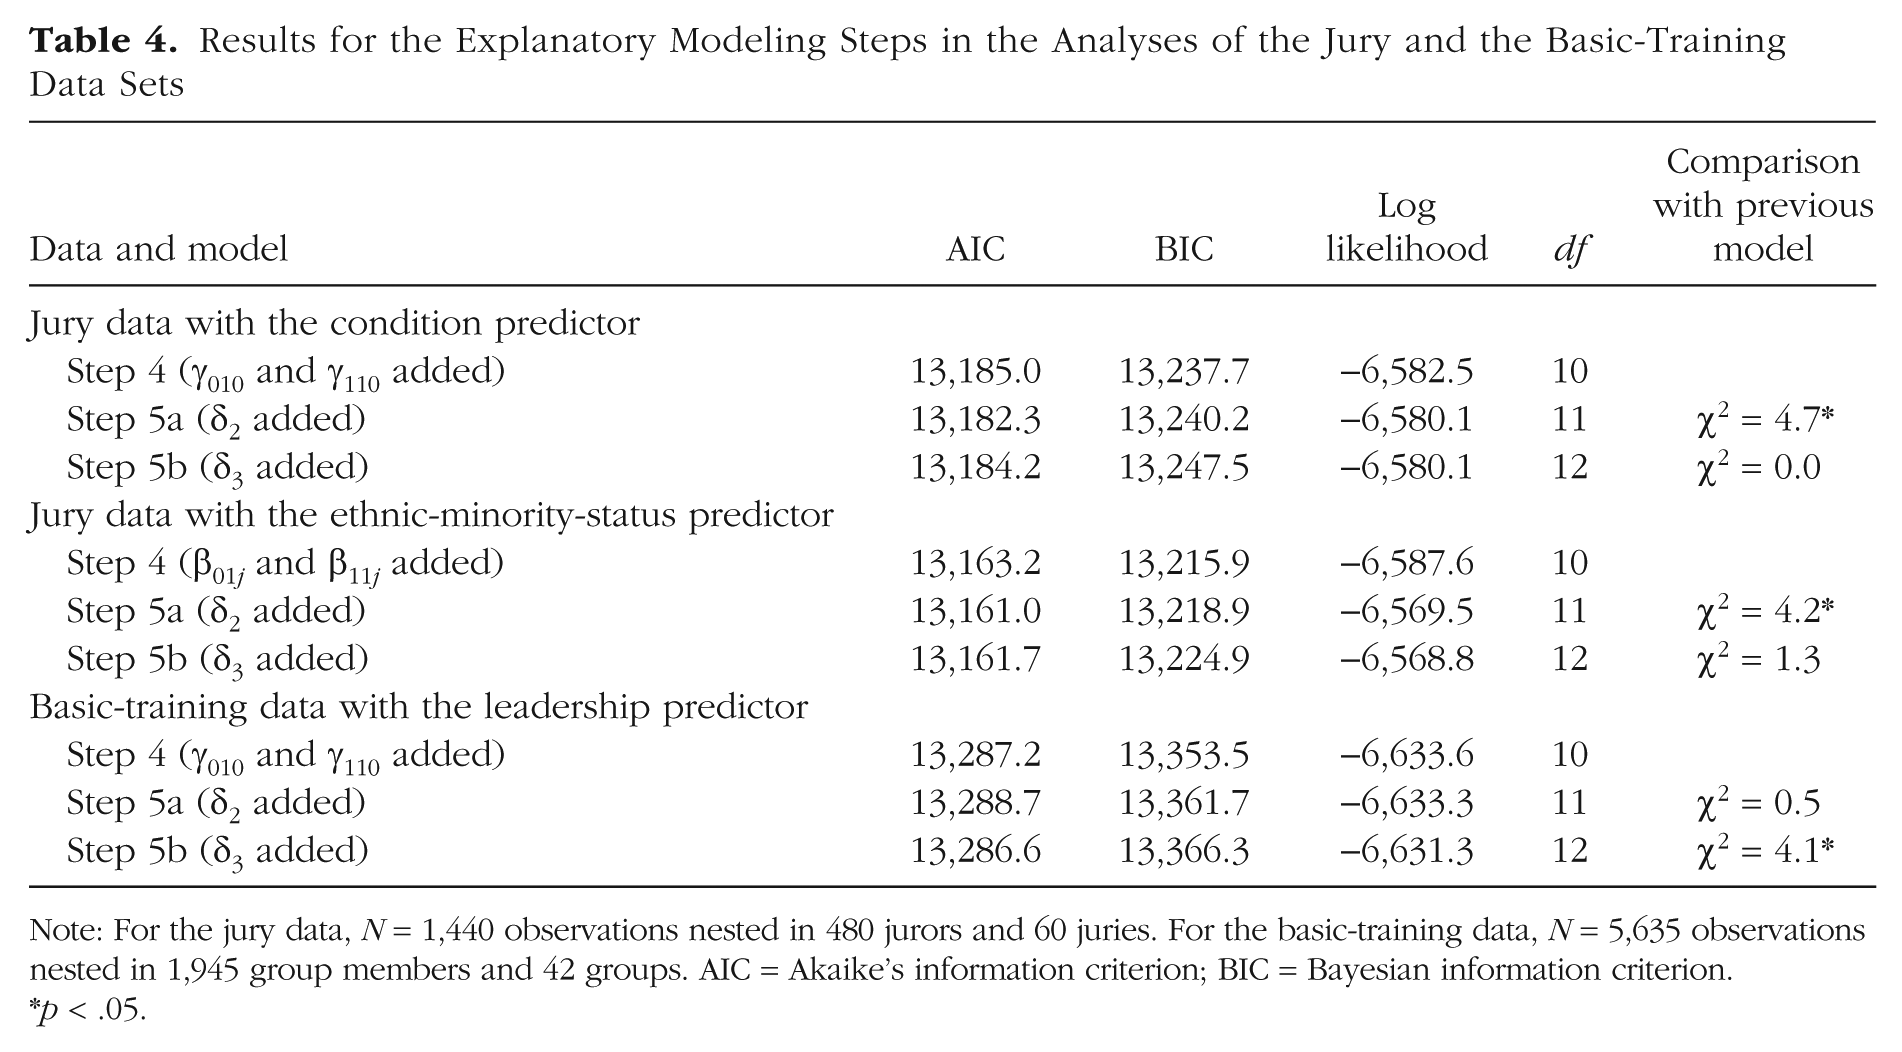
Note: For the jury data, N = 1,440 observations nested in 480 jurors and 60 juries. For the basic-training data, N = 5,635 observations nested in 1,945 group members and 42 groups. AIC = Akaike’s information criterion; BIC = Bayesian information criterion.
p < .05.
Parameter Estimates for Step 5a in the Best-Fitting Models From the Analyses of the Jury Data Set
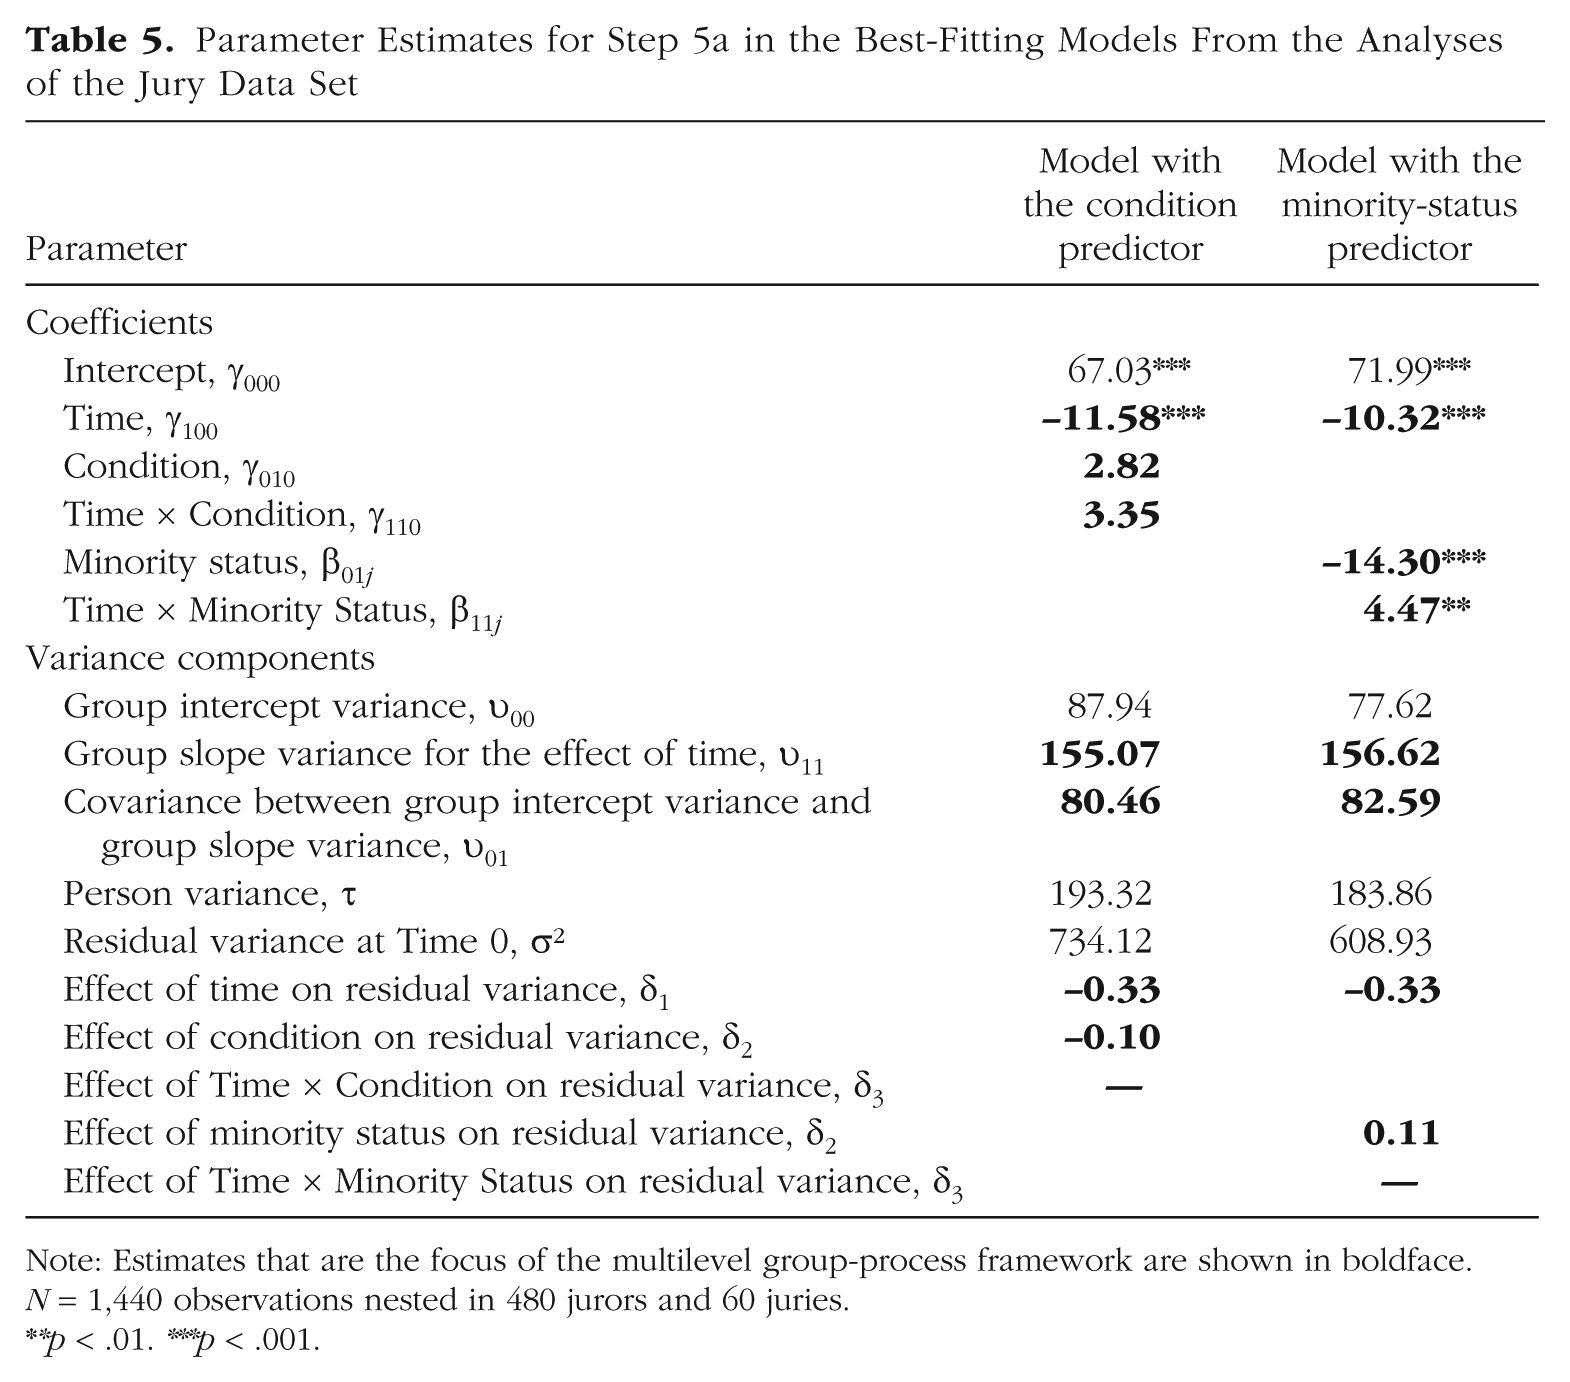
Note: Estimates that are the focus of the multilevel group-process framework are shown in boldface. N = 1,440 observations nested in 480 jurors and 60 juries.
p < .01. ***p < .001.
Another question that is frequently of interest in research on jury deliberation is whether jurors who are members of a minority racial or ethnic group (Hispanic, Black, Native American, or non-White in the United States) behave differently than jurors who belong to the majority (Bornstein & Greene, 2011; MacCoun, 1989; Sommers, 2007). To study this research question using the MGPF, we used ethnic-minority status (1 = non-White, 0 = White) as a person-level predictor. Figure 2 shows the minority status of the jurors in the juries of this data set.
We began by adding ethnic-minority status as a predictor in Step 4. As Table 5 shows, minority jurors differed in their mean level and the amount of change in their latent means over time. Specifically, compared with other jurors, minority jurors were less convinced that the defendant was guilty at the start of the study (β01j = −14.30, p < .001). This finding is in line with earlier research suggesting that the experiences of non-White Americans with the justice system differs from the experience of the White majority (Sommers, 2007). The evaluations of minority jurors also had a less steep slope over time compared with the evaluations of other jurors, β11j = 4.47, p < .01. Thus, ethnic-minority jurors showed less change from their original views than nonminority jurors did. A potential explanation for this pattern is that minority jurors had already identified or thought about potential mitigating circumstances on their own, and thus during the experiment, information on potentially mitigating circumstances affected their opinions less.
As indicated in Tables 4 and 5, results for Step 5 revealed that ethnic-minority jurors also differed from nonminority jurors in their level of consensus with the group, χ2(1) = 4.24, p < .05, generally showing less consensus than other jurors, δ2 = 0.11. This pattern remained constant across time, as indicated by a nonsignificant interaction of the predictor with time, χ2(1) = 1.3.
The basic-training data set
In the basic-training data set, we examined whether having highly rated drill sergeants in the beginning of basic training (modeled as a shared platoon-level rating) was related to changes in the mean trajectories and to changes in the residual variances (see Tables 4 and 6). Despite evidence suggesting that platoons differed in their mean trajectories, we found no evidence in Step 4 that these differences were related to leadership, β01j = −0.03, n.s.
Parameter Estimates for Step 5b in the Best-Fitting Model From the Analysis of the Basic-Training Data Set
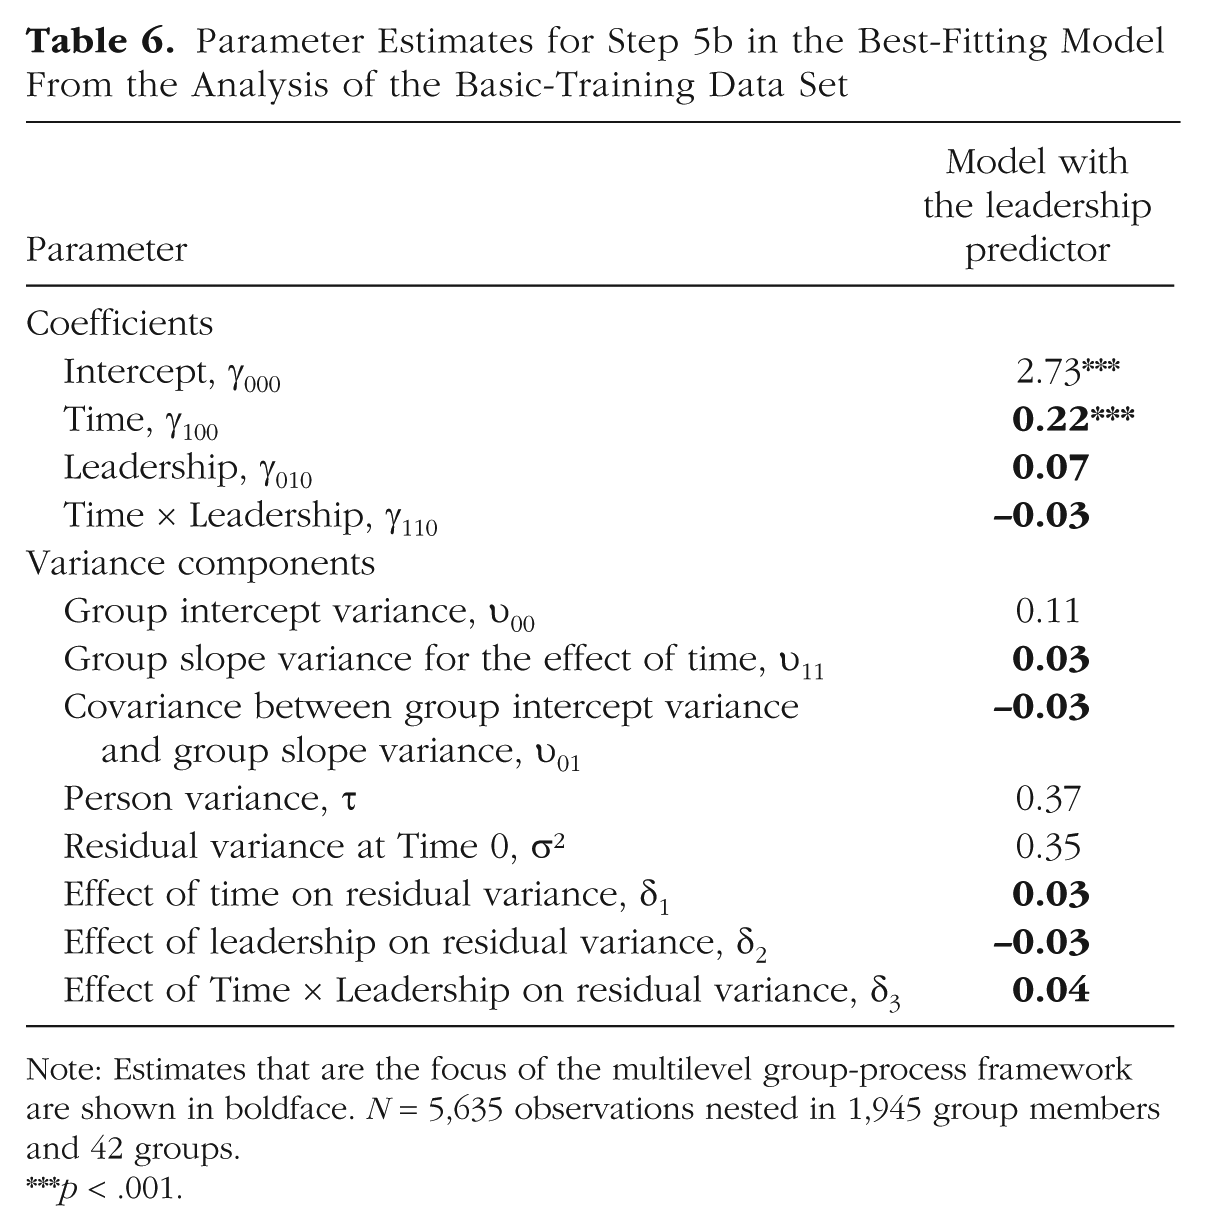
Note: Estimates that are the focus of the multilevel group-process framework are shown in boldface. N = 5,635 observations nested in 1,945 group members and 42 groups.
p < .001.
Likewise, in Step 5a, we found no evidence to suggest that ratings of leadership were related to mean levels of residual variance, δ2 = 0.01, χ2(1) = 0.48, n.s., which suggests that overall levels of consensus were unrelated to how the groups rated their leadership. However, we found that leadership and time had an interaction effect on residual variance in Step 5b, δ3 = 0.04, χ2(1) = 4.07, p < .05. At Time 0 (first measurement), groups with low leadership ratings (1 SD below the mean) and groups with high leadership ratings (1 SD above the mean) had similar residual variances (σ2 = 0.37 and σ2 = 0.34, respectively). In contrast, at Time 2 (last measurement), the residual variance of groups with initially low leadership ratings was relatively unchanged, σ2 = 0.36, but the residual variance of groups with initially high leadership ratings increased to 0.43. This effect is a bit surprising, as one might normally expect that positive leadership would help groups develop strong shared climates. In this case, though, units with more positive leadership tended to show less consensus regarding cohesion over time. A potential explanation for this finding is that only some soldiers resonated with strong leadership, and other soldiers who struggled in basic training felt estranged by highly rated leaders. Ultimately, though, we caution readers not to overinterpret these exploratory findings, but rather to appreciate the types of questions that can be addressed with the MGPF.
Advantages of the Multilevel Group-Process Framework
The MGPF addresses several issues and challenges in studying group processes and also allows researchers to test novel research hypotheses. In this section, we highlight some of these specific advantages.
A systematic approach for studying group processes
The MGPF translates several theoretical group phenomena into specific hypotheses within a statistical model and thus allows researchers to test these hypotheses empirically with laboratory or field data. We have presented a step-by-step procedure that researchers can follow to systematically map and explore the potential presence of various change phenomena in their data.
Jointly studying the emergence of consensus and directional shift
One core limitation of many previous approaches to studying groups is that these approaches frequently focus on group phenomena involving mean-level change or consensus change in isolation. The MGPF models both types of processes within one framework and thus helps avoid potential bias (see Bliese & Ployhart, 2002; Lang & Bliese, 2018; Lang et al., 2018) when researchers study mean-level change without accounting for consensus change or vice versa.
Formal tests
One important advantage of the methods we have described in this article is that they provide formal tests for the emergence of consensus and unbiased tests for latent mean-level change. Extant approaches for studying the emergence of consensus (e.g., using the ICC1) do not directly provide researchers with a way to statistically test whether a pattern of change in their data is significant or not. Extant approaches for studying mean-level change typically aggregate group members’ responses and ignore potential within-group changes in consensus. Notably, viewing group processes and dynamics from a multilevel perspective allows researchers to add predictors of different types of change and can thus be used with both correlational and experimental data.
Flexible estimation
Although the framework we have described is not based on models that go beyond standard multilevel models, MGPF analyses can nevertheless be estimated in a variety of software programs, such as nlme (Pinheiro & Bates, 2000), glmmTMB (Brooks et al., 2017), and the Bayesian MCMCglmm (Hadfield, 2010) in R; NLMIXED in SAS (Wolfinger, 1999); and Mplus (Muthén & Muthén, 2018). A somewhat different parameterization of the models (see Lang et al., 2018, for details) can be fitted using flexible standard multilevel software, such as lme4 in R (Bates, Mächler, Bolker, & Walker, 2015), mlwin (Goldstein, 2011), or HLM (Raudenbush & Bryk, 2002). In the appendix, we provide code for our analyses of the jury data using nlme in R. This code can easily be adapted to other data sets.
Conclusion
We started this article by noting that psychologists are frequently interested in understanding the complex change processes that take place in groups in a variety of applied settings. However, when researchers seek to study and model these processes, they are confronted with the fact that several different processes can unfold simultaneously in groups over time. In this article, we have described a framework that allows researchers to track latent mean-level change and consensus change in groups and to test predictors of both processes. We believe that this framework provides a basis for gaining new insights into how group processes unfold over time.
Supplemental Material
LangOpenPracticesDisclosure – Supplemental material for Opening the Black Box: A Multilevel Framework for Studying Group Processes
Supplemental material, LangOpenPracticesDisclosure for Opening the Black Box: A Multilevel Framework for Studying Group Processes by Jonas W. B. Lang, Paul D. Bliese and Amy B. Adler in Advances in Methods and Practices in Psychological Science
Footnotes
Appendix: R Code for Reading in,Preparing,and Analyzing the Jury Data
Acknowledgements
This material has been reviewed by the Walter Reed Army Institute of Research, which has no objection to its presentation and/or publication. The opinions or assertions contained herein are the private views of the authors, and are not to be construed as official, or as reflecting true views of the Department of the Army or the Department of Defense. The investigators have adhered to the policies for protection of human subjects as prescribed in Army Regulation (AR) 70–25.
Action Editor
Jennifer L. Tackett served as action editor for this article.
Author Contributions
J. W. B. Lang reanalyzed the jury data, and P. D. Bliese reanalyzed the Army data. J. W. B. Lang wrote the first draft of the manuscript, with the exception that P. D. Bliese and A. B. Adler wrote the sections on the Army data. P. D. Bliese and A. B. Adler edited the first draft and rewrote several sections. All the authors approved the final submitted version of the manuscript.
Declaration of Conflicting Interests
The author(s) declared that there were no conflicts of interest with respect to the authorship or the publication of this article.
Open Practices
Preregistration: not applicable
The complete Open Practices Disclosure for this article can be found at http://journals.sagepub.com/doi/suppl/10.1177/2515245918823722. This article has received badges for Open Data and Open Materials. More information about the Open Practices badges can be found at ![]() .
.
References
Supplementary Material
Please find the following supplemental material available below.
For Open Access articles published under a Creative Commons License, all supplemental material carries the same license as the article it is associated with.
For non-Open Access articles published, all supplemental material carries a non-exclusive license, and permission requests for re-use of supplemental material or any part of supplemental material shall be sent directly to the copyright owner as specified in the copyright notice associated with the article.