
Abstract
In the traditional statistical framework, nonsignificant results leave researchers in a state of suspended disbelief. In this study, we examined, empirically, the treatment and evidential impact of nonsignificant results. Our specific goals were twofold: to explore how psychologists interpret and communicate nonsignificant results and to assess how much these results constitute evidence in favor of the null hypothesis. First, we examined all nonsignificant findings mentioned in the abstracts of the 2015 volumes of Psychonomic Bulletin & Review, Journal of Experimental Psychology: General, and Psychological Science (N = 137). In 72% of these cases, nonsignificant results were misinterpreted, in that the authors inferred that the effect was absent. Second, a Bayes factor reanalysis revealed that fewer than 5% of the nonsignificant findings provided strong evidence (i.e., BF01 > 10) in favor of the null hypothesis over the alternative hypothesis. We recommend that researchers expand their statistical tool kit in order to correctly interpret nonsignificant results and to be able to evaluate the evidence for and against the null hypothesis.
Never use the unfortunate expression “accept the null hypothesis.”
The interpretation of statistically nonsignificant findings is a vexing point of traditional psychological research. 1 Within the framework of null-hypothesis significance testing (NHST; Fisher, 1925; Neyman & Pearson, 1933), decisions about the null hypothesis are based on the p value. Under NHST logic, one is entitled to reject the null hypothesis whenever the p value is smaller than or equal to a predefined α threshold (typically set at .05; but see Benjamin et al., 2018). In contrast, the p value does not entitle one to claim support in favor of the null hypothesis. According to the common interpretation, any p value higher than α indicates that one has to withhold judgment about the null hypothesis (Cohen, 1994). This asymmetric characteristic of the NHST framework frustrates the interpretation and communication of nonsignificant results (Edwards, Lindman, & Savage, 1963; Nickerson, 2000). It is known that results with a p value greater than .05 are subject to misinterpretation among researchers (Goodman, 2008), but the extent to which this biases the communication of psychological findings has been unexplored. In this article, we examine the degree of miscommunication of nonsignificant findings in current psychological publications; in addition, we use Bayes factors to assess how much these findings support the null hypothesis relative to a composite alternative hypothesis (e.g., Etz & Vandekerckhove, 2017).
Nonsignificant findings in psychological research are both disliked and misinterpreted, and this brings dire consequences. First, the common aversion to nonsignificant findings (e.g., Ferguson & Heene, 2012; Greenwald, 1975) not only causes publication bias (e.g., Franco, Malhotra, & Simonovits, 2014) but also harms the validity of the reported outcomes. For example, most questionable research practices are aimed at transforming otherwise nonsignificant p values into significant p values (e.g., Hartgerink, van Aert, Nuijten, Wicherts, & van Assen, 2016; Lilienfeld & Waldman, 2017; Nuijten, Hartgerink, van Assen, Epskamp, & Wicherts, 2016; Pritschet, Powell, & Horne, 2016). Second, nonsignificant findings are commonly misinterpreted, usually because researchers regard nonsignificant p values as support for the null hypothesis (i.e., misconception #2 in Goodman, 2008). However, p values larger than the threshold indicate only that the test was incapable of rejecting the null hypothesis; this could have occurred because the effect does not exist, but it also could have occurred because the power of the test was insufficient to detect a true effect (Dienes, 2014, 2016). Indeed, an examination of the psychology literature suggests that a high proportion of statistically nonsignificant results are false negatives (Hartgerink, Wicherts, & van Assen, 2017).
Finally, when confronted with nonsignificant findings, researchers may seek refuge in a description of the sample rather than inference concerning the population; such a tendency is revealed by expressions such as “no difference between the groups was observed.” Such statements about the sample are problematic, as the observed difference is never exactly zero in the case of continuous data, even when the null hypothesis holds exactly. The question that bears scientific interest always concerns the extent to which observed effects generalize to the population. One could argue that sometimes the authors do not mean literally what they write in these cases and that expert readers can reach the proper interpretation. Nevertheless, these expressions represent a type of miscommunication that can create ambiguity for experts and misunderstanding for lay readers. Despite much recent discourse on methodological challenges in the empirical sciences (e.g., Munafò et al., 2017), the ways in which nonsignificant findings are discussed and interpreted have remained relatively unexplored. One previous study (Hoekstra, Finch, Kiers, & Johnson, 2006) explored whether the recommendations of the fifth edition of the American Psychological Association’s (2001) publication manual improved the way authors report and interpret the results of significance testing. The data showed that both before and after the publication of the new guidelines, nonsignificant effects were interpreted as claims of no effect in 60% of cases.
In this article, we report an observational study in which we investigated the prevalence of various interpretations of nonsignificant findings. We also explored the evidential value of these results using Bayes factors (e.g., Jeffreys, 1961; Kass & Raftery, 1995). Unlike NHST, Bayes factors indicate how much the data favor one hypothesis over another (Dienes, 2008). Therefore, when the necessary information was available, we computed Bayes factors for all reported nonsignificant t-test results in our sample. This allowed us to explore the degree to which reported nonsignificant results actually provide support for the null hypothesis.
Disclosures
Preregistration
Our data-analysis plan was uploaded to the Open Science Framework (OSF) prior to conducting the analyses. The document is available at https://osf.io/f2n7c. The statistical analyses of the link between Bayes factors and p values and between Bayes factors and sample sizes were not specified in the preregistration. Further minor deviations from this plan are described in the Supplemental Material available online (http://journals.sagepub.com/doi/suppl/10.1177/2515245918773742).
Data, materials, and online resources
All data and materials, as well as the R code for the analyses and figures, can be accessed at https://osf.io/f2n7c/. The Supplemental Material (http://journals.sagepub.com/doi/suppl/10.1177/2515245918773742) presents the Bayesian robustness test, describes our deviation from the original research plan, and discusses our results from exploratory analyses using the distribution of p values.
Reporting
We report how we determined all data exclusions and all measures in the study.
Ethical approval
No ethical approval was required for this project as we analyzed published articles without collecting new data.
Method
Sample
We selected the abstracts of every empirical research article with human participants published in 2015 in the journals Psychological Science (n = 150), Psychonomic Bulletin & Review (n = 167), and Journal of Experimental Psychology: General (n = 95; overall N = 412). All three are prominent journals that cover broad areas of psychological research. From this collection, we selected the articles that contained at least one negative empirical statement in their abstracts. By “negative statement,” we mean that the authors explicitly stated the absence of an effect (e.g., “had no effect,” “were the same”) or that they referred to a nonsignificant finding (e.g., “was not significant”).
For each negative statement, we screened the main text and supplement of the article to additionally record (a) the corresponding p value, (b) the type of statistical analysis, and (c) the sentence describing the results of the analysis. Additionally, when the claim was based on a t statistic (one-sample, paired-samples, or independent-samples t test), we recorded the t value and the number of participants in each experimental group. 2
Screening procedure
The data-collection procedure was the following: One author screened the selected abstracts and judged whether they contained negative statements. If an abstract contained one or more such statements, the author extracted the corresponding additional data from the article. The selected articles were then reexamined by another author to ensure that the statements in the abstracts were based on the selected statistical tests. Next, two authors independently categorized each of the extracted claims from the abstracts using three categories and two subcategories (see Table 1 for hypothetical examples):
Hypothetical Examples for the Categories of Claims Concerning Nonsignificant Findings
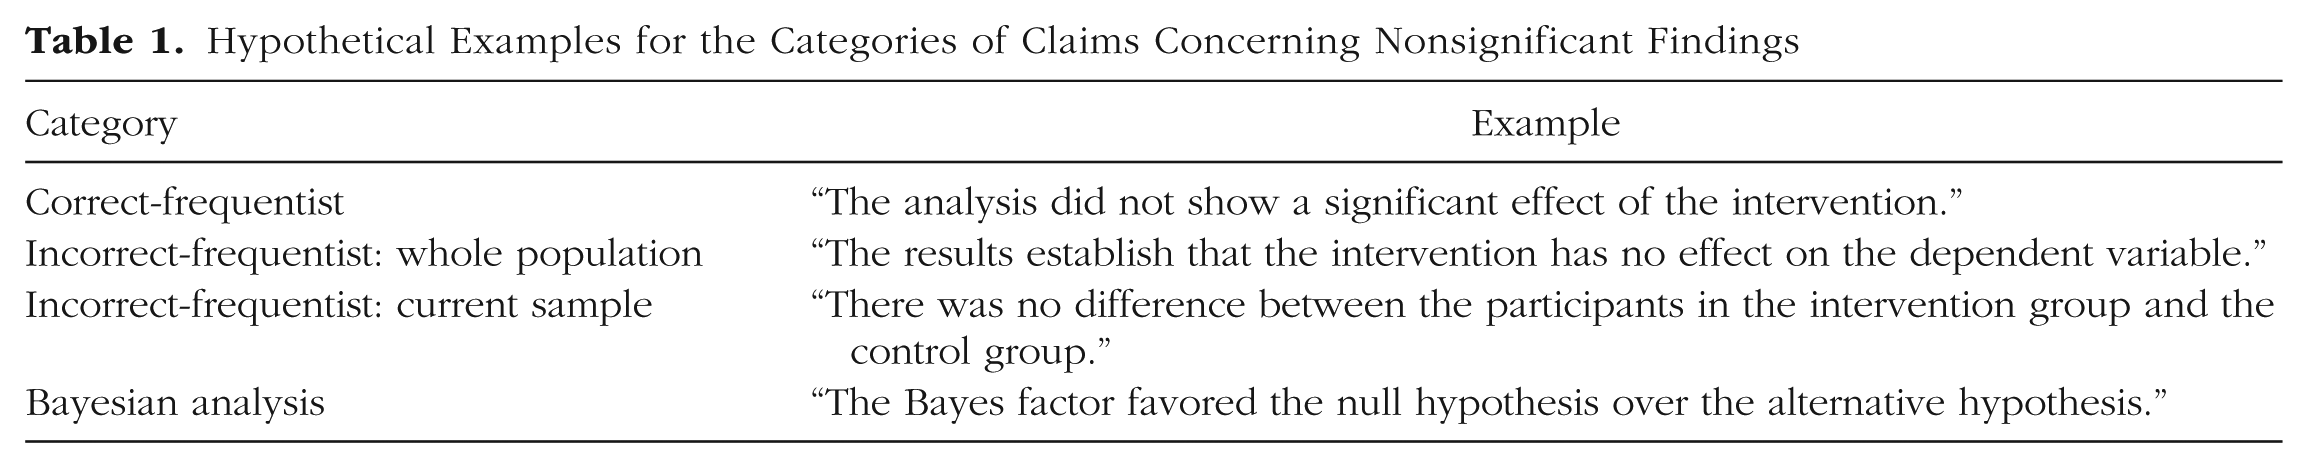
The correct-frequentist category included statements that referred only to the fact that the analysis did not yield a significant result and did not imply that the effect is absent in the population
The incorrect-frequentist category included statements indicating that the authors inferred the absence of an effect from a nonsignificant result. We differentiated two subcategories: one for statements generalized to the whole population and another for statements restricted to the current sample.
The Bayesian analysis category included statements indicating that the authors used Bayes factors to quantify evidence in favor of the null hypothesis.
Disagreements regarding categorization were resolved by discussion, and the agreement of at least three authors was needed to reach a conclusion in any given case.
Calculating Bayes factors
To gauge the strength of evidence for the null hypothesis, we calculated Bayes factors, that is, the likelihood of the data under the null hypothesis (i.e., equal population means) divided by the likelihood of the data under the alternative hypothesis. Bayes factors greater than 1 indicate relative evidence for the null hypothesis, whereas Bayes factors smaller than 1 indicate relative evidence for the alternative hypothesis. As an aid for interpretation of the Bayes factors, we employed Jeffreys’s (1961) classification scheme (see also Lee & Wagenmakers, 2013): Bayes factors between 1/3 and 3 are labeled anecdotal evidence, Bayes factors between 3 and 10 (or between 1/3 and 1/10) indicate moderate evidence, and Bayes factors greater than 10 or smaller than 1/10 indicate strong evidence.
We calculated Bayes factors only when t tests were reported. To obtain the Bayes factors that correspond to the reported t statistics and degrees of freedom, we applied the default settings of the ttest.tstat function of the BayesFactor R package (Morey, Rouder, & Jamil, 2015). The default settings specify the alternative hypotheses by assigning effect size a two-tailed Cauchy distribution with medium scale (i.e., r = √2/2). This default JZS prior (Rouder, Speckman, Sun, Morey, & Iverson, 2009) constitutes one of several proposed methods to specify the predictions of the alternative hypothesis. As we detail later, we repeated our Bayes factor reanalysis using two alternative prior distributions in order to explore the robustness of the results.
Results
Planned analyses
Screening
We found at least one negative statement in 132 of the 412 screened abstracts (Psychological Science: n = 39; Psychonomic Bulletin & Review: n = 58; Journal of Experimental Psychology: General: n = 35). These 132 abstracts contained 137 negative statements (Psychological Science: n = 39; Psychonomic Bulletin & Review: n = 61; Journal of Experimental Psychology: General: n = 37). We linked these statements to 175 statistical tests from the articles, and we collected 122 reported p values from these tests (Psychological Science: n = 26; Psychonomic Bulletin & Review: n = 46; Journal of Experimental Psychology: General: n = 50). The number of reported p values is substantially smaller than the number of tests because some tests used nonfrequentist statistics (e.g., Bayes factors) and in several cases, the p value was not reported (e.g., for nonsignificant regression slopes or analyses of variance) and could not be retrieved from the authors. 3
Categories of statements
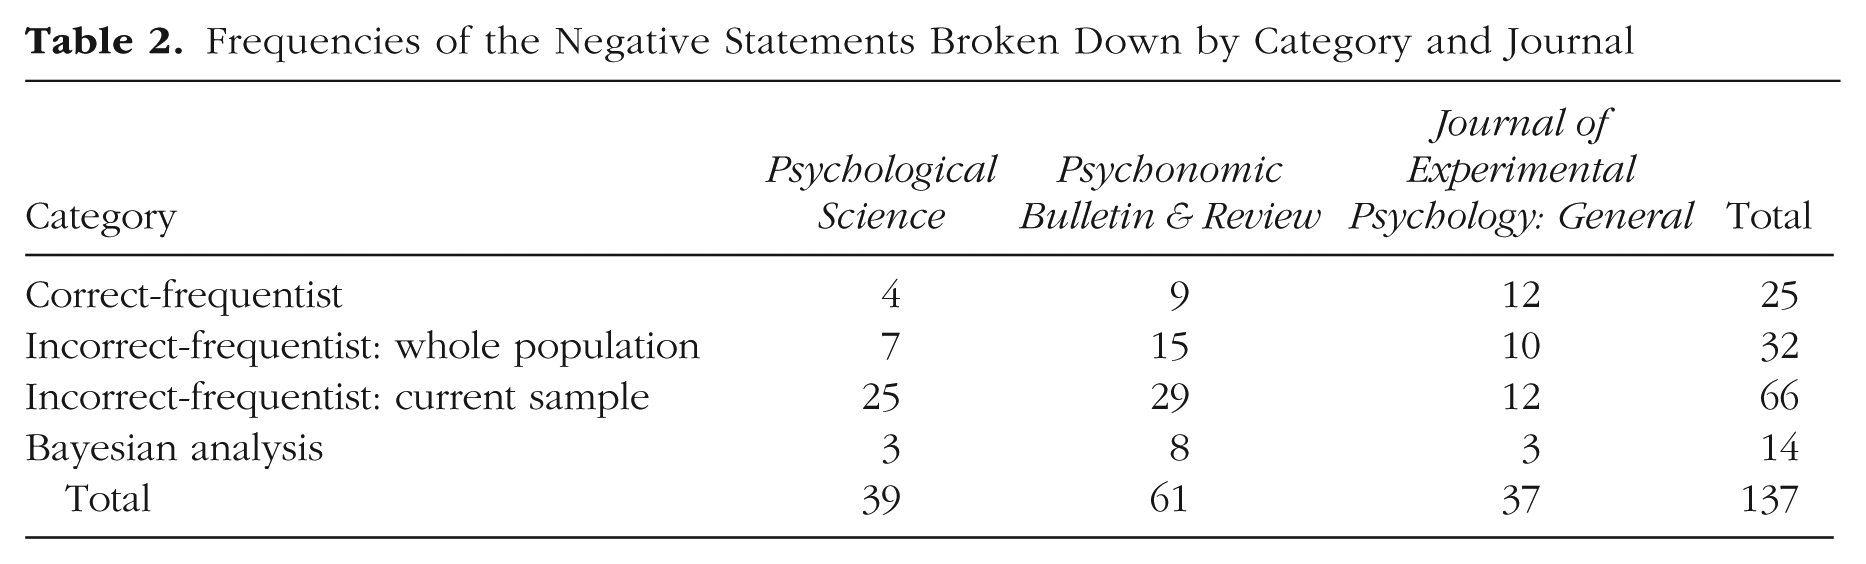
We found that 72% (n = 98) of the negative statements misinterpreted the nonsignificant result; 23% (n = 32) fell in the “incorrect-frequentist: whole population” subcategory, and 48% (n = 66) fell in the “incorrect-frequentist: current sample” subcategory. Only 18% (n = 25) of the statements were categorized as correct frequentist reporting. The least common category was “Bayesian analysis,” which included only 10% (n = 14) of the statements. Table 2 reports the frequencies of the different categories of negative claims broken down by journal.
Frequencies of the Negative Statements Broken Down by Category and Journal
Bayesian analyses
From the 175 statistical tests that we collected from the articles, we identified 67 t tests and were able to acquire the necessary information for Bayesian analyses of 63 tests. We calculated Bayes factors (BF01—evidence in favor of the null hypothesis) with a medium-scale (r = √2/2) Cauchy prior under the alternative hypothesis. The 63 t tests yielded 16 anecdotal (25%), 45 moderate (71%), and 2 strong (3%) BF01s, all of them in favor of the null hypothesis. Both of the strong BF01s were obtained in studies with sample sizes of more than 300 participants (see Exploratory Bayesian Analyses for a more thorough description of the link between sample size and BF01s).
Robustness test
These results were obtained for a specific prior distribution (i.e., a two-tailed medium-scale Cauchy distribution on the standardized effect size). To probe the robustness of the results, we calculated the BF01s of the 63 t tests using normal priors (Dienes, 2014) and informed priors (Gronau, Ly, & Wagenmakers, 2017; see the Supplemental Materials for a detailed description). Figure 1 shows the BF01s, ordered by their size, as calculated with each of the three priors. The figure also indicates the percentages of the BF01s in the different evidence categories. With the default prior, 74.6% (n = 47) of the BF01s were greater than 3 (providing at least moderate evidence for the null), whereas with the informed prior, only 44.4% (n = 28) of the BF01s provided this level of support for the null. BF01s computed with the normal prior showed even weaker evidential support for the null, as only 25.4% (n = 16) of them exceeded a value of 3. Applying the informed rather than the default prior changed the evidential category of the BF01s in 20 cases (31.7%), and application of the normal rather than the default prior resulted in 33 (52.4%) changes in the evidential category. However, as is apparent from Figure 1, the differences between the values of the BF01s calculated with the different models were in most cases not substantial. The large number of differences in evidence categorizations is due to the fact that the majority of the BF01s were scattered around the category thresholds.
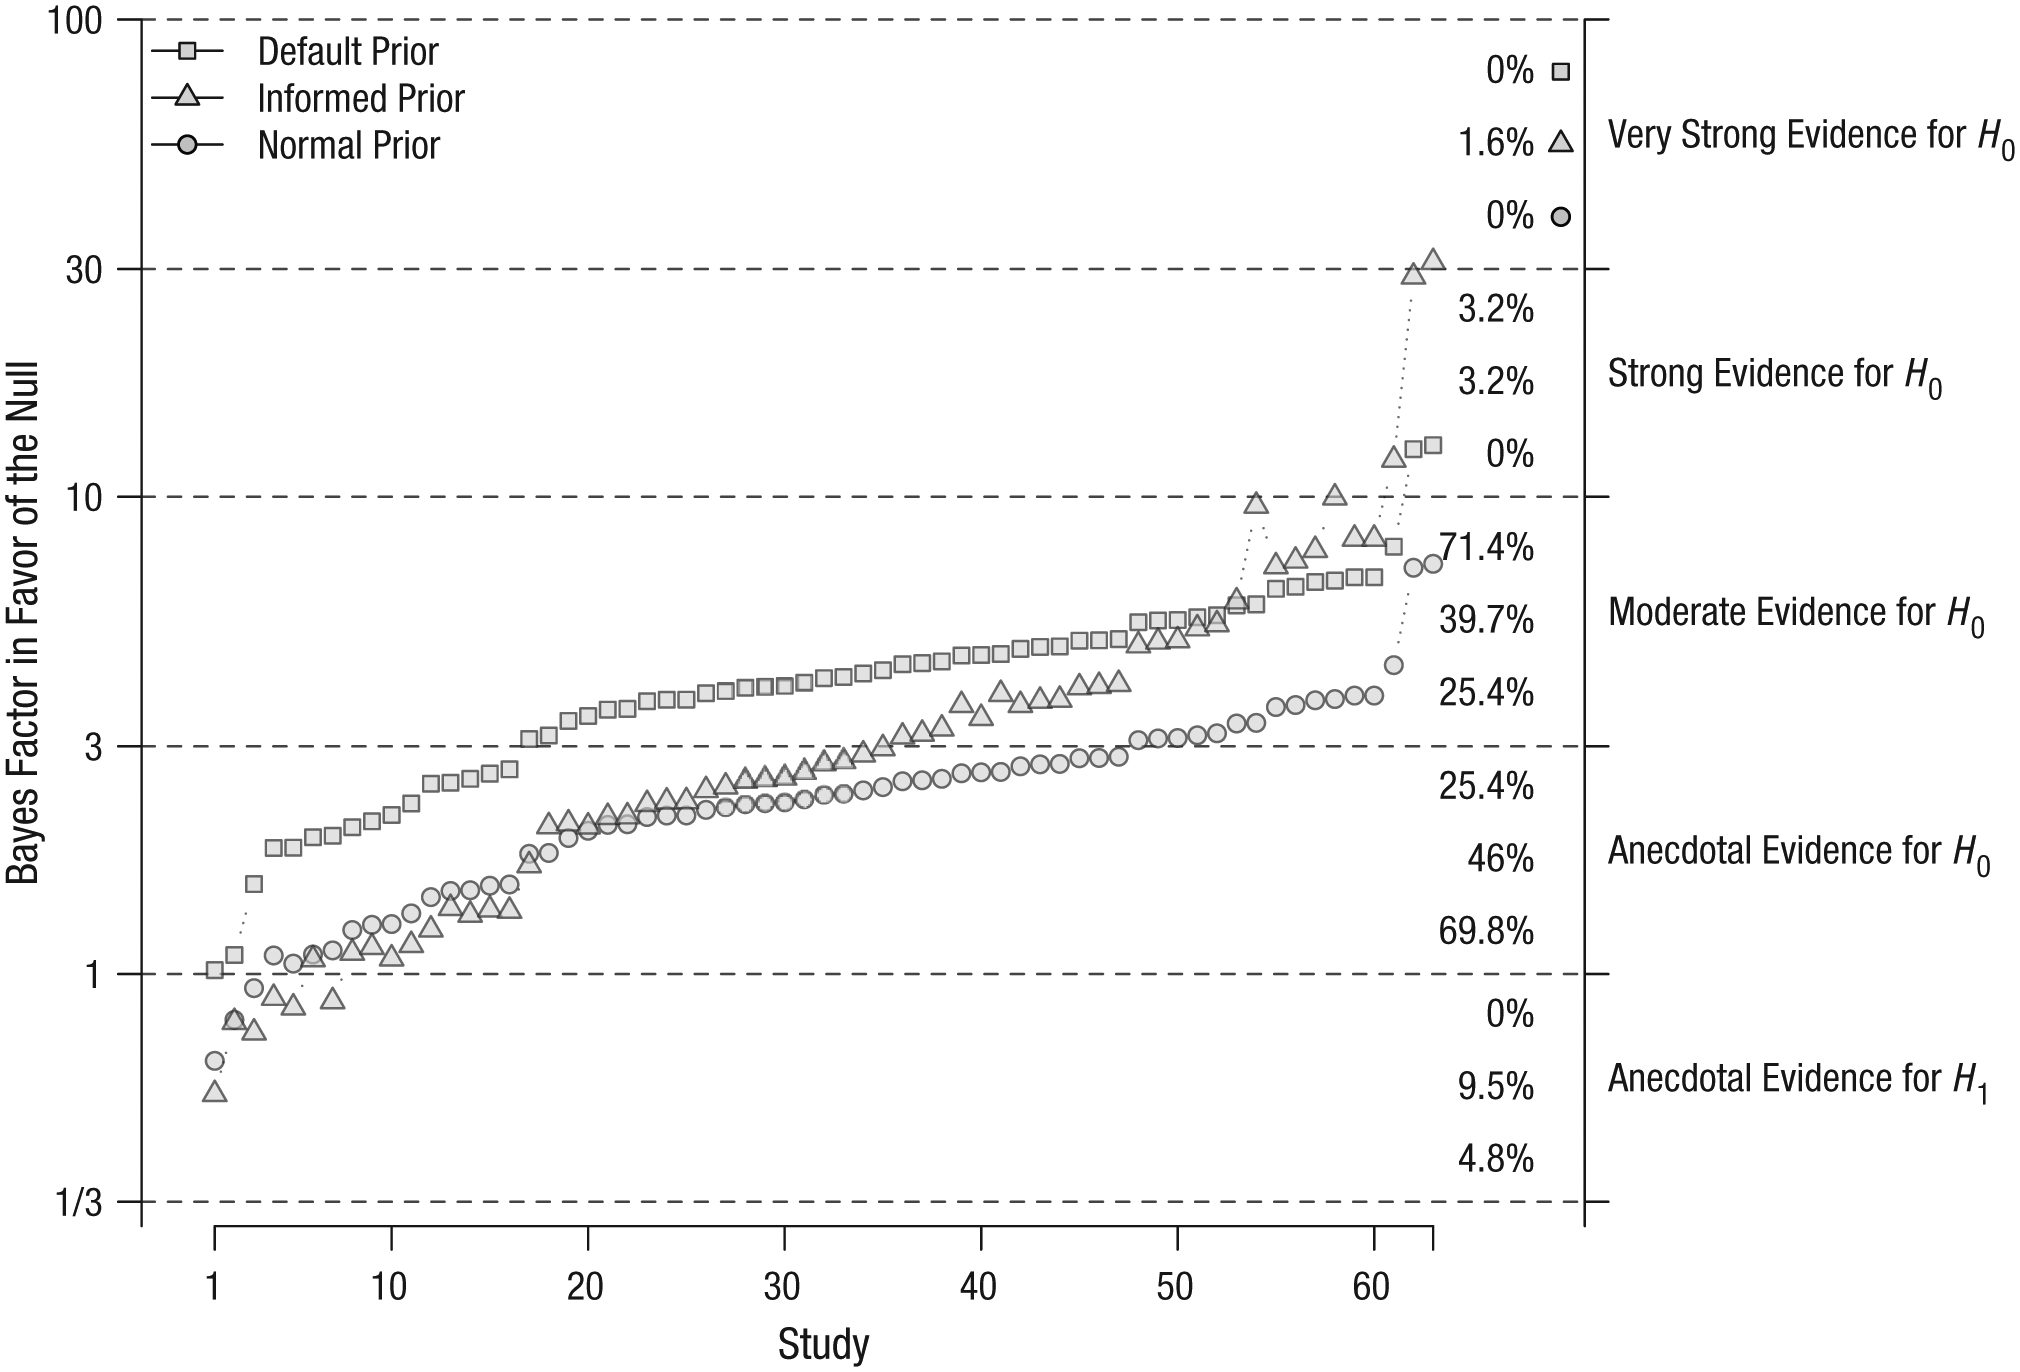
Bayes factors in favor of the null hypothesis (H0) for each of the 63 nonsignificant t tests reported in the selected literature. For each t test, Bayes factors were calculated with default, informed, and normal prior specifications of the alternative hypothesis (H1). Note that the scaling of the y-axis has been log-e transformed to facilitate visualization of the relationships between the Bayes factors calculated with different prior specifications. The labels on the right-hand side of the y-axis represent Jeffreys’s (1961) scheme for classifying the strength of evidence. To the left of each label, the numbers indicate the percentage of all results falling in the indicated category when the Bayes factors were calculated using default, informed, and normal prior specifications, respectively (from top to bottom). This figure has been reformatted from the original, which was published under a CC-By Attribution International License and is available at https://doi.org/10.6084/m9.figshare.5721076.v1.
Exploratory Bayesian analyses
To explore the extent to which the p values and the corresponding BF01s were associated, we plotted the reported p values 4 against the BF01s calculated with the default prior (see Fig. 2) and conducted Bayesian parameter estimation by computing Kendall’s τ and its 95% credible interval (CI; see Box 1 for additional analytic details). This correlation analysis revealed that the relationship between the p values and the BF01s was moderate and that the true value of the correlation likely fell between .20 and .50 (τ = .38, 95% CI = [.20, .52]). Figure 2 shows that this moderate relation was driven primarily by the correlation between the low p values (smaller than .3) and the BF01s, and that the values of the BF01s leveled off for p values higher than .3. The figure also shows that high p values do not guarantee strong evidence for the null hypothesis.
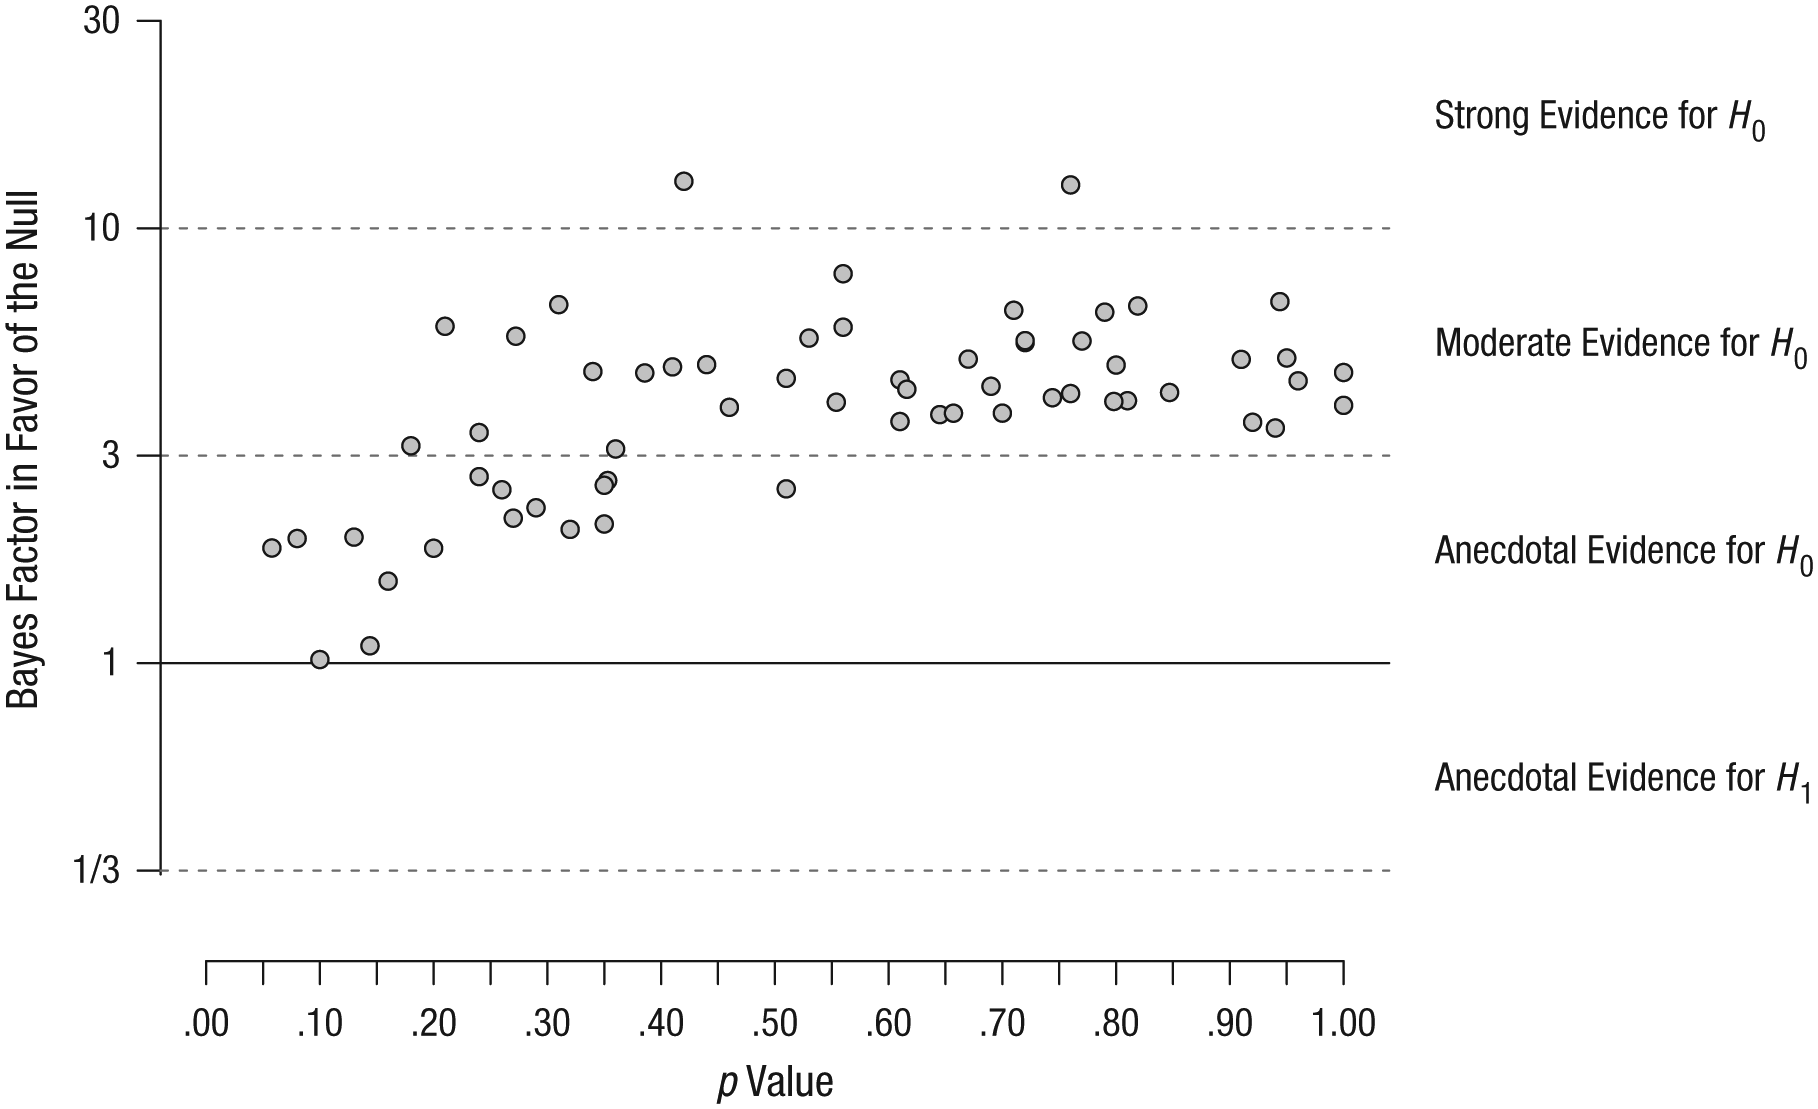
Scatterplot showing the relationship between the p values from the selected studies and the corresponding default BF01s (τ = .38, 95% credible interval = [.20, .52]). Note that the scaling of the y-axis has been log-e transformed to facilitate visualization of the relationship. Plotted points above the solid black line indicate evidence for the null hypothesis. This figure has been reformatted from the original, which was published under a CC-By Attribution International License and is available at https://doi.org/10.6084/m9.figshare.5721076.v1.
Bayesian Parameter Estimation
For the two exploratory correlation analyses reported in this section, we decided to conduct Bayesian parameter estimation instead of hypothesis testing. Therefore, we report the correlation coefficients (Kendall’s τs) with their 95% credible intervals (CIs). The investigated associations were nonlinear; thus, we opted to compute Kendall’s τ to estimate the population effect sizes (e.g., Kendall & Gibbons, 1990). To calculate Kendall’s τ, we used the KendallTauB function from the DescTools R package (Signorell, 2017). We passed on the τ value and the sample size to compute the 95% CIs with the credibleIntervalKendallTau function created by van Doorn, Ly, Marsman, and Wagenmakers (2016). We employed the two-tailed default prior distribution of τ, which is a nonuniform distribution on τ constructed from a uniform distribution on the Pearson’s ρ (parametric yoking; van Doorn et al., 2016).
Next, we investigated the relationship between sample size and BF01. It is apparent from Figure 3 that the majority of the BF01s providing anecdotal evidence in favor of the null hypothesis (13 cases, 81.25% of all anecdotal BFs) were obtained in studies with small sample sizes (n < 35). In contrast, 48% (12 cases) of the small samples produced moderate evidence in favor of the null hypothesis. Strong evidence was reached only in studies with large samples (n > 300), and all of the large-sample studies provided at least moderate evidence in favor of the null hypothesis. To estimate the strength of the association between sample size and BF01, we calculated the correlation coefficient and its 95% CI. We found a positive correlation (τ = .45, 95% CI = [.26, .59]).
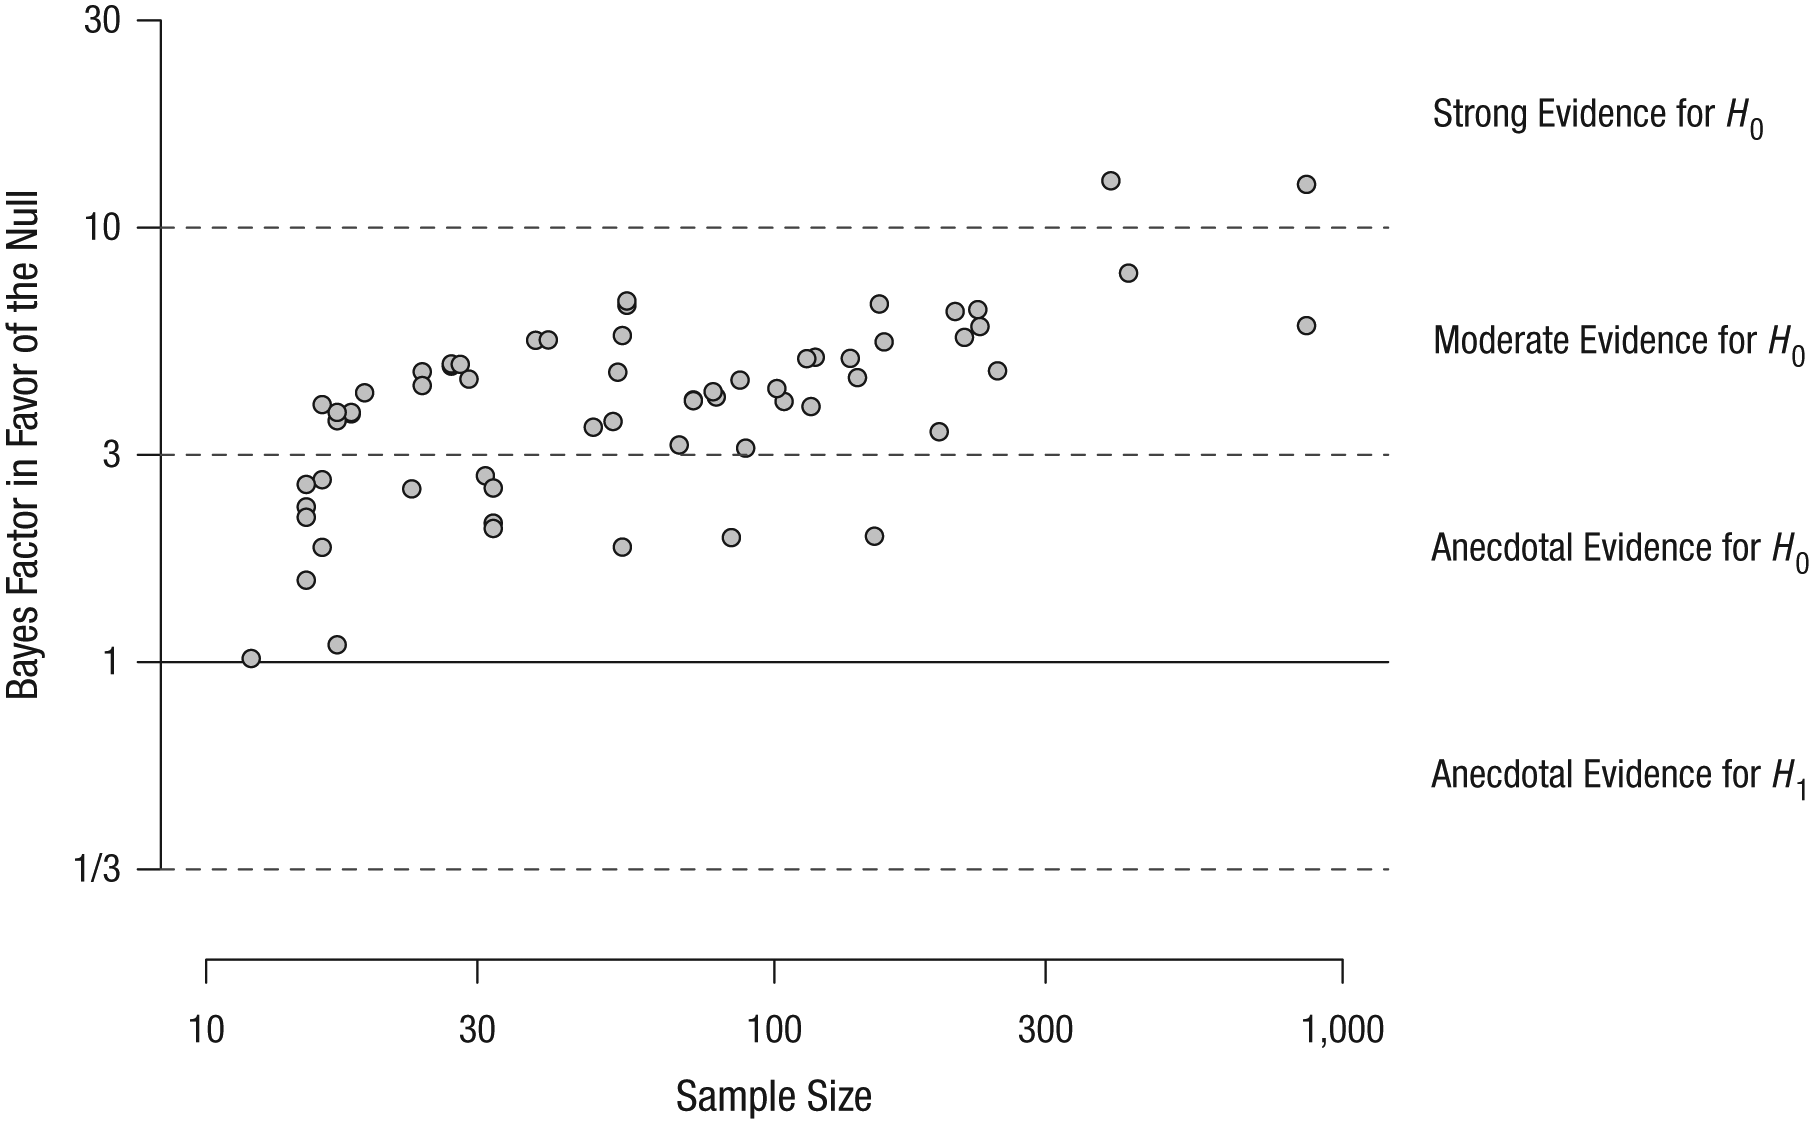
Scatterplot showing the relationship between the sample sizes of the selected studies and the corresponding BF01s (τ = .45, 95% credible interval = [.26, .59]). Note that the scaling of both axes has been log-e transformed. This figure has been reformatted from the original, which was published under a CC-By Attribution International License and is available at https://doi.org/10.6084/m9.figshare.5721076.v1.
Discussion
The goal of this study was twofold: to explore how psychology researchers interpret and communicate nonsignificant results and to assess how much these results truly constitute evidence in favor of the null hypothesis. Toward this end, we collected all the negative statements from the abstracts of three domain-general psychology journals, and we extracted and reanalyzed the statistics corresponding to those statements.
The analysis of the negative statements in the abstracts demonstrates that there are several ways in which researchers interpret nonsignificant results. Only 28% (n = 39) of these statements were in agreement with the logic of the employed statistical methods (frequentist: 18%, n = 25; Bayesian: 10%, n = 14). Among the incorrect inferences, the smaller fraction of the statements (23%, n = 32) indicated that there was no effect in the population. The most prevalent interpretation of nonsignificant results, however, was incorrect and limited to the observed sample (48%, n = 66). Although it is possible that the words the researchers used to describe their results did not reflect what they meant to say, awareness of this habit must be raised because interpreting the results of an inferential test with respect to the observed sample is not meaningful.
In an exploratory analysis reported in the Supplemental Material, we compared the extracted statistical results (i.e., those corresponding to negative statements in abstracts) with all the reported nonsignificant statistical results from the same year in the same three journals. This analysis suggests that researchers are less likely to build an argument on a nonsignificant result if the corresponding p value is small than if it is large.
These observations underscore the apparent confusion and uncertainty regarding the interpretation of nonsignificant results, and they also reflect that the field has no generally applied strategy for discussing nonsignificant findings. The apparent confusion and uncertainty in research practice possibly originate from the fact that although researchers are motivated to discuss all of their findings, the NHST framework is not designed to be informative about negative results (Fisher, 1935). As Fisher (1935) wrote: It should be noted that the null hypothesis is never proved or established, but is possibly disproved, in the course of experimentation. Every experiment may be said to exist only in order to give the facts a chance of disproving the null hypothesis. (p. 19)
This limitation has resulted not just in a great number of uncommunicated negative results (Franco et al., 2014), but also, as this study shows, in unwarranted interpretation of negative findings.
To assess the extent to which the reported nonsignificant findings in our sample constitute the absence of evidence (i.e., nondiagnostic results produced by low power) or evidence of absence (i.e., support for the null hypothesis), we conducted a Bayes factor reanalysis. The interpretation of Bayes factors is always conditional on the level of support for the hypotheses expected from the data (Aczel, Palfi, & Szaszi, 2017). As is apparent in Figure 2, almost all the BF01s were smaller than 10, and a great proportion of them were under 3. Although there are different traditions for characterizing the strength of evidence indicated by Bayes factors (Schönbrodt, 2015), values lower than 3 are most often interpreted as anecdotal, and values lower than 10 are generally not considered strong evidence (Lee & Wagenmakers, 2013). Note that when the null hypothesis and the alternative hypothesis are deemed equally likely a priori, a Bayes factor of 3 raises the model probability for the null hypothesis from 50% to 75% (leaving a full 25% probability for the alternative hypothesis), and a Bayes factor of 10 raises the model probability from 50% to 91% (leaving 9% probability for the alternative hypothesis).
The result of our reanalysis, and its robustness to alternative prior specifications of the alternative hypothesis, suggests that the nonsignificant findings that were elevated to the abstracts of the selected studies provide at best only moderate evidence for the authors’ negative claim. In a considerable number of cases, the nonsignificant findings presented in the abstracts carry evidence that is not worth more than a bare mention (Etz & Vandekerckhove, 2017; Jeffreys, 1961). This weakness may be partly due to the typically low sample sizes in psychology (see, e.g., Aczel, Palfi, Szaszi, Szollosi, & Dienes, 2015; Kekecs et al., 2016). Hoekstra, Monden, van Ravenzwaaij, and Wagenmakers (2018), reanalyzing nonsignificant results in medicine, found much stronger evidence for the null hypothesis with samples two or three magnitudes larger than those in our analysis. Our finding of a moderate link between sample size and Bayes factor further corroborates this explanation.
Taken together, our results extend the list of reasons why current research practice in psychological science needs to be reconsidered. It is a long-known problem that positive results are more attractive (Giner-Sorolla, 2012) and more likely to be published (Franco et al., 2014; Rosenthal, 1979) than negative results. This publication bias is often blamed for promulgating misleading and nonreplicable findings and for resulting in a loss of immense resources (Lilienfeld & Waldman, 2017). Here, we have shown that even when these negative findings are reported, they are often miscommunicated or lack sufficient evidential support. In fact, the situation has not improved since Hoekstra et al. (2006) observed that 61% of the psychology articles published between 2002 and 2004 claimed no effect or a negligible effect purely on the basis of statistically nonsignificant results. We suggest that negative results in science carry a “curse” that is due not only to their lack of attraction, but also to the problematic status of negative results within the NHST tradition, as well as to the chronic underestimation of required sample sizes in psychological experiments.
We note that our sample for the Bayesian reanalysis was constrained to t tests in articles published in three journals in 2015. Nevertheless, we would not expect to obtain a substantially different pattern of results with a more comprehensive sample given that a recent Bayesian reanalysis of more than 300,000 published significant t-, F- and r-test results indicated that the strength of evidence is comparable among the different statistical tests in psychological studies (Aczel et al., 2017). The generalizability of any Bayesian analysis depends on the predictions of the tested hypotheses, which is determined by their prior distributions. We examined the robustness of our conclusions with a range of different prior distributions, and each time we obtained the same pattern of results.
Transparency in conducting and communicating research is of primary importance for improving the field. However, the field may also benefit from adopting a more inclusive statistical approach. For instance, the proponents of Bayes factors argue that Bayesian analysis could help alleviate several of the current challenges. Bayes factors can be interpreted as evidence not just against, but also for, the null hypothesis. In addition, they are insensitive to stopping rules, allowing the experimenter to stop data collection whenever the evidence for one of the hypotheses is sufficiently compelling (Dienes, 2016; Rouder, 2014; but see de Heide & Grünwald, 2017). The Bayes factor is not the only tool for testing the absence of an effect or demonstrating that an effect is too small to be practically relevant. For instance, parameter estimation with confidence intervals (e.g., Cumming, 2014) can be informative about the size of an effect, and equivalence testing (Lakens, 2017), a frequentist procedure that is conceptually similar to analysis of the Bayesian region of practical equivalence (ROPE; e.g., Kruschke, 2014), provides a way to accept the null hypothesis if a region of negligible effect sizes can be determined. Nonetheless, these alternative methods cannot be applied to test a point null hypothesis, which was the primary focus of the current study.
It has long been recognized that psychological experiments are often underpowered (Cohen, 1990). The statistical power of a typical two-group between-subjects design is estimated to be less than 35% (Bakker, van Dijk, & Wicherts, 2012), and power analysis is reported for only 3% of psychological studies in general. Although these issues might be traced back to some inappropriate rules of thumb existing among research psychologists (Bakker, Hartgerink, Wicherts, & van der Maas, 2016), our results provide further evidence that without a substantial increase in statistical power, psychologists’ data can provide only weak evidence in favor of the null hypothesis.
Conclusion
Our findings reveal that nonsignificant results are often misinterpreted in the psychology literature. Moreover, our Bayesian reanalyses reveal that most nonsignificant findings reported in the abstracts in this literature provide only limited evidence for the null hypothesis. These observations suggest that nonsignificant findings, as traditionally reported, can easily mislead the reader. Specific statistical training, a more skeptical mind-set, and an extension of the standard statistical toolbox are possible remedies to promote more adequate communication and more appropriate assessment of negative results.
Supplemental Material
SupplementaryMethodsandResults – Supplemental material for Quantifying Support for the Null Hypothesis in Psychology: An Empirical Investigation
Supplemental material, SupplementaryMethodsandResults for Quantifying Support for the Null Hypothesis in Psychology: An Empirical Investigation by Balazs Aczel, Bence Palfi, Aba Szollosi, Marton Kovacs, Barnabas Szaszi, Peter Szecsi, Mark Zrubka, Quentin F. Gronau, Don van den Bergh and Eric-Jan Wagenmakers in Advances in Methods and Practices in Psychological Science
Supplemental Material
WagenmakersOpenPracticesDisclosure – Supplemental material for Quantifying Support for the Null Hypothesis in Psychology: An Empirical Investigation
Supplemental material, WagenmakersOpenPracticesDisclosure for Quantifying Support for the Null Hypothesis in Psychology: An Empirical Investigation by Balazs Aczel, Bence Palfi, Aba Szollosi, Marton Kovacs, Barnabas Szaszi, Peter Szecsi, Mark Zrubka, Quentin F. Gronau, Don van den Bergh and Eric-Jan Wagenmakers in Advances in Methods and Practices in Psychological Science
Footnotes
Acknowledgements
We thank Maarten Marsman for his help with the code and Melissa Wood for her comments on earlier versions of the manuscript. B. Palfi is grateful to the Dr Mortimer and Theresa Sackler Foundation, which supports the Sackler Centre for Consciousness Science.
Action Editor
Alex O. Holcombe served as action editor for this article.
Author Contributions
B. Aczel, B. Palfi, A. Szollosi, B. Szaszi, and E.-J. Wagenmakers designed the study and wrote the manuscript. M. Kovacs, P. Szecsi, and M. Zrubka contributed to the data collection and methodology. B. Palfi, M. Kovacs, Q. F. Gronau, and D. van den Bergh contributed to the analysis and visual presentation of the results. All the authors reviewed and approved the final version of the submitted manuscript.
Declaration of Conflicting Interests
The author(s) declared that there were no conflicts of interest with respect to the authorship or the publication of this article.
Funding
A. Szollosi was supported by the “Nemzet Fiatal Tehetségeiért” Scholarship (NTP-NFTÖ-16-1184), and E.-J. Wagenmakers was supported by a Vici grant from the Netherlands Organisation for Scientific Research (NWO, 016.Vici.170.083).
Open Practices
All data and materials, as well as the R code for the analyses and figures, have been made publicly available via the Open Science Framework and can be accessed at https://osf.io/f2n7c/. The analysis plans can be accessed at https://osf.io/f2n7c/. The complete Open Practices Disclosure for this article can be found at http://journals.sagepub.com/doi/suppl/10.1177/2515245918773742. This article has received badges for Open Data, Open Materials, and Preregistration. More information about the Open Practices badges can be found at ![]() .
.
Notes
References
Supplementary Material
Please find the following supplemental material available below.
For Open Access articles published under a Creative Commons License, all supplemental material carries the same license as the article it is associated with.
For non-Open Access articles published, all supplemental material carries a non-exclusive license, and permission requests for re-use of supplemental material or any part of supplemental material shall be sent directly to the copyright owner as specified in the copyright notice associated with the article.