
Abstract
The attentional spatial-numerical association of response codes (Att-SNARC) effect (Fischer, Castel, Dodd, & Pratt, 2003)—the finding that participants are quicker to detect left-side targets when the targets are preceded by small numbers and quicker to detect right-side targets when they are preceded by large numbers—has been used as evidence for embodied number representations and to support strong claims about the link between number and space (e.g., a mental number line). We attempted to replicate Experiment 2 of Fischer et al. by collecting data from 1,105 participants at 17 labs. Across all 1,105 participants and four interstimulus-interval conditions, the proportion of times the effect we observed was positive (i.e., directionally consistent with the original effect) was .50. Further, the effects we observed both within and across labs were minuscule and incompatible with those observed by Fischer et al. Given this, we conclude that we failed to replicate the effect reported by Fischer et al. In addition, our analysis of several participant-level moderators (finger-counting habits, reading and writing direction, handedness, and mathematics fluency and mathematics anxiety) revealed no substantial moderating effects. Our results indicate that the Att-SNARC effect cannot be used as evidence to support strong claims about the link between number and space.
A foundational issue in cognitive science is the question of how people represent concepts. Classical approaches to cognitive science, exemplified by Fodor’s (1975) language-of-thought hypothesis and Newell and Simon’s (1976) physical-symbol-systems hypothesis, view representations as abstract or amodal and as distinct from sensorimotor processing. In contrast to these traditional views, a range of other views that go under labels such as embodied, situated, or grounded cognition maintain that representations (a) are intimately linked to sensorimotor processing (see, e.g., Wilson, 2002, for an overview), (b) are analog rather than symbolic, and (c) represent by resembling their targets in some sense (e.g., see Gładziejewski & Miłkowski, 2017; Williams & Colling, 2018).
One area of research that has provided a wealth of empirical findings valuable for debates about this issue has been numerical cognition. In fact, Fischer and Brugger (2011) referred to numerical cognition as the “prime example of embodied cognition.” In particular, they pointed to tasks examining spatial-numerical associations to make their case.
Researchers have long reasoned that numbers might be represented in a spatially organized manner (Galton, 1880), for example, as a mental number line (e.g., Restle, 1970). Key support for this notion comes from a series of nine parity-judgment experiments conducted by Dehaene, Bossini, and Giraux (1993). In their experiments, Dehaene et al. asked participants to judge whether a number was odd or even and reported that responses to large numbers were faster when participants pressed a right-hand key rather than a left-hand key, whereas the opposite was true for small numbers. They labeled this number-magnitude-by-response-side interaction the spatial-numerical association of response codes (SNARC) effect.
In these experiments, there was no standard with which to compare the presented number. Consequently, whether a particular number was responded to more quickly with the left hand or the right hand was not determined by the absolute magnitude of the number, but rather by the relative magnitude of the number within a stimulus set. Thus, the number 5 was responded to more quickly with the left hand when it appeared in a set of numbers ranging from 4 to 9 but more quickly with the right hand when it appeared in a set of numbers ranging from 0 to 5 (e.g., Dehaene et al., 1993; Fias, Brysbaert, Geypens, & d’Ydewalle, 1996).
Dehaene et al. (1993) reported that the effect was dependent on neither the handedness of participants nor the hand used to make the response, but instead depended on the side of space of the response: When participants’ hands were crossed, responses to small numbers were quicker with the right hand than with the left (however, see Wood, Nuerk, & Willmes, 2006). Nonetheless, Dehaene et al. did report that the effect was dependent on participants’ reading and writing direction. Specifically, although they reported finding the effect in experiments with French participants, who had experience reading and writing from left to right, they also reported failing to find the effect in an experiment with Iranian participants, who had experience reading and writing from right to left (see also Shaki, Fischer, & Petrusic, 2009, and Zebian, 2005). Together, the results from the nine experiments reported in Dehaene et al. were taken to support the idea of a mental number line and the association of numbers of increasing magnitude with the left-to-right axis of external space.
Although the SNARC effect appears to be robust (see Wood, Willmes, Nuerk, & Fischer, 2008, and Toomarian and Hubbard, 2018, for recent reviews), the great range of findings has resulted in debate about mechanism. One such debate concerns whether the SNARC effect is produced by early, response-independent mechanisms or whether processes at the stage of response selection are responsible. According to theories that place the origin of the SNARC effect at an early stage, the mere observation of a number should be sufficient to activate the spatial code because the spatial code is intimately connected to the numerical representation. Consequently, these theories make the strongest claims about the link between number and space. Theories that place the origin of the SNARC effect at the response-selection stage, however, make weaker claims about the connection between number and space. As Pecher and Boot (2011) noted, if the response-selection stage gives rise to the SNARC effect, then no underlying spatial-numerical representation need be assumed.
Most recent work has tended to support the notion that the response-selection stage is the locus of the SNARC effect. In particular, Keus and colleagues have used both behavioral (Keus & Schwarz, 2005) and psychophysiological (Keus, Jenks, & Schwarz, 2005) evidence to argue in favor of a later, response-related origin of the SNARC effect. Further support comes from a computational model that relies on task-dependent conceptual coding of the number at a stage distinct from the numerical representation itself (Gevers, Verguts, Reynvoet, Caessens, & Fias, 2006).
In addition, response-polarity-related accounts break the link between number, space, and the SNARC effect. For example, Proctor and Cho (2006) argued that on binary classification tasks, items in the task set are coded as being positive or negative in polarity. Response selection can then be facilitated when there is a structural overlap between the polarity of the item (the number in the case of the SNARC effect) and the response. Thus, perceptual or conceptual overlap between the stimulus and response dimensions is not required for the SNARC effect to occur. In short, Gevers et al.’s (2006) model and Proctor and Cho’s (2006) account do not rely on the notion of a mental number line or sensorimotor-linked representations.
A range of empirical findings support these types of accounts. For example, Santens and Gevers (2008) reported that SNARC-like effects can be produced when left-right responses are replaced with unimanual close-far responses: Small numbers are associated with close responses, and large numbers are associated with far responses. Further, Landy, Jones, and Hummel (2008) reported that verbal “yes” and “no” responses on a parity-judgment task were facilitated by large numbers and small numbers, respectively.
Finally, still other researchers have argued in favor of a working memory account of the SNARC effect. For example, in an experiment reported by van Dijck and Fias (2011), participants performed a fruit/vegetable classification task after having been encouraged to store the stimuli as an ordered set in working memory. Specifically, a sequence of fruit and vegetable names was displayed in the center of the computer screen, and participants were tested on the order of the items. Then, in a subsequent classification task, responses to items that had appeared early in the sequence were faster if made with the left hand rather than the right hand, and responses to items that had appeared later in the sequence were faster if made with the right hand rather than the left hand. The authors argued that this working memory account can also explain why SNARC-like effects emerge for other kinds of ordinal sequences, such as months of the year (Gevers, Reynvoet, & Fias, 2003) or days of the week (Gevers, Reynvoet, & Fias, 2004), as well as why spatial-numerical associations can be moderated by giving participants instructions to associate numbers with positions on a clockface (1–5 on the right and 6–10 on the left) rather than on a ruler (1–5 on the left and 6–10 on the right; Bächtold, Baumüller, & Brugger, 1998).
Given that several competing accounts of the SNARC effect exist and that many of these accounts do not require a mental number line, one may doubt whether spatial-numerical associations provide evidence for anything like embodied number representations or number representations that are intimately linked with space. However, there is evidence that does support an early, response-independent locus for the SNARC effect and thus does provide support for the notion of a mental number line and spatially linked number representation—the modified version of Posner’s (1980) attentional cuing task developed by Fischer, Castel, Dodd, and Pratt (2003). In Fischer et al.’s experiment, participants were asked to press a single response button whenever a lateralized target, a white circle, appeared, regardless of whether it appeared on the left or the right. The target was always preceded by either a small number (1 or 2) or a large number (8 or 9), which was unrelated to the subsequent location of the target. Because the response was not lateralized, response-related effects were not possible. Results from this paradigm were consistent with the SNARC effect, as participants were quicker to detect left-side targets when they were preceded by small numbers and quicker to detect right-side targets when they were preceded by large numbers, at least when the numbers and targets were separated by an interstimulus interval (ISI) between 250 and 1,000 ms. This finding—named the attentional SNARC (Att-SNARC) effect—suggests that viewing a number can cue spatial attention either to the left or to the right depending on the magnitude of the number.
Because the Att-SNARC effect is strong evidence in favor of an early, response-independent locus for the mechanism underlying the SNARC effect, the Att-SNARC effect plays a crucially important role in adjudicating debates about the origin of the SNARC effect and the nature of number representations. As a result, Fischer et al.’s original finding has been extremely influential (e.g., cited 746 times according to Google Scholar as of May 15, 2020). However, subsequent attempts to replicate the effect have produced a wide array of results.
Galfano, Rusconi, and Umiltà (2006) reported a so-called statistically significant effect for left-side targets when the data were aggregated over ISI conditions of 500 and 800 ms and a one-tailed test was employed, estimate = 6 ms, t(25) = 1.75, p = .046 (reported as p = .04). They also reported a statistically significant effect for right-side targets when the data were aggregated over these two ISI conditions and a one-tailed test was employed, but the claimed statistical significance reflected a reporting error, estimate = 5 ms, t(25) = 1.59, p = .062 (reported as p = .04). Although it is possible to obtain a point estimate for each of the ISI conditions with the data aggregated over the left- and right-side targets (500-ms ISI: 8 ms; 800-ms ISI: 4 ms), the corresponding variances and test statistics for these estimates were not reported and cannot be obtained from what was reported.
Ristic, Wright, and Kingstone (2006) reported a statistically significant effect when the data were aggregated over six ISI conditions ranging from 350 to 800 ms and over the left- and right-side targets, estimate = 3.79 ms (unreported; obtained via digitization of the figure), F(1, 17) = 5.48, p = .032 (reported as p < .05). Although it is possible to obtain, via digitization of the figure, a point estimate for each of the six ISI conditions with the data aggregated over the left- and right-side targets (350-ms ISI: 11.24 ms; 400-ms ISI: 2.81 ms; 500-ms ISI: −1.44 ms; 600-ms ISI: 6.17 ms; 700-ms ISI: 6.05 ms; 800-ms ISI: −2.17 ms), the corresponding variances and test statistics for these estimates were not reported and cannot be obtained from what was reported.
Dodd, Van der Stigchel, Leghari, Fung, and Kingstone (2008) reported a statistically significant effect when the data were aggregated over three ISI conditions ranging from 250 to 750 ms and over the left- and right-side targets, but the claimed statistical significance reflected a reporting error, estimate = 5.5 ms (unreported), F(1, 29) = 4.05. p = .054 (reported as p < .05). They also reported statistically significant effects for the 500-ms ISI condition for left-side targets, estimate = 16 ms, t(29) = 2.48, p = .010 (reported as p < .05), and for right-side targets, estimate = 6 ms, t(29) = 2.34, p = .013 (reported as p < .05). Although it is possible to obtain a point estimate for each of the three ISI conditions with the data aggregated over the left- and right-side targets (250-ms ISI: 6 ms; 500-ms ISI: 11 ms; 750-ms ISI: −0.5 ms), the variances and test statistics for these estimates were not reported and cannot be obtained from what was reported.
Salillas, El Yagoubi, and Semenza (2008) reported a so-called statistically nonsignificant effect for a 450-ms ISI condition when the data were aggregated over the left- and right-side targets, estimate = 7.5 ms, F(1, 11) = 1.3, p = .28 (reported as “ns”). Additionally, Ranzini, Dehaene, Piazza, and Hubbard (2009) reported a statistically nonsignificant effect when the data were aggregated over three ISI conditions ranging from 300 to 500 ms and over the left- and right-side targets, estimate = 3 ms (unreported; obtained via digitization of the figure), F(1, 14) = 4.1, p = .06. Point estimates and variances and test statistics for such estimates for the three ISI conditions with the data aggregated over the left- and right-side targets were not reported and cannot be obtained from what was reported.
More recently, van Dijck, Abrahamse, Acar, Ketels, and Fias (2014) reported a statistically nonsignificant effect when the data were aggregated over four ISI conditions ranging from 250 to 1,000 ms and over the left- and right-side targets, estimate = 1 ms (unreported; obtained via digitization of the figure), reported F(1, 42) < 1.05, reported p > .37. Point estimates and variances and test statistics for such estimates for the four ISI conditions with the data aggregated over the left- and right-side targets were not reported and cannot be obtained from what was reported. In a second experiment, van Dijck et al. also reported a statistically nonsignificant effect when the data were aggregated over three ISI conditions ranging from 100 to 700 ms and over the left- and right-side targets, estimate = −2.5 ms (unreported; obtained via digitization of the figure), F(1, 28) = 2.94, p = .097. Point estimates and variances and test statistics for such estimates for the three ISI conditions with the data aggregated over the left- and right-side targets were not reported and cannot be obtained from what was reported.
Zanolie and Pecher (2014) reported a statistically nonsignificant effect when the data were aggregated over four ISI conditions ranging from 250 to 1,000 ms and over the left- and right-side targets, estimate = 0.5 ms (unreported; obtained via digitization of the figure), F(1, 19) = 0.03, p = .863. Although it is possible to obtain a point estimate for each of the four ISI conditions with the data aggregated over the left- and right-side targets (250-ms ISI: −1 ms; 500-ms ISI: 2 ms; 750-ms ISI: 5 ms; 1,000-ms ISI: −4 ms), the variances and test statistics for these estimates were not reported and cannot be obtained from what was reported. In a second experiment, Zanolie and Pecher also reported a statistically nonsignificant effect when the data were aggregated over the same four ISI conditions and over the left- and right-side targets, estimate = −1.5 ms (unreported; obtained via digitization of the figure), F(1, 23) = 0.17, p = .686. Although it is possible to obtain a point estimate for each of the four ISI conditions with the data aggregated over the left- and right-side targets (250-ms ISI: −2 ms; 500-ms ISI: 5 ms; 750-ms ISI: −3 ms; 1,000-ms ISI: −6 ms), the variances and test statistics for these estimates were not reported and cannot be obtained from what was reported.
Finally, Fattorini, Pinto, Rotondaro, and Doricchi (2015) reported a statistically nonsignificant effect when the data were aggregated over 500-ms and 700-ms ISI conditions and over the left- and right-side targets, estimate = 2 ms (unreported; obtained via digitization of the figure), F(1, 59) = 1.69, p = .20. Point estimates and variances and test statistics for such estimates for the two ISI conditions with the data aggregated over the left- and right-side targets were not reported and cannot be obtained from what was reported. In a second experiment, Fattorini et al. also reported a statistically nonsignificant effect when the data were aggregated over four ISI conditions ranging from 250 to 1,000 ms and over the left- and right-side targets, estimate = −1.75 ms (unreported; obtained via digitization of the figure), F(1, 31) = 1.5, p = .22. Although it is possible to obtain a point estimate for each of the four ISI conditions with the data aggregated over the left- and right-side targets (250-ms ISI: −2 ms; 500-ms ISI: −1 ms; 750-ms ISI: −2 ms; 1,000-ms ISI: −2 ms), the variances and test statistics for these estimates were not reported and cannot be obtained from what was reported.
A natural approach to assessing these various attempts to replicate the Att-SNARC effect would involve synthesizing the evidence across all published studies of the effect via meta-analysis. This would allow for, among other things, the estimation of an overall average effect size, the heterogeneity in effect sizes across studies, and the effects of potential moderators at the study level or otherwise. However, this approach is complicated because (a) the statistical significance (or nonsignificance) of a study’s results typically affects whether or not the study is published, which results in a set of published studies that is not representative, and (b) meta-analytic results are biased when the set of studies analyzed is not representative (Ioannidis, 2008; McShane, Böckenholt, & Hansen, 2016). Instead, the Registered Replication Report (RRR) format pursued in the present study provides an ideal means of assessing the Att-SNARC effect because in an RRR, results from all participating labs are included in the meta-analysis regardless of what those results are. Further, preregistration of the primary hypotheses and statistical analyses mitigates some potential biases.
An additional benefit of the RRR format is that it allows for the investigation of potential moderators not previously considered, which might shed new light on mechanism and perhaps also the wide array of results observed in the various attempts to replicate the Att-SNARC effect. Consequently, in addition to replicating the experimental protocol of Fischer et al., we investigated several variables that could potentially moderate the Att-SNARC effect: finger-counting habits, reading and writing direction, handedness, and mathematics ability and mathematics anxiety (for details and conjectures, see Fischer, 2006, 2008; Fischer & Knops, 2014; Georges, Hoffmann, & Schiltz, 2016; and Shaki et al., 2009).
Before proceeding, we note that alternative accounts of the effect reported by Fischer et al. have been suggested. These include, for example, accounts based on working memory (van Dijck et al., 2014). We also note that manipulations that make explicit associations between number and space have been able to produce Att-SNARC-like effects (e.g., Fattorini et al., 2015, Experiment 3). Because these alternative accounts and additional manipulations have theoretical implications that differ from the Att-SNARC effect as originally proposed by Fisher et al., they are not discussed further here.
Disclosures
Preregistration
This study was preregistered. All relevant documentation is available on the Open Science Framework (OSF) at https://osf.io/he5za/.
Data, materials, and online resources
The data and materials are available on OSF at https://osf.io/he5za/. Links to the lab-specific pages of all participating labs are available on OSF at https://osf.io/7zyxj. Data and scripts to re-create the manuscript are available on a companion website at http://git.colling.net.nz/attentional_snarc/. An archived version of the companion website is available at https://doi.org/10.5281/zenodo.3738555. The Supplemental Material (http://journals.sagepub.com/doi/suppl/10.1177/2515245920903079) contains detailed results for Models 1 through 5 as well as detailed results for the secondary analyses.
Reporting
We report how we determined our sample size, all data exclusions, all manipulations, and all measures in the study.
Ethical approval
All participating labs obtained ethical approval in accordance with their local requirements, and the research was carried out in accordance with the Declaration of Helsinki.
Method
Sample size
Each participating lab was required to provide a target sample size no smaller than 60 participants and a stopping rule (see the lab-specific pages for details). We chose 60 participants as the minimum because, as required for RRRs, it provides high power conditional on a hypothetical assumed effect size, namely, power of .92 for a one-tailed test at α = .05 conditional on an effect size of 0.4 on the standardized Cohen’s d scale, about the midpoint of previously published estimates. This value corresponds to a raw effect size of 6 ms assuming a between-participants standard deviation of 15 ms, again about the midpoint of previously published estimates.
Because of time constraints, not all labs were able to reach the minimum target of 60 participants (see Table 1 for the sample size achieved by each lab). However, given the sample sizes actually achieved, and again conditional on an effect size of 0.4 on the standardized Cohen’s d scale, a statistically significant effect would be expected in 93% of the labs (i.e., about 16). Thus, if 0.4 is a reasonable estimate of the effect size and there are no substantial moderators of the effect, statistically significant effects would be expected not only at the meta-analytic level but also at the level of the individual lab.
Number of Participants for Each Lab: Total Number, Number Included in the Analysis, and Number Excluded for Each Reason
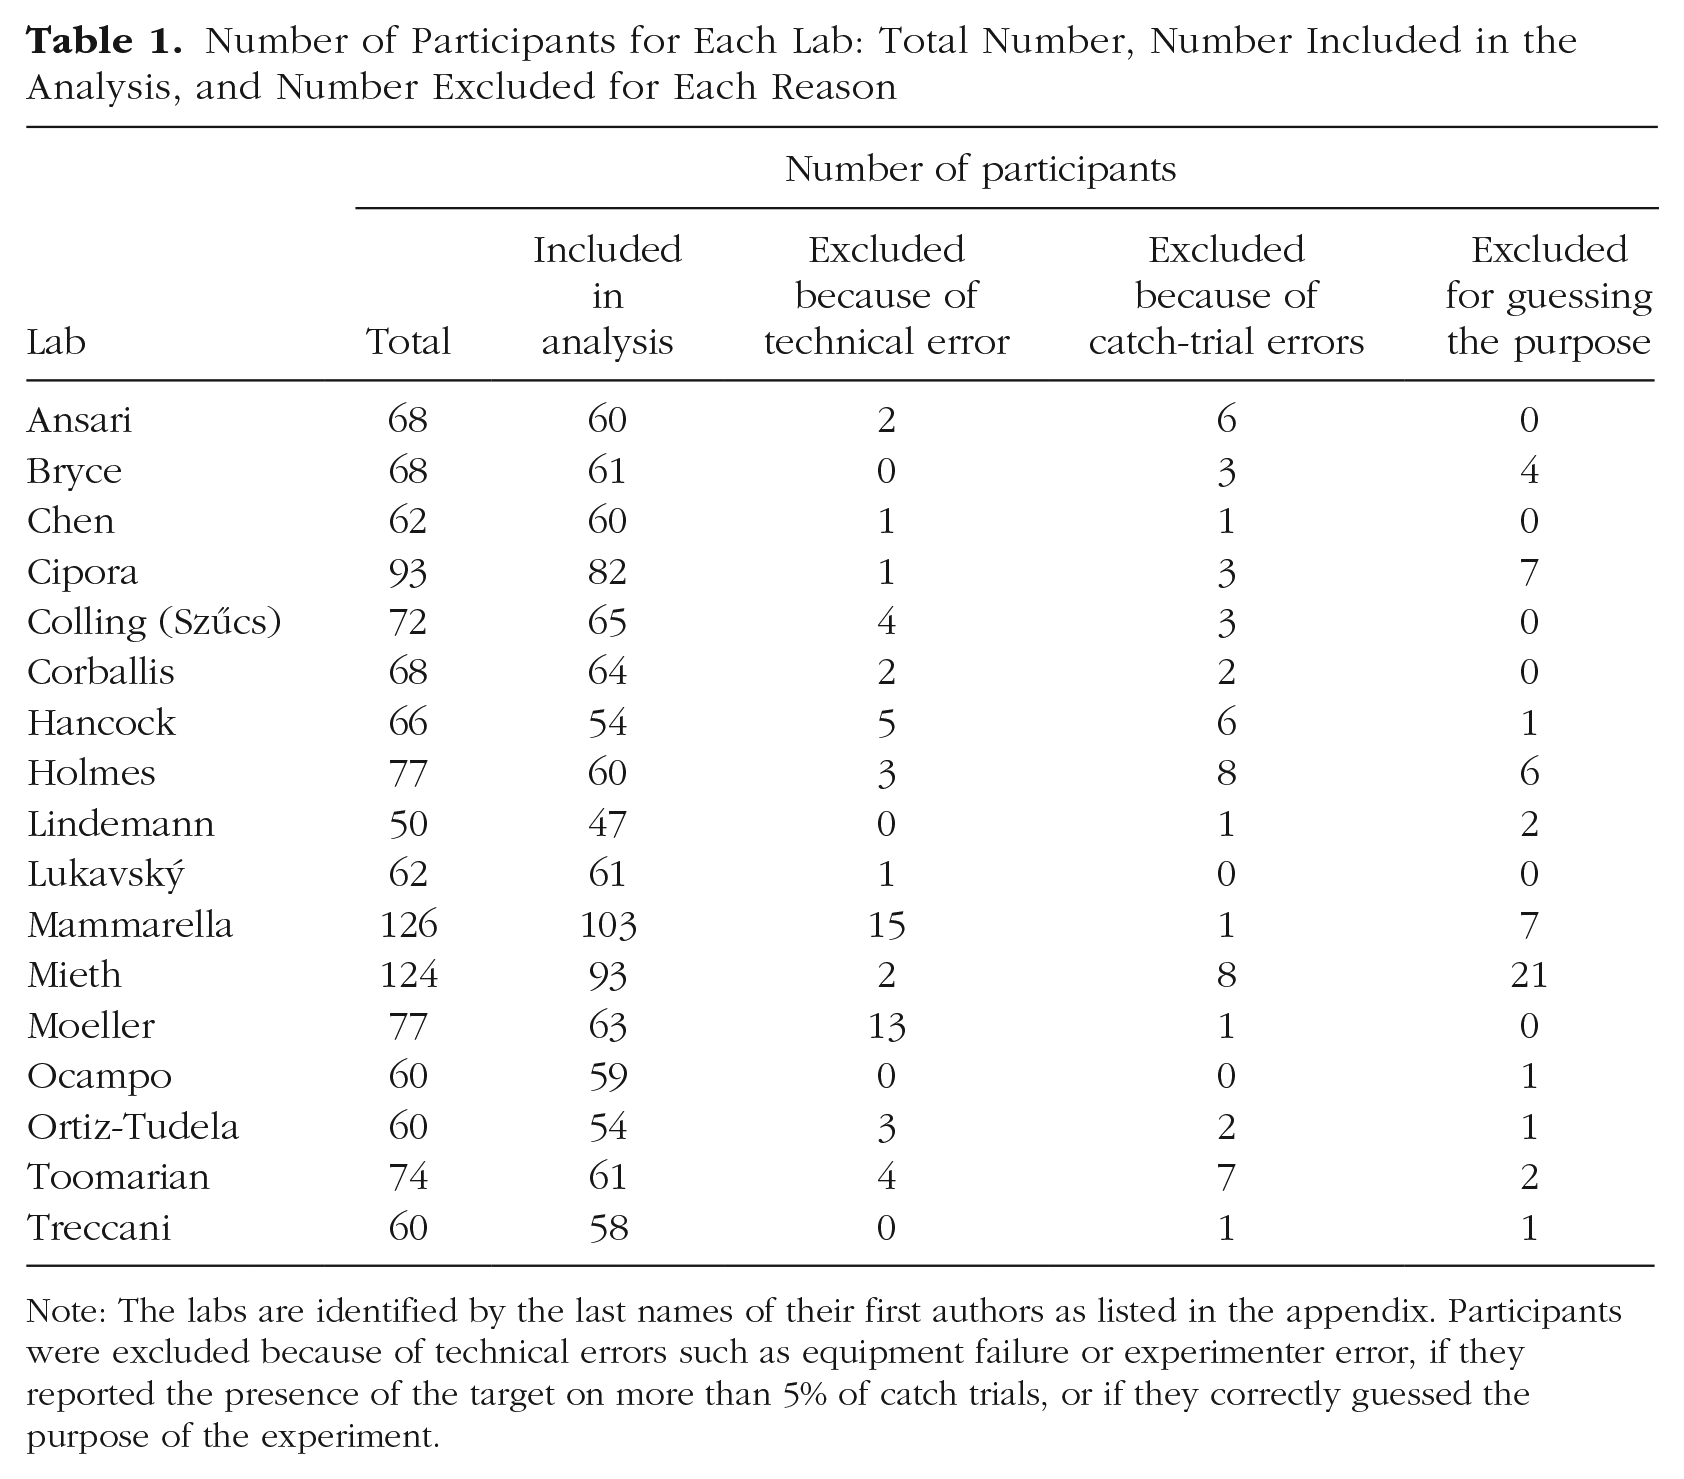
Note: The labs are identified by the last names of their first authors as listed in the appendix. Participants were excluded because of technical errors such as equipment failure or experimenter error, if they reported the presence of the target on more than 5% of catch trials, or if they correctly guessed the purpose of the experiment.
Materials
The participating labs all had (a) a testing station, such as a room or a cubicle, where participants could undertake the experiment without distraction; (b) a computer for presenting stimuli and recording responses; (c) a chin rest or similar device to ensure that participants remained a set distance from the computer monitor; and (d) a tape measure used to calibrate distance from the screen. Five labs also optionally made use of an eye tracker to record participants’ eye movements during the attentional-cuing task (see the lab-specific pages for details).
An instruction booklet detailing how to perform the setup and calibration procedure and the finger-counting assessment was provided to the labs. These materials were initially written in English, but each lab conducted the experiment in the predominant language of its locale. Thus, the experiment was also conducted in German, Dutch, Czech, Spanish, Italian, and Chinese. All materials were translated from English into these other languages and then independently back-translated into English to ensure accuracy.
All materials, including the translations, are available at https://osf.io/7zyxj/. To perform analyses, we used R (Version 3.5.1; R Core Team, 2018) and the R packages bindrcpp (Version 0.2.2; Müller, 2018), checkmate (Version 1.8.5; Lang, 2017), dplyr (Version 0.7.6; Wickham, François, Henry, & Müller, 2018), forcats (Version 0.3.0; Wickham, 2018a), forestplot (Version 1.7.2; Gordon & Lumley, 2017), ggplot2 (Version 3.0.0; Wickham, 2016), glue (Version 1.3.0; Hester, 2018), kableExtra (Version 0.9.0; Zhu, 2018), knitr (Version 1.20; Xie, 2015), lme4 (Version 1.1.18.1; Bates, Mächler, Bolker, & Walker, 2015), magick (Version 1.9; Ooms, 2018), magrittr (Version 1.5; Bache & Wickham, 2014), Matrix (Version 1.2.14; Bates & Maechler, 2018), nlme (Version 3.1.137; Pinheiro, Bates, DebRoy, Sarkar, & R Core Team, 2018), papaja (Version 0.1.0.9842; Aust & Barth, 2018), purrr (Version 0.2.5; Henry & Wickham, 2018), pwr (Version 1.2.2; Champely, 2018), readr (Version 1.1.1; Wickham, Hester, & Francois, 2017), reticulate (Version 1.10; Allaire, Ushey, & Tang, 2018), R.matlab (Version 3.6.2; Bengtsson, 2018), stringr (Version 1.3.1; Wickham, 2018b), tibble (Version 1.4.2; Müller & Wickham, 2018), tidyr (Version 0.8.1; Wickham & Henry, 2018), and tidyverse (Version 1.2.1; Wickham, 2017).
Procedure
We employed an experimental paradigm based on Experiment 2 of Fischer et al. We chose Experiment 2 over Experiment 1 because Experiment 2 had fewer ISI conditions and because the results were statistically significant in a greater proportion of the conditions. Before starting data collection, each lab performed a monitor calibration procedure using a supplied calibration script. This procedure involved measuring the viewing distance from the computer monitor and the size of standard stimuli presented on the screen (see https://osf.io/2m4ad/ for details). After participants provided informed consent, they were seated in front of the monitor with their chin placed in a chin rest that was located a fixed distance from the monitor (set during the calibration procedure), and then data collection commenced.
The standard trial structure, which was identical to that of Fischer et al. and did not include timing modifications for the eye tracker (see the Eye-Tracking Protocol subsection for details), is shown in Figure 1. The initial display on each trial consisted of a centrally located white fixation point (0.2° diameter) flanked by two white outline boxes (1° × 1°), all on a black background. The centers of the boxes were located 5° from the center of the fixation point. This initial display was shown for 500 ms. Next, a digit (1, 2, 8, or 9; height of 0.75°) replaced the fixation point for a fixed duration of 300 ms. After the digit was removed, the fixation point reappeared. Finally, a circular white target (0.7° diameter) appeared in either the left- or the right-side box after a variable duration (250 ms, 500 ms, 750 ms, or 1,000 ms) on target trials, and no target appeared on catch trials.
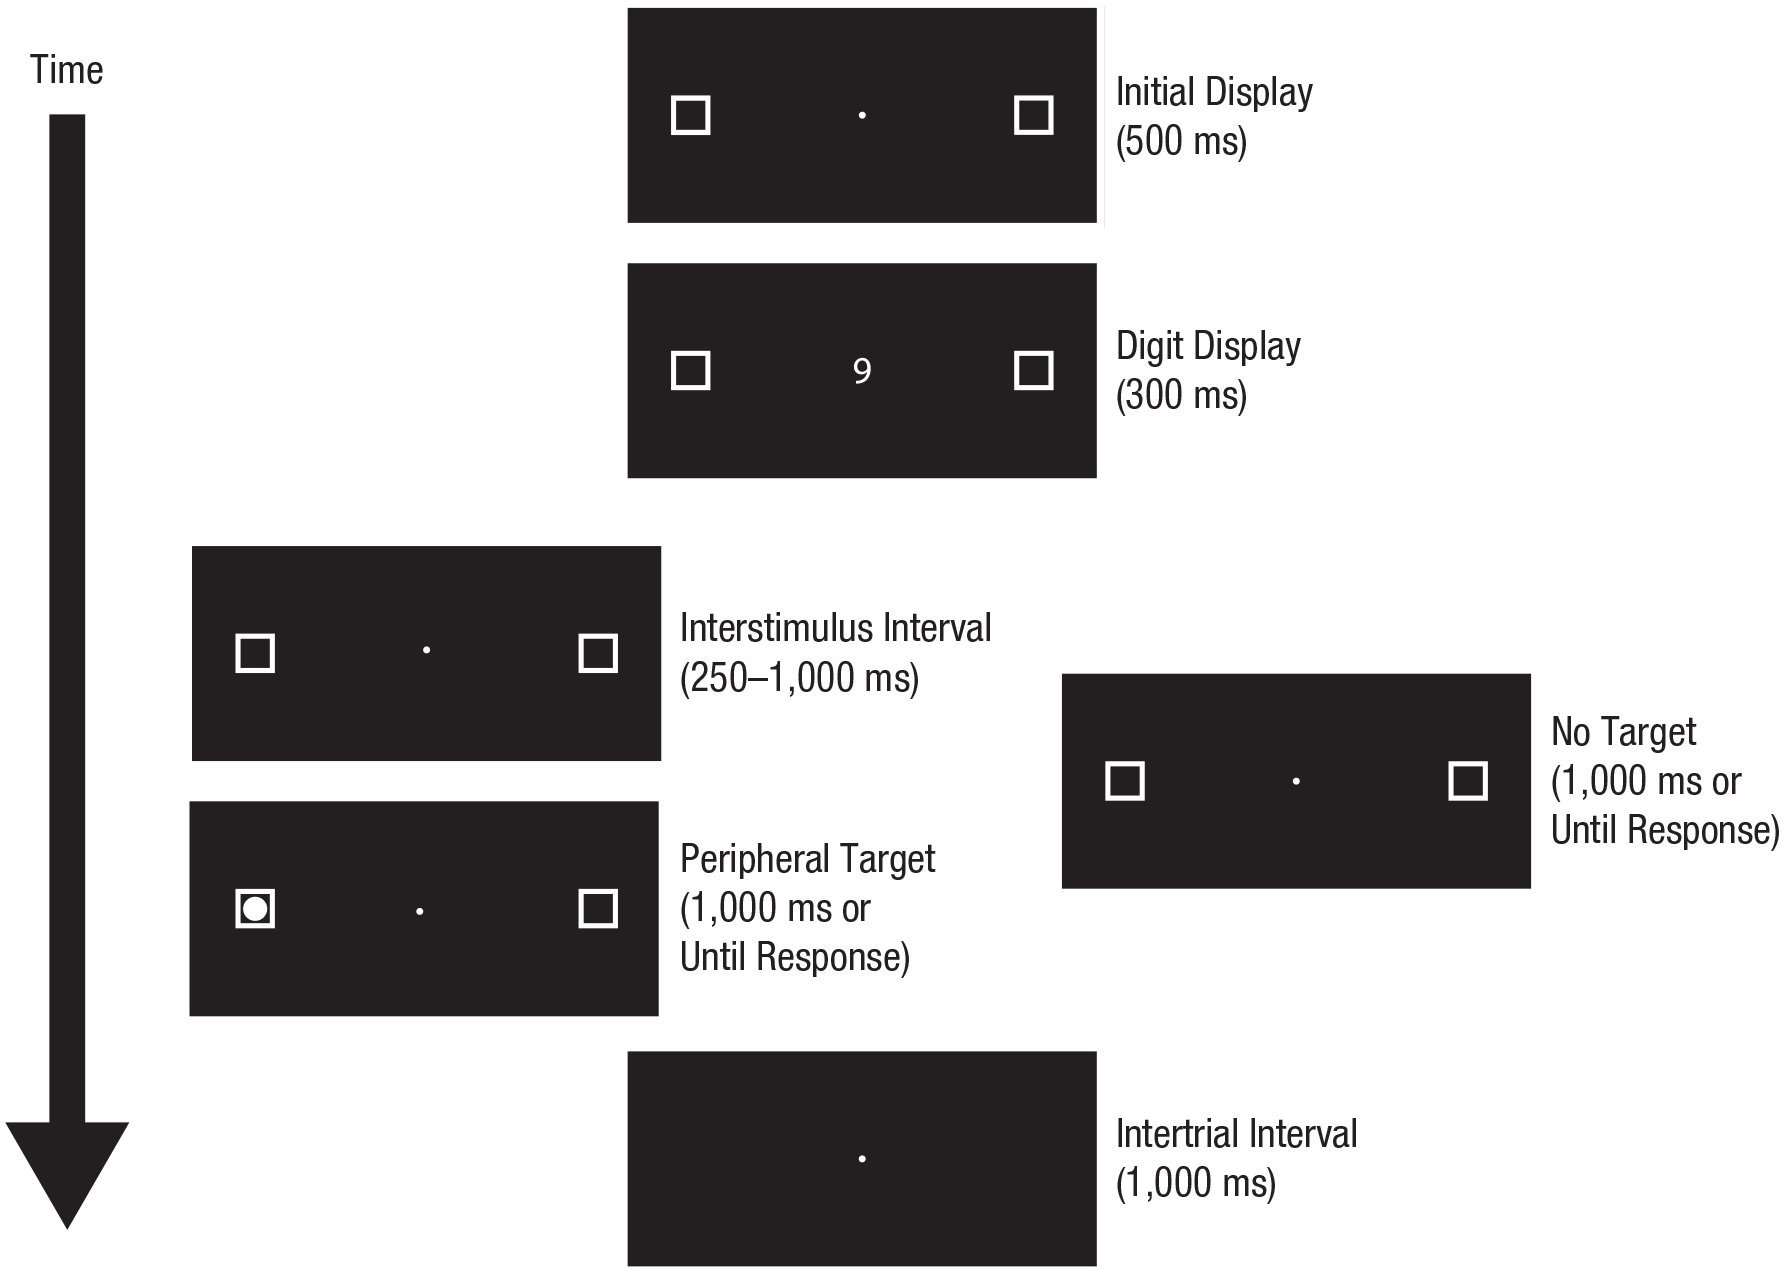
Trial structure for target trials and catch trials. The initial display on each trial consisted of a centrally located white fixation point flanked by two white outline boxes, all on a black background. Next, a digit replaced the fixation point. After the digit was removed, the fixation point reappeared. Finally, a circular white target appeared in either the left- or the right-side box after a variable duration on target trials, and no target appeared on catch trials. Target trials ended after a response was made or 1,000 ms after the onset of the target, whichever came first. Catch trials ended 1,000 ms after the digit was removed. Trials advanced automatically, separated by an intertrial interval of 1,000 ms.
Target trials ended after a response was made or 1,000 ms after the onset of the target, whichever came first. Catch trials ended 1,000 ms after the digit was removed. Trials advanced automatically, separated by an intertrial interval of 1,000 ms.
Participants responded to the appearance of the target by pressing the space bar with their preferred hand. When a participant responded before the target appeared or responded on a catch trial, the trial ended, and the following warning appeared: “Too quick! Please wait until the target appears in a box before pressing SPACE” [English version]. When a participant failed to respond on a target trial, the following warning was presented: “Too slow! Please press SPACE as soon as the target appears.” Participants who erred on more than 5% of trials were excluded from analyses.
Participants performed a total of 800 trials (640 target trials and 160 catch trials), split into five blocks of 160 trials each, with 128 target trials and 32 catch trials per block; the trials in each block were evenly divided across the four ISI conditions, four digits, and two target locations, and the order of presentation was random.
Eye-tracking protocol
Code implementing an eye-tracking protocol using an EyeLink 1000 (SR Research, Ottawa, Ontario, Canada) eye tracker was provided to all labs and is available on Github at https://github.com/ljcolling/FischerRRR-eyetracking. Of the five labs that optionally made use of an eye tracker, one used a different eye tracker; this lab has provided information regarding deviations from the standard protocol on its lab-specific page. The standard nine-point grid was used for calibration and validation at the start of each block and when required during a block. The start of a trial was triggered after the detection of 500 ms of stable fixation within a 2° box centered on the fixation point. If the system could not detect a stable fixation within a 2,000-ms time window, the calibration process was repeated. After the digit was presented, and before the target appeared, the gaze position was monitored, and any deviations outside a 1° box centered on the fixation point were recorded. Any deviations toward the lateral boxes that exceeded 2° resulted in the trial being marked as contaminated. These trials were excluded from primary analyses; however, they were analyzed separately to determine whether eye movements moderated the Att-SNARC effect.
Finger counting
To assess finger-counting fluency, we used a task derived from that developed by Lucidi and Thevenot (2014). Participants were asked to read aloud four sentences while counting the number of syllables in each. Because reading aloud prevents verbalizing counting, most participants needed to resort to finger counting while sounding out the syllables. For each sentence, the experimenter recorded the first finger and first hand the participant used. Although most participants used their fingers for the task, some participants adopted a different strategy. Participants who failed to engage in finger counting after two sentences were prompted to do so. Details of the prompting were recorded in lab logs (see the lab-specific pages for details).
The results from the finger-counting task were used to place participants into five groups: consistent left-starters, consistent right-starters, inconsistent left-starters, inconsistent right-starters, and others. This classification was determined not only by participants’ hand choices, but also by how consistently they engaged in finger counting. Consistent left-starters and consistent right-starters were those participants who counted using a hand on all four occasions and started on the same hand on at least three of them. Inconsistent left-starters and inconsistent right-starters were participants who counted using a hand on two or three occasions and started on the same hand on at least two of them. All remaining participants were classified as other (e.g., those who did not count on their fingers, those who counted on their fingers only once, and those who counted an equal number of times with each hand).
Reading and writing direction
To assess reading and writing direction, we used a simple question asking participants if they had experience with languages that are written exclusively from left to right (e.g., English and German), with languages that are not written exclusively from left to right (e.g., Hebrew), or with languages of both types (see https://osf.io/dqnkq/ for details). For the Chinese version of this question, participants were asked if they had experience with languages that are usually written horizontally, with languages that are usually written vertically, or with languages of both types (see https://osf.io/r3fhx/ for details). Responses to this question were used to place participants into two groups: exclusively left-to-right readers-writers and not exclusively left-to-right readers-writers. Participants who selected the first option were placed in the left-to-right readers-writers group, and all the remaining participants were placed in the not-exclusively left-to-right readers-writers group.
Handedness
To assess handedness, we used Nicholls, Thomas, Loetscher, and Grimshaw’s (2013) 10-item questionnaire. In labs conducting the experiment in a language other than English, the questionnaire was translated, and some questions were replaced with more culturally appropriate versions when required (see https://osf.io/r3fhx/ for details).
Mathematics assessment
To assess mathematics fluency, we used the short mathematics assessment employed by Tibber et al. (2013). This test is adapted from the Mathematics Calculation Subtest of the Woodcock-Johnson III Tests of Cognitive Abilities (Woodcock & Johnson, 1989). It contains 25 multiple-choice mathematics questions requiring addition, subtraction, multiplication, and division. Participants had 30 s to select the response on each trial; the timing was controlled by the computer software. A countdown timer was stationed in the top left of the screen to inform participants of the time remaining. The 25 questions were split into five sets of 5 questions each. Two errors on a single set or errors on consecutive sets terminated the test. The final score was the total number of correct answers.
Mathematics anxiety
To assess mathematics anxiety, we used the Abbreviated Math Anxiety Scale (AMAS; Hopko, Mahadevan, Bare, & Hunt, 2003). The AMAS contains nine questions that ask participants to rate (on a scale from 1 to 5) how anxious they would feel during particular events, including thinking of an upcoming mathematics test, taking a mathematics examination, and listening to a mathematics lecture. In labs conducting the experiment in a language other than English, the AMAS was translated. The final score was the sum of the individual ratings; possible scores ranged from 9 (low anxiety) to 45 (high anxiety).
Exit questionnaire
An exit questionnaire that asked participants to describe the purpose of the experiment was used to determine whether they had guessed its purpose. Participants who guessed correctly, as judged by the experimenter, were excluded from primary analyses; however, their data were analyzed separately to determine whether guessing the experiment’s purpose moderated the Att-SNARC effect.
Exclusion criteria
Participants who committed errors on more than 5% of the catch trials, who correctly guessed the purpose of the experiment, or who did not undertake all tasks were excluded from the analysis.
Analysis
The dependent variables of interest were the four congruency effects, one in each of the four ISI conditions (i.e., 250 ms, 500 ms, 750 ms, and 1,000 ms). The congruency effect was defined as the average difference in response time between congruent and incongruent trials; congruent trials were defined as trials with left-side targets preceded by low digits (1 or 2) and trials with right-side targets preceded by high digits (8 or 9), and incongruent trials were defined as trials with left-side targets preceded by high digits and trials with right-side targets preceded by low digits. A positive value for the congruency effect indicates that participants were faster responding on congruent trials than on incongruent trials, and a negative value indicates the reverse.
We analyzed our data via multilevel multivariate meta-analytic models (McShane & Böckenholt, 2018). Such models have at least two advantages over the standard random-effects meta-analytic model. First, they can take account of the dependence between multiple dependent variables (here, the congruency effect in each of the four ISI conditions). Second, rather than assuming a simple two-level structure, with participants nested within labs, they can take account of more complex nesting structures (here, participants nested within moderator groups, such as consistent left-starters, consistent right-starters, etc., and moderator groups nested within labs). In short, the standard approach necessitates treating several variance components as zero, and thereby makes unwarranted independence assumptions.
For each analysis, we considered several simplifications of the equal-allocation multilevel multivariate compound-symmetry specification detailed in McShane and Böckenholt (2018); we also considered an equal-variance version of the single-correlation equal-allocation multilevel multivariate compound-symmetry specification that, in the notation of that article, sets the σ d,d equal for all dependent variables d (i.e., the congruency effect in each of the four ISI conditions). We chose among the six specifications using Akaike’s information criterion (Akaike, 1974).
In analyzing moderators, it is ideal to consider them all jointly within a single model. Unfortunately, data sparsity precluded this. When the moderators were considered jointly, many combinations of them resulted in either zero or very few participants per moderator group in each lab. Indeed, this was also the case for some moderators when considered alone (i.e., reading and writing direction and handedness; see Tables S4 and S6, respectively, in the Supplemental Material). Consequently, we consider each moderator separately.
For models featuring no moderators (Model 1) or discrete moderators (finger counting, reading and writing direction, and handedness; Models 2–4, respectively), for simplicity we analyzed the data at the moderator-group level, as per McShane and Böckenholt (2018), using data from moderator groups not precluded for reasons of data sparsity. For the model featuring continuous moderators (mathematics fluency and mathematics anxiety; Model 5), this was not possible, so we analyzed the data at the participant level using an analogous specification (see the Model 5 subsection for details) and using data from all participants. Our motivation for considering these moderators follows.
Model 1: no moderators
Fischer et al. reported a positive congruency effect. The purpose of Model 1 was to assess this reported effect by replicating the analysis performed by Fischer et al., and consequently, this model did not take account of any moderators.
Model 2: finger counting
Recent work suggests that spatial-numerical compatibility effects in general (Fischer, 2008)—including attentional-cuing effects in response to numbers (Fischer & Knops, 2014)—might be moderated by finger-counting behavior. Specifically, this work suggests that these effects are stronger among people who start finger counting on the left hand and weaker or possibly even reversed among those who start finger counting on the right hand. The purpose of Model 2 was to assess this possibility, and consequently this model took account of the finger-counting moderator.
This model used only data from participants who consistently engaged in finger counting and consistently started on the same hand, that is, participants classified as consistent left-starters or consistent right-starters. We restricted the analysis to these two groups principally because if finger-counting behavior has an effect, we would expect it to be most prominent in participants whose finger-counting habits are clear and unambiguous.
Model 3: reading and writing direction
Recent work suggests that the congruency effect might be weaker or possibly even reversed among people who have experience with languages that are not read and written exclusively from left to right (Fischer, 2008; Shaki et al., 2009). The purpose of Model 3 was to assess this possibility, and consequently this model took account of the reading-and-writing-direction moderator. Specifically, participants were placed into two groups according to their responses on the reading-writing questionnaire: those who read and wrote exclusively left to right and those who did not.
Model 4: handedness
The purpose of Model 4 was to assess whether handedness moderates the congruency effect, and consequently this model took account of the handedness moderator. Specifically, participants were classified as left-handed or right-handed according to their responses on the handedness questionnaire.
Model 5: mathematics fluency and mathematics anxiety
Recent work suggests that numerical abilities (Fischer, 2006) and mathematics anxiety (Georges et al., 2016) may influence the strength of spatial-numerical associations. The purpose of Model 5 was to assess this possibility, and consequently this model jointly took account of both mathematics fluency and mathematics anxiety, as measured by the math test and AMAS, respectively. Specifically, we employed a multilevel model with fixed effects included for the full set of ISI Condition × Math Test × AMAS interactions, and random effects included for each participant, for each ISI condition for each lab (with equal variance and zero correlation), and for the math test, the AMAS, and the Math Test × AMAS interaction for each lab (independently).
Secondary analyses
The purpose of our secondary analyses was to assess whether insight into the purpose of the experiment or eye movements moderated the congruency effect. Specifically, Model 1 was estimated separately on data from participants who correctly guessed the purpose of the experiment and also separately on data from eye-movement-contaminated trials of participants with contaminated trials in every combination of ISI and congruency condition.
Results
Replication operationalization
According to the common definition of replication employed in practice, a subsequent experiment has successfully replicated a prior experiment if the results from the two experiments either (a) failed to attain statistical significance or (b) were directionally consistent and attained statistical significance. This definition has been applied analogously in large-scale replication projects such as the present one by comparing the statistical significance (or nonsignificance) of the results from a meta-analysis of the replication studies with the statistical significance (or nonsignificance) of the results from the original study.
However, the null-hypothesis significance-testing paradigm upon which this operationalization of replication is based has been the subject of no small amount of criticism over the decades (Cohen, 1994; Gelman, Carlin, Stern, & Rubin, 2003; McShane & Gal, 2016, 2017; Meehl, 1978; Rozenboom, 1960), and recent calls to abandon it abound (Amrhein, Greenland, & McShane, 2019; Amrhein, Trafimow, & Greenland, 2019; McShane, Gal, Gelman, Robert, & Tackett, 2019; Wasserstein, Schirm, & Lazar, 2019). Further, recent work discussing alternative statistical paradigms specifically in the context of replication (Colling & Szűcs, 2018) has called for a better understanding of how statistical inference relates to scientific inference. A key point is that any assessment of whether a theory is supported by data depends on whether the magnitude of the observed effect is consistent with the theory (Gelman & Carlin, 2014). Consequently, in assessing replication, we distinguish between statistical hypotheses and scientific hypotheses and focus on that latter, specifically in light of the scientific hypothesis advanced by Fischer et al.
Exclusions
In total, 17 labs contributed data from 1,267 participants; 162 were excluded as per our exclusion criteria, which left a total of 1,105. See Table 1 for details of the total number of participants recruited by each lab, the number included in the analysis, and the number excluded for each reason; the technical-error category includes those participants who were excluded for having incomplete data because of, for example, equipment failure or experimenter error.
Five labs used an eye tracker for at least some of their participants. Table S11 in the Supplemental Material shows the number of participants in each of these labs tested with an eye tracker, the number of participants whose data were analyzed in our secondary analysis of trials contaminated by eye movement, and the number of such contaminated trials in each combination of ISI condition and congruency condition.
Preliminary analyses
Across all 1,105 participants and four ISI conditions, the congruency effect we observed had a mean of 0.24 ms and a standard deviation of 12.48 ms. In addition, across all 1,105 participants, it had a mean of −0.07 ms and a standard deviation of 13.45 ms in the 250-ms ISI condition, a mean of 0.94 ms and a standard deviation of 12.42 ms in the 500-ms ISI condition, a mean of −0.02 ms and a standard deviation of 12.12 ms in the 750-ms ISI condition, and a mean of 0.10 ms and a standard deviation of 11.84 ms in the 1,000-ms ISI condition. Further, across the six possible pairs of ISI conditions, the correlation had a mean of .00 (and a mean of .03 in magnitude).
Across all 1,105 participants and four ISI conditions, the proportion of times the congruency effect we observed was positive was .50. In addition, across all 1,105 participants, this proportion was .49 in the 250-ms ISI condition, .53 in the 500-ms ISI condition, .48 in the 750-ms ISI condition, and .50 in the 1,000-ms ISI condition. Further, the number of ISI conditions with a positive congruency effect was zero for .06 of the participants, one for .26 of the participants, two for .36 of the participants, three for .26 of the participants, and four for .06 of the participants. All of these results are compatible with the relevant binomial distribution with probability parameter .5 (i.e., the distribution of the number of heads on tosses of a fair coin).
Primary analyses
Model 1: no moderators
The purpose of Model 1 was to replicate the analysis performed by Fischer et al., and thus it did not take account of any moderators. Model 1 was estimated on data from 1,105 participants from 17 labs. We summarize the results from Experiment 2 of Fischer et al. along with results from each lab and from Model 1 in Figure 2.
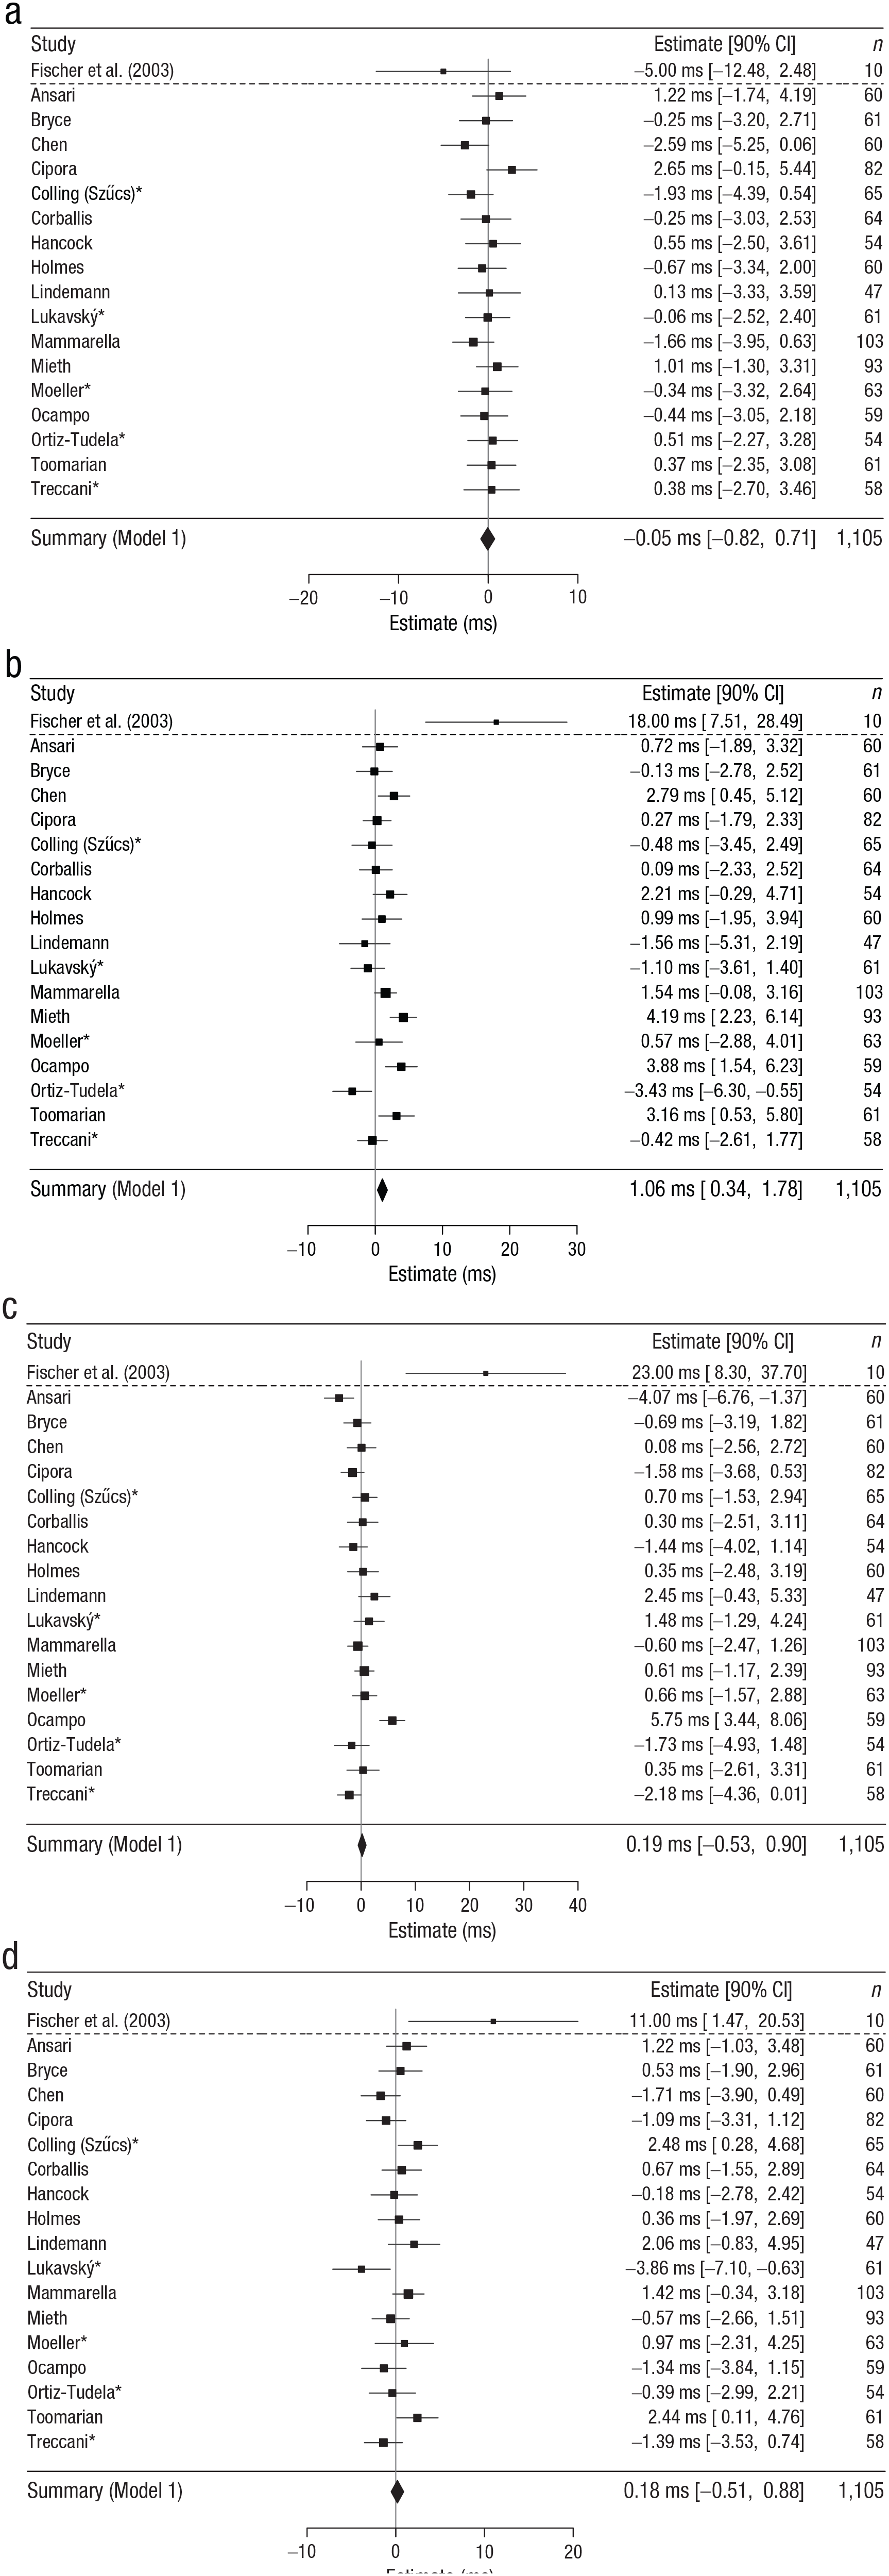
Summary of results from Experiment 2 of Fischer, Castel, Dodd, and Pratt (2003), each lab in the present study, and Model 1. Each panel presents the estimate for a given interstimulus-interval (ISI) condition: (a) 250 ms, (b) 500 ms, (c) 750 ms, and (d) 1,000 ms. The squares give the effect observed in each lab in each ISI condition; the size of each square is inversely proportional to the sample size. The horizontal lines give the 90% confidence interval (CI) in each lab in each ISI condition, and the diamond gives the Model 1 estimate and 90% CI. Labs are identified by the last name of their first authors as listed in the appendix; labs that used an eye tracker are marked with an asterisk. The effects observed both within and across labs were minuscule and incompatible with those observed by Fischer et al. (2003). They were also highly consistent both across ISI conditions and across labs; the latter result suggests that lab-level moderators are unlikely to have driven our results.
The effects we observed both within and across labs were minuscule and incompatible with those observed by Fischer et al. Specifically, Fischer et al. estimated an effect of −5.00 ms in the 250-ms ISI condition, 18.00 ms in the 500-ms ISI condition, 23.00 ms in the 750-ms ISI condition, and 11.00 ms in the 1,000-ms ISI condition. In contrast, Model 1 estimated effects of −0.05 ms, 1.06 ms, 0.19 ms, and 0.18 ms, respectively, in the four ISI conditions.
Given these results in tandem with those of our preliminary analyses, we conclude that we failed to replicate the effect reported by Fischer et al.
The effects we observed were highly consistent across ISI conditions. They were also highly consistent across labs, perhaps surprisingly given a recent finding—contrary to both substantive and statistical expectations—of a nontrivial degree of heterogeneity across labs in large-scale replication projects like the present study (McShane, Tackett, Böckenholt, & Gelman, 2019). Specifically, we estimated heterogeneity across labs at 1.02 ms—nonzero but practically unimportant for many purposes (see Table S1 in the Supplemental Material for details). This result suggests that lab-level moderators are unlikely to have driven our results.
Model 2: finger counting
Model 2 was estimated on data from 343 consistent left-starters from 17 labs and 482 consistent right-starters from 17 labs. We summarize the results from Experiment 2 of Fischer et al. along with results from Models 1 through 4 in Figure 3. Although previous work suggests a stronger congruency effect among left-starters and a weaker or possibly even reversed effect among right-starters, Figure 3 shows that finger counting had no substantial impact on the results. Specifically, the figure shows a minuscule congruency effect for each finger-counting group in each ISI condition and minuscule differences between congruency effects for the two finger-counting groups in each ISI condition (see Tables S2 and S3 in the Supplemental Material for details).
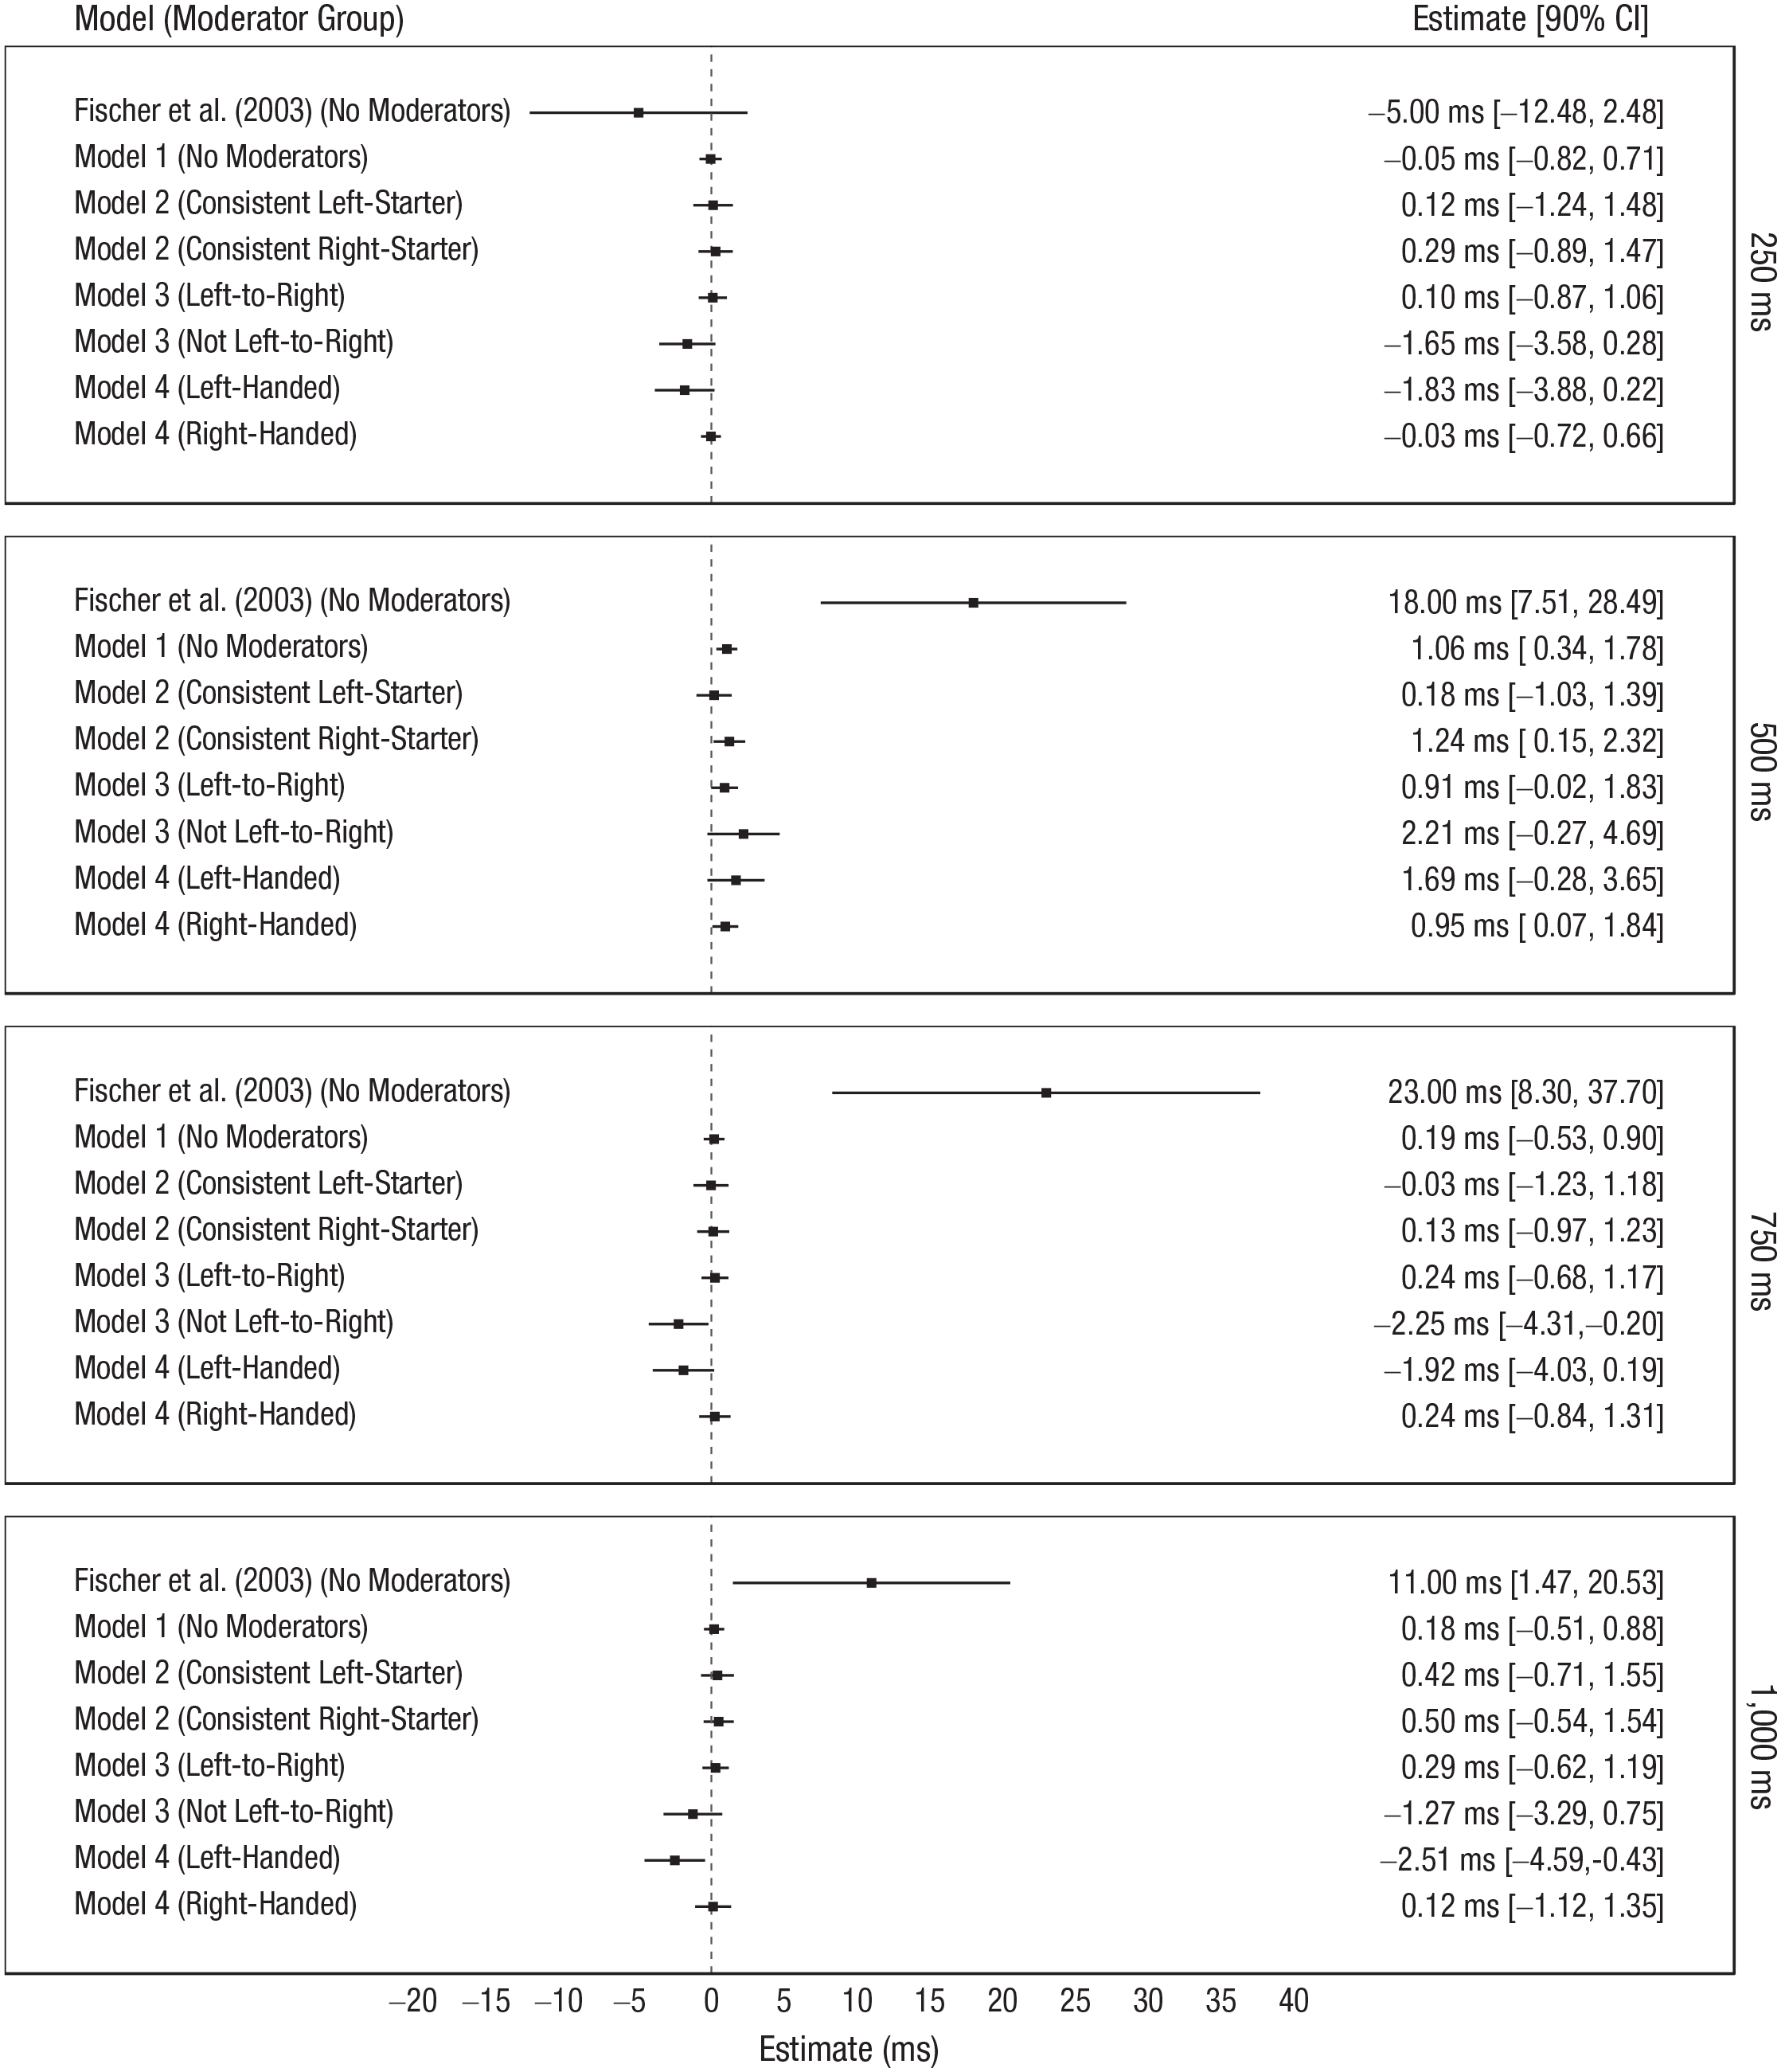
Summary of results from Experiment 2 of Fischer, Castel, Dodd, and Pratt (2003) and Models 1 through 4. Each panel presents the estimates for a given interstimulus-interval condition: from top to bottom, 250 ms, 500 ms, 750 ms, and 1,000 ms. The squares give the point estimates, and the horizontal lines give 90% confidence intervals (CIs). The effects observed both within and across labs were minuscule and incompatible with those observed by Fischer et al. (2003). They were also highly consistent across ISI conditions.
Model 3: reading and writing direction
Model 3 was estimated on data from 1,014 exclusively left-to-right readers-writers from 17 labs and 76 not exclusively left-to-right readers-writers from 8 labs. Although previous work suggests a weaker or possibly even reversed congruency effect among participants who have experience with languages that are not read and written exclusively from left to right. Figure 3 shows that reading and writing direction had no substantial impact on the results. Specifically, the figure shows a minuscule effect for each reading-and-writing-direction group in each ISI condition and minuscule differences between the congruency effects for the two reading-and-writing direction groups in each ISI condition (see Tables S4 and S5 in the Supplemental Material for details).
Model 4: handedness
Model 4 was estimated on data from 69 left-handed participants from 9 labs and 1,007 right-handed participants from 17 labs. Figure 3 shows that handedness had no substantial impact on the results. Specifically, the figure shows a minuscule effect for each handedness group in each ISI condition and minuscule differences between the congruency effects for the two handedness groups in each ISI condition (see Tables S6 and S7 in the Supplemental Material for details).
Model 5: mathematics fluency and mathematics anxiety
Model 5 was estimated on data from 1,105 participants from 17 labs. Although previous work suggests that mathematics fluency and mathematics anxiety might moderate congruency effects, we observed no substantial moderating effects (see Table S8 in the Supplemental Material for details).
Secondary analyses
Model 1 was estimated separately on data from 41 participants (from four labs) who correctly guessed the purpose of the experiment and also separately on data from 10,468 eye-movement-contaminated trials of 132 participants (from five labs) with contaminated trials in every combination of ISI and congruency condition. These analyses yielded no results of substantive interest (see the Supplemental Material for details).
Discussion
The Att-SNARC effect has been used to argue for an early, response-independent, and automatic origin of the SNARC effect. If the SNARC effect is produced by early mechanisms, this would provide good evidence for embodied number representations and support strong claims about the link between number and space (e.g., a mental number line).
We attempted to replicate Experiment 2 of Fischer et al. by collecting data from 1,105 participants at 17 labs. Across all 1,105 participants and four ISI conditions, the proportion of times the congruency effect we observed was positive was .50. Further, the effects we observed both within and across labs were minuscule and incompatible with those observed by Fischer et al. Given this, we conclude that we failed to replicate the effect reported by Fischer et al.
The effects we observed were highly consistent both across ISI conditions and across labs; the latter result suggests that lab-level moderators are unlikely to have driven our results. In addition, our analyses of several participant-level moderators (finger-counting habits, reading and writing direction, handedness, and mathematics fluency and mathematics anxiety) revealed no substantial moderating effects.
We conclude with two important points. First, on the basis of the common definition of replication employed in practice, one might object that we did in fact successfully replicate Fischer et al., at least in the 500-ms ISI condition. In response, we argue that this objection illustrates one major flaw of that definition: Our result in the 500-ms ISI condition is manifestly incompatible with the analogous result of Fischer et al. In addition, we view a difference of about 1 ms, even if “real,” as too small for any neurally or psychologically plausible mechanism—particularly one constrained to operate only within a narrow time window of 500 ms after the stimulus. That said, we recognize that some such mechanism could be subject to an arbitrarily large attenuation factor in any particular experimental paradigm, such as that of Fischer et al., and that potential new paradigms could reveal an effect. Nonetheless, even if such paradigms are forthcoming, we maintain on the basis of our results that the paradigm of Fischer et al. provides no evidence of such a mechanism.
Second, we note several limitations of the present study. First and foremost, although our results demonstrate that the Att-SNARC effect cannot be used as evidence to support the strong claims about the link between number and space discussed earlier, our results do not refute such accounts. Specifically, although one might, on the basis of our results, prefer accounts of the SNARC effect that do not imply a mental number line, the evidence for and against different claims about the SNARC effect must be viewed in its entirety. The Att-SNARC effect provides only one such piece of evidence—albeit a particularly strong and valuable one.
In addition, a set of limitations relates to our sample of participants. Our sample was recruited primarily from North America, Europe, and Australasia. Consequently, participants who read and wrote exclusively from left to right are overrepresented in our data. As reading and writing direction has been shown to strongly moderate spatial-numerical associations, it would have been preferable to have more participants with experience with languages that are not read and written exclusively from left to right. Further, data sparsity precluded considering all moderators jointly in a single model.
Finally, the finger-counting assessment we employed did not contain an explicit instruction to engage in finger counting. As a result, some participants employed finger counting inconsistently, and they were therefore excluded from the Model 2 analysis.
Supplemental Material
CollingOpenPracticesDisclosure – Supplemental material for Registered Replication Report on Fischer, Castel, Dodd, and Pratt (2003)
Supplemental material, CollingOpenPracticesDisclosure for Registered Replication Report on Fischer, Castel, Dodd, and Pratt (2003) by Lincoln J. Colling, Dénes Szűcs, Damiano De Marco, Krzysztof Cipora, Rolf Ulrich, Hans-Christoph Nuerk, Mojtaba Soltanlou, Donna Bryce, Sau-Chin Chen, Philipp Alexander Schroeder, Dion T. Henare, Christine K. Chrystall, Paul M. Corballis, Daniel Ansari, Celia Goffin, H. Moriah Sokolowski, Peter J. B. Hancock, Ailsa E. Millen, Stephen R. H. Langton, Kevin J. Holmes, Mark S. Saviano, Tia A. Tummino, Oliver Lindemann, Rolf A. Zwaan, Jiří Lukavský, Adéla Becková, Marek A. Vranka, Simone Cutini, Irene Cristina Mammarella, Claudio Mulatti, Raoul Bell, Axel Buchner, Laura Mieth, Jan Philipp Röer, Elise Klein, Stefan Huber, Korbinian Moeller, Brenda Ocampo, Juan Lupiáñez, Javier Ortiz-Tudela, Juanma de la Fuente, Julio Santiago, Marc Ouellet, Edward M. Hubbard, Elizabeth Y. Toomarian, Remo Job, Barbara Treccani and Blakeley B. McShane in Advances in Methods and Practices in Psychological Science
Supplemental Material
CollingSupplementalMaterial – Supplemental material for Registered Replication Report on Fischer, Castel, Dodd, and Pratt (2003)
Supplemental material, CollingSupplementalMaterial for Registered Replication Report on Fischer, Castel, Dodd, and Pratt (2003) by Lincoln J. Colling, Dénes Szűcs, Damiano De Marco, Krzysztof Cipora, Rolf Ulrich, Hans-Christoph Nuerk, Mojtaba Soltanlou, Donna Bryce, Sau-Chin Chen, Philipp Alexander Schroeder, Dion T. Henare, Christine K. Chrystall, Paul M. Corballis, Daniel Ansari, Celia Goffin, H. Moriah Sokolowski, Peter J. B. Hancock, Ailsa E. Millen, Stephen R. H. Langton, Kevin J. Holmes, Mark S. Saviano, Tia A. Tummino, Oliver Lindemann, Rolf A. Zwaan, Jiří Lukavský, Adéla Becková, Marek A. Vranka, Simone Cutini, Irene Cristina Mammarella, Claudio Mulatti, Raoul Bell, Axel Buchner, Laura Mieth, Jan Philipp Röer, Elise Klein, Stefan Huber, Korbinian Moeller, Brenda Ocampo, Juan Lupiáñez, Javier Ortiz-Tudela, Juanma de la Fuente, Julio Santiago, Marc Ouellet, Edward M. Hubbard, Elizabeth Y. Toomarian, Remo Job, Barbara Treccani and Blakeley B. McShane in Advances in Methods and Practices in Psychological Science
Footnotes
Appendix: Author Affiliations and Lab Implementations
Links to the lab-specific pages are available at https://osf.io/7zyxj.
Lincoln J. Colling, University of Cambridge
Damiano De Marco, University of Cambridge and University of Padova
Blakeley B. McShane, Northwestern University
Dénes Szűcs, University of Cambridge
Language: English
Eye tracker: SR Research EyeLink 1000
Protocol adjustments: None
Daniel Ansari, The University of Western Ontario
Celia Goffin, The University of Western Ontario
H. Moriah Sokolowski, The University of Western Ontario
Language: English
Eye tracker: None
Protocol adjustments: None
Donna Bryce, University of Tübingen
Rolf Ulrich, University of Tübingen
Language: German
Eye tracker: None
Protocol adjustments: None
Sau-Chin Chen, Tzu-Chi University
Language: Chinese
Eye tracker: None
Protocol adjustments: The behavioral tasks were used in their original form; however, all tasks were accompanied with printed instructions in Chinese because of the technical difficulties in displaying Chinese characters in the experimental software.
The assessments of handedness, finger counting, and reading and writing direction were modified as follows: First, for the handedness assessment, two questions were changed for cultural reasons. “When buttering bread, which hand holds the knife?” was replaced with “When cutting an orange, which hand holds the knife?” and “In which hand do you hold the peeler when peeling an apple?” was replaced with “In which hand do you hold the knife when peeling an apple?” Second, the finger-counting task was translated into Chinese, and participants were instructed to count the number of words, rather than syllables, while reading the text aloud. Finally, the reading-and-writing-direction assessment was modified to be appropriate for Taiwanese below 30 years of age. This generation of Taiwanese usually write Chinese words horizontally but are able to read both horizontal and vertical Chinese text. Therefore, the response options for this assessment were changed to “1. Usually horizontal writing,” “2. Usually vertical writing,” and “3. Any combination of the above.”
Additionally, the exit questionnaire was modified in two ways. First, participants were instructed to write down their answer to the exit question, “What do you think the purpose of their experiment is?” and their writing direction was recorded. Second, participants were asked to indicate the print style they would expect when reading a report about this study. They were able to select from two examples showing Chinese text printed in the horizontal and the vertical style.
Krzysztof Cipora, University of Tübingen
Hans-Christoph Nuerk, University of Tübingen
Philipp Alexander Schroeder, University of Tübingen
Mojtaba Soltanlou, University of Tübingen
Language: German
Eye tracker: None
Protocol adjustments: None
Paul M. Corballis, University of Auckland
Christine K. Chrystall, University of Auckland
Dion T. Henare, University of Auckland
Language: English
Eye tracker: None
Protocol adjustments: None
Peter J. B. Hancock, University of Stirling
Stephen R. H. Langton, University of Stirling
Ailsa E. Millen, University of Stirling
Language: English
Eye tracker: None
Protocol adjustments: None
Kevin J. Holmes, Colorado College
Mark S. Saviano, Colorado College
Tia A. Tummino, Colorado College
Language: English
Eye tracker: None
Protocol adjustments: None
Oliver Lindemann, Erasmus University Rotterdam
Rolf A. Zwaan, Erasmus University Rotterdam
Language: Dutch
Eye tracker: None
Protocol adjustments: None. Participants were not informed that the mathematics tests would be part of the protocol prior to the experiment.
Jiří Lukavský, Czech Academy of Sciences
Adéla Becková, Charles University
Marek A. Vranka, Charles University
Language: Czech
Eye tracker: SR Research EyeLink II, Version 2.31
Protocol adjustments: None; minor changes to clarify the instructions
Irene Cristina Mammarella, University of Padova
Simone Cutini, University of Padova
Language: Italian
Eye tracker: None
Protocol adjustments: None
Laura Mieth, Heinrich Heine University Düsseldorf
Raoul Bell, Heinrich Heine University Düsseldorf
Axel Buchner, Heinrich Heine University Düsseldorf
Jan Philipp Röer, Witten/Herdecke University and University of Tübingen
Language: German
Eye tracker: None
Protocol adjustments: None
Korbinian Moeller, Leibniz-Institut für Wissensmedien, Tübingen, Germany, and University of Tübingen
Stefan Huber, Leibniz-Institut für Wissensmedien, Tübingen, Germany
Elise Klein, Leibniz-Institut für Wissensmedien, Tübingen, Germany
Language: German
Eye tracker: SR Research EyeLink 1000
Protocol adjustments: None
Brenda Ocampo, The University of Queensland
Language: English
Eye tracker: None
Protocol adjustments: None; clarifying instructions were added
Javier Ortiz-Tudela, University of Granada
Juanma de la Fuente, University of Granada
Juan Lupiáñez, University of Granada
Marc Ouellet, University of Granada
Julio Santiago, University of Granada
Language: Spanish
Eye tracker: SR Research EyeLink 1000
Protocol adjustments: None
Elizabeth Y. Toomarian, University of Wisconsin–Madison
Edward M. Hubbard, University of Wisconsin–Madison
Language: English
Eye tracker: None
Protocol adjustments: None
Barbara Treccani, University of Trento
Remo Job, University of Trento
Claudio Mulatti, University of Padova
Language: Italian
Eye tracker: SR Research EyeLink 1000
Protocol adjustments: None
Acknowledgements
We acknowledge the help of the original authors, in particular Martin Fischer and Jay Pratt.
Transparency
Action Editor: Alex O. Holcombe
Editor: Daniel J. Simons
Author Contributions
L. J. Colling and D. Szűcs proposed the study. L. J. Colling programmed the experiments. L. J. Colling and B. B. McShane developed the analysis plan and conducted the analyses. L. J. Colling wrote an initial manuscript. L. J. Colling and B. B. McShane wrote revised and final manuscripts. All authors critically reviewed the manuscript by providing comments, feedback, and edits at all stages of writing, and all authors approved the final manuscript. All authors were involved in data collection. Authors from the contributing labs provided translated materials where required (see the ![]() ).
).
ORCID iDs
References
Supplementary Material
Please find the following supplemental material available below.
For Open Access articles published under a Creative Commons License, all supplemental material carries the same license as the article it is associated with.
For non-Open Access articles published, all supplemental material carries a non-exclusive license, and permission requests for re-use of supplemental material or any part of supplemental material shall be sent directly to the copyright owner as specified in the copyright notice associated with the article.