
Abstract
Fluorescent calcium (Ca2+) imaging is one of the preferred methods to record cellular activity during in vitro preclinical studies, high-content drug screening, and toxicity analysis. Visualization and analysis for dose–response data obtained using high-resolution imaging remain challenging, due to the inherent heterogeneity present in the Ca2+ spiking. To address this challenge, we propose measurement of cytosolic Ca2+ ions using spinning-disk confocal microscopy and machine learning–based analytics that is scalable. First, we implemented uniform manifold approximation and projection (UMAP) for visualizing the multivariate time-series dataset in the two-dimensional (2D) plane using Python. The dataset was obtained through live imaging experiments with norepinephrine-induced Ca2+ oscillation in HeLa cells for a large range of doses. Second, we demonstrate that the proposed framework can be used to depict the grouping of the spiking pattern for lower and higher drug doses. To the best of our knowledge, this is the first attempt at UMAP visualization of the time-series dose response and identification of the Ca2+ signature during lytic death. Such quantitative microscopy can be used as a component of a high-throughput data analysis workflow for toxicity analysis.
Introduction
Cytosolic calcium (Ca2+) imaging is known to be crucial for estimating drug toxicity during drug evaluation and screening, since Ca2+ signaling plays important roles in regulation of cell physiology, apoptosis, and necrosis.1,2 Recently, many scientists focused on investigating different imaging modalities and data analysis techniques to improve the estimation of cytosolic Ca2+ levels. For example, two-photon microscopy has been implemented to image dendritic Ca2+, 3 whereas light-field microscopy has been used to estimate intracellular Ca2+ through high-speed volumetric imaging of single neurons in Caenorhabditis elegans. 4 Moreover, various imaging methods such as FLIM (fluorescence lifetime image-scanning microscopy) have been explored for accurate estimation of Ca2+ in the range of 20–200 nM and for the establishment of calibration curves. 5 Monitoring of Ca2+ sequestration at the subcellular level remains challenging, however, since it requires the collection of fluorescent signals from various planes during volumetric imaging using advanced microscopy. 6 Currently, most existing systems, including plate readers and fluorescent microscopes, are not capable of providing the information present inside the cell, which requires elimination of out-of-focus light through the pinhole placed before the detector. 7
Traditional imaging methods for high-content screening,8,9 based on fluorescent microscopes, have an inherent disadvantage due to the large amount of out-of-focus light coming from other focal planes. 7 Also, traditional fluorescent microscopy suffers from other disadvantages, including photobleaching. In contrast, confocal imaging provides imaging of a single focal plane and control over choosing field depth.10–12 Recently, there has been significant improvement in the direction of high-content imaging in real-time monitoring of signaling dynamics in single cells.13,14 Although laser scanning confocal microscopy is one of the approaches that can be used for measuring subcellular Ca2+ dynamics, the imaging speed is compromised. 15 Hence, we choose to use spinning-disk microscopy to perform cytosolic-Ca2+ imaging in a single plane. The rationale behind using Fluo-4 as the indicator is that it is having higher dissociation rate and lower value of Kd (345 nM). Additionally, Fluo-4 has high dynamic range, brightness, and high signal-to-noise ration among various Ca2+ dyes. 16
It is known that 34% of drugs on the market are based on G protein-coupled receptor (GPCR)-targeting drugs17,18 that are used to treat chronic heart disease, neurodisease, and cancer. It has also been shown that Ca2+ imaging can be used for drug screening and to identify the operating range of GPCR-targeting drug doses. 19 GPCR-targeting drugs, including norepinephrine, tizanidine, clonidine, and dexmedetomidine (examples of neuroprotective drugs), are generally used for the treatment of various neurodegenerative diseases as well as heart dysfunctions.18,20,21 The evaluation of drug efficiency and ranking of drugs have been performed through k-means clustering of the features extracted from the Ca2+ response. 19
An increased level of norepinephrine is known to stimulate cardiac autophagy and hypertrophy. 22 In fact, excess norepinephrine is known to cause oxidative stress and cell death. Existing studies mostly concentrate on the mechanisms corresponding to lower levels of norepinephrine. 23 Despite knowing the adverse effects of norepinephrine, the responses in the presence of higher levels of norepinephrine are not explored. Specifically, large-scale studies and identification of Ca2+ signatures for a longer duration have not been performed. In this context, we propose imaging using confocal imaging and visualization of a dataset of a large number of videos on Ca2+ dynamics using uniform manifold approximation and projection (UMAP). To the best of our knowledge, this is the first instance of studying cell death dynamics through confocal imaging of cytosolic Ca2+ and identification of various Ca2+ signatures using fuzzy clustering. In addition, we present a detailed comparison of Ca2+ dynamics at low and high levels of norepinephrine.
In this article, we choose norepinephrine that targets α2 adrenergic receptors (α2ARs), since the underlying mechanism for inducing toxicity is crucial in determining the drug dose range for modulating cardiac function.24–26 Clinical trials have shown that norepinephrine can be used for the treatment of hypotension and maintaining mean arterial pressure in the intensive care unit (ICU) setting as well as during caesarian delivery. It has been found that norepinephrine has been tested in such clinical trials with perfusion of approximately 0.05–2 µg/Kg.min of norepinephrine using an intravenous pump. 22 In several other cases, however, it has been reported that higher drug doses may be lethal by activating apoptosis by creating Ca2+ overload in the mitochondrial matrix. 23 Hence, a toxicity study assumes importance for determining the safe ranges of drug doses and Ca2+ levels under higher levels of norepinephrine.
Previous studies mostly concentrate on toxicity studies based on protein expression and quantification of viability and the percentage of apoptotic cells using annexin V. 21 Recent work shows that flow cytometry has been implemented to measure cytosolic and mitochondrial Ca2+ to monitor apoptosis. 21 These techniques, however, are able to capture only the Ca2+ level at a lower resolution. Moreover, fluorescent and confocal microscopy also have been used for studying the apoptotic process through the measurement of intracellular Ca2+. 27 However, obtaining the correlation between cellular responses and death dynamics remains challenging due to the unavailability of tools that can be used for quantitative imaging. In this article, we demonstrate a methodology for high-resolution imaging that provides the Ca2+ dynamics in subcellular parts in the presence of high levels of norepinephrine.
One of the major challenges for analyzing a large number of time-lapse Ca2+ imaging videos is to visualize and quantify the spatiotemporal dynamics of Ca2+ level obtained through time-lapse imaging. In this context, the development of tools in combination with high-content imaging and automated analysis is expected to increase the quality of molecules progressing to preclinical stages during the drug development pipeline. 28 Previously, various clustering techniques including k-means and hierarchical clustering, based on Euclidian and correlation distances, have been used to group the cells with respect to a Ca2+-spiking patterns shown by them in a population.29–31 There is, however, less investigation in clustering analysis that divides the Ca2+ time-series data points into groups, such that distributions of patterns corresponding to lower and higher drug doses are deciphered.
Recently, a nonlinear dimensionality reduction technique, UMAP, has been developed for the analysis of high-dimensional data. 32 In the current work, we propose a computational framework based on UMAP and fuzzy c-means (FCM) clustering, which generates a complete visualization of a dataset for Ca2+ dynamics and finds the relative distribution of various responses in a dose range. The rationale behind choosing FCM is to perform a probabilistic allocation for the points that can be a part of various clusters.
In this article, we propose an integrated framework for the measurement and analysis of Ca2+ in single cells through live cell imaging using spinning-disk confocal microscopy. First, we provide a detailed protocol for imaging using confocal microscopy. Second, this work highlights the use of UMAP for visualization and interpretation of spiking responses at various doses. The toolbox based on UMAP and FCM is efficient and fast, such that standard desktop computers can process the data in a few seconds. The specific novelty of the proposed study is to demonstrate the feasibility of using UMAP and FCM to identify distinctly different responses. Furthermore, reclustering of high dose responses shows that there are three distinct responses, among which one corresponds to the accumulation of Ca2+ in subcellular parts followed by cell blebbing and lytic death. The quantitative imaging reveals the specific signature of Ca2+ dynamics that lead to cell death.
Materials and Methods
Cell Culture
HeLa cells were cultured in Dulbecco’s modified Eagle medium (DMEM; Cellgro, Manassas, VA) supplemented with 10% dialyzed fetal bovine serum (Atlanta Biologicals, Flowery Branch, GA). The cells were grown in 29 mm glass-bottom dishes (In Vitro Scientific, Sunnyvale, CA) and were maintained in culture until 70–80% confluency.
Imaging Setup Using Spinning-Disk Confocal Microscopy
Cells seeded on 29 mm glass-bottom dishes were imaged (48 h after seeding the cells) using a Leica spinning-disc confocal-imaging system (Leica Microsystems, Wetzlar, Germany) that has an Andor FRAPPA device and electron-multiplying charge-coupled device (EM-CCD) camera (Andor, Belfast, UK). During the entire duration of Ca2+ imaging, HeLa cells were maintained in Hank’s Balanced Salt Solution (HBSS; Invitrogen, Life Technologies, Grand Island, NY) at 37 °C, 5% CO2, in an incubator that is attached to the microscope. To avoid the decrease in fluorescent intensity through drifts in the imaging plane, an adaptive focus control (AFC) was used. Specifically, a 63× oil objective was used to find the Ca2+ spiking in subcellular parts. Fluorescent images were acquired with argon laser, excited at 488 nm for tracking Fluo-4 (Molecular Probes, Life Technologies, Grand Island, NY) intensity.
Fluorescent Dye Labeling and Ca2+ Imaging for Monitoring Cell Death
Ca2+ imaging was performed in HBSS. Cell cultures were loaded with 2 µM Fluo-4 for 30 min in HBSS at 25 °C. Then, the cells were washed with HBSS three times with a 10 min incubation time for each of the washes. Time-lapse imaging was performed before and after adding the drug. The Fluo-4 images (excitation: 488 nm; emission: 510 nm) were acquired at approximately 3–4 s intervals at 37 °C. Norepinephrine (Sigma-Aldrich, St. Louis, MO) in HBSS was used to activate the α2AR at various doses. To cover a wide range of agonist concentrations, the cells were treated with nine different concentrations (0.1 µM, 0.5 µM, 1 µM, 10 µM, 40 µM, 50 µM, 100 µM, 200 µM, and 400 µM) of norepinephrine. Time-lapse imaging was used to construct the videos to monitor the cell fate dynamics and Ca2+ level for 615 s.
Differential Interference Contrast Imaging and a Propidium Iodide Hoechst Assay for Cell Lysis
HeLa cells were washed three times with HBSS (Gibco, Grand Island, NY) before differential interference contrast (DIC) imaging using a laser scanning confocal microscope (SP8 Lightning, Leica Microsystems). To detect the cell lysis, cells were stained with 2.5 µg/ml propidium iodide (PI; Sigma-Aldrich) and were visualized using an excitation at 561 nm and emission at 600–660 nm using a Hybrid Detector 4 (Hyd4; Leica Microsystems) and 63× oil objective in confocal microscopy. 33 Nuclear morphology was analyzed using Hoechst 33342 nuclear staining, and imaging was performed with a 63× oil objective (Sigma-Aldrich) at 405 nm excitation.34,35 DNA condensation was visualized using a photomultiplier tube (PMT) 3 detector (emission: 420–480 nm).
Image Analysis Measurements and Quantification
Time-lapse movies were acquired every 3–4 s for 103 s (30 frames) before agonist addition and 615 s after agonist addition. Andor IQ software was used to obtain the time course of fluorescence intensity of Fluo-4 in each cell treated with drug. For single-cell analysis, the regions of interest (ROIs) were selected around the cell periphery, and the mean fluorescent signal was collected within the ROIs (
Since the dataset was obtained through acquisition of multiple videos for a large range of doses, it was found that some of the videos contain photobleaching (
Dataset Description
The distribution of various doses in the dataset used is represented in
Data Preprocessing
To perform correction to address the photobleaching events, first de-trending of the fluorescent traces was performed using an algorithm presented in Venkateswarlu et al. 36 Next, the time course of Ca2+ was denoised using the method of exponential moving average. The tsmovavg function in MATLAB was used to smoothen data. Since the Fluo-4 intensity measures are at different time points for different videos, finally Fluo-4 intensities for all videos at a fixed set of time points (395) were calculated through interpolation using the interp1 function in MATLAB.
Normalization
After preprocessing, we performed normalization of the dataset using L2norm, which is defined on Euclidean distance:
Running the Dimensionality Reduction Algorithm
We used the umap-learn library (Version 0.3.9) of Python 3.7, which computes the reduced matrix using UMAP projection.32,37,38 This algorithm was run on a total dataset (395 time points × 298 cells) and a higher-doses dataset (395 time points × 65 cells). The UMAP runtime was found to be 1.07 s. We also had performed t-distributed stochastic neighbor embedding (t-SNE) for visualizing the two-dimensional (2D) projection with a runtime of 2.79 s.
Visualization of Cell Populations and Fuzzy Clustering
To visualize the ability of the dimensionality reduction method to preserve the cohesiveness of data, we first incorporated the categorical labels of various drug doses. To choose a putative cluster number, first we performed clustermap visualization based on hierarchical clustering using the Python Seaborn Library (Version 0.9). Since the clustermap analysis indicated that the dataset may be divided into approximately 10 distinct groups (
Comparison of Ca2+ Spiking within a Group
We further present the similarity between the spiking profiles of all cells within and among clusters using the empirical cumulative distribution function (eCDF in MATLAB). The eCDF is a step function that jumps up by 1/n at each of the n data points, thus converging to probability 1. Here, the distance between two cells was measured by calculation of pairwise root mean square error (RMSE) between the eCDFs of those two cells. The lower RMSE between the eCDFs of two Ca2+-spiking profiles indicates higher statistical similarity between them. In addition, we calculated Pearson’s correlation coefficient between each pair within 10 clusters.
A schematic diagram for the overall workflow proposed for visualization and analysis is presented in
Figure 1
. Also, the parameters and distances used in the algorithms are listed in
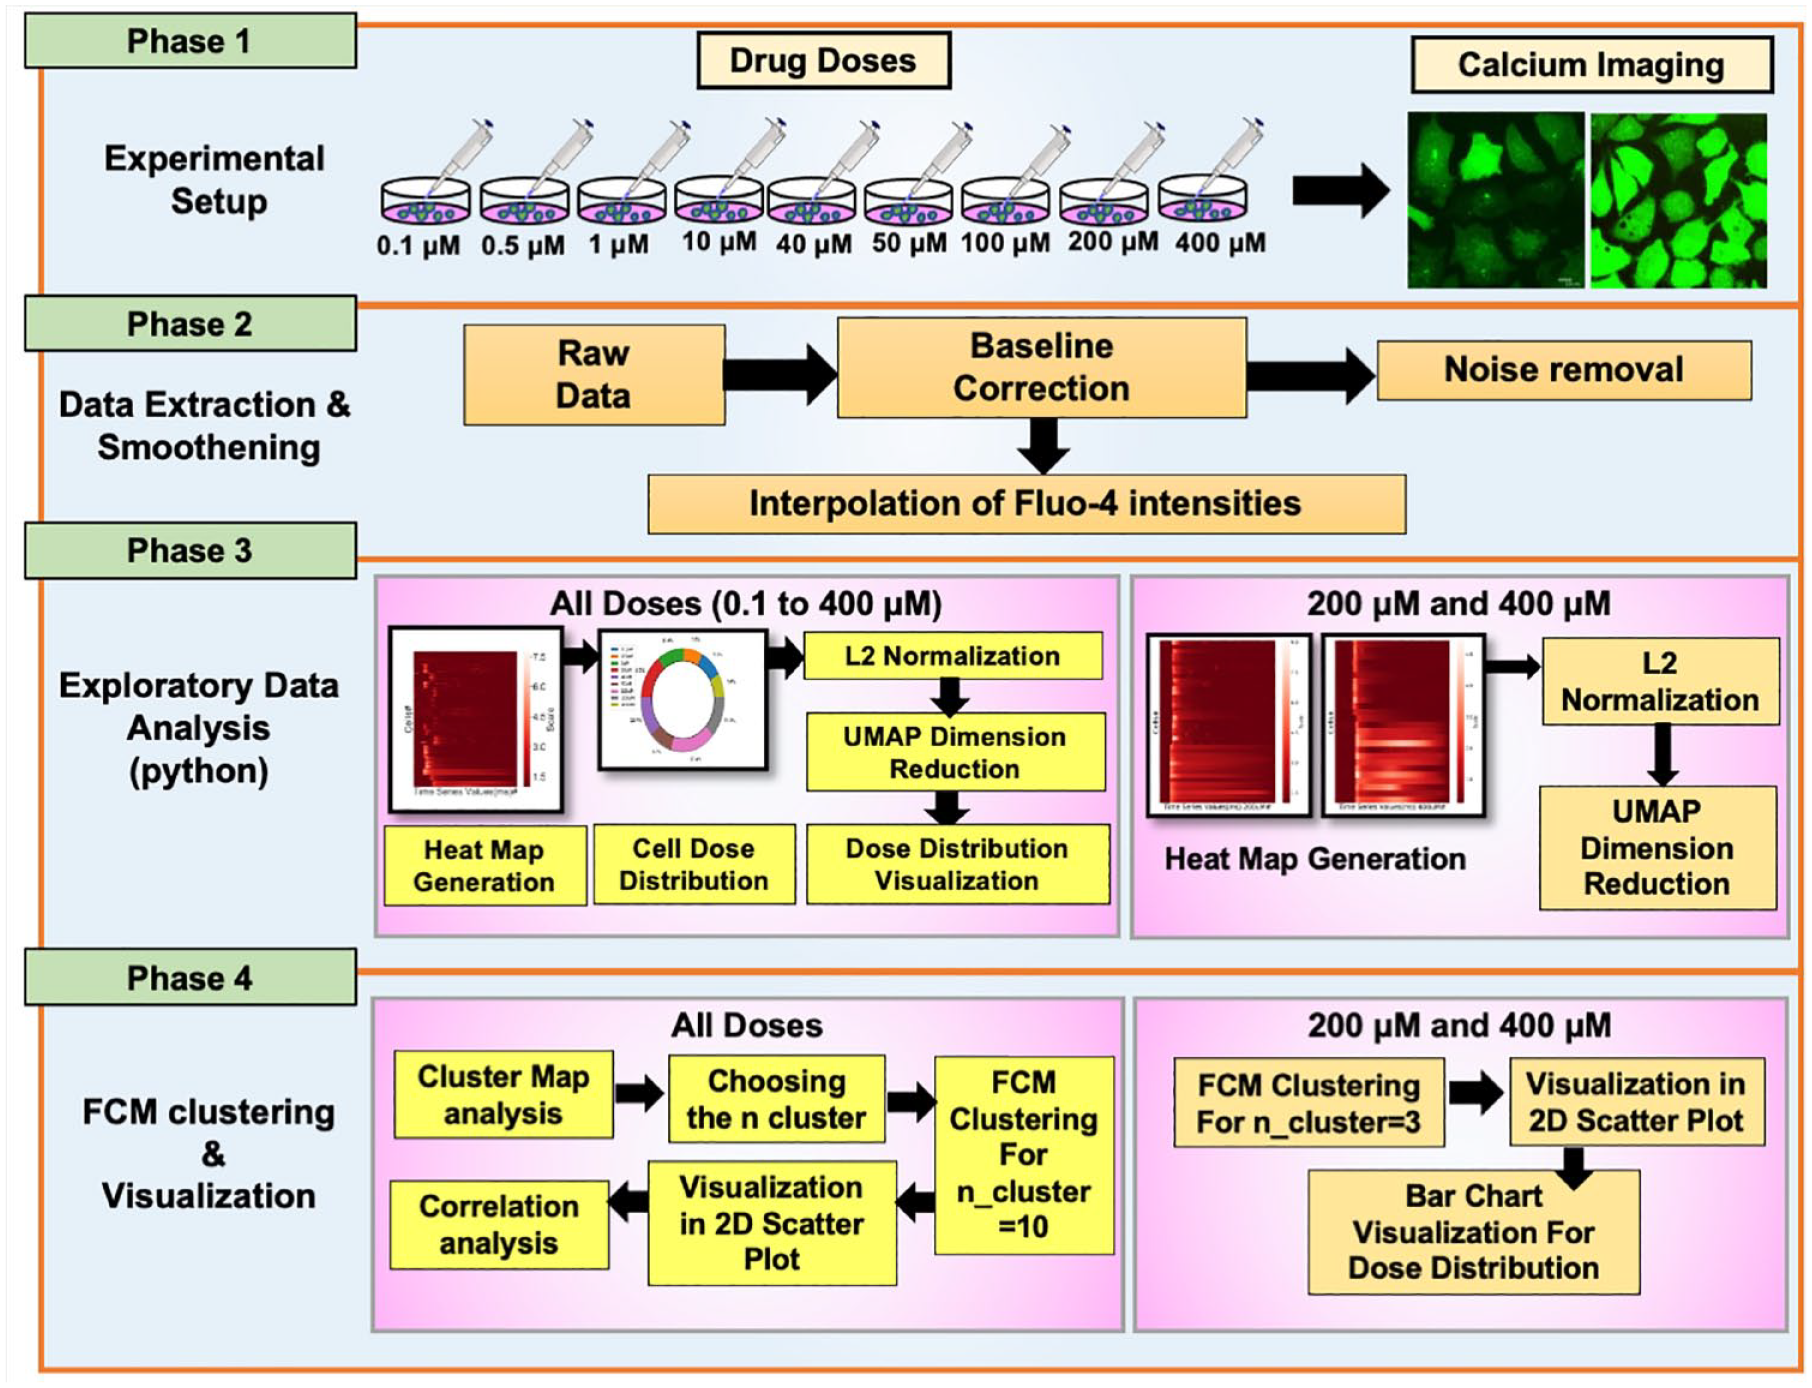
Schematic diagram for data acquisition to obtain a dose–response profile using high-resolution Ca2+ imaging, data visualization, and clustering of Ca2+ dynamics. The process is divided into four steps: (
Statistical Analysis
One-way analysis of variance (ANOVA) was used for multiple comparisons between doses to see the difference with respect to the amplitude and number of spikes in Ca2+ oscillation using MATLAB.
Results
Time-Lapse Imaging and Single-Cell Responses
We have used a time-lapse imaging approach to obtain Ca2+ responses after treatment with an agonist for various doses and obtained quantitative information about collective Ca2+ dynamics in a group of cells cultured on a petri dish.
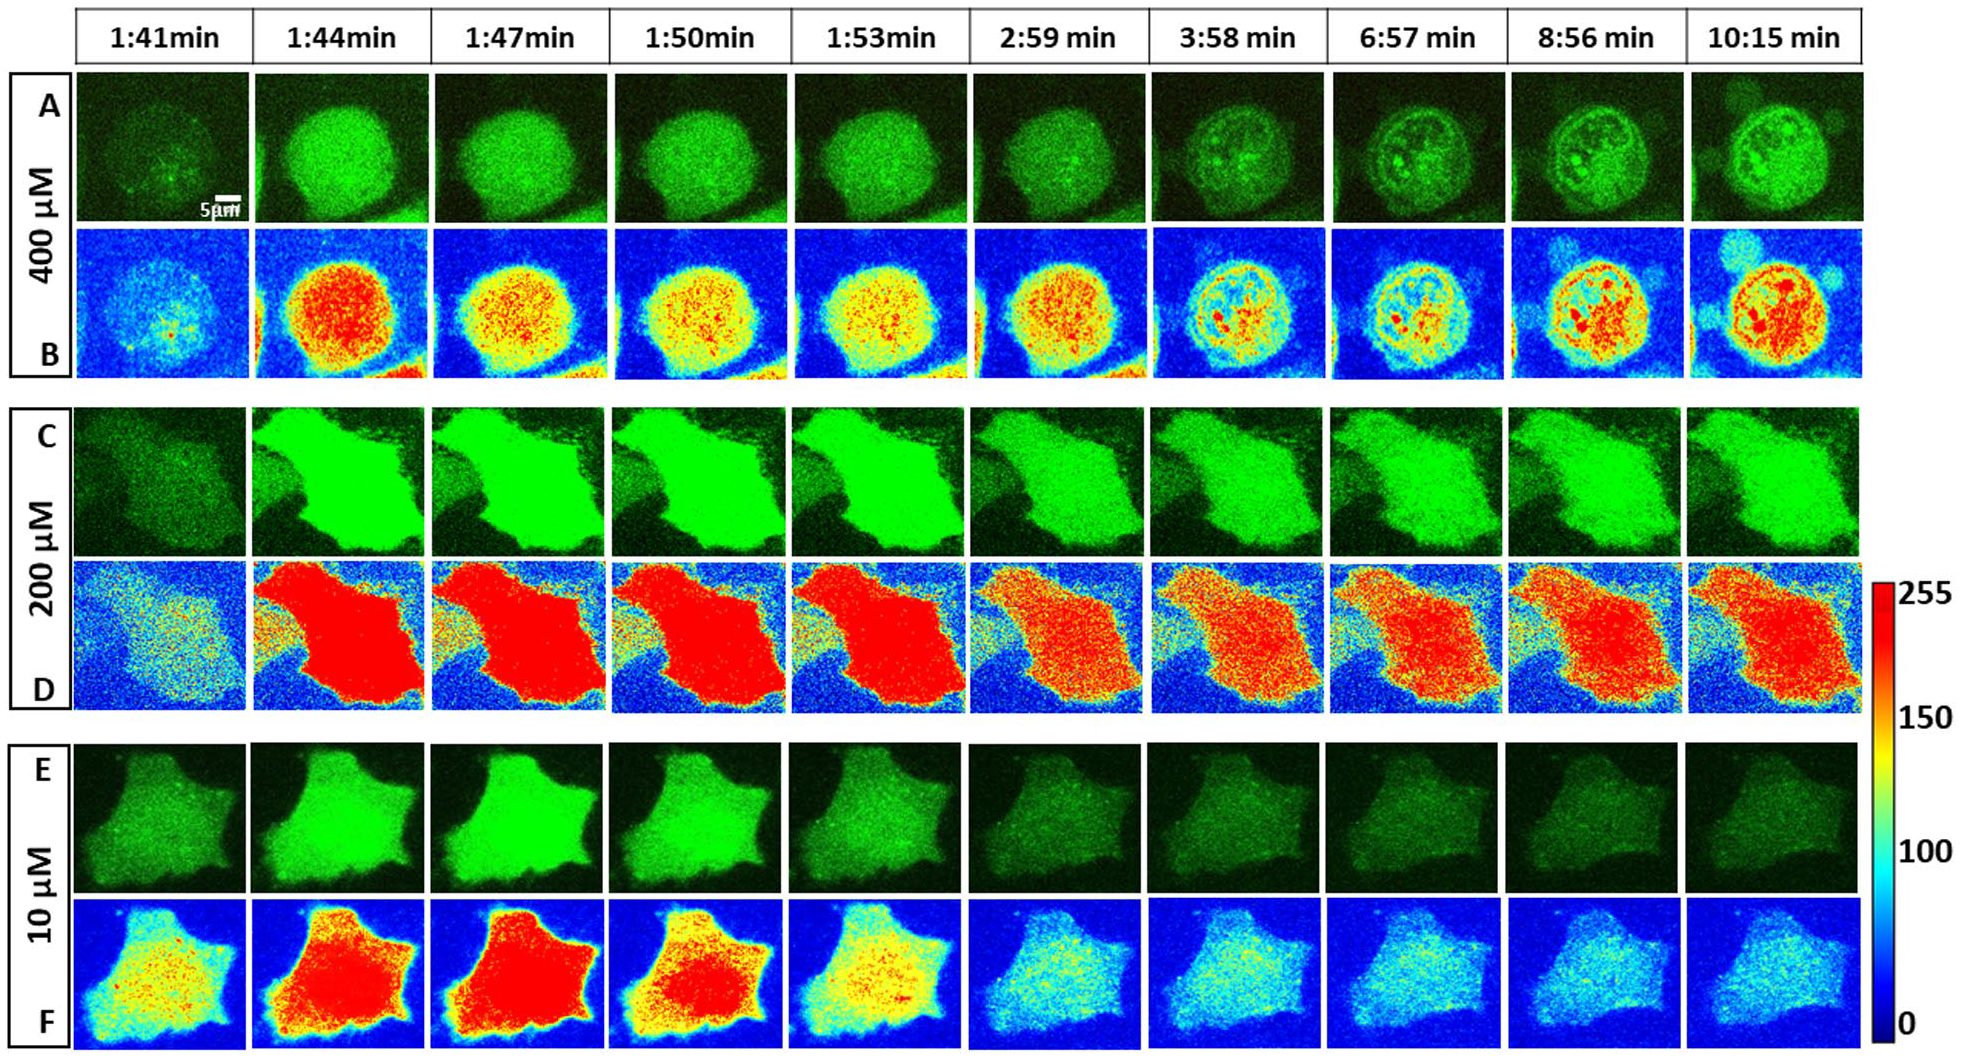
Figure 2
shows the heat map representation of time-lapse images obtained for two representative cell populations treated with 10 µM and 400 µM norepinephrine. The results show that for lower doses, the Ca2+ level comes back to the basal level after 3 s, whereas for higher doses, an increased level of Ca2+ is maintained for a longer period. To obtain a mapping of dose response from 0.1 µM to 400 µM, we plotted the time course of Fluo-4 intensity in multiple cells for each dose (
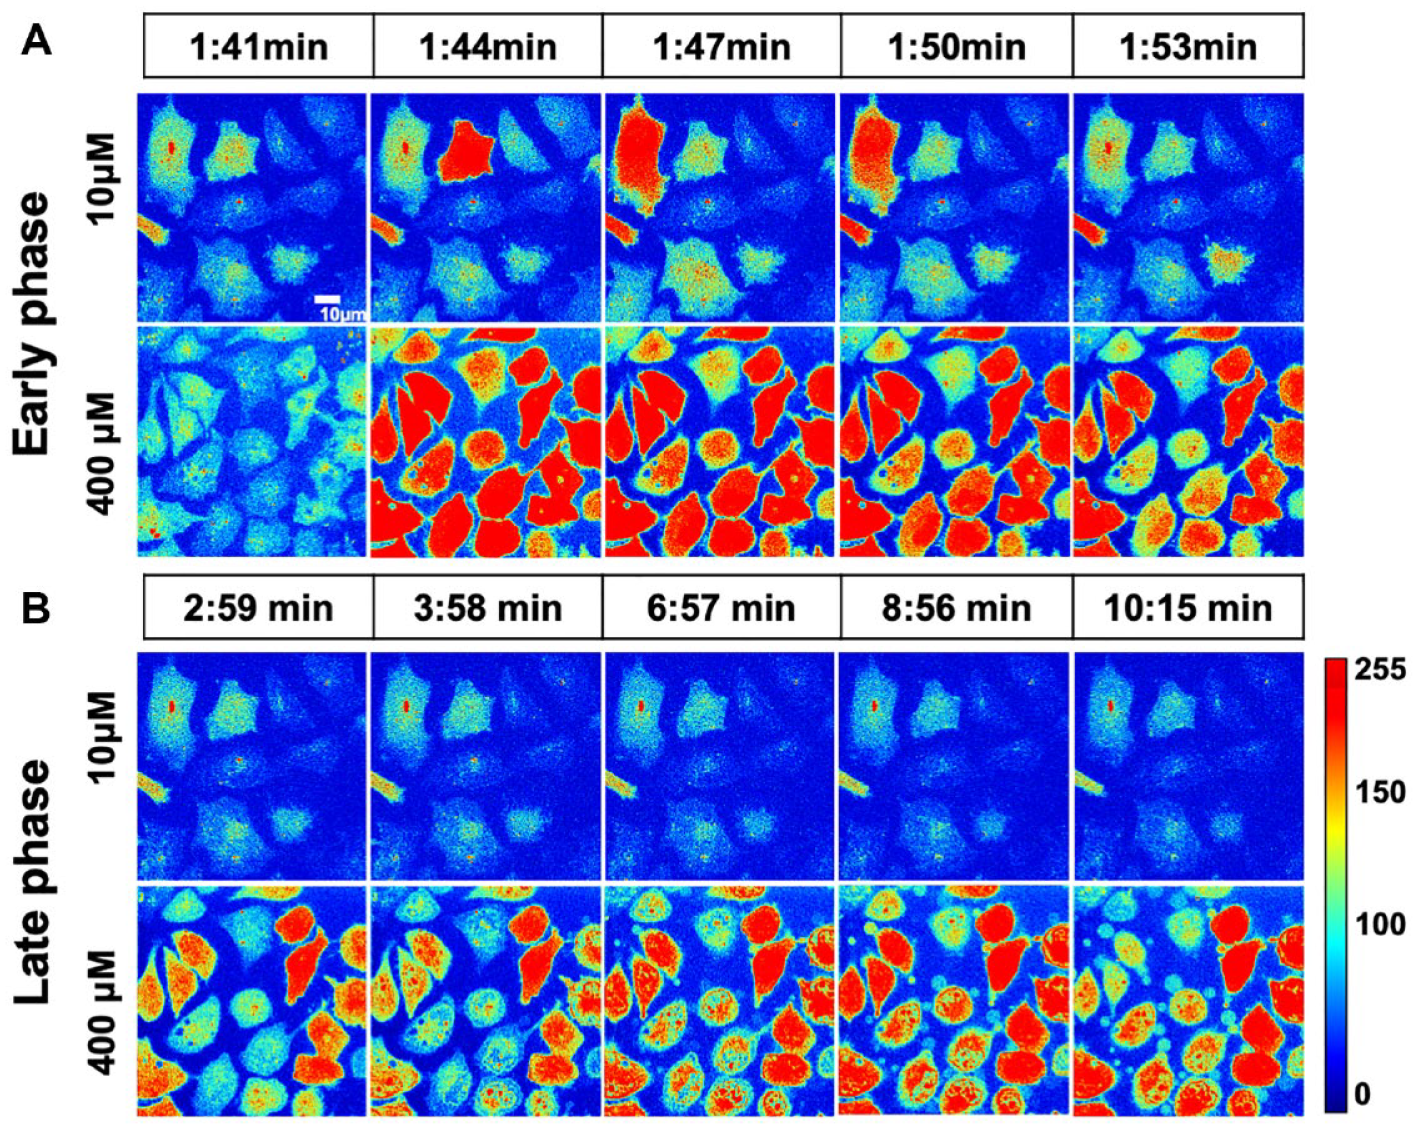
Spatial intensity mapping of Fluo-4 showing the distribution of Ca2+ response in a HeLa cell population (n = x) in the presence of norepinephrine (an α2-adrenergic receptor agonist). Representative time-lapse images were collected from the videos captured using a 63× oil objective in spinning-disk confocal microscopy for 615 s. (
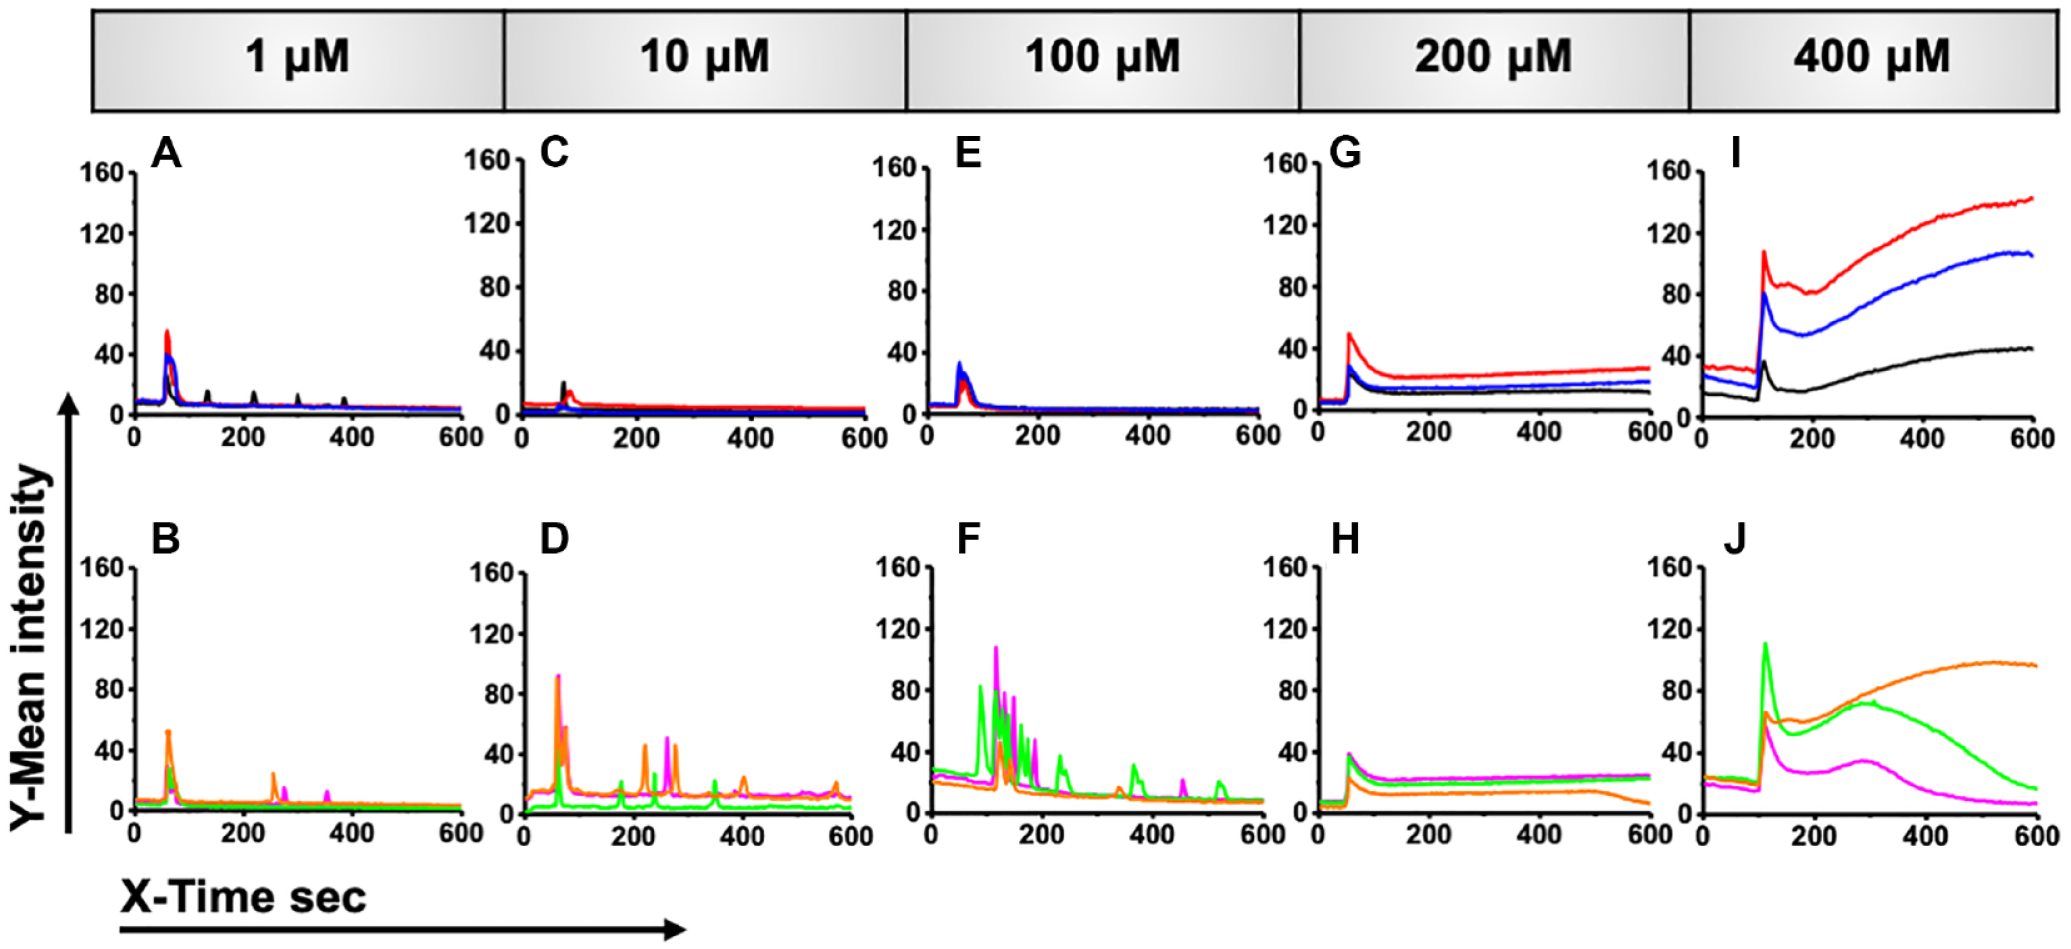
Time course of Fluo-4 intensity obtained from single cells treated with a norepinephrine dose ranging from 1 µM to 400 µM shows cell-to-cell variability in Ca2+ response. For each dose of norepinephrine, five representative fluorescent traces from individual cells are shown: (
Time Course of Cytosolic Ca2+ for a Wide Range of Drug Doses
First, we show the complete time-series dataset on responses obtained for 0.1 to 400 µM for 298 cells through the heat map representation, where the y-axis is Fluo-4 intensity for all the cells treated with various doses (
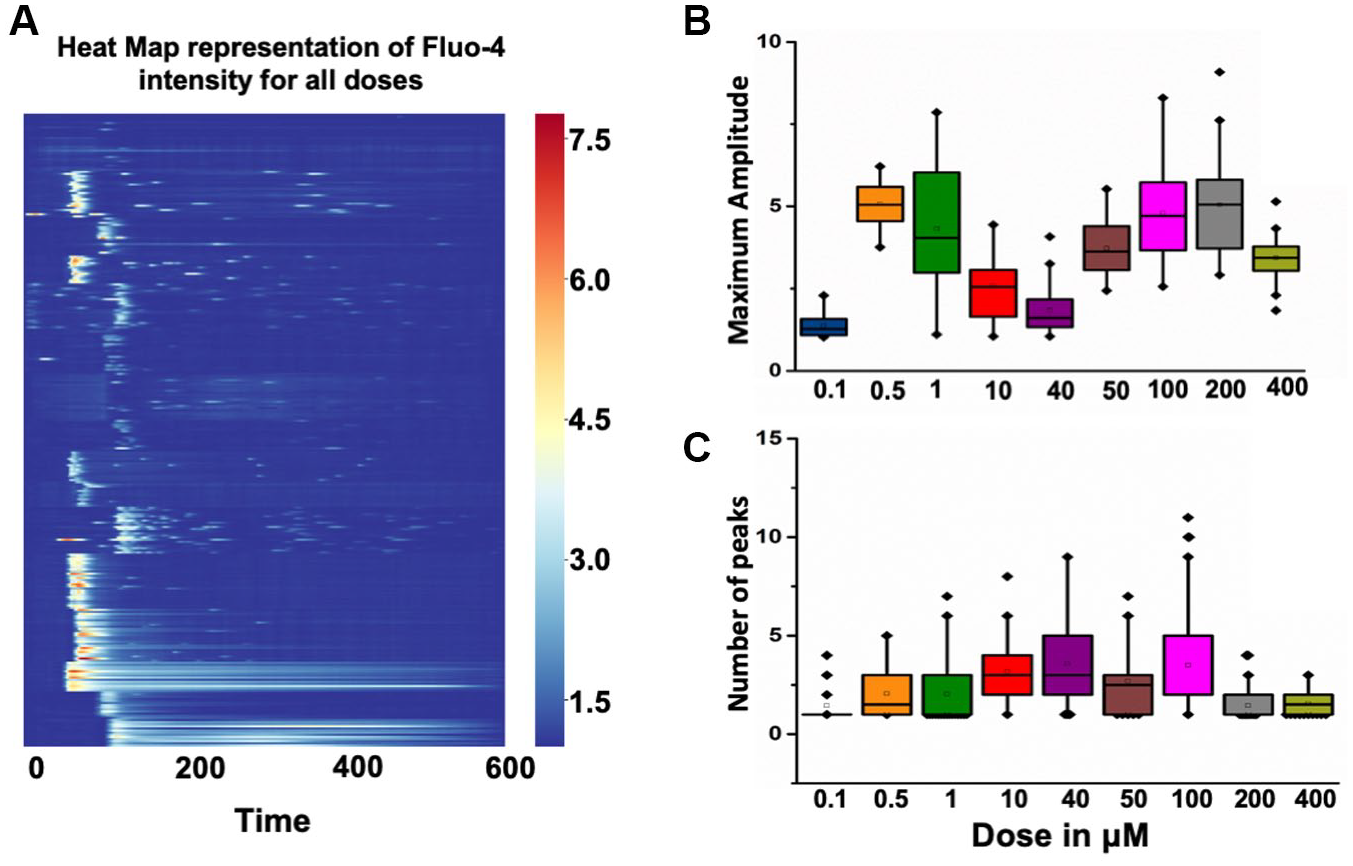
Visualization of a dose–response profile obtained from Ca2+-imaging experiments. (
Next, we performed one-way ANOVA for pairwise comparisons between doses to investigate the dose-to-dose differences in numbers of peaks and amplitude of the Ca2+ resposes.
UMAP Visualization and Fuzzy C-Means Clustering
Since single-cell Ca2+ dynamics for various doses give rise to high-dimensional data, we have implemented UMAP to convert the information to a lower dimension. UMAP is known to be very efficient at embedding large high-dimensional datasets.
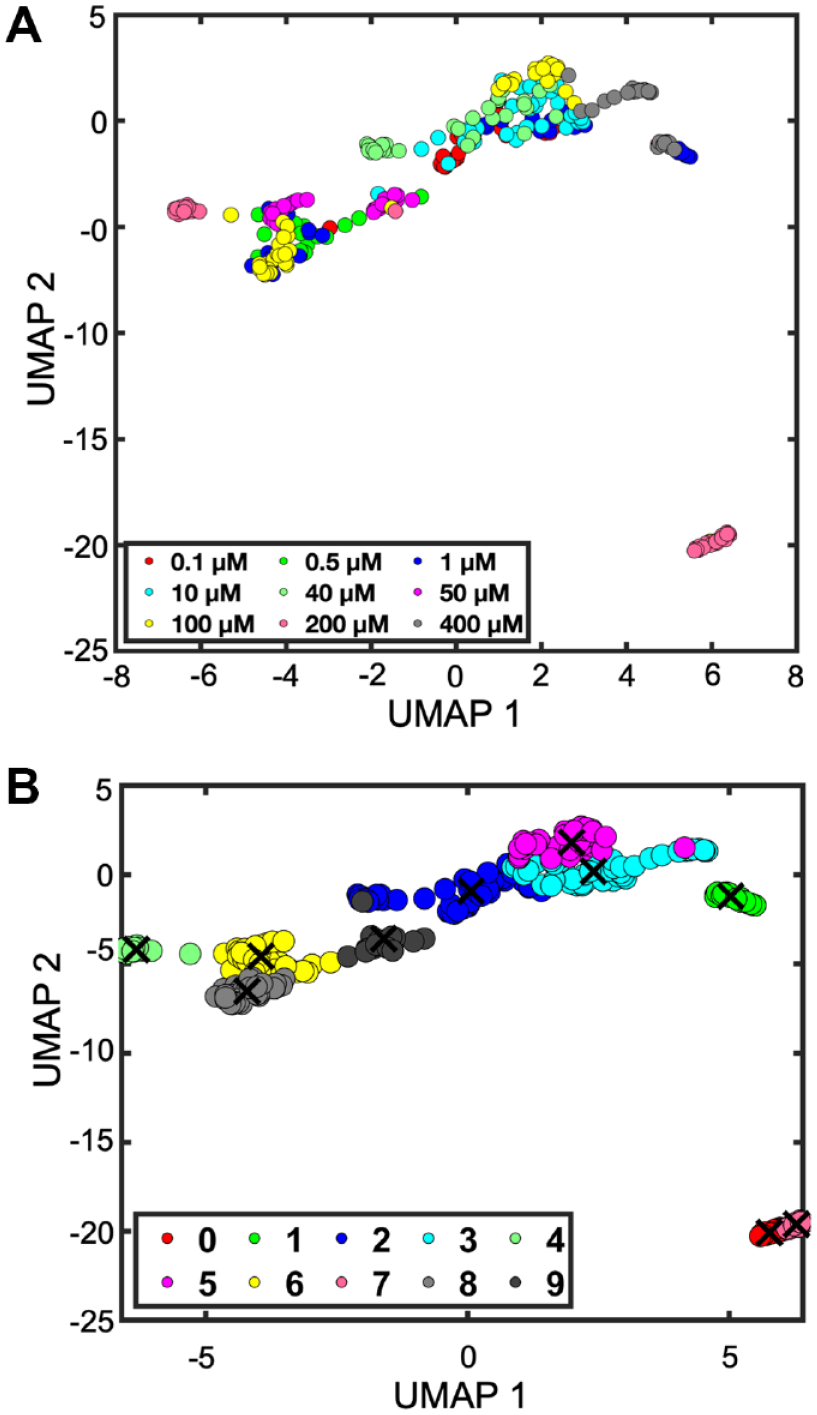
Uniform manifold and projection (UMAP) embed the overall structure of dose–response data based on measurement of Ca2+. (a) UMAP of fluorescent traces color-coded according to the norepinephrine dose. (b) UMAP and fuzzy c-means clustering of Ca2+ responses (k = 10). Please see figure online for color.
After UMAP reduction, we found that many data points could go to more than one cluster. Hence, we performed fuzzy c-means clustering for grouping the time-series events into 10 broad types (
While UMAP is able to segregate the data into distinct island regions corresponding to one cluster, back mapping of time-series data shows that clusters 0 and 4 show a spiking pattern of distinct features and cluster 3 shows the noisy responses corresponding to low drug doses (
To show that the proposed quantitative confocal microscopy with UMAP visualization and FCM clustering is better than the other existing methods, we performed an analysis of the above dataset with six methods: (1) feature extraction and k-means clustering, (2) feature extraction and FCM clustering, (3) PCA and k-means clustering, (4) feature extraction and hierarchical clustering, (5) UMAP and hierarchical clustering, and (6) UMAP and fuzzy clustering.
Comparison of Various Methods for Analysis of Ca2+ Response Using Seven Internal and External Clustering Validation Indices.
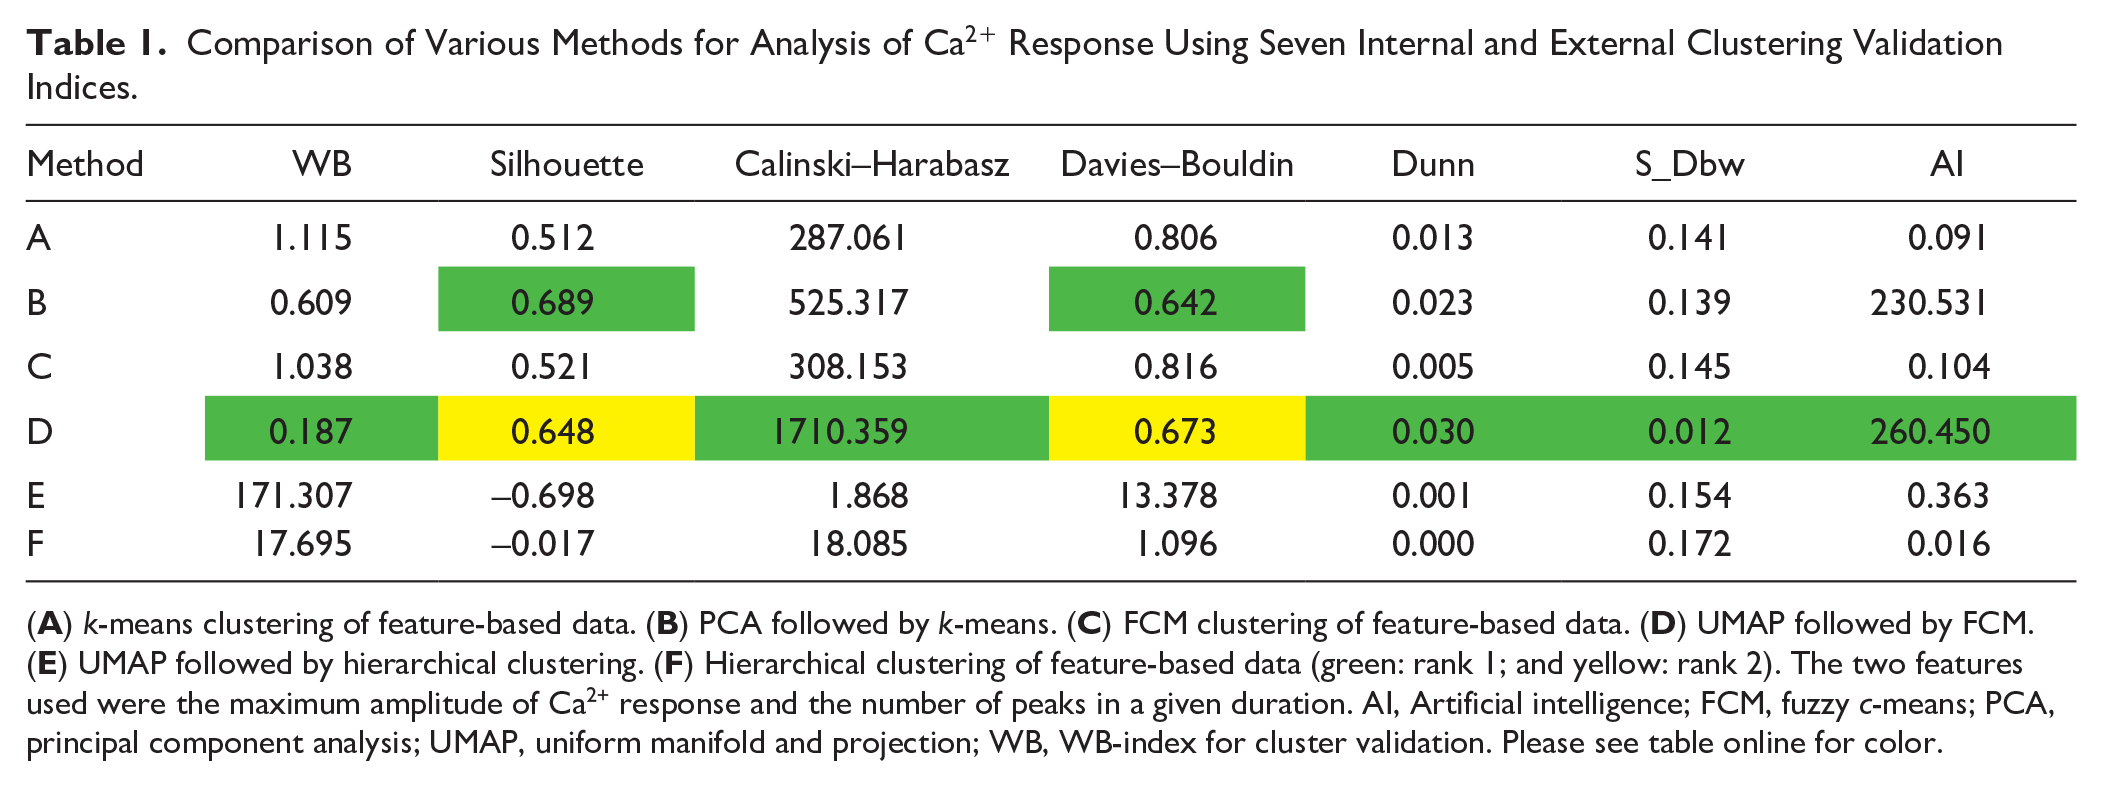
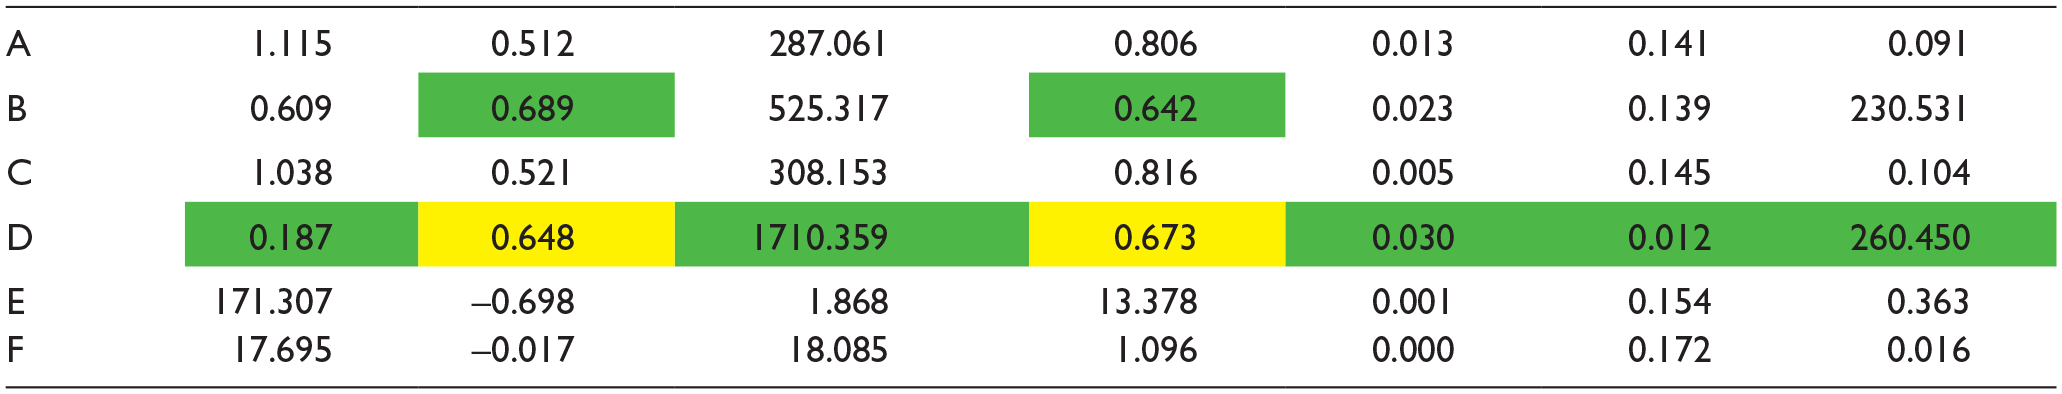
(
Single-Cell Ca2+ Dynamics for Higher Drug Doses
Based on these results, we reclustered the Ca2+ dynamics in cells treated with 200 and 400 µM of norepinephrine (
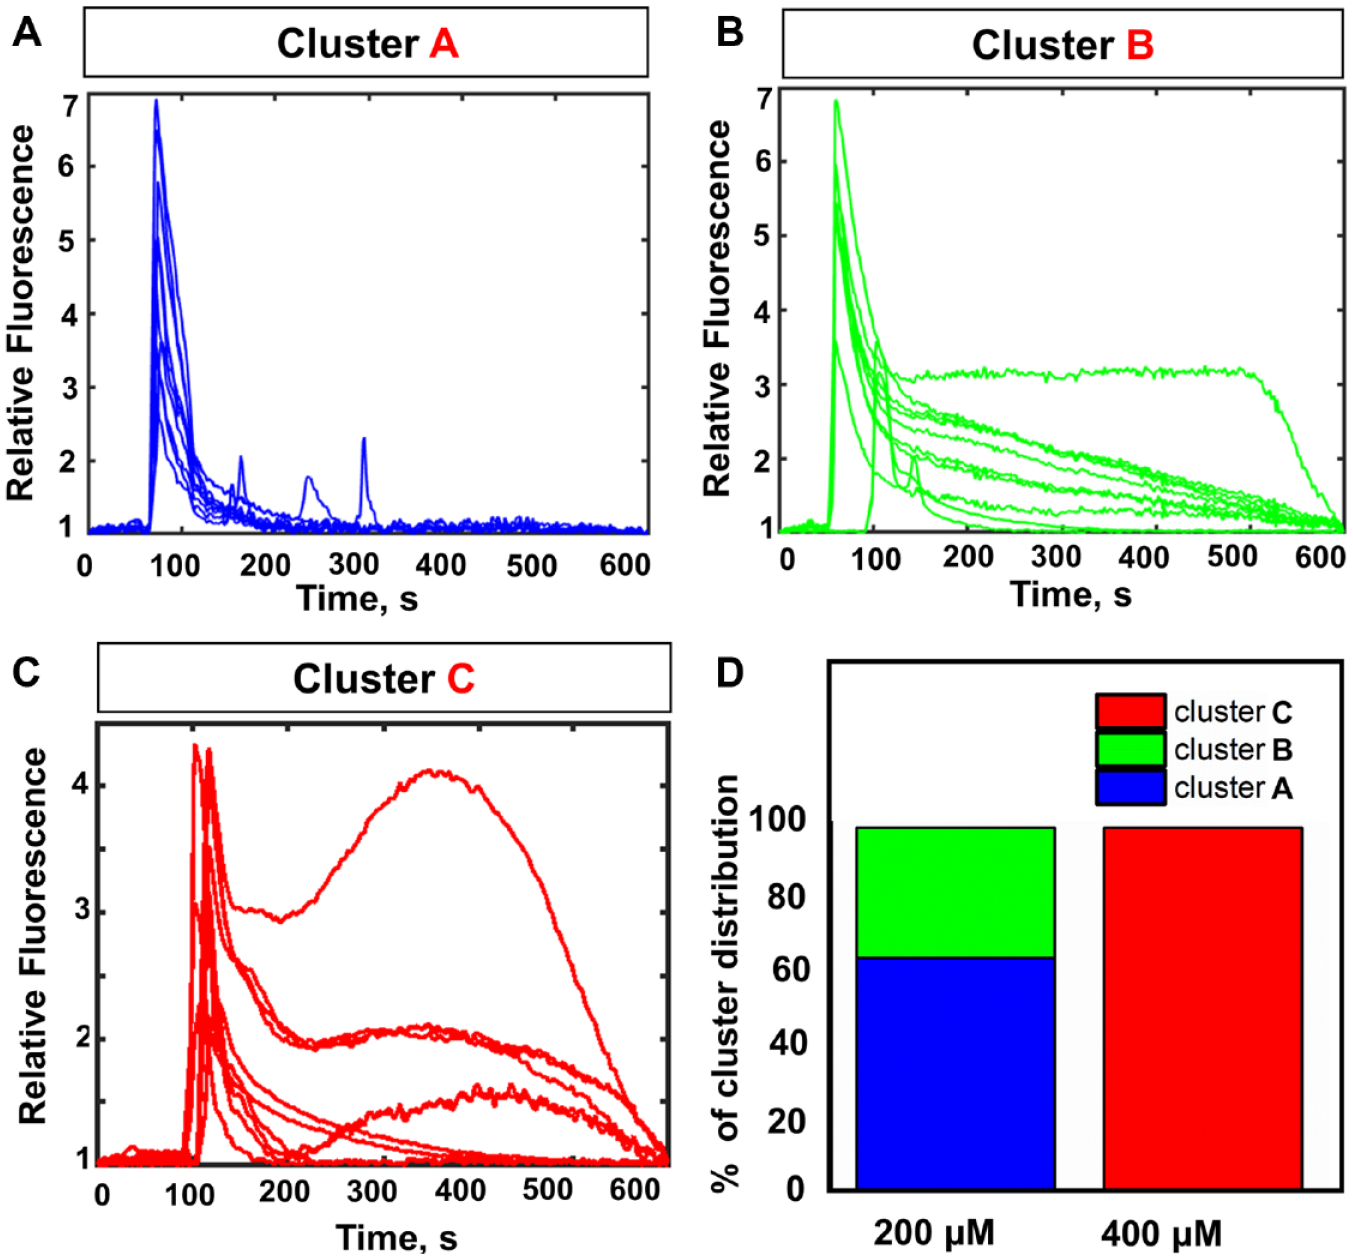
Single-cell landscaping of Ca2+ dynamics at higher doses. (
Spatial Mapping of Cytosolic Ca2+ in Single Cells
To identify the specific pattern of Ca2+ accumulation in cells of cluster A obtained from reclustering the dataset corresponding to the high dose, we further focused on spatial mapping of Ca2+ levels in single cells. Specifically, to have a correlation between Ca2+ traces and cell fate, we show the specific Ca2+ signature corresponding to the higher dose of norepinephrine.
Figure 7A
shows the impact of higher drug doses on cytosolic Ca2+ along with the cell morphology corresponding to cluster C.
Figure 7B
shows the corresponding spatial intensity mapping describing the sequestration of Ca2+ into small subcellular domains. Specifically, confocal imaging of Fluo-4 intensity reveals that the released Ca2+ is sequestered in specific intracellular regions in the cell (180–615 s after the addition of drug). Also, we found that the sequestration of Ca2+ leads to the formation of extracellular projections and cell blebbing between 240 and 615 s (
Characteristic fluorescent images and spatial heat mapping of three distinct Ca2+ responses. (
In contrast, distinctly different traces are obtained for cells from cluster B (
To confirm cell lysis, we performed time-lapse imaging of cells treated with 400 µM norepinephrine using a PI assay.
To validate the proposed method, we further compared the method with a lysis assay using PI and a DNA-staining assay with Hoechst 33342. The results show the change in cell shape and the increase in Hoechst 33342 during 0–200 s. Generally, the toxicity of cells is tested using cell shape and a PI assay.
33
Figure 8
shows the comparison of time-lapse imaging based on confocal microscopy of cytosolic Ca2+ with an established method like DIC imaging, PI, and Hoechst staining.33–35 We performed DNA staining using Hoechst 33342 and time-lapse imaging, as shown in
Figure 8
(panel 3). The results show that there is an increase in the Hoechst signal with time (
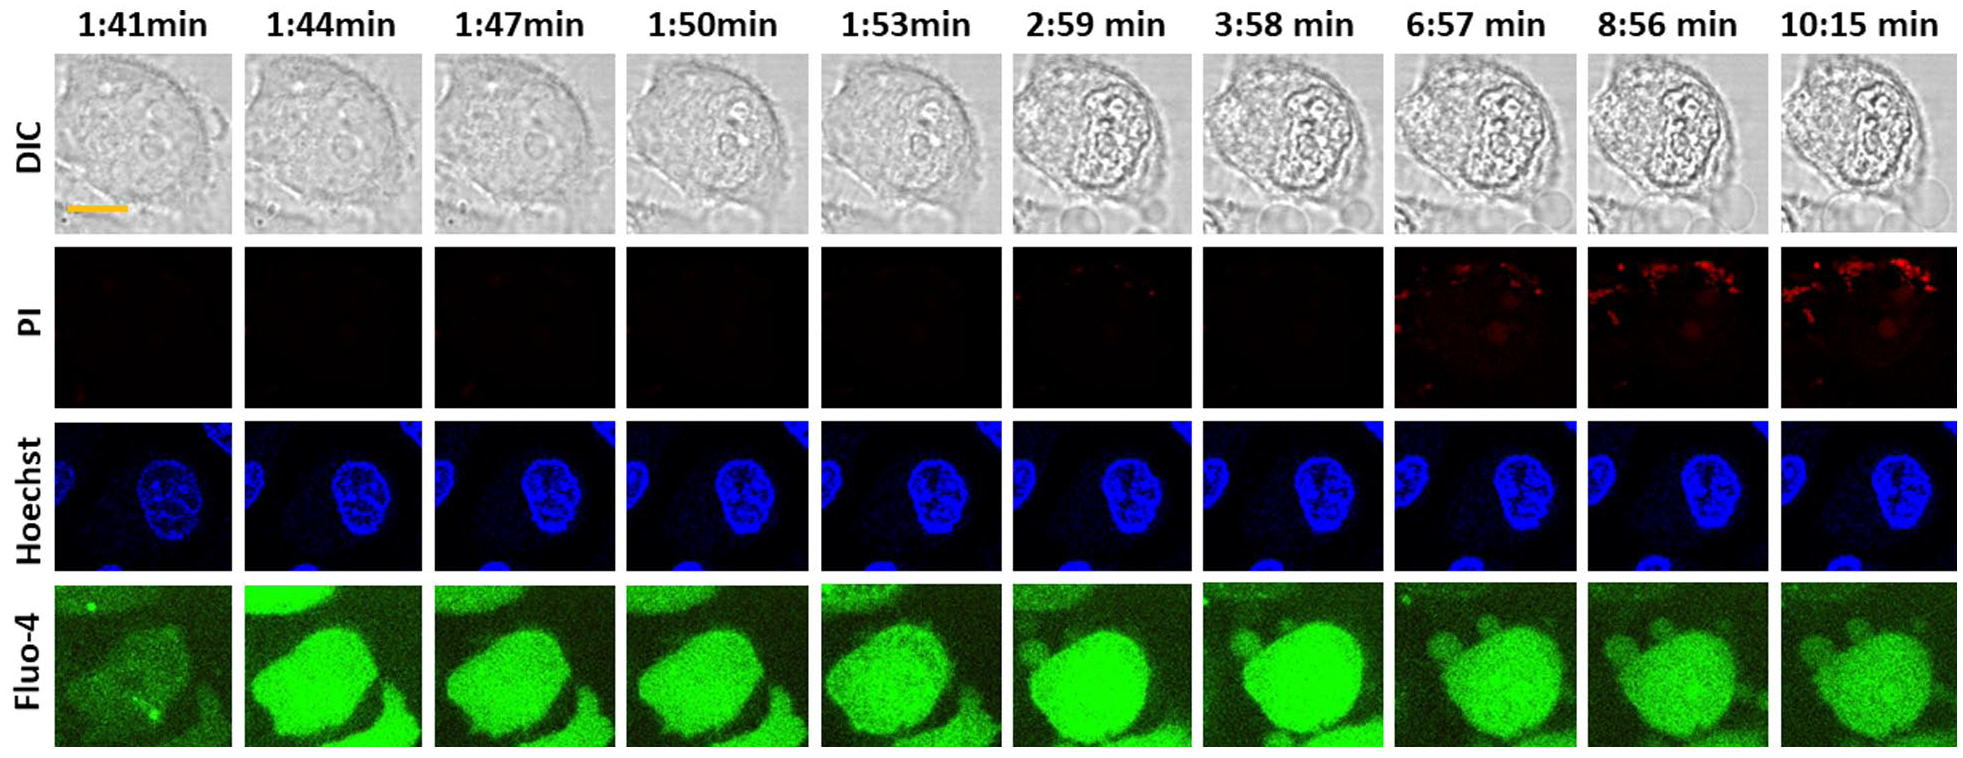
Comparison of various imaging techniques for measuring cell lysis and cell death using confocal microscopy. Comparison of signals obtained from time-lapse imaging: (
Discussion
In this work, we propose live imaging-based testing of ligands and identify specific Ca2+ signatures using machine learning tools. Specifically, we performed dimension reduction of the dose–response dataset followed by clustering of Ca2+ responses. Particularly, we performed reclustering of responses obtained with higher drug doses. To observe the time course of events at various drug doses, we performed Fluo-4 imaging using a 63× objective in spinning-disk confocal imaging. Also, we showed that the proposed computational framework is capable of identifying the cell death dynamics that are correlated with accumulation of Ca2+ in subcellular parts. This work shows a proof of concept that such an assay can be used for monitoring cell dynamics and Ca2+ signature during cell death.
Although higher resolution in spatiotemporal distribution of Ca2+ can be obtained by 3D imaging,
36
here we performed 2D imaging because 3D imaging leads to a reduction in time resolution and increase in imaging time. Another drawback for large-scale 3D imaging is that there is no suitable software that can be used for quantification of total fluorescent intensity within the specific volume obtained through 3D reconstruction. Moreover, more resources are needed in terms of memory and computation time for the reconstruction of z-stacks, visualization of Ca2+ oscillations, volumetric segmentation, and data analysis.
36
The current method is based on 2D imaging of cytosolic Ca2+ in a confocal plane, and some confocal images may appear oversaturated. Due to this, the quantitation may give a reduced value of fluorescence measurement compared to the actual value of fluorescence. Although measurement of higher concentrations of Ca2+ is one of the limitations of the proposed technique, the error arising from unwanted pixels was minimized using background correction, as mentioned in
Although the expression of single reporter biomolecules can be used for live monitoring and for generating dynamic data on apoptotic processes using high-resolution microscopy, 40 the major disadvantage is lower transfection efficiency. This method has the ability to monitor transfected cells, which are around 30–40% of the whole cell population. 41 Hence, in large-scale data acquisition on multiple doses, and mapping of toxicity remains challenging using transfection-based methods.
Although differentiation between lytic and apoptotic death is outside the scope of this work, the proposed assay can be updated for simultaneous monitoring of other dyes, including caspase-8 reporter and mitochondrial (Mitotracker) dye, along with Ca2+. Fluorometric characteristics have to be chosen such that there are no overlapping signals.33,40 It was observed that imaging with multiple dyes, including PI–Fluo-4 and Hoechst–Fluo-4, leads to overlapping signals, different rates of internalization of the dye, and modification in toxicity levels. Hence, to quantify the toxicity or lytic process in the presence of norepinephrine, it was not possible to perform imaging using combinations of Fluo-4 and PI or Fluo-4 and Hoechst.
Recently, cell viability and cytotoxicity assays have assumed significant importance in drug screening and preclinical studies. Especially, dynamical feature extraction from quantitative phase imaging has been proved to be suitable for cell death detection. 33 Time-lapse imaging of cell morphology and cell mass topography during cell death has been used to classify cell death into two types: apoptosis and cell lysis. Since it has been reported that lytic death is associated with the formation of large cytoplasmic membrane blebs or multiple small blebs, it is possible that norepinephrine is inducing lytic cell death at higher doses. One of the achievements of this work is to decipher the correlation between Ca2+ sequestration in the subcellular domain and rupturing the membrane. 33 It has also been shown that norepinephrine with a lower dose may induce apoptosis when treated for a longer period of time. 22 The proposed study shows that a higher dose of norepinephrine can be specifically delivered to cancer cells to induce lytic cell death. 42
Although HeLa cells are known to be a good model for testing the cytotoxicity of norepinephrine, the same study can also be performed in a heart cell model. 43 Based on these results, we plan to perform an in vitro preclinical study of H9c2 cells for toxicity analysis and estimation of the Ca2+ level in the presence of various levels of norepinephrine. Such a model may also provide a cell-based model for hypertrophy. 23 The other limitation of the proposed framework for dose–response analysis is that it gives only the complex waveform for Ca2+ oscillation but does not provide the actual Ca2+ concentration. To estimate the concentration of Ca2+ at the subcellular level, we need to build a calibration curve by measuring Fluo-4 intensity under various concentrations of Ca2+ in a solution. 5
For dimension reduction, in general, PCA, t-SNE, UMAP, and other mapping-based techniques can be implemented. 33 To address the inherent nonlinear nature, however, we implemented UMAP and t-SNE, and specifically chose UMAP since it takes less time. UMAP can save computation time significantly for high-content screening experiments. 32 In contrast, fuzzy clustering is a soft clustering in which the data point closer to the center of the cluster has a higher degree of membership compared to the one that is farthest. The major disadvantage of using FCM, however, is a priori specification of the number of clusters. Hence, further improvements can be proposed based on HDBSCAN (hierarchical density-based spatial clustering of applications with noise) clustering in the future, which can be used for automation in the selection of cluster numbers. 44 Furthermore, to achieve fully automated analysis, an image-processing module coupled with the proposed dimension reduction and clustering can be used as a high-throughput data analysis workflow toward toxicity mapping. Also, the proposed computational tool can be used for analysis of cytosolic Ca2+ measured through genetic sensors. 12
The results show that higher concentration of norepinephrine induces sequestering of Ca2+ in subcellular parts during the dynamic cell death process. It is known that such an increase in cytosolic Ca2+ leads to an increase in mitochondrial membrane potential and thereby causes damage to epithelial cells. 27 Norepinephrine is known to induce IP3R1 [IP3 (inositol 1,4,5-trisphosphate) receptor subtype 1] activation, which leads to Ca2+ release from the endoplasmic reticulum (ER) to the cytosol.45–47 Also, previous studies indicate that IP3R3 may have a significant role in controlling cell death in HeLa cells and other cells. 48 The proposed tool can be used to investigate the role of IP3R3 channels involved in the sequestration of Ca2+ in the mitochondria. In addition, mathematical modeling can be performed to find the roles of various subtypes of IP3 receptor in the regulation of Ca2+ sequestration. Further channel-blocking experiments can be performed to identify the role of IP3R3. Also, a quantitative analysis of mitochondrial Ca2+ (Rhod dye) and correlation with Ca2+ sequestration can be useful for understanding the progression of cell death dynamics.
Supplemental Material
sj-pdf-1-jla-10.1177_24726303211019394 – Supplemental material for Quantitative Confocal Microscopy for Grouping of Dose–Response Data: Deciphering Calcium Sequestration and Subsequent Cell Death in the Presence of Excess Norepinephrine
Supplemental material, sj-pdf-1-jla-10.1177_24726303211019394 for Quantitative Confocal Microscopy for Grouping of Dose–Response Data: Deciphering Calcium Sequestration and Subsequent Cell Death in the Presence of Excess Norepinephrine by Kuruba Manohar, Suman Gare, Soumita Chel, Vaibhav Dhyani and Lopamudra Giri in SLAS Technology
Footnotes
Acknowledgements
The authors thank Dr. Narasimhan Gautam for providing the research facilities at Washington University in St. Louis, and we also thank the valuable contributions of Vani Kalyanraman in setting the initial stages of the project on live cell imaging. We acknowledge Dr. Soumya Jana for his valuable contribution in framing the computational methods.
Supplemental material is available online with this article.
Author Contributions
Manohar Kuruba, Suman Gare, and Lopamudra Giri: conceptualization and methodology development; Manohar Kuruba, Suman Gare, and Soumita Chel: data analysis; Suman Gare and Vaibhav Dhyani: visualization and analysis; and Manohar Kuruba, Lopamudra Giri, and Suman Gare: writing the original draft.
Declaration of Conflicting Interests
The authors declared no potential conflicts of interest with respect to the research, authorship, and/or publication of this article.
Funding
The authors disclosed receipt of the following financial support for the research, authorship, and/or publication of this article: This work was funded in part by BT/PR22239/NNT/28/1269/2017. This work was also funded by BT/PR21261/MED/31/348/2016. We also thank Department of Science and Technology for providing the Fellowship granted to Kuruba Manohar.
References
Supplementary Material
Please find the following supplemental material available below.
For Open Access articles published under a Creative Commons License, all supplemental material carries the same license as the article it is associated with.
For non-Open Access articles published, all supplemental material carries a non-exclusive license, and permission requests for re-use of supplemental material or any part of supplemental material shall be sent directly to the copyright owner as specified in the copyright notice associated with the article.