
Abstract
Ambitions to improve the connectivity of devices to enable automation and digital representation of processes have been around for some time. Nevertheless, some companies, especially in life science and analytical science, tend to adopt these developments rather slowly. In the field of microbial analysis of drinking and process water, for example, a large part of the work is still carried out manually, although the high number of samples per day and the low fluctuation in work processes would predestine water analysis for a higher degree of automation. Obstacles such as the risk of bottlenecks and possible downtimes after machine failure, the spatial conditions together with the low flexibility of the automated system, a lack of trained personnel, and the high acquisition costs hinder this development, however.
To lower these barriers, we have developed a system for the generation of flexibly expandable automated process lines, which handles sample handling and sample transport as a decisive step in the networking of several devices. The system allows the connection of devices that are distributed over the entire laboratory or close to each other, as well as those with a combination of both spatial situations. A functional or throughput expansion of the process can be realized by adding additional devices or storage areas to the network.
With this concept, we have established a system for the automatic processing of defined steps of a routine Legionella pneumophila screening in drinking water testing. From this starting point, the process can be extended to cover further steps, such as concentrating or plating, up to the full analytical workflow.
Introduction
Microbial Drinking Water Testing
As early as 1883, Robert Koch established the bacterial contamination of water as a criterion for the quality of drinking water and thus created the beginnings of modern drinking water analysis. 1 This parameter, now known as the heterotrophic plate count (HPC), still exists today. 2 Since then, however, the number of parameters that have to be monitored in compliance with the German Federal Environment Agency to ensure quality and make drinking water a safe foodstuff has risen steadily. Since the introduction of the German Drinking Water Ordinance in 1975, the number of chemical, microbial, physical, and radioactivity parameters increased from 18 to a total number of 106 in 2018. 3 Considering microbiological drinking water analysis, which is the objective of the developed automation system, the Drinking Water Ordinance defines strict threshold values for the following parameters: 2
Coliform bacteria and Escherichia coli [0 colony-forming units (cfu)]
Enterococcus [0 cfu]
Pseudomonas aeruginosa [0 cfu]
HPC at 22 °C and 36 °C [20–1000cfu/ml]
Clostridium perfringens (and spores) [0 cfu]
Legionella spp. [100 cfu/100 ml]
All these organisms either are potentially dangerous to human health or serve as indicator parameters, and they must therefore be monitored at a defined frequency depending on the corresponding flow rate of the water-distributing institution. On one hand, coliform bacteria and Enterococcus indicate fecal impurities in the water, which in the past led to devastating epidemics. 4 Legionella pneumophila, on the other hand, is the main factor for the outbreak of legionellosis, an infectious disease that can range in severity from a mild, febrile illness (Pontiac fever) to rapid and potentially fatal pneumonia (Legionnaires’ disease). 5 In German drinking water treatment, chloride is hardly used anymore for water disinfection, which additionally increases the importance of frequent screens. 6
The more than 2500 large water suppliers (>1000 m3/d) 7 and the even larger number of process water–using facilities, in conjunction with the sampling intervals required by law, lead to an enormous amount of samples. In 2016, >1 million 8 official drinking and process water tests for microbial contamination, or indicator parameters in general, were carried out in Germany alone. Although the time to receive the results is rather slow, culture-based screening methods are still the state of the art for monitoring the microbial burden of drinking and process water. When testing for Legionella spp., Clostridium perfringens, and HPC, this procedure is currently the only one permitted under the Drinking Water Ordinance.
Considering the high number of samples, combined with the minimal fluctuation in the performed workflows, the demand and potential for a suitable automation strategy seem to be obvious. One system that is already commercially available is the ScanStation by Interscience S.A.R.L.
9
(Saint-Nom la Bretèche, France), which works as an automatic incubator and real-time colony counter with a maximum capacity of 300 plates per batch. This range of functions enables the automation of at least some subprocesses in drinking water analysis. A function or capacity expansion as well as integration into an automated process chain are not possible with the currently available versions, however. Nevertheless, the field of microbial testing of drinking water is still dominated by manually performed workflows with at most a basal level of automation. This reluctance to switch to automation can be explained by the specific situation of drinking water analysis laboratories. The main issue is related to the necessary process accreditation and validation of all routine drinking water analysis laboratories in Germany [Deutsches Institut für Normung (DIN) European Standards (EN)
We believe that, in particular, the barriers of high initial costs, the possibility of future-proof process adaptation, and the company’s adaptation to the new technology can be addressed by maximizing the flexibility and scalability of the automation solution. This article emphasizes the need for flexibility 11 by developing a system that can be easily adapted in terms of functionality, throughput, and sample capacity, and that also offers opportunities for expansion or modification at a later stage. In this way, it is possible to grow into the subject of automation step by step, according to the available budget, by starting with small and simple processes instead of building up total laboratory automation (TLA) from the outset.
Flexibility of Automated Systems
In this work, we tried to transfer manually dominated processes into a certain level of automation while preserving a maximum level of flexibility to address different specific needs in the functionality and performance of laboratories in the field of microbial testing. In 1982, however, Hedberg and Jonsson already pointed out that technology has often made organizations more rigid rather than more flexible. 12 Although technology has developed much further, it is still true that an easy adaptation of existing technologies to changing needs or parameters is often difficult to obtain. Changing the container type in an established analysis procedure (e.g., from a 90 mm culture plate to one with a 120 mm diameter) can cause enormous problems because not every available device may be able to handle the new format. It is therefore important to define and formalize the essential aspects and constraints under which flexibility must be maintained.
Structuring the Definition of Flexibility
Regarding the changing external situation, De Groote defined the generic term of flexibility as the yielding of the best possible performance in the face of environmental variability. 13 Hence, the initial starting point for the formalization of flexibility is the environment for which the technology is built. In the case of drinking and process water analysis, the intended environment will always be a laboratory with either an analytical or research orientation. The next step is to consider the possible variability within the boundaries of the previously defined environment. According to Najmabadi et al., the laboratory hardware needs to face functional, structural, and throughput changes. Therefore, they split the total flexibility (Ftotal) into functional flexibility Ff, structural flexibility Fs, and throughput flexibility Fv. 14
Functional flexibility represents the adaptability of a system to changes in functional requirements. In the lab environment, Najmabadi et al. 14 structured those into liquid-handling flexibility Ffl, transportation flexibility Fft, and instrument feeding flexibility Ffi. Nelson and Ghods defined the feature of modularity to be important to achieve functional flexibility. 15 Here, a system is divided into certain, less complex parts that fulfill distinct functions and can be removed or exchanged from the system separately.
Structural flexibility represents the ability of the system to change its configuration. 14 Nelson and Ghods presumed the feature of consistency as important for the overall acceptance of the system to changes. 15 The standardization of the inter- and intrasystem interfaces can achieve this consistency.
Throughput flexibility is defined as the capability of the system to react to throughput changes. 14 The total flexibility of the laboratory system depends on each of the just-defined flexibilities in a functional correlation [see Eqs. (1) and (2)]. 14


Determination of Numerical Flexibility Values
The determination of specific numeric values to characterize a system according to its flexibility can be helpful to identify the best design in the developmental phase as well as to characterize already existing systems and thus make them comparable with each other. In the work of Suh, a structured model is presented to consider the design of mechanical systems on a theoretical level.16,17 This consideration is based on two axioms.
The first axiom is called the independence axiom. According to this, the requirements for the automated system need to be mapped from the functional domain into design parameters in the physical domain. These functional requirements are the minimum set of independent parameters that the system needs to fulfill according to the customer’s or user’s needs. The translation of the functional demands into specific design parameters represents a transition from what to how.
The second axiom is the information axiom. This axiom states that the design with the lowest information context has the highest probability of success. The information context is the sum of each probability-of-success function (p) of all parameters in a given design. Since we intended to calculate and compare the effects of individual design parameters, it was sufficient to determine the p-values and not the accumulated information context. The p-function displays the degree of how well a design parameter (dp) fulfills the corresponding functional requirement (fr).

Every flexibility parameter has its distinct probability-of-success function. One method for the determination of the p-value is the comparison of how well the design range (dr) fits the needs of the system range (sr). The intersection between the two is the common range (cr). Equation (3) 14 shows the probability of success written as the quotient of the cr and sr. In case the automated system fulfills the requirement completely, the probability of success is 1 and thus 100%. In contrast, if the design fulfills none of the requirements, p is 0, which corresponds to 0%.
When calculating the adaptation flexibility of a system to a priori unknown processes, sr and cr are consequently also unknown. It can therefore be difficult to calculate precise numerical values. For that reason, it is rather beneficial to display the quotient of design capability and system requirement as a function. This illustrates a clear correlation and also indicates to what extent dr needs to be changeable and adaptable to achieve an optimal p-value.
Materials and Methods
Legionella spp. Screening According to DIN EN ISO 11731
Legionella screening was carried out according to DIN EN ISO 11731. 18 Tap water samples were collected and analyzed by a routine laboratory for drinking water analysis. To reduce possible side flora, all water samples were heat-treated in a water bath (50 °C, 30 min) prior to processing. Subsequently, each sample was plated directly following membrane filtration on buffered charcoal yeast extract (BCYE) agar plates (bioMérieux, Marcy-l’Étoile, France).
Direct Plating Method
After rigorous shaking of the specimen bottle, 1 ml of the sample was spread on the culture plate with a sterile spatula.
Membrane Filtration Method
After rigorous shaking of the sample bottle, 150 ml of sample was vacuum-filtrated (Sartorius Combisart with Sartorius vacuum pump 16612, pmax = 13 mbar; Sartorius, Göttingen, Germany) using a 47 mm cellulose nitrate membrane filter (pore size 0.45 µm; Sartorius). The filter was then placed directly on the culture plate with sterile forceps (retentate side up), avoiding air bubbles. After incubation periods of 4 and 10 d (at 36 °C), the grown colonies with conspicuous Legionella characteristics were counted. If a threshold of 100 CFU/ml was exceeded, colonies were subcultured on BCYE-CYS (cysteine) agar plates (bioMérieux). Since L-cysteine is essential for the growth of Legionella, the resistance of cultivability proves the existence of these bacteria.
Equipment and Materials Used for Device Construction
All of the devices described in this study were developed in-house, using both rapid manufacturing techniques such as fused deposition modeling three-dimensional (FDM 3D) printing and classic manufacturing techniques. All system components are designed for operation on 24V direct current (DC).
Robotic-Based PetriJet Platform
We used a Raspberry Pi 4 as the device controller (https://www.raspberrypi.org/products/raspberry-pi-4-model-b/). Each axis is driven by National Electrical Manufacturers Association size 23 (NEMA 23) stepper motors controlled by Trinamic motion control module 1110 (TMCM1110) drivers. For internal data transmission, an RS485 bus system with a customized Trinamic Motion Control Language (TMCL)-based communication protocol was used. Both grippers are equipped with Arduino Nano (ATmega 328; https://store.arduino.cc/usa/arduino-nano) low-level (LL) controllers.
Track-Based Transport Rail
The rail system as a passive component consists of industry-standard metal profiles and is equipped with two custom-made 24V DC busbars that serve as the power supply for the automated guided vehicle (AGV). The AGV has a built-in Teensy3.2 LL controller and an ESP8266 Wi-Fi communication bridge.
Camera Station
The camera station is equipped with an IDS UI-1580LE complementary metal–oxide–semiconductor (CMOS) industrial camera (Imaging Development Systems, Obersulm, Germany) and allows the sample to be illuminated from above and below.
Results and Discussion
Parameter Determination
As discussed above, the overall goal of process automation in microbial testing of drinking and process water is to preserve maximum adaptability of the developed system to changes or a priori unknown parameters in the laboratory environment. We have therefore defined the customer requirements, as shown in Table 1 , and mapped them into functional requirements. The total functionality of the system, the available budget, and the throughput demands are unknown parameters that, to a certain extent, depend on the specific situation of each company or laboratory f(c) or even change as a function of time f(t). In addition, most laboratories that consider automation try to rather slowly adapt their workflows to a more automated way of processing and do not build new and fully equipped facilities from the ground up. Thus, the automated system usually needs to be installed into already existing spatial conditions and share this space with human staff members. This requires the system to be adaptable. The only fixed requirement is the need for certain process robustness and stability.
Customer Needs, Their Mapping into Functional Requirements, and Deduction of Physical Design Parameters.
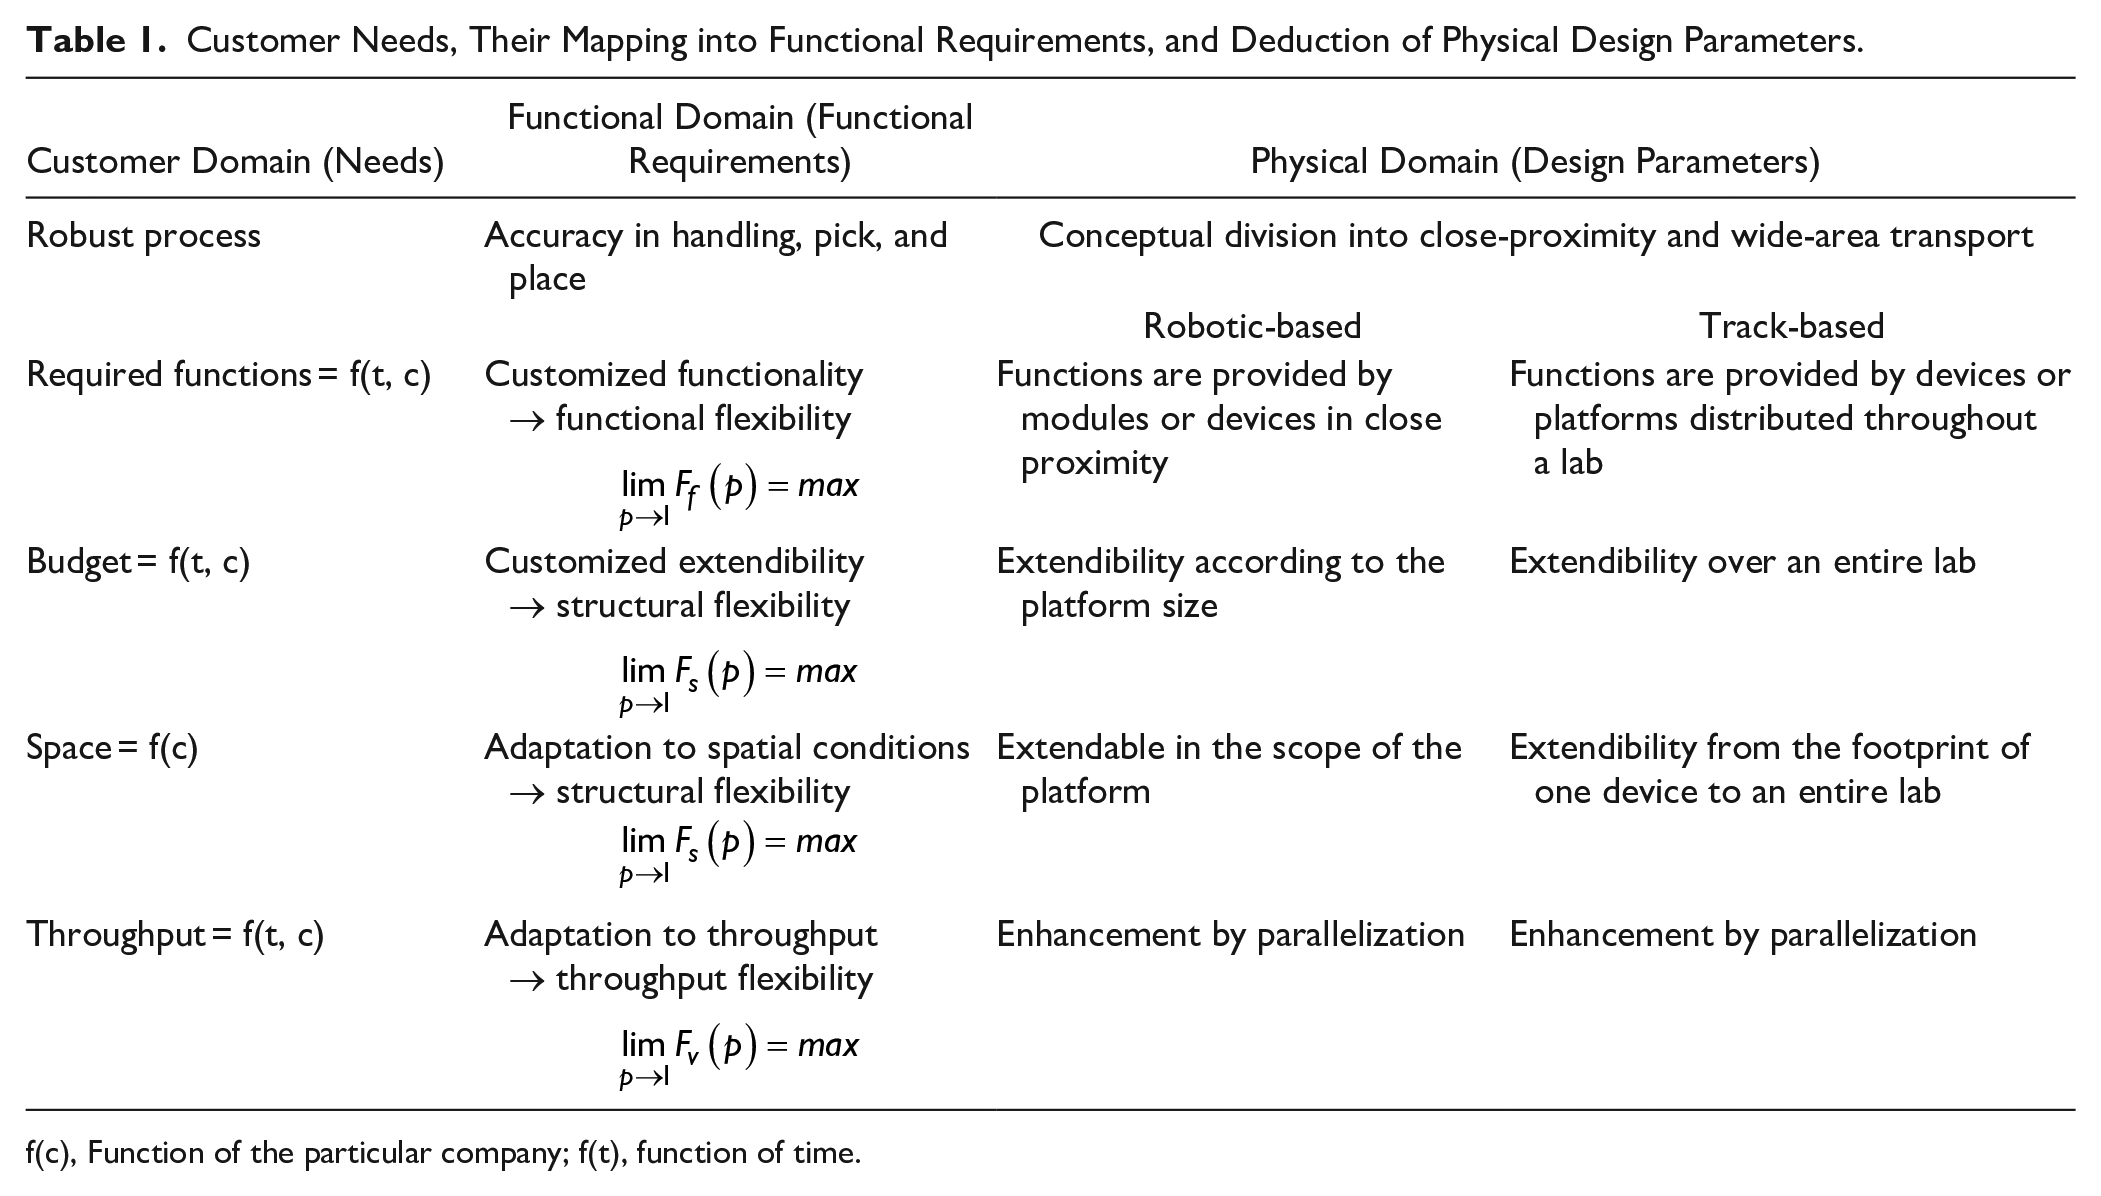
f(c), Function of the particular company; f(t), function of time.
In light of these considerations, the claimed system needs to interconnect already existing or customized devices and thus allow the creation of customizable process chains. The following explanations are summarized in Figure 1 . By using existing laboratory equipment, the possible functions and processes depend only on the type and number of devices in the network. Thus, the actual task of the developed system is limited to the transport and handling of samples and materials as well as the loading of the specific process equipment. This approach is in line with the idea of gaining flexibility via component-sharing modularity.15,19 At the communication level, the system needs to be capable of addressing all devices in the network to make centralized process control, data administration, and analysis possible (see the Management Architecture Concept section). The handling and loading of previously unknown samples hold a conflict of aims, however, since the handling units are usually specially designed for one or just a few sample container types or devices. The only possible alternative would be a handling device mimicking the human hand, since almost every device is designed or capable to be loaded manually. Such a complex mechanical element, however, would have some disadvantages in terms of robustness and speed of the process. Another obstacle is the long transport route the handling end-effector would have to travel to reach remote devices in the network. At every device side, the coordinate systems of the handling unit and the device would need to be synchronized to keep an acceptable handling accuracy. To avoid these obstacles, we divided the handling and transport function into two different approaches depending on the physical distance of the devices to be connected.
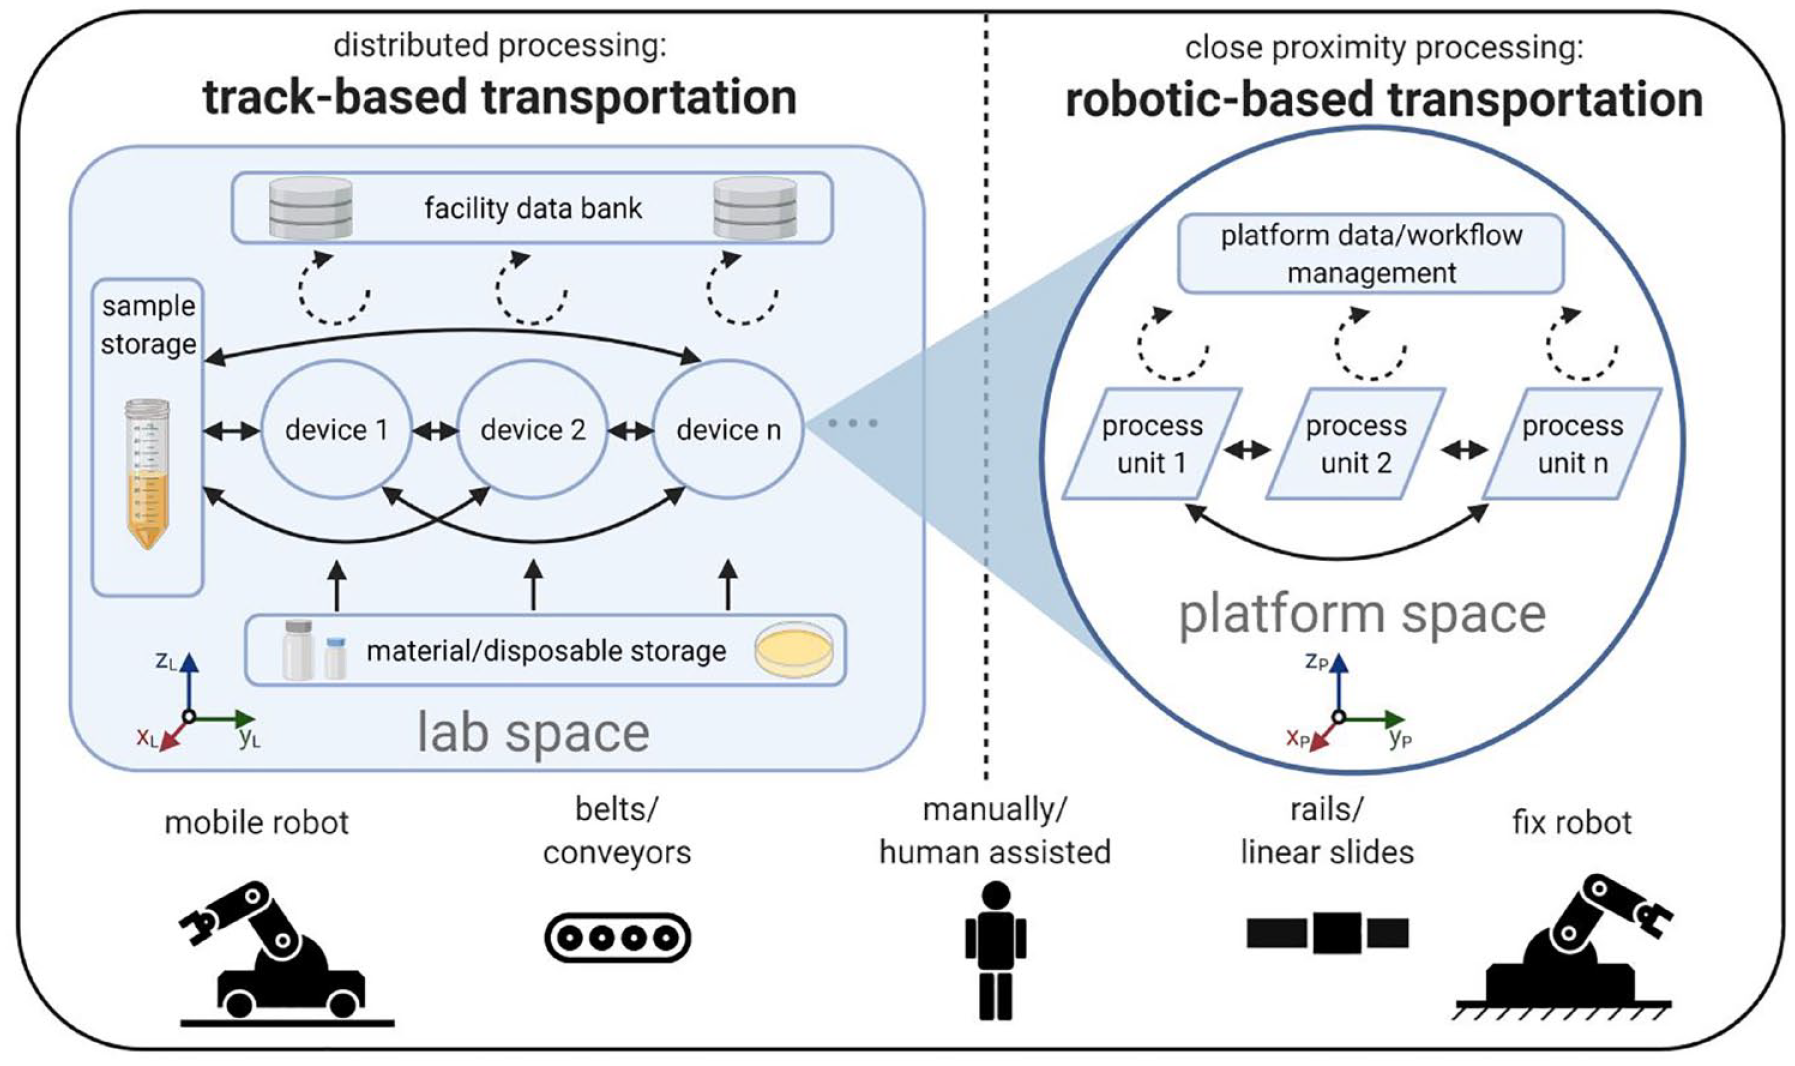
Connection of devices (left) on a lab scale and (right) on a platform scale. Full arrows represent possible transportation tasks of physical objects, and dotted arrows represent the transfer of data.
For larger devices close to each other or small benchtop gadgets that can be moved easily, we use a robotic-based transportation and handling concept (see
When fixed equipment or platforms are located at a greater distance, a track-based transport approach connects the distributed processing stations (see
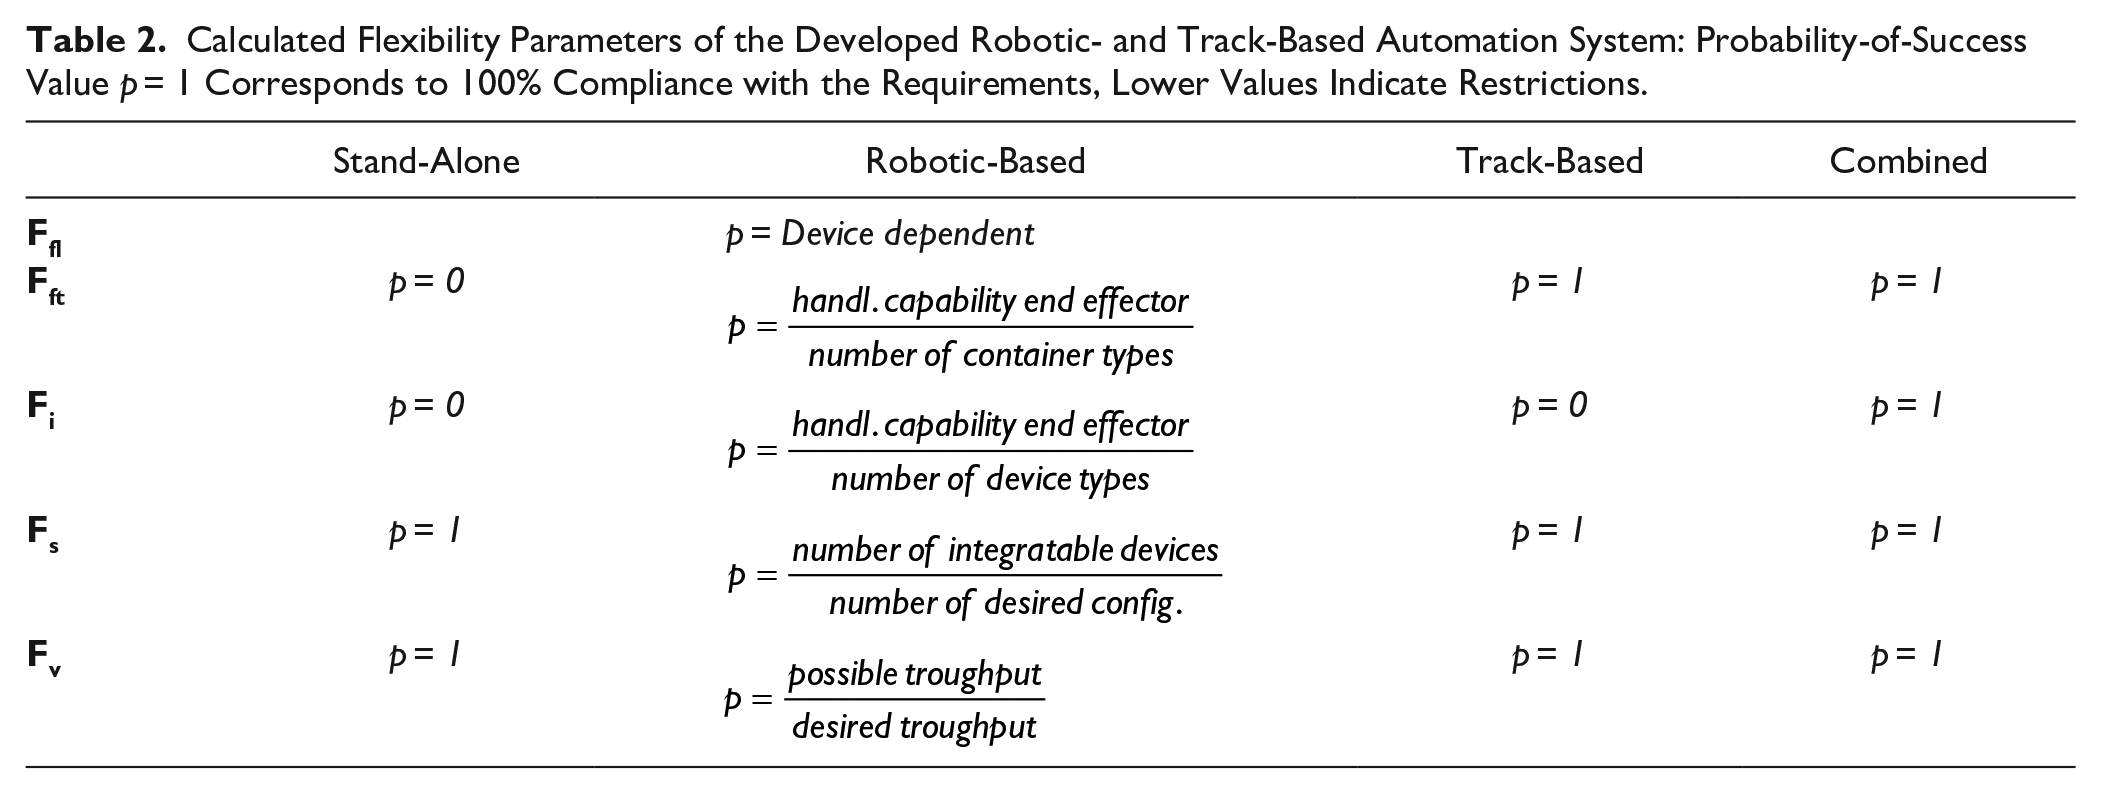
In both approaches, all devices could also be used in stand-alone configurations connected on the data and communication levels without any physical interconnection. Hence, the transport has to be carried out by a human, but naturally that results in only an assisted, rather than a fully automated, workflow. Here, we consider only the flexibility of automated processes, according to which the p-values for transport and instrument-loading flexibility (Fft, Ffi) would approach zero. In contrast, by combining the robotic- and track-based approach, maximum transport and handling flexibility can be achieved (see Table 2 ). Since the system takes care of container transport and device loading, it has no liquid-handling function by itself. Such functionalities exclusively depend on the devices in the network. For this reason, the liquid-handling flexibility Ffl will not be examined further.
Calculated Flexibility Parameters of the Developed Robotic- and Track-Based Automation System: Probability-of-Success Value p = 1 Corresponds to 100% Compliance with the Requirements, Lower Values Indicate Restrictions.
In the following, we describe the actual implementation of both approaches into physical systems with a concluding application example. In this context, we also consider the flexibility parameters already introduced.
Robotic-Based Approach
With the presentation of the PetriJet platform,20,21 we have already demonstrated the development of a robot-based platform for the automatic handling of Petri dishes. This early PetriJet version, however, allowed the integration of only one processing module at a time and had very limited space for storage available. Setting up a process with multiple steps was not possible on this platform. In addition, all culture plates had to be sealed to allow transport via a vacuum gripper. For these reasons, we have made a further development of the platform. The current PetriJet is shown in
Figure 2
(pos. 1). The platform is now primarily adapted for the automation of certain steps in drinking water analysis in accordance with DIN EN ISO 11731
18
(see the Application Example section). Nevertheless, as with the first platform version, the modular structure allows the workflow to be changed and thus adapted to different process requirements. Conceptually, the platform is capable of executing individual steps of a process chain, thus supporting manual work in critical subprocesses, up to the execution of the entire process chain without the need for user intervention. The range of functions is determined by the type and number of the integrated process modules (see
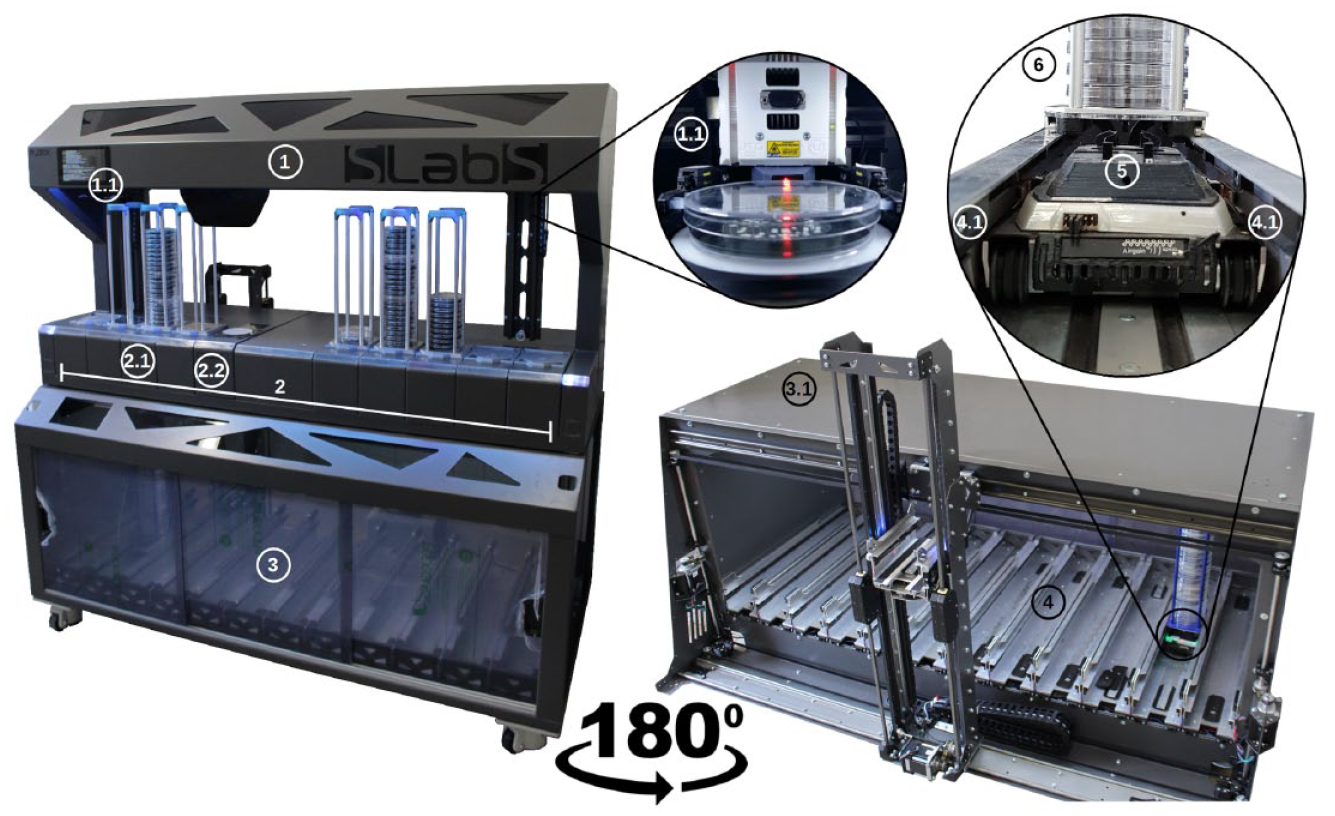
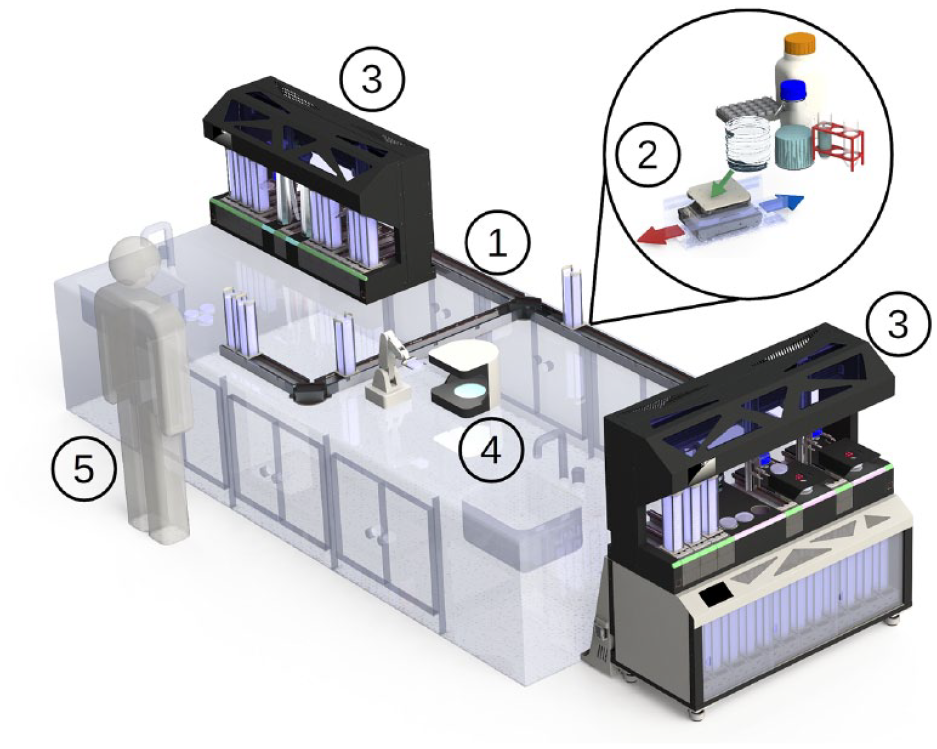
Image of the automated process line for Legionella screening, consisting of (
Within the platform, which has a footprint of approximately 1608×540 mm, the samples are transported to the desired positions. Handling and transport are carried out by two electric parallel grippers specially designed for the transport of 90 mm Petri dishes (see
The actual experimentation, manipulation, and analysis take place only at the process stations (see
A typical workflow processed on the PetriJet platform would require the user to perform the following preparatory steps:
Insert all the necessary processing stations in the platform (if used in stand-alone mode).
Create the desired workflow with all the necessary analytical steps on the graphical user interface (GUI) of the process computer.
Submit all necessary disposables, chemicals, and samples according to the process.
Start the process, and wait for the protocol.
For the implementation of the platform in a larger process line, it is possible to simply couple the platform with the track-based transport system (see the Application Example section). This enables mechanical interconnection with several other stations, devices, and storage areas. This capability also affects all flexibility parameters, as shown in Table 2 .
Track-Based Approach
To connect devices in a distributed processing workflow, we developed a physical implementation of the track-based transport approach in the form of a rail system. The transport system consists of three distinct modules: a rail system, a cargo slide, and a carrier robot (see
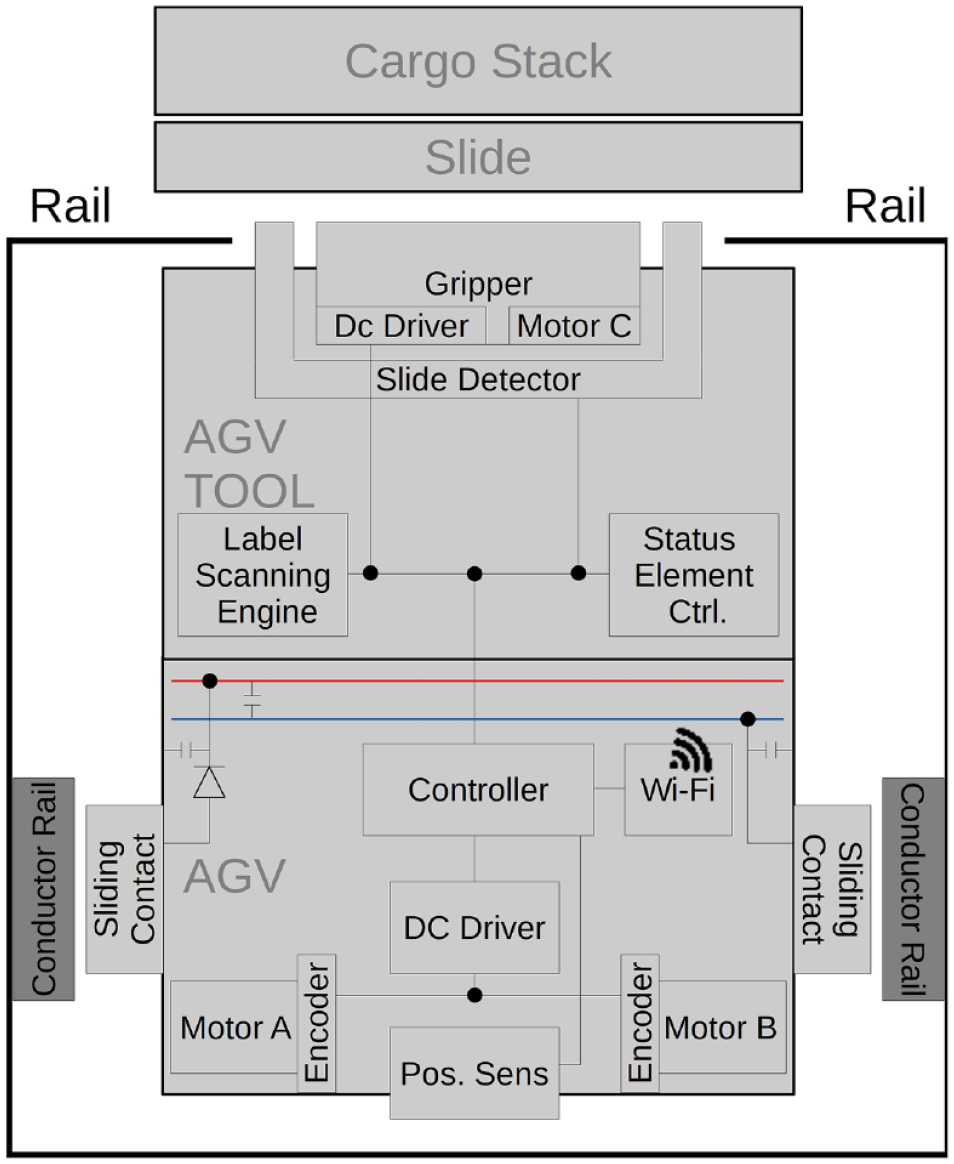
Functional block diagram of the automated guided vehicle (AGV) inside the rail system.
The rail system can be installed in various lengths or shapes, and it forms the permanently installed transport route through which the goods are transported to the desired destinations (see
Computer-aided design (CAD) concept study of the track-based transportation system to connect several distributed devices and places. (
This concept of distributed processing enables workflows on the scale of an entire room or even the entire floor of a building, as illustrated in
Figure 1
. As mentioned before, no end-effector is installed to enable the transfer of the load; therefore, a handling device must be available at each destination to transfer the load to the respective device (see
The design of the system was inspired by the AGV’s rack retrieval and shuttle systems, which are used particularly in warehouse automation. 22 Here, cargo has to be transported from storage areas such as shelves to packaging, subsequent treatment, or delivery destinations. Hence, for those tasks, such facilities share some similarities with laboratory institutions.
Management Architecture Concept
To ensure the possibility of centralized process control, data administration, and data analysis, a connection at the communication level of the devices is crucial. The capability of an easy device connection at the data transfer level can generate semiautomated or assisted workflows even without the necessity for any transportation or handling components in the entire process. Figure 5 shows a schematic illustration of the management architecture of the developed process chain system. It is structured hierarchically into the field level (FL), instrument level (IL), process level (PL), and user level (UL), each with increasing levels of abstraction. At the UL, the workflow is defined by the user via a drag-and-drop interface. Available resources can be linked together in a process flowchart. The PL schedules the generated workflow and takes care of the instrument communication and data handling. Currently, we use in-house developed software modules to display the UL and PL. Because, however, the integration of new devices into the process flow is still time-consuming and not based on existing standards, we will replace the connecting middleware with a commercially available solution. Within the framework of a joint project, we discovered the LabOperator software by Labforward 23 (Berlin, Germany) and found it was an appropriate substitute. It provides quick device integration by driver solutions for various interfaces. By using a SiLA2-compliant driver, it is also possible to integrate a nonproprietary communication standard. A graphical user interface enables a quick workflow definition.
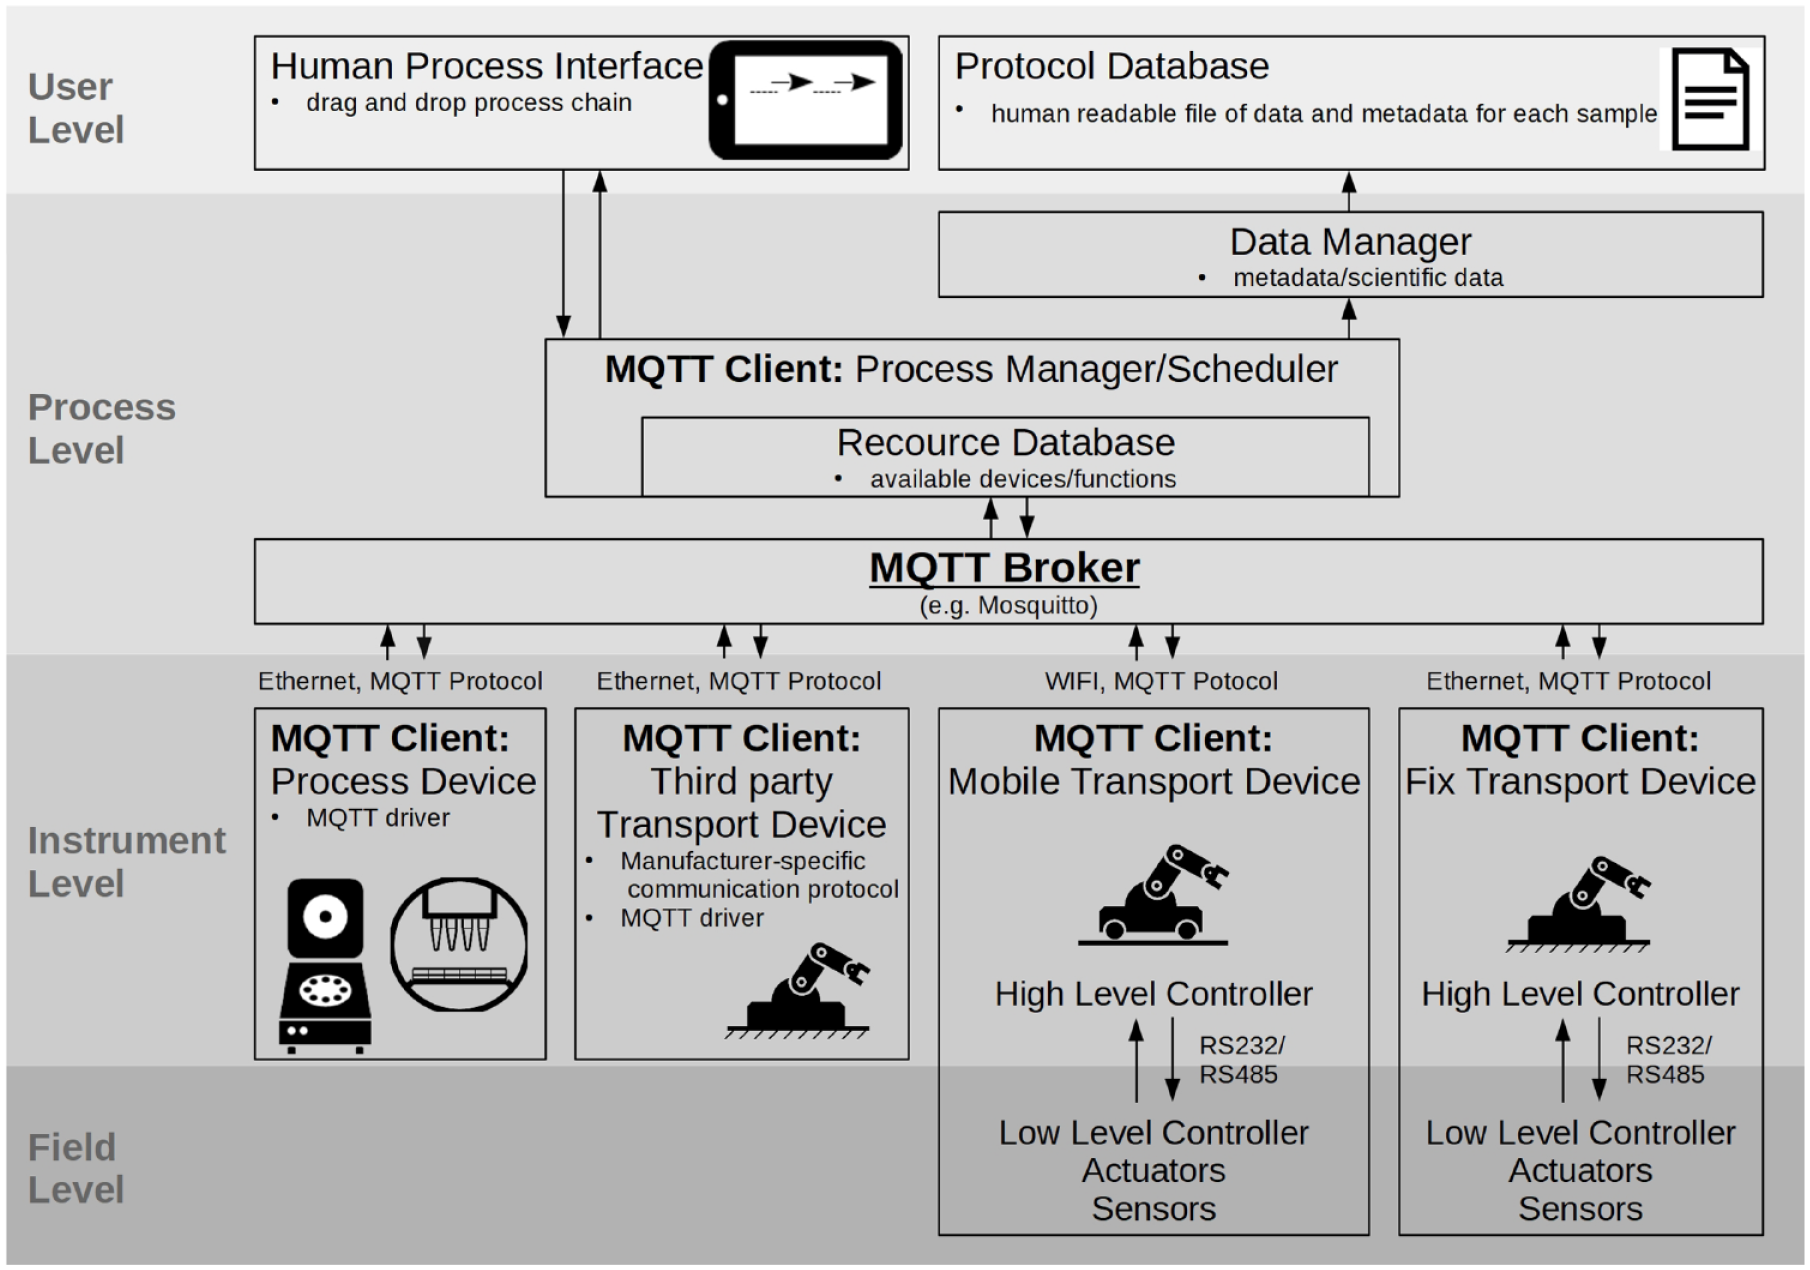
Hierarchical structure of the management architecture.
The IL consists of all available devices that fulfill the actual execution of the workflow. The field level is of interest if a device (in our case, the PetriJet platform or the AGV) is developed and built up in-house, and it is displayed only for the sake of completeness. We implemented a high-level (HL) controller (e.g., Teensy 3.2 or Raspberry Pi) in every stand-alone device that manages the communication with the superordinate control system as well as the control and processing of potential LL controllers, sensors, and actuators. The internal communication of the devices is vendor specific and does not affect the external communication. We mostly use the RS232 or (in the case of multiple bus participants) RS485 interface with a TMCL-based communication protocol.
The most critical point in the architecture is the connection between the PL and IL, because it is the interface between proprietary software. For easy implementation of new devices into the process resources, the communication interface between all devices on the IL must be standardized. We decided to use the MQTT Protocol 24 as an interface design because of its simplicity and payload flexibility. The protocol itself is based on a publish–subscribe pattern, which provides an alternative to traditional client–server architectures. The Process Manager software brick, together with all devices, serves as MQTT clients, either with direct implementation of the communication interface or via a driver solution. The communication between instances is handled by the MQTT Broker, whereby we used the Eclipse Mosquitto Server. 25 All devices subscribe to two different topics by default: a broadcast message and their identification (ID). At the start of the program, the process manager publishes an ID request via the broadcast topic. Every device replies to that call with the publishing of its unique ID and available properties. With this information, the process manager creates a topic for every ID and thus generates a communication channel for every device over which messages and data can be received from and sent to the process manager. Also, an instance is created in the process manager’s resource database that is visible and available to the user. This design works robustly for at least simple control commands. Regardless, we have not tried to send larger data packages (such as pictures) via this interface yet, although it is possible according to the literature. 26 When data or metadata are shared within a topic, they are collected and organized according to the sample ID by the data manager and stored in a protocol database.
We use this communication interface for its simplicity and are aware of existing standards. In further developments, we are going to exchange the MQTT-based communication with an interface such as the laboratory standard SiLA2 27 or the Open Platform Communications Unified Architecture (OPC UA) standard, 28 which is widely used in the industry.
Application Example
In the following, we demonstrate the described process automation through device interconnection using example applications from the field of drinking water analysis, in particular Legionella screening. These examples serve to illustrate the system design. Detailed results of the application studies will be presented in further publications.
The monitoring of Legionella cultures has to be performed, according to DIN EN ISO 11731. 18 All work steps are usually carried out manually by laboratory staff in a shift work schedule. The screening process described in the Materials and Methods section illustrates the high number of optical analysis and sample transport steps during the investigation period. These are, in accordance with a workflow analysis in a medium-sized routine laboratory, the most time-consuming steps. Therefore, the automated process line at the current stage of development is equipped to perform these optical analyses in the Legionella screening workflow.
Figure 2 shows the entire construction with the robotic PetriJet platform (pos. 1) on top of a storage unit (pos. 3). This storage area disposes of the previously described track-based transportation rails (pos. 4). In this particular setup, the rails have two functions: to enable the transport of Petri dish magazines (pos. 6) and to store the magazines in the manner of flow rack storage. The storage space can hold up to 50 magazines, with a maximum of 20 plates per stack (∑1000 plates). For the presentation of the optical analysis in Legionella screening, we have equipped the PetriJet platform with only one camera (pos. 2.2) as a processing station.
The process described below is shown in the flowchart in
Figure 6
. To run the analysis, the user loads the storage area (
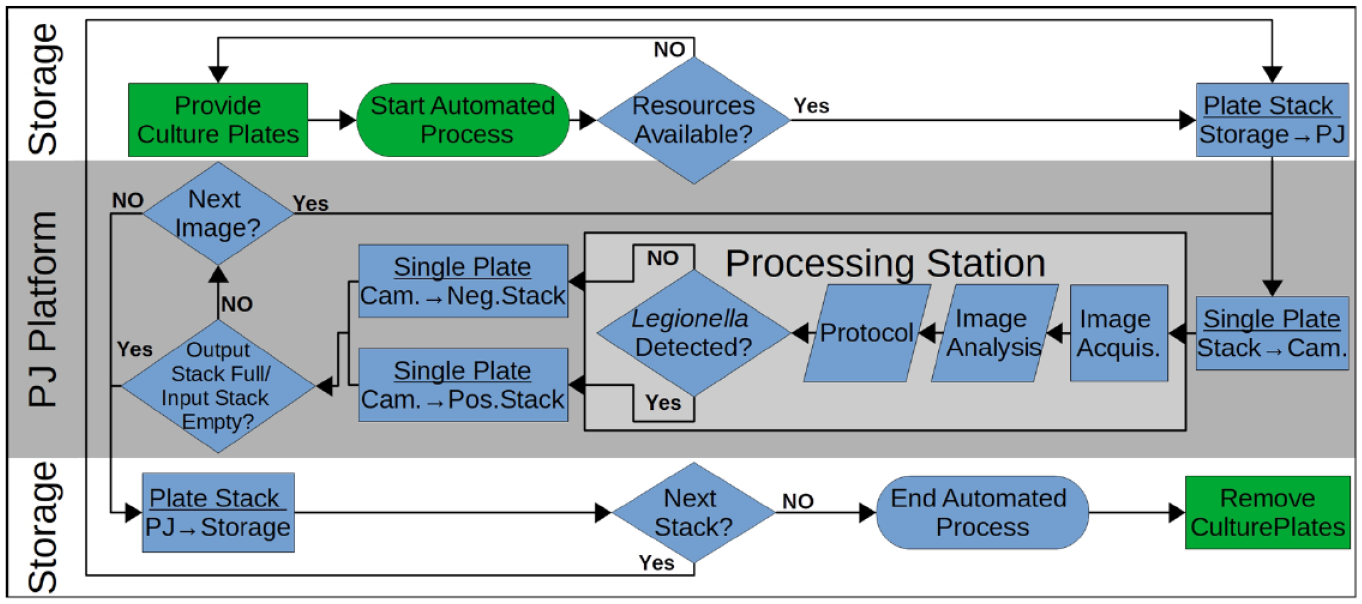
Process flowchart optical analysis for Legionella spp. Blue boxes: Automatic process steps; green boxes: manual process steps; light gray box: sample processing module (possibly extendible by other processing modules). Arrows in blue boxes represent transport steps. Illustrated case represents the automatic image analysis process: The user inserts stacked culture plates in the storage area; after process start, availability of all resources is checked by the system; transport of the culture plate stack from the storage area to the PetriJet platform via a rail system; transport of single plates from stack to camera via grippers; image acquisition; colony count; protocol setting with colony count and metadata; transport of a plate via gripper into a positive stack (Legionella detected) or negative stack (plate without Legionella); transport of a stack via a rail system into a storage space; and take a new stack and repeat the process, if required.
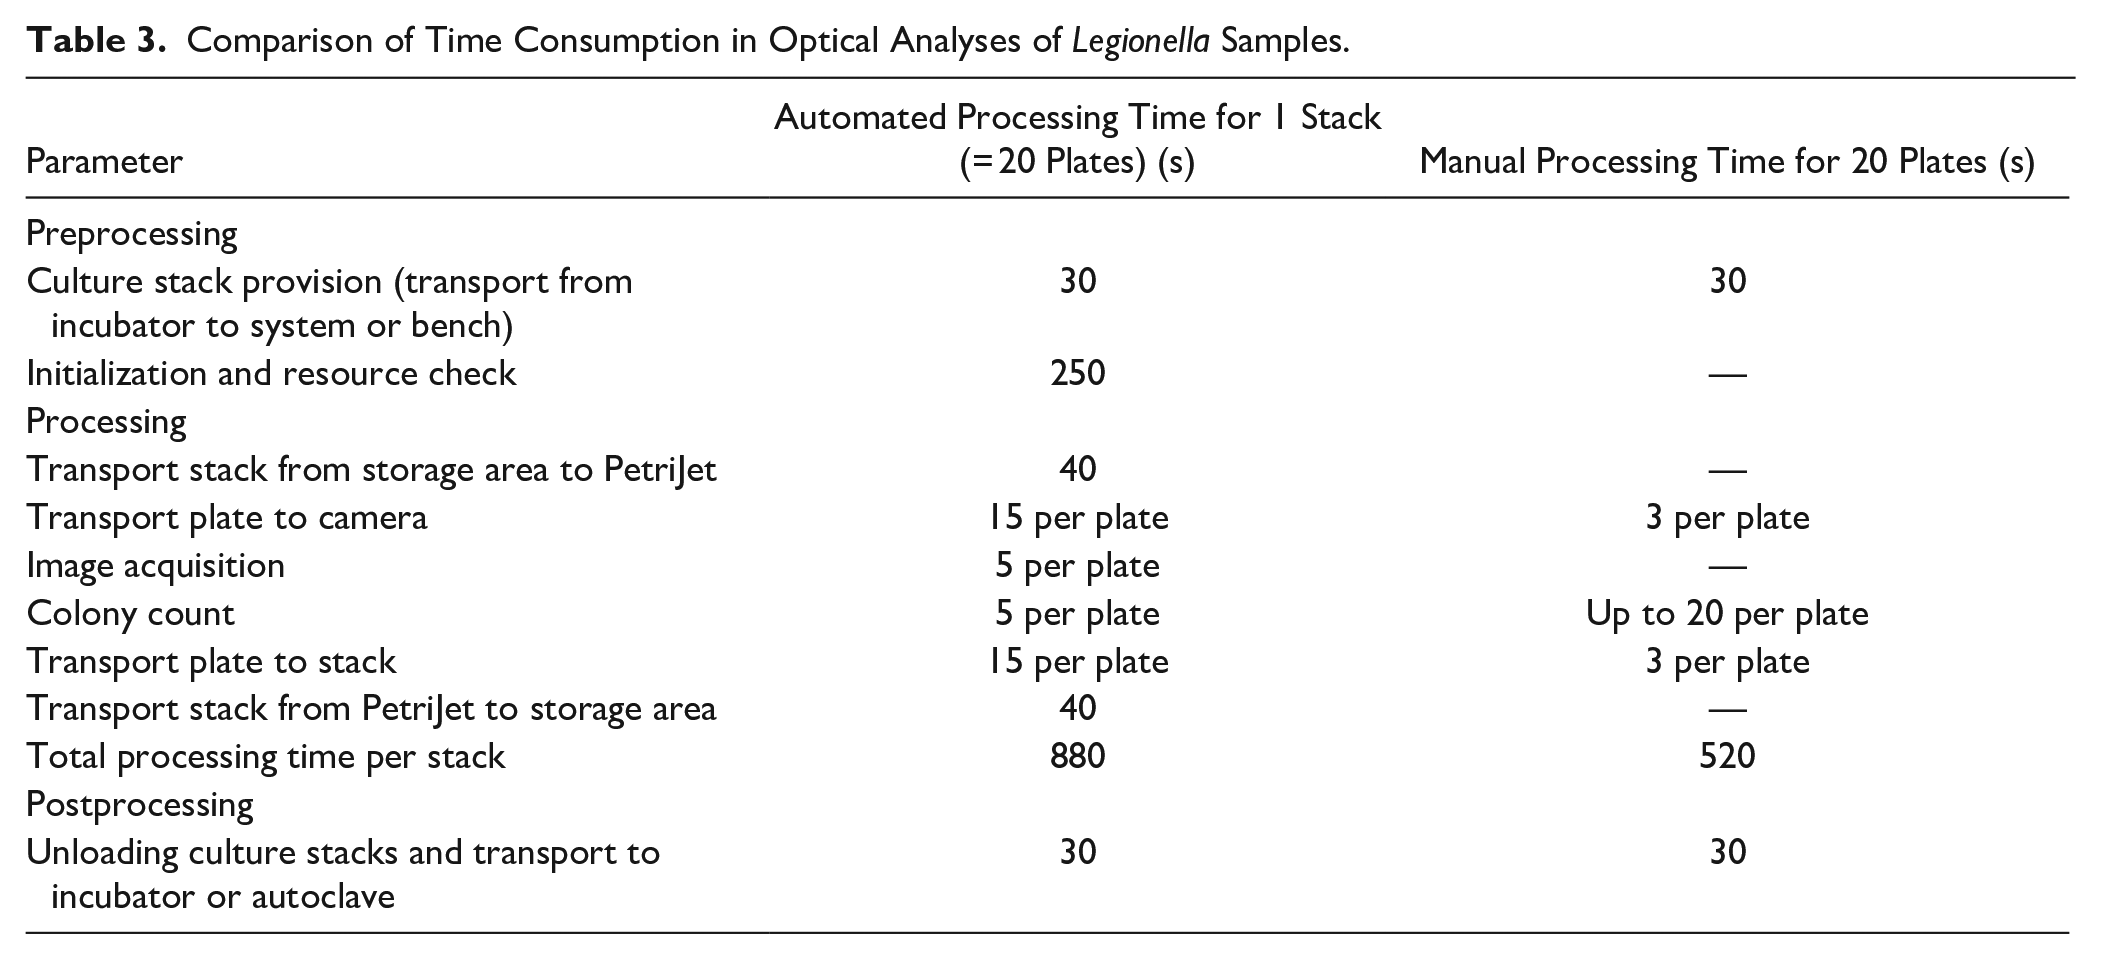
The results shown in Table 3 illustrate a still-existing advantage in total processing time when the analysis is performed manually compared to the automated setup. The focus of this automation concept was never on increasing the processing speed, however, but on autonomous process control and thus decoupling the analytical process flow from the schedule of the human operator. Hence, by extending the functionality of the process line with additional devices, such as an incubator or a gadget for culture streak, the system can provide considerable walkaway time while running the process in its optimal parameters.
Comparison of Time Consumption in Optical Analyses of Legionella Samples.
There were no problems with contamination or nonsterility during the entire test procedure, because the device never came into contact with the actual sample during the automated optical analysis. Furthermore, even culture streaks and sample concentrations in analytical laboratories for drinking and process water are usually carried out under nonsterile conditions anyway.
Another analysis that the platform can theoretically perform under the current setup without hardware changes is screening for HPC, which is the total number of growing microorganisms. The protocol is defined in DIN EN ISO 6222. 29 The workflow is quite similar to the Legionella testing, but here the sample and the nutrient media are mixed as a pour plate, and the media have no selective effect. Since all (under the given circumstances) cultivable microorganisms are growing during the incubation period, the image analysis of the plate pattern becomes more complex and error prone due to the differences in color, shape, size, and structure. Since image analysis has already caused problems with Legionella screening, no HPC process has run on the platform yet.
Conclusion
Processes in the field of microbial testing of drinking and process water are still hardly automated and depend heavily on manually performed operations, although the small fluctuations and high sample numbers suggest a true need for automation. Due to structures and workflows that have been established throughout decades and the lack of trained personnel in the particular companies, a radical change to a higher degree of automation in the manner of a TLA is not going to happen soon. A more promising approach is a gradual one, in which automation starts with small and easy-to-handle process steps to slowly adapt to the changes in an automated environment. For a later extension of the process in terms of functionality, speed, or capacity, the system must be flexibly adaptable.
Here, we presented a system for the generation of such flexible process lines by connecting several devices that are either located close to each other or distributed over the entire laboratory space. With this approach, we built a robotic platform as well as a track-based transportation system to partially automate the Legionella screening process in drinking water analysis. This system provides the opportunity to enlarge the automated process line step by step by including new devices at different spatial positions. Critical subprocesses can thus be parallelized to avoid bottlenecks and downtimes. A further expansion of the track system turns out to be fairly easy and cheap, since the rails are simple to construct and made of standard components.
Initial test runs with an automated process line for the optical analysis of Legionella samples showed that manual handling is still significantly faster than the automated system. Increasing the processing speed is not the purpose of the system, but the autonomous execution of a process and the logging of the results. The system is still in the conceptual stage, however, and requires a certain redesign in hardware and software to be robustly deployed outside of an academic environment. This mainly concerns the still-existing unreliable results in the colony count. After the current colony detection problems are solved, a manuscript with more comprehensive data and results will be published. Another important step will be the restructuring of the high-level communication interfaces to an already used standard such as SiLA2, which simplifies the installation of the system in an already existing infrastructure or the fast insertion of new devices into the process line.
In the longer term, we are going to further use the transportation system to create autonomously working process lines for microbial testing of drinking water, especially to expand the functions of the Legionella screening workflow by integrating new devices for culture streak or incubation. By increasing the level of automation, it will then be possible to carry out the entire screening process largely without human support.
Footnotes
Abbreviations
AGV, Automated guided vehicle; CFU, colony-forming unit; cr, common range; dp, design parameter; Ff, functional flexibility; Fi, instrument feeding flexibility; Fl, liquid-handling flexibility; FL, field level; fr, functional requirement; Fs, structural flexibility; Ft, transport flexibility; Ftotal, total flexibility; Fv, throughput flexibility; GUI, graphical user interface; HI, human interface; HL, high level; HPC, heterotrophic plate count; IL, instrument level; LL, low level; MQTT, Message Queuing Telemetry Transport; OPC UA, Open Platform Communications Unified Architecture; p, probability-of-success function; PL, process level; SiLA, Standardization in Laboratory Automation; sr, system range; TLA, total lab automation; UL, user level
Declaration of Conflicting Interests
The authors declared no potential conflicts of interest with respect to the research, authorship, and/or publication of this article.
Funding
The authors disclosed receipt of the following financial support for the research, authorship, and/or publication of this article: The authors are grateful for the financial support of this work by The Free State of Saxony, State Ministry of Science and the Arts, grant number 100321036.