
Abstract
For the purposes of high-throughput immunoassay screening, PerkinElmer’s AlphaLISA technology offers many benefits over traditional enzyme-linked immunosorbant assay (ELISA). However, its 680 nm excitation wavelength coincides with a wavelength of peak photosynthetic pigment absorbance, hindering the technology’s utility within the plant biotechnology industry. In assays containing photosynthetic matrices, it is proposed that excitation of chlorophyll leads to the production of singlet oxygen, which initiates a pigment-associated background signal, reducing assay sensitivity. A customized donor bead, modified for excitation outside the range of photosystem absorbance, was tested for its capacity to improve assay sensitivity with extracts containing photosynthetic pigments. In three assays designed against crystalline domain insecticidal protein targets, use of the customized donor bead along with its altered excitation wavelength led to the elimination of pigment-associated signal and improved separation between target-positive and null samples. Reduction in null photosynthetic extract signal led to a 16× sensitivity improvement in a quantitative assay. The customized donor bead was also found to be photostable under ambient laboratory lighting, potentially improving the overall utility of AlphaLISA technology. The customized donor bead enables sensitive, high-throughput immunoassay screening of photosynthetic tissues within the plant biotechnology industry using a convenient, photostable protocol.
Introduction
Agricultural High-Throughput Sample Screening
Plant biotechnology has led to significant improvements in crop productivity worldwide. Development of improved and novel crop varieties requires careful selection and combination of introduced or native traits, a task that is often monitored and optimized through the detection of key proteins or peptides. Enzyme-linked immunosorbant assay (ELISA) is an industry standard for high-throughput protein screening due to its simple protocol and low material cost per data point. 1 However, ELISA is known for its high-labor protocol, requiring multiple wash steps to remove unbound material. This requirement significantly hinders its integration into automated settings. AlphaLISA and AlphaScreen (Alpha) technology (PerkinElmer, Waltham, MA) is an alternative high-throughput protein screening platform that offers benefits over traditional ELISA, 2 including a wide dynamic range and advertised sensitivity down to femtogram levels of the protein target. It offers a homogenous protocol without wash or separation steps, which is easily automated for increased throughput. Compared with ELISA, the platform offers quality data at a competitive cost along with significant reductions in labor. A significant limitation of Alpha chemistry is its sensitivity to ambient light, a characteristic that is often mitigated through filtration or dimming of lab lighting.
In a typical sandwich Alpha assay, solubilized acceptor and donor beads are bound to a target protein via ligand–antigen interaction. During detection, photoexcitation leads to singlet oxygen generation by the donor bead. When ligand-guided binding to the protein target holds acceptor and donor beads in close proximity, donor-generated singlet oxygen initiates a cascade of reactions within proximal acceptor beads, leading to a detectable chemiluminescent signal. 3 Although Alpha assays have been successfully deployed in many applications, including animal health, 4 drug discovery, 5 and therapeutic research,6,7 the screening technology is notably absent within plant biotechnology applications. This absence may be related to the chemistry’s inherent vulnerability to a pigment-associated background signal, which negatively impacts assay results.
Mechanism of AlphaLISA Plant Pigment-Associated Signal
For plant applications, test samples destined for protein screening assays are often sourced from photosynthetic tissues because they are readily available and easily collected. Pigments found within photosynthetic tissues, including chlorophyll, xanthophylls, and carotenoids, absorb light of various wavelengths. Though chlorophyll absorbs at a range of wavelengths within the visible spectrum, it has a notable absorbance peak at 680 nm, coinciding with the excitation wavelength of the traditional donor bead.
When plant extract containing photosynthetic pigments is used in a traditional Alpha assay, 680 nm excitation leads to chlorophyll excitation. Inefficient diffusion of excitation energy can lead to the production of triplet chlorophyll, a photosensitizer that can react with ambient triplet oxygen to produce singlet oxygen. 8 Based on this information, we propose that this initiates signal from acceptor beads, which is independent of the ligand–antigen reaction and the donor beads, increasing the assay’s baseline signal. In addition, variability in chlorophyll content from sample to sample adds variability to the assay’s baseline signal. Taken together, these effects lead to reduced assay sensitivity.
Strategies for the Elimination of AlphaLISA Plant Pigment-Associated Signal
Once extracted, photosynthetic machinery and pigments cannot be effectively removed from solution, inactivated, or quenched. The best method for elimination of plant pigment-associated signal is to modify the donor bead’s chemistry to vacate the photosynthetically active 680 nm excitation wavelength. Our mitigation strategy was to replace the chemistry’s traditional donor bead with a custom donor bead, which excites at a wavelength outside the range of photosystem absorbance. Within the vendor-customized product, active component phthalocyanine was replaced with naphthalocyanine to accomplish a shift in excitation wavelength from 680 nm to the photosynthetically inactive 775 nm. Comparison of the two donor bead species has revealed that the photostable custom product can deliver improved quality and sensitivity when used in assays containing photosynthetic pigments.
Materials and Methods
Tissue Sample Preparation
Sample Collection
Corn and soybean leaf tissue was collected by excision of 5 mm leaf disks, ranging in growth stage from V3 to R1. Two to four leaf disks (5–10 mg weight) were sampled in 1.2 mL titer tubes (84501XNBZQ, Quality Scientific Plastics, San Diego, CA). For corn root tissue collection, approximately 5 cm (200–400 mg) of tissue was collected from the tip of nodal roots. Root tissue was rinsed with water and placed in a 4 mL polycarbonate vial (04-240-05, OPS Diagnostics, Lebanon, NJ) for storage. All samples were stored at −80 °C until extraction.
Sample Extraction and Total Protein Quantification
Sample extraction was performed by mechanical maceration in extraction buffer. A 1× reconstitution of chloride-phosphate mixture (PW0002-30, EMD Millipore, Billerica, MA) was prepared with the addition of 0.05% Tween-20 detergent (P9416, Sigma-Aldrich, St. Louis, MO) for all leaf extractions, or without Tween-20 for root extractions. Unless otherwise noted, all leaf extractions were performed by adding two 3/16-inch ball bearings and 500 µL of extraction buffer to titer tubes containing four thawed leaf disks before grinding in a Geno/Grinder 2010 (SPEX SamplePrep, Metuchen, NJ) for 1 min at 1650 strokes/min. Ground samples were centrifuged at 4000 rcf for 10 min at 4 °C to pellet debris before collecting clarified extract. For root extraction, a 3/8-inch ball bearing and 750 µL of extraction buffer were added to a thawed sample storage vial before processing as described above. As necessary, total protein quantification was completed using a referenced method. 9
Assay Development
Assays were prepared for three crystalline domain insecticidal proteins, including CRY34, CRY1A.88, and CRY2A.127 proteins, using custom monoclonal IgG antibodies. All assays were developed in sandwich format using biotinylated antianalyte, PerkinElmer AlphaLISA acceptor beads (6772002), and AlphaScreen 680 nm (6760002) or 775 nm (6760011) streptavidin donor beads. Procedures adapted from PerkinElmer’s assay development guide 10 were used for antibody pair selection, acceptor bead conjugation, and selection of assay condition optima. Antibody biotinylation was performed by Rockland Immunochemicals Inc. (Limerick, PA) or using NHS-PEG4-Biotin (21329, Thermo Fisher Scientific, Waltham, MA) per reagent protocol guidelines.
Assay Preparation
Reagent Dilution
All reagents were diluted immediately prior to use with a 1× dilution of AlphaLISA assay buffer stock (AL000F, PerkinElmer) as diluent. Biotinylated antibody was diluted to achieve a previously determined optimal concentration, which ranged from 0.63 to 5.2 µg/mL in solution. Preconjugated acceptor bead was added to the biotinylated solution at 50 µg/mL. The 680 and 775 nm streptavidin-coated donor beads were diluted under green-filtered fluorescent lab lighting (R389, Rosco Laboratories Inc., Stamford, CT) to achieve concentrations of 80 µg/mL.
AlphaLISA Reaction Protocol
Experimentation suggests that AlphaLISA reactions are scalable and easily miniaturized. Final reaction volumes for this work ranged from 12 to 20 µL. For reaction setup, one volume of protein extract was added to a white 384-well ProxiPlate (6008280, PerkinElmer) using an appropriately configured liquid handler. One volume of a solution containing optimally titered biotinylated antibody and preconjugated acceptor bead was added to the wells of the plate using a Multidrop Combi reagent dispenser outfitted with a low-volume cassette (5840300, 24073295, Thermo Fisher Scientific). Reaction plates were allowed to incubate for 50–60 min at room temperature before adding two volumes of appropriately titered donor bead solution using similar addition methods. For all reagent additions, mixing of well contents was facilitated by the force of reagent addition or mechanical methods as necessary. Following donor bead addition, reaction plates were allowed to incubate for 60–75 min before reading in an appropriately configured detector. A BMG PHERAstar FS outfitted with an AlphaScreen filterset (BMG Labtech, Ortenberg, Germany) was used for the detection of all reactions containing the 680 nm donor bead. A modified PerkinElmer EnSpire multimode plate reader was used for the detection of all reactions containing the 775 nm donor bead.
Quantification of Pigment-Associated Signal
Testing for Pigment-Associated Singlet Oxygen Production
A null sample of leaf and root tissues was extracted. Leaf extract was diluted 1:2 (1 part in 2 total parts) in extraction buffer prior to testing. Four microliters of root extract, leaf extract, or extraction buffer was loaded into 384-well reaction plates followed by 4 µL of prediluted acceptor beads and 8 µL of AlphaLISA assay buffer. Buffer-only wells were prepared, containing 16 µL of AlphaLISA assay buffer. Reaction plates were covered with an opaque foil seal and incubated for 2 h at room temperature before reading in appropriate detectors.
Survey of Signal from Positive, Null, and Buffer Analytes
Known positive and null leaf extracts were prepared. Using both donor bead species and each of the three protein target assays described in the “Assay Preparation” section, we prepared assays using positive and null extracts and extraction buffer as analyte. The signal-to-noise ratio (S/N) was determined by calculating the ratio of average positive signal versus average null signal. The null-to-buffer ratio (N/B) was assessed by calculating the ratio of average null versus average buffer signal.
Survey of Pigment-Associated Signal
A set of 15 null corn leaf samples and 1 null soybean leaf sample was extracted in sextuplicate. Within each replicate set, three samples were extracted using the standard extraction protocol, while three were extracted in a protocol modified to induce low photosynthetic matrix content (low matrix). For low-matrix extraction, the leaf disk number was reduced from 4 to 2 per extraction, while buffer volume was increased from 500 to 700 µL. Sample extracts were analyzed for their absorbance at 680 nm and their contribution to Alpha assay signal. For absorbance measurement, 135 µL of sample extract was loaded into the wells of a flat-bottomed 96-well polystyrene microplate (9205, Thermo Scientific, Rochester, NY). Extract absorbance was measured at 680 nm using a Spectramax Plus 384 absorbance plate reader (Molecular Devices, Sunnyvale, CA). For Alpha assay signal measurement, sample extracts were analyzed using the CRY2A.127 assay as outlined in the “Assay Preparation” section. A standard curve was prepared using purified target protein and plated in assay wells alongside sample replicates. Standard curve target concentrations ranged from 2.0 to 125 pg/µL. From curves with R2 values of 0.98 or higher, coefficients derived from quadratic fit were used to quantitate signal from sample wells. In addition to pigment-associated signal quantification, signal from null sample wells was compared with signal from wells containing positive sample and assay buffer using 680 and 775 nm donor beads in assays for all 3 target proteins.
Testing for Assay Sensitivity Improvements
Sample Preparation
Known positive and null samples were extracted. To simulate the target protein’s known range of expression in biological samples, positive sample extract was diluted into null sample extract at dilution factors of 5, 20, and 80. Those extract dilution series were then diluted serially in extraction buffer to achieve dilution factors of 2, 4, 8, 16, 32, and 64.
Standard Curve Preparation
A standard curve was prepared by serial dilution of purified target protein in a 1:8 mixture of Stabilzyme Select (SZ03, Surmodics Inc., Eden Prairie, MN) in extraction buffer. Standard curve target concentrations ranged from 0.4 to 6 pg/µL.
Assay Preparation, Analysis, and Scoring
All samples and curve levels were independently assayed using 680 and 775 nm donor beads in the CRY34 assay. Assay wells were prepared in quadruplicate for each sample and standard curve level. From curves with R2 values of 0.98 or higher, coefficients derived from quadratic fit were used to quantitate signal from sample wells. For all samples, final results were adjusted for the extraction buffer dilution factor. Samples were aligned for comparison based on dilution factor in both null extract and extraction buffer. The minimum acceptable dilution factor was selected based on its ability to (1) produce null interpolations that were below the lower limit of quantification (LLOQ) and (2) produce positive interpolations that were consistent with neighboring dilutions. Assay sensitivity in parts per million (ppm) target protein was calculated as standard curve LLOQ (in pg/µL) divided by total protein (in µg/µL) multiplied by minimum sample dilution factor.
Testing for Donor Bead Photostability in Ambient Light
Diluted 680 and 775 nm donor bead solutions and prepared assay wells were tested for photostability. A CRY34-positive leaf sample was extracted. Extract was diluted to achieve in-range target protein content using extraction buffer as diluent. Diluted extract, biotinylated antianalyte, and preconjugated acceptor beads were added to all wells of two 384-well plates as outlined in the “Assay Preparation” section. Solutions of 680 and 775 nm donor beads were prepared and separated into two equivalent aliquots for light-exposed and light-protected treatments. Light-exposed aliquots were placed under fluorescent laboratory lighting (1250–1400 lux) for 20 min. Light-protected aliquots remained under light filters. Light-exposed and light-protected 680 and 775 nm donor bead aliquots were each dispensed to 192 replicate wells. Half of the replicate wells were covered with opaque foil seal, while half were covered with an optically clear seal. Plates were incubated at room temperature for 1 h under laboratory lighting. After incubation, plate seals were removed from wells before reading plates using appropriate detectors.
Results and Discussion
Pigment-Associated Singlet Oxygen Production
Incomplete reactions, containing only acceptor beads and null analyte, were prepared to demonstrate the capacity of photosynthetic plant pigments to generate singlet oxygen upon excitation of the reaction well ( Fig. 1 ). Because donor beads were absent from incomplete reactions, analyte served as the only source of singlet oxygen to initiate acceptor chemiluminescence. Pigment autofluorescence can be ruled out as a source of signal elevation because the 615 nm Alpha integration wavelength is shorter than the 680 and 775 nm excitation wavelengths. In wells that were excited at the photosynthetically active wavelength of 680 nm, the null leaf extract (leaf + acceptor) showed potential to produce significantly elevated signal when compared with nonphotosynthetic analytes, including root extract (root + acceptor) and buffer (buffer + acceptor), and wells containing buffer alone (buffer only). In contrast, when the photosynthetically inactive wavelength of 775 nm was used for excitation, all analytes produced signal that was similar to buffer alone.
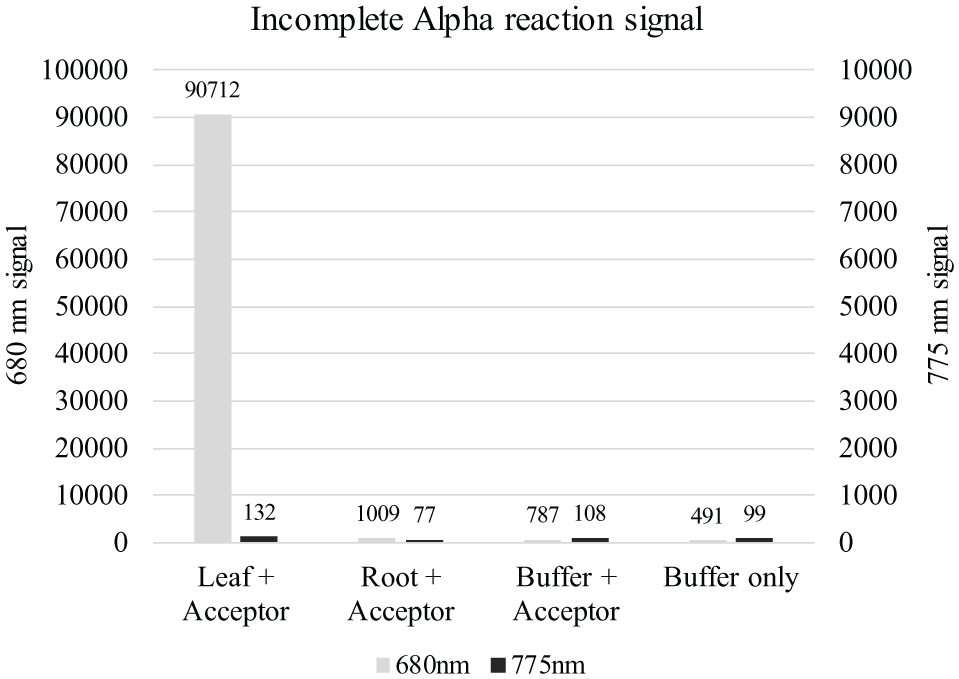
Signal obtained from incomplete Alpha reactions using 680 and 775 nm excitation wavelengths.
Chlorophyll is present in leaf tissue but absent in root tissue, and demonstrates a pronounced absorbance peak at 680 nm with very low absorbance at wavelengths above 700 nm.11,12 When wells containing photosynthetic extract are illuminated by 680 nm light during detection, chlorophyll is excited, leading to formation of triplet chlorophyll, which reacts with ambient oxygen to form singlet oxygen. 8 Because chlorophyll is ubiquitous within the reaction well, singlet oxygen formed during excitation could lead to detectable signal from proximal acceptor beads. Vacating the photosynthetically active wavelength of 680 nm in favor of 775 nm eliminates pigment-associated singlet oxygen production because chlorophyll does not effectively absorb 775 nm light.
Pigment-Associated Signal in Complete Alpha Reactions
To demonstrate the capacity of pigment-associated singlet oxygen production to elevate the assay’s baseline signal, signal obtained from buffer and photosynthetic positive and null analyte was surveyed across all three target protein assays using both donor bead species ( Table 1 ). Signal varied greatly across platforms. However, this should be expected because separate detectors were used, each with a differently tuned photomultiplier. In assays containing 680 nm donor bead, N/B ratios ranged from 5.2 to 11, indicating consistent elevation of null signal above the buffer. In contrast, assays containing 775 nm donor bead produced N/B values ranging from 0.8 to 1.4. Preferential reduction of null signal led to desirable improvements in S/N values compared with the 680 nm donor assay.
Average of Replicate Signal Obtained from Two Positive, One Null, and One Buffer Analyte in Three Target Protein Assays Using 680 and 775 nm Donor Beads.
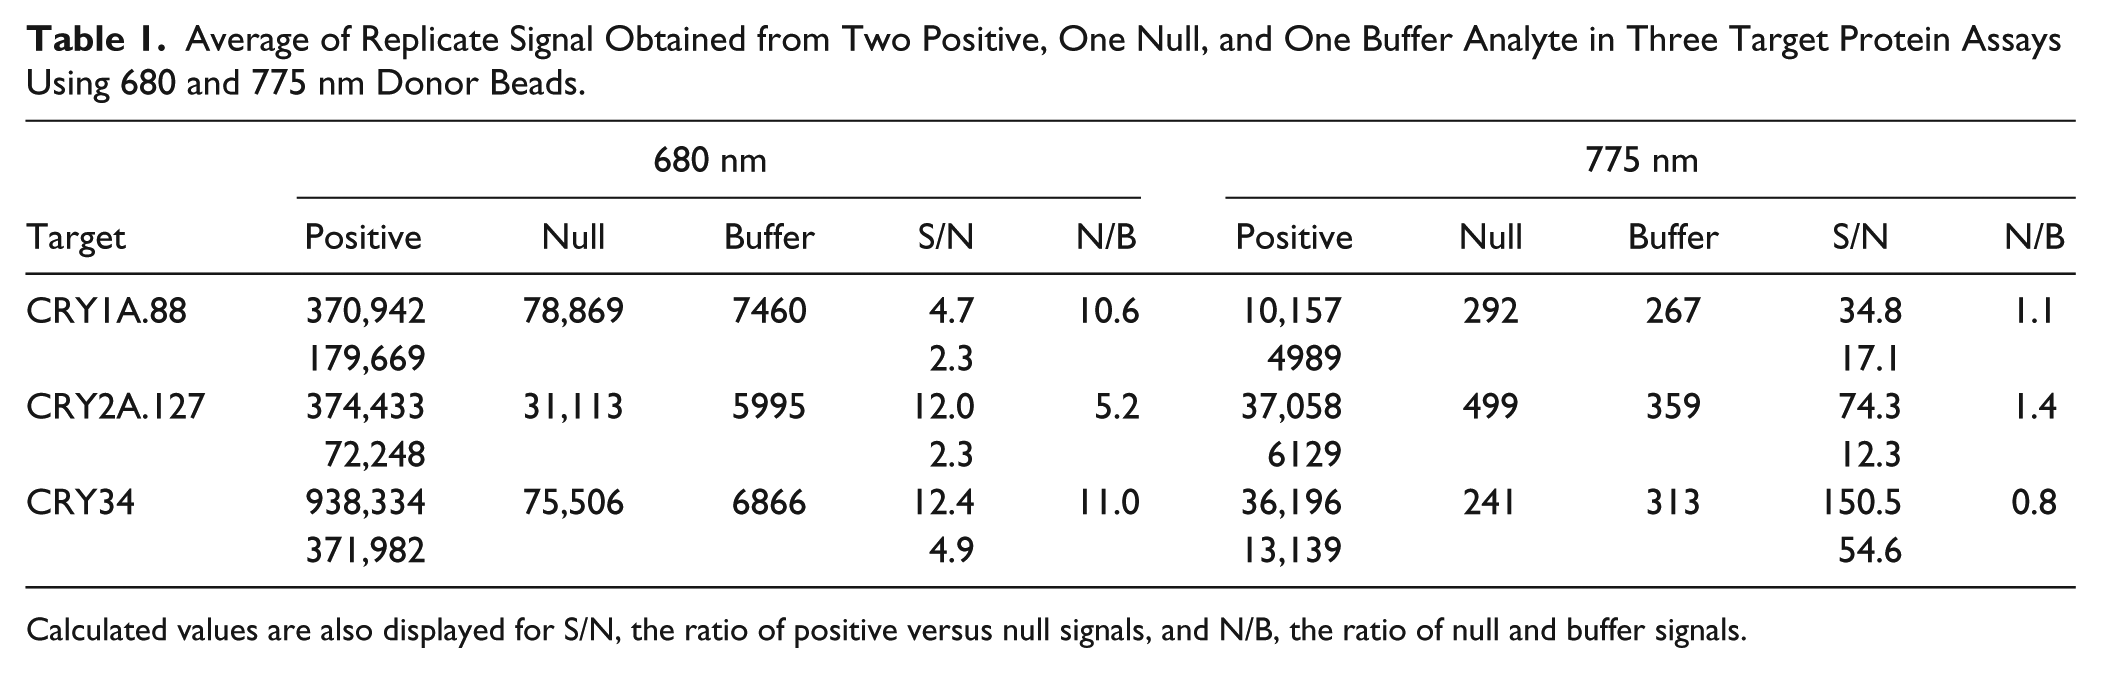
Calculated values are also displayed for S/N, the ratio of positive versus null signals, and N/B, the ratio of null and buffer signals.
To demonstrate the capacity of elevated baseline signal to produce false-positive results, 96 null photosynthetic tissue extracts were assayed in a complete Alpha reaction alongside a purified standard curve for quantification. Each extract’s chlorophyll content was correlated with its Alpha assay signal to demonstrate how pigment-associated signal can be influenced by variable photosynthetic matrix content across a sample set.
Variability in Photosynthetic Matrix
Extracted and diluted replicates of the 96 null leaf samples produced total protein scores ranging from 0.092 to 0.70 µg/µL, averaging 0.33 µg/µL with a coefficient of variance (CV) of 44.6%. Within extraction triplicates, total protein variability as measured by CV exceeded 25%. This variability is considered to be representative of sample sets used for high-throughput protein screening. Variability in extraction efficiency led to variable 680 nm absorbance values (A680), which ranged from 0.064 to 0.47 optical density (OD), averaging 0.18 OD with a CV of 45.7%. Within extraction triplicates, A680 variability exceeded 20% for many source tissues. Across all samples processed, the total protein score showed positive correlation with photosystem pigment absorbance, suggesting that extract chlorophyll content is directly proportional to sample extraction efficiency ( Fig. 2 ).
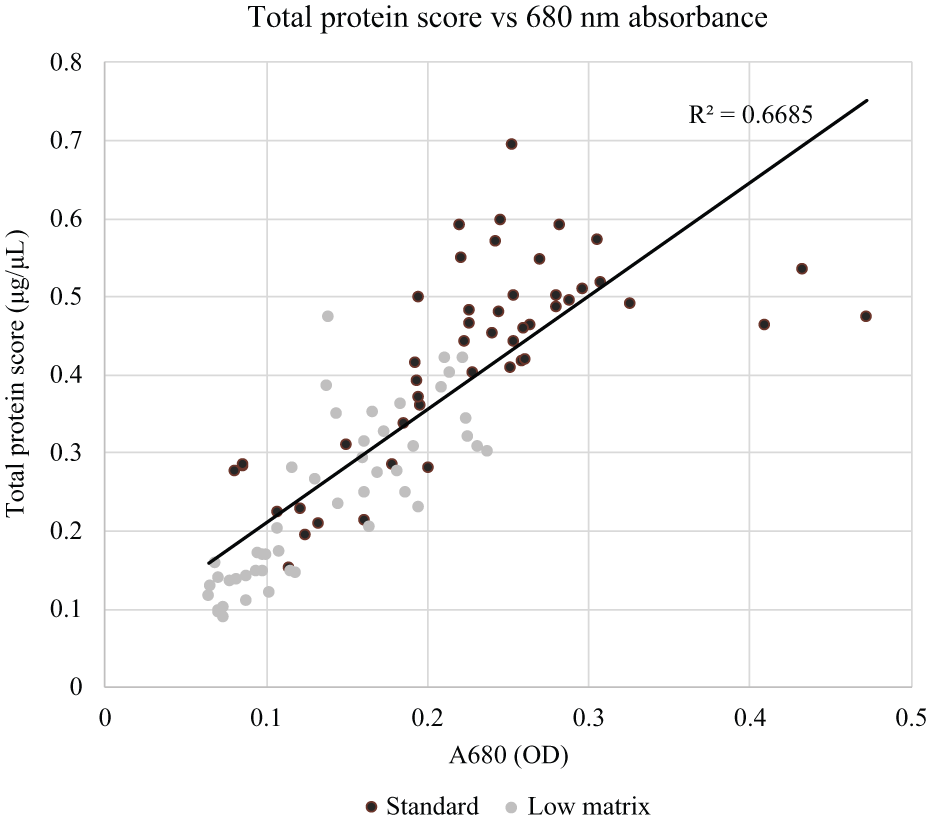
Correlation of total protein score with chlorophyll content, as measured by absorbance at 680 nm. The data series marked “Standard” was extracted using the standard protocol and diluted 1:2 in extraction buffer prior to processing. The data series marked “Low matrix” was extracted using a protocol modified to induce low photosynthetic matrix content. The “Low matrix” samples were not diluted prior to processing.
Correlation of Chlorophyll Content with Pigment-Associated Signal
With the 680 nm donor bead, the group of null leaf extracts produced signal ranging from 7400 to 48,000 counts, averaging 25,000 counts. The samples interpolated between 0.73 and 2.9 pg/µL on the CRY2A.127 assay curve, averaging 1.7 pg/µL with a CV of 31%. Null sample interpolation showed positive correlation with chlorophyll content, as measured by A680 ( Fig. 3 ). The interpolation of many known negative samples fell well above this assay’s desired 2.0 pg/µL LLOQ; thus, after scoring with a curve desired 2.0 pg/µL sensitivity, many null samples would produce false-positive interpolations.
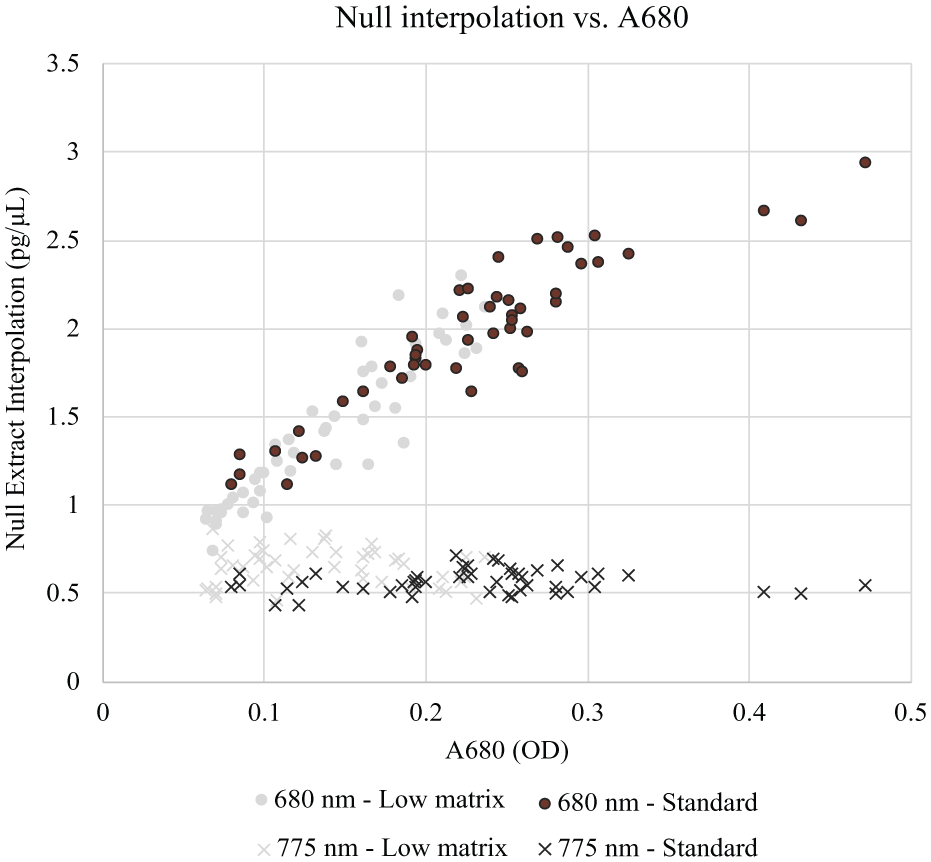
Correlation of null sample interpolation with chlorophyll content, as measured by absorbance at 680 nm. The data series marked “Standard” was extracted using the standard protocol and diluted 1:2 in extraction buffer prior to processing. The data series marked “Low matrix” was extracted using a protocol modified to induce low photosynthetic matrix content. The “Low matrix” samples were not diluted prior to processing.
When the 775 nm donor bead and modified EnSpire detector were used, the same null samples produced signal ranging from 72 to 290 counts, averaging 140 counts. Assay interpolations ranged from 0.43 to 0.85 pg/µL on the CRY2A.127 assay curve, averaging 0.61 pg/µL with a variability of 19% CV. After scoring with a curve desired 2.0 pg/µL sensitivity, all null samples produced interpolations well below the LLOQ, eliminating the possibility of false-positive interpolation ( Fig. 3 ). Null sample interpolations were consistent regardless of chlorophyll content.
Plant tissue and cellular structure adds challenge to the task of protein extraction for immunoassay screening. Leaf tissue is commonly sampled due to availability and ease of collection but contains a waxy cuticle that reduces extraction buffer penetration. Also, in order to release cellular contents into solution, the cell wall must be disrupted in a manner that does not negatively impact the target protein’s solubility or immunoreactivity. The extraction parameters described herein, including mechanical grinding in a simple extraction buffer, are typical for many protein targets within the plant biotechnology industry.
Within plant biotechnology high-throughput immunoassay screening, sample-to-sample variability in photosynthetic matrix content is unavoidable. Biological factors, including but not limited to environmental conditions, collection conditions, plant age, water content, and genotype differences, contribute to this variability. When traditional 680 nm donor beads are used, variability in photosynthetic matrix content causes variable and elevated signal from the null sample population, which can lead to false-positive results. The use of the 775 nm donor bead with an appropriate detector eliminates pigment-associated signal and reduces this risk.
Assay Sensitivity
To demonstrate how the elevation of null sample signal influences assay sensitivity, positive and null sample extracts were analyzed in a high-throughput quantitative Alpha assay. Using positive extract dilution agreement and null extract signal elevation as metrics, we estimated the final assay sensitivities and compared them between donor bead species.
Positive Sample Dilution Agreement
Wells containing 680 nm donor beads produced acceptable dilution agreement across sample dilution factors 2–64. Artificially prepared high-, medium-, and low-expressing samples produced average values of 120.1, 26.7, and 7.0 µg/mL, respectively. Variability in final back-calculated interpolation for each dilution series ranged from 3.8% to 7.7% CV. Similarly, for wells containing the 775 nm donor beads, artificially prepared high-, medium-, and low-expressing samples produced average values of 131.8, 29.2, and 6.3 µg/mL, respectively. Variability in final back-calculated interpolation for each dilution series ranged from 1.0% to 8.8% CV. Both donor bead species produced similar interpolations for all expression levels and showed an approximate fourfold factor between high, medium, and low samples, matching expectations based on preparation methods. These data are summarized in Table 2 .
Positive and Null Sample Performance in the CRY34 Quantitative Assay Using 680 and 775 nm Donor Beads.
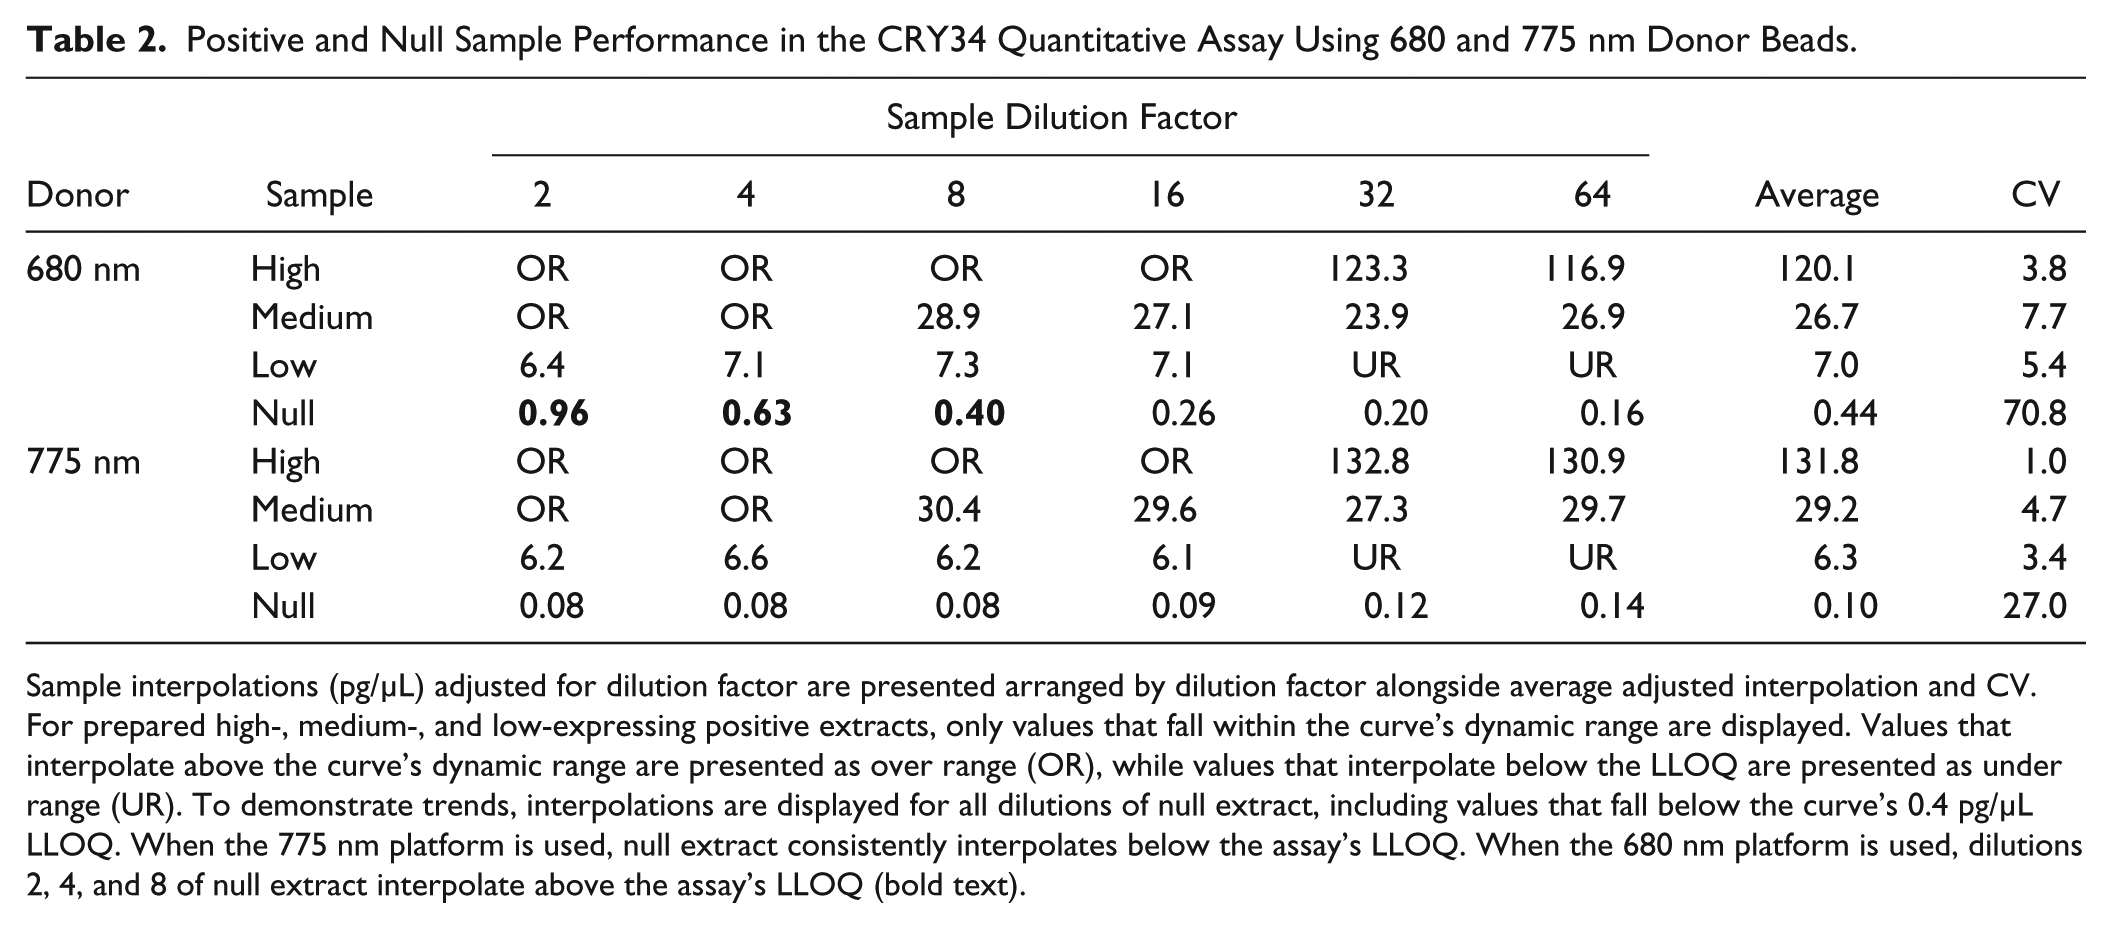
Sample interpolations (pg/µL) adjusted for dilution factor are presented arranged by dilution factor alongside average adjusted interpolation and CV. For prepared high-, medium-, and low-expressing positive extracts, only values that fall within the curve’s dynamic range are displayed. Values that interpolate above the curve’s dynamic range are presented as over range (OR), while values that interpolate below the LLOQ are presented as under range (UR). To demonstrate trends, interpolations are displayed for all dilutions of null extract, including values that fall below the curve’s 0.4 pg/µL LLOQ. When the 775 nm platform is used, null extract consistently interpolates below the assay’s LLOQ. When the 680 nm platform is used, dilutions 2, 4, and 8 of null extract interpolate above the assay’s LLOQ (bold text).
Negative Sample Performance
For wells containing 680 nm donor beads, the most concentrated sample dilution factors of null leaf extract produced signal that was elevated significantly above buffer. With interpolations as high as 0.96 pg/µL, many dilutions of null extract interpolated above the assay’s desired 0.40 pg/µL LLOQ. In contrast, for wells containing 775 nm donor bead, the null extract produced interpolations ranging from 0.08 to 0.14 pg/µL, all of which fell well below the assay’s LLOQ. These data are summarized in Table 2 .
Comparison of Assay Sensitivity between Donor Bead Species
Assay sensitivity suffers when pigment-associated signal elevates the assay’s baseline signal. Assay sensitivity is a function of the standard curve’s LLOQ and the minimum extract dilution factor. The performance of positive and null samples is taken into account when determining minimum extract dilution factor. Positive samples must show a linear response to dilution within the range of acceptable extract dilutions. In addition, null samples must interpolate below the LLOQ in all acceptable extract dilutions.
As outlined in Table 2 , both donor bead species show capacity to produce equally low-dilution CV, indicating an acceptable linear dilution response for all three artificially created positive samples. Within the assay utilizing the 680 nm donor bead, null samples produce interpolations equivalent to, or above, the LLOQ for all dilutions up to dilution factor 8. As described in the investigation of pigment-associated signal, variability in photosynthetic matrix content may lead to even higher null interpolations across a sample set. As depicted in the table, in order to eliminate the possibility of false-positive interpolation, a minimum dilution for the 680 nm donor assay was set at 1:32, resulting in an assay sensitivity of 25.6 ppm for a sample containing 0.5 µg/mL total protein. In contrast, null samples did not show potential for false-positive interpolation at any dilution in the assay containing the 775 nm donor. When a 1:2 minimum dilution factor was used, the 775 nm assay delivered an assay sensitivity of 1.6 ppm for a sample containing 0.5 µg/µL total protein and was 16× more sensitive than the 680 nm assay.
Ambient Light Photostability
To demonstrate photostability for each donor bead species, donor bead working solutions and prepared Alpha assay wells were exposed to ambient laboratory lighting. Signal was reduced by 95% when the 680 nm donor bead working solution was exposed to light, and by 76% when prepared wells were exposed to lighted incubation (n = 96 for each condition). For wells containing 775 nm donor beads, neither working solution nor prepared assay wells showed reduction in signal as a result of light exposure.
The Alpha immunoassay platform offers many advantages to high-throughput sample processing. The homogenous chemistry eliminates laborious wash steps associated with ELISA processing. Assays can be easily developed or converted from existing ELISA. The reactions are easily miniaturized, offering cost savings and lending the technology to high-density plate formats. 13 Multiplexed immunoassays have even been presented using PerkinElmer’s newer product offerings. 14 Despite all of the chemistry’s advantages, its traditional 680 nm donor bead is light sensitive, which can significantly hinder its implementation in the high-throughput environment for which it was intended.
Impregnated into the donor bead is a finite supply of reactive chemistry, which is responsible for the conversion of nearby triplet oxygen to singlet oxygen. When traditional donor beads are exposed to wavelengths near 680 nm, present in the spectra of standard fluorescent laboratory lighting, this chemistry is exhausted. This photosensitivity can be minimized by applying light filters or reducing overall illumination, but both of these workspace modifications result in nonoptimal laboratory working conditions. Suitable for assays containing or lacking photosynthetic pigments, the 775 nm donor bead serves as a convenient, photostable alternative to traditional 680 nm chemistry.
Footnotes
Acknowledgements
We thank internal reviewers for contributions and thoughtful review of the manuscript. We thank Catherine Sweeny and Roger Bossé for their role in managing the production and supply of the custom materials.
Declaration of Conflicting Interests
The authors declared the following potential conflicts of interest with respect to the research, authorship, and/or publication of this article: Both authors are employed by Corteva Agriscience, Agriculture Division of DowDuPont and their research and authorship of this article was completed within the scope of their employment with Corteva Agriscience.
Funding
The authors received no financial support for the research, authorship, and/or publication of this article.