
Abstract
Undoubtedly, microfluidics has been a focal point of interdisciplinary science during the last two decades, resulting in many developments in this area. Centrifugal microfluidic platforms have good potential for use in point-of-care devices because they take advantage of some intrinsic forces, most notably centrifugal force, which obviates the need to any external driving forces. Herein, we introduce a newly designed detection chamber for use on microfluidic discs that can be employed as an absorbance readout step in cases where the final solution has a very low viscosity and surface tension. In such situations, our chamber easily eliminates the air bubbles from the final solution without any interruption. One microfluidic disc for measuring the hemoglobin concentration was designed and constructed to verify the correct functioning of this detection chamber. This disc measured the hemoglobin concentration of the blood samples via the HiCN method. Then, the hemoglobin concentration of 11 blood samples was quantified and compared with the clinic’s data using the hemoglobin measurement disc, which included four hemoglobin measurement sets, and each set contained two inlets for the blood sample and the reagent, one two-part mixing chamber, and one bubble-free detection chamber. The measured values of the disc had good linearity and conformity compared with the clinic’s data, and there were no air bubbles in the detection step. In this study, the standard deviation and the turnaround time were ± 0.51 g/dL and 68 s, respectively.
Keywords
Introduction
Undoubtedly, microfluidics, a subset of micro-total analysis systems, has been a focal point in scientific areas in the last two decades and has attracted the attention of many researchers of various fields. Microfluidics provides valuable advantages over traditional benchtop analysis systems. These benefits have resulted in enhanced sensitivity with lower cost, faster reaction time, lower consumption of samples and reagents, enhanced mass and heat transfer control, and good potential for automation and parallelization.1–4 Based on the mentioned advantages, microfluidic-based devices have gained popularity for analysis purposes.5,6
Moreover, centrifugal microfluidics is considered a popular and widespread branch of microfluidics. 7 Lab-on-a-disc (LoaD) systems take advantage of the presence of multiple inherent forces, including Coriolis force, Euler force, and, most importantly, centrifugal force that is not available in other types of microfluidic chips. The centrifugal force, as the main driving force in LoaD systems, is achievable for creating the fluid flow just by means of a rotating motor; consequently, the requirement of a syringe pump or any other extraneous driving forces is eliminated, which in turn paves the way for the commercialization of such systems.8–11 This advantage has propelled researchers and manufacturers to exploit the LoaD platforms as the point-of-care testing (POCT) systems. POCT equipment has frequently been applied for detecting and measuring various types of biomarkers, including cells, proteins, and metabolites, for the prognosis and diagnosis of diseases.7–12
Hemoglobin (Hb) is a protein in red blood cells (RBCs) that gives blood its red color and is responsible for carrying oxygen through the body. Hb is made up of four protein parts (heme groups), each of which contains one iron atom. 13 Measuring the Hb level in the blood is an important criterion used by physicians for the prognosis or diagnosis of diseases.4,14 Although there are many commercial complete blood count auto analyzers available that measure the concentration of Hb routinely, only a few studies have used microfluidic platforms to measure the Hb level. Steigert et al. introduced a novel LoaD system for performing the emergency quantification of Hb in a fast and fully automated manner. Actually, for this end, they implemented the SLS method in a colorimetric measurement with a 100 s turnaround time. 15 In their study, the optical path length increased from 1 mm to 5 mm using a structural total internal reflection (TIR). This way, the sensitivity of the assay was enhanced as well. It should be noted that the required accuracy for beaming and the exact placement of the V-groove features were two challenges for the TIR feature in the centrifugal microfluidic discs. 15 Also, Kim et al. introduced a microfluidic air bubble-free cuvette for quantification of the total Hb concentration. In their study, the cyanmethemoglobin (HiCN) method along with colorimetric detection was used. 16 They investigated the microfluidic cuvettes with both dual- and single-side-wall microchannels. The result indicated that no air trapping occurred in the single-side-wall cuvette. Although they gained a good sensitivity in only the 105 µm optical length path, they did not provide any automated processing for their device.
Some references have recommended that at least a 10 mm optical length path is required in colorimetric measurements in order to gain a linear calibration curve. 17 Despite these recommendations, we showed that a linear calibration curve in a 2 mm optical path length was achievable by using a high-resolution spectrometer and exploiting an appropriate blood sample dilution ratio. Considering that a remarkable time for measuring Hb in whole blood samples accounted for the hemolysis and chemical reaction steps, we decreased the required time for this assay to less than 1 min using a proper mixing chamber. Moreover, a novel readout chamber was designed and built based on the inertia force. This chamber easily eliminated air bubbles from the final solution, and thus the readout procedure was done without any interruption. This presented detection chamber is especially useful wherever the concentration of a biomarker has to be measured in a fluid with very low viscosity. In order to investigate the proper operation of this chamber, we quantified the Hb concentration of 11 blood samples.
Materials and Methods
Design and Fabrication
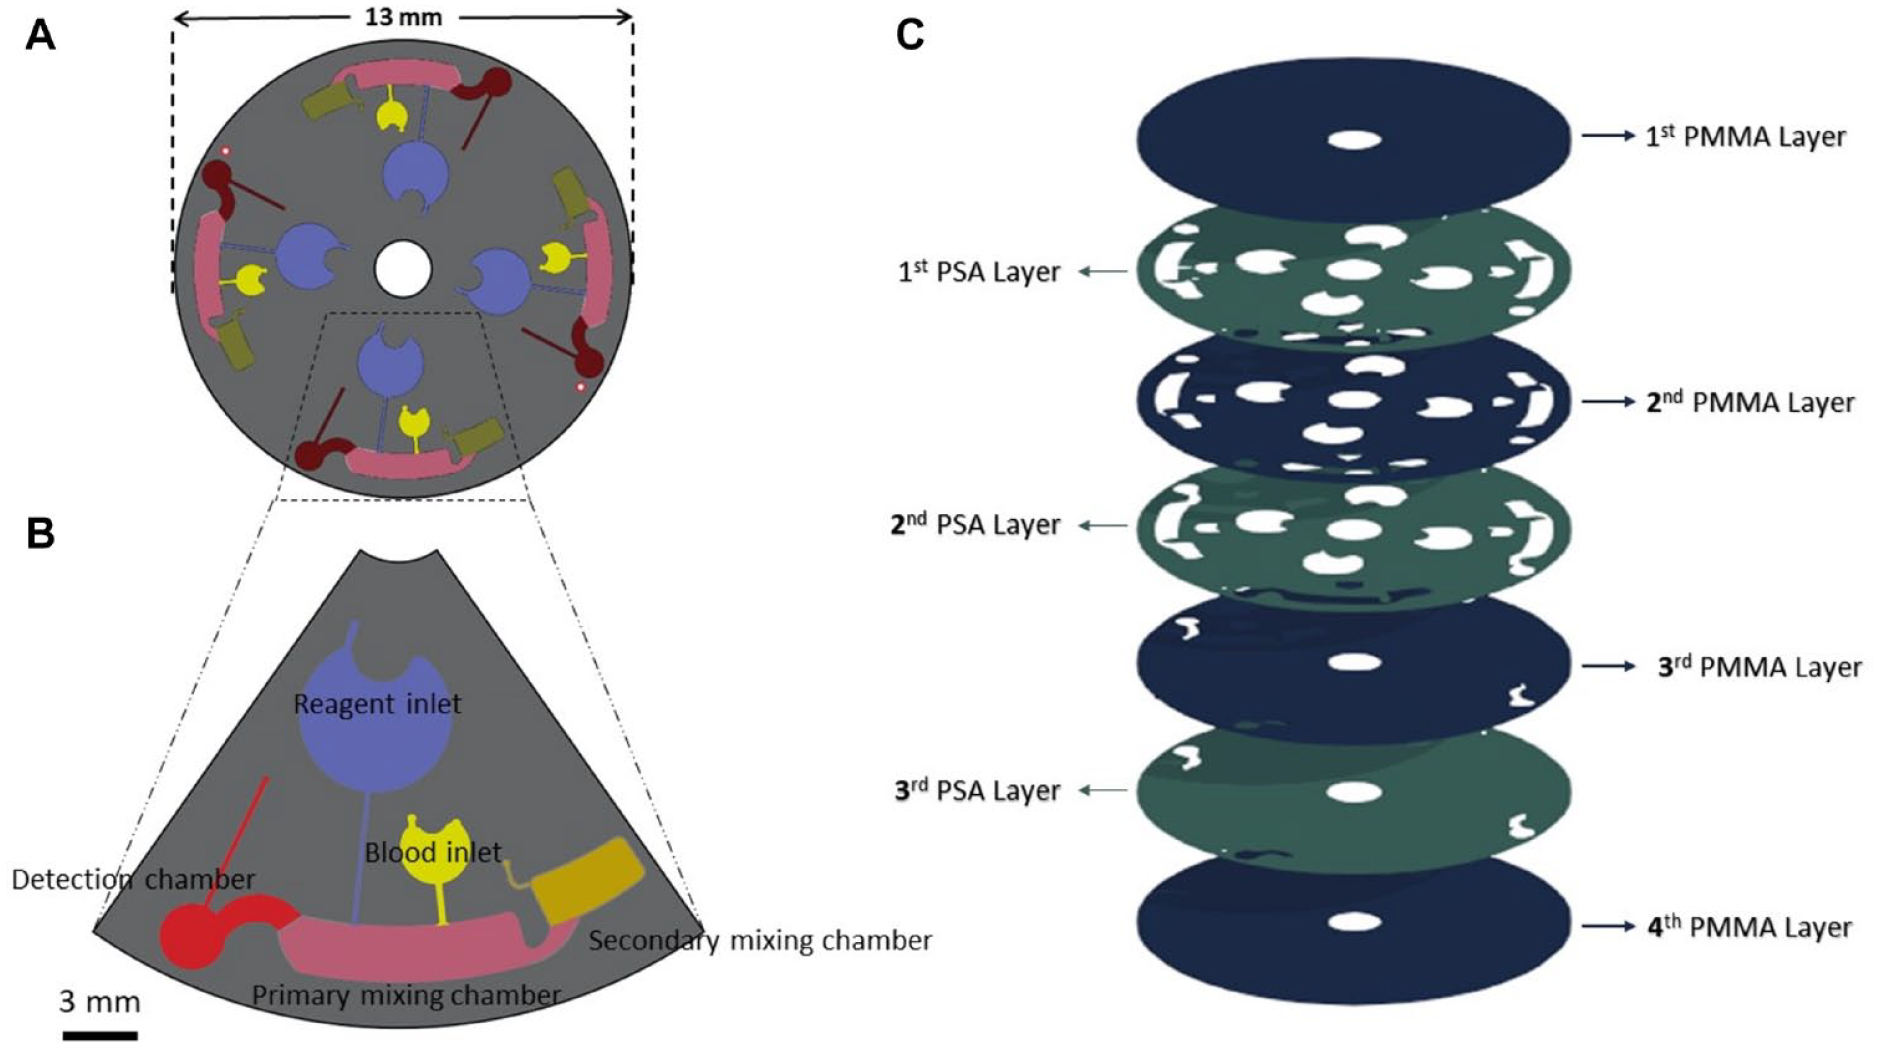
In this experiment, two microfluidic discs were designed and fabricated: a calibration disc and a Hb compact disc (Micro/Nano BioSystems Laboratory [MNBS-Lab], Sharif University of Technology, Iran, under supervision of Dr. Saadatmand). The calibration disc was designed to be used in the manual steps of this research, especially for drawing the calibration curve. As no reaction occurred in this disc, each set of the calibration units only included one inlet, one detection chamber, and one air outlet vent. The detection chambers on the calibration disc acted as cuvettes with a 2 mm optical path length (
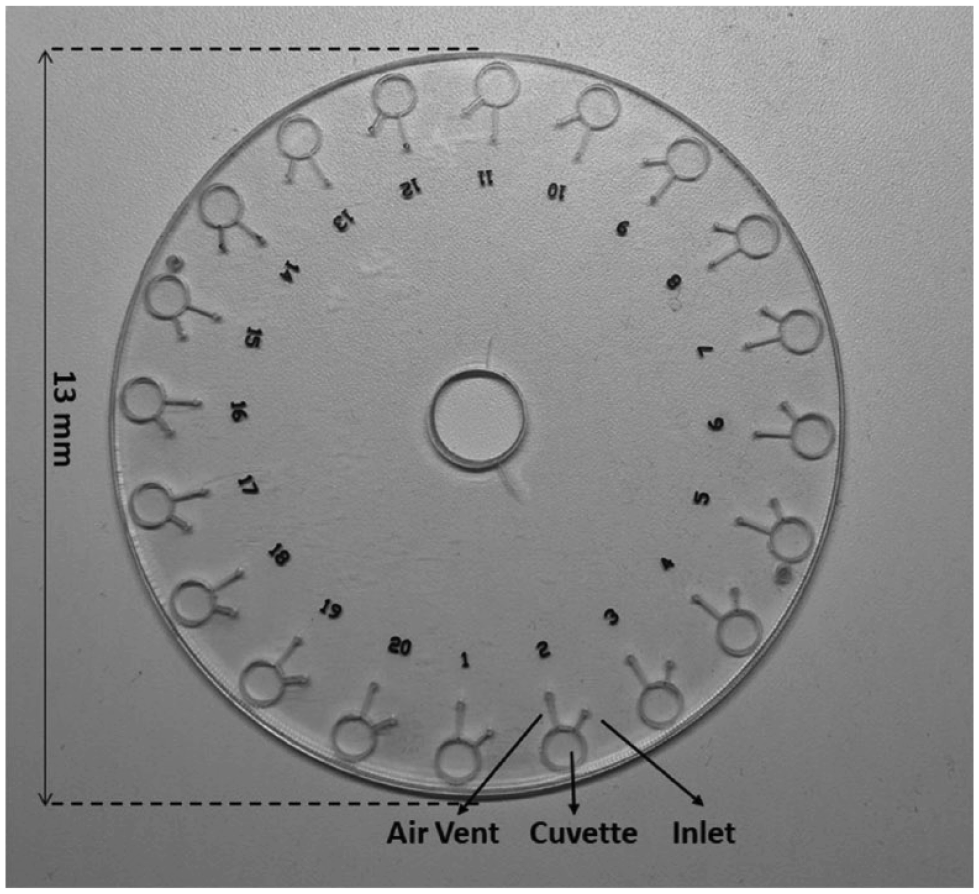
The calibration disc that is used for manual experiments and acts as a cuvette with a 2 mm optical path length. The calibration disc includes 20 measuring units, each of which includes one inlet, one cuvette, and one air vent.
(
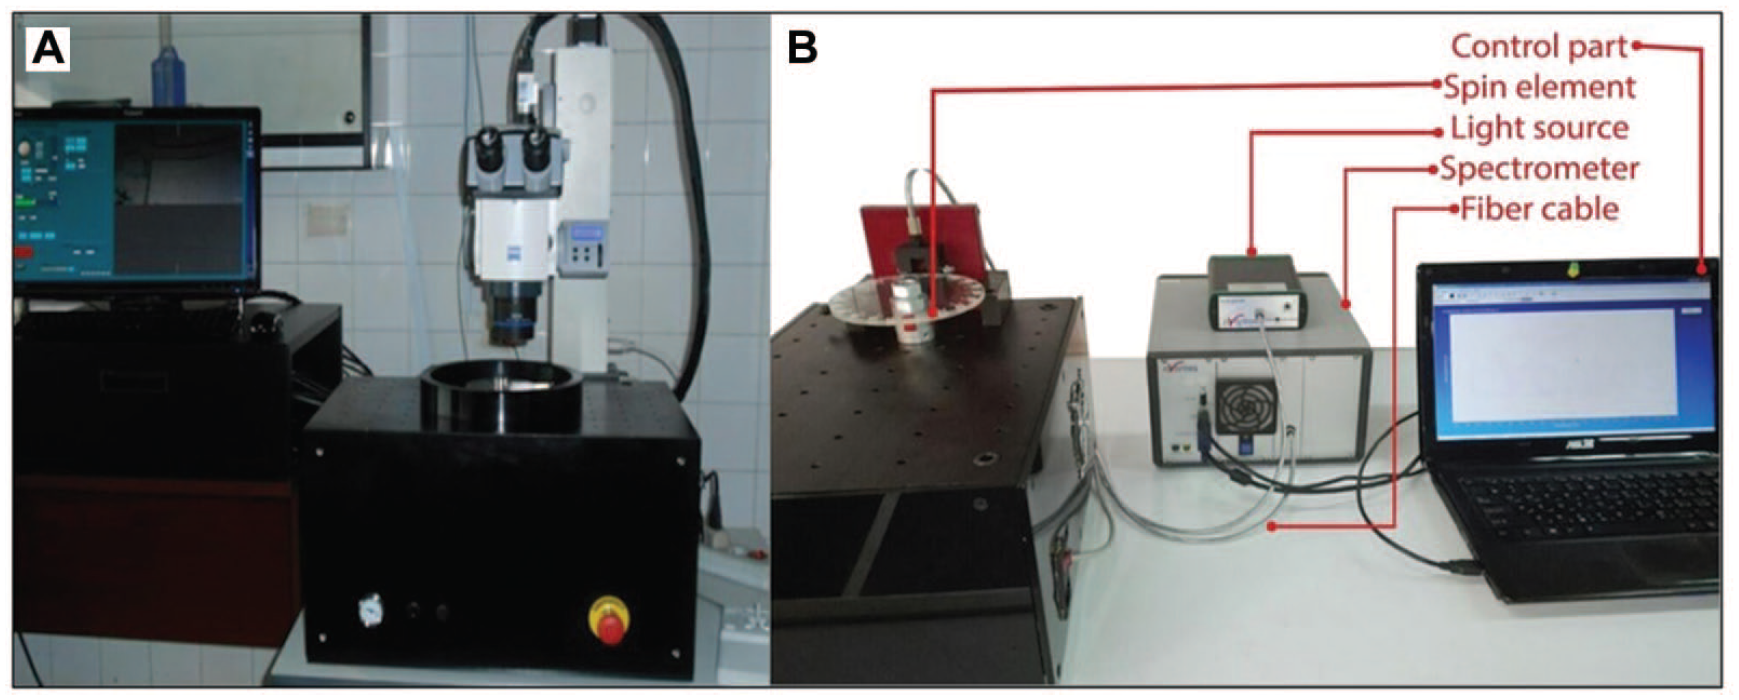
As we reported in our previous study, 14 the aforementioned fabricated discs were a hybrid assembly of seven layers, including four polymethyl methacrylate (PMMA) discs (Chochen, Tainan, Taiwan; 1 mm thickness) that were stacked together with three layers of pressure-sensitive adhesive (PSA) (FLEXcon; 60 µm thickness). A schematic arrangement of the disc’s layers is shown in Figure 2C . In this design, the first PMMA layer just includes vent holes, and the last PMMS layer acts as the substrate and includes the connective part between the detection chamber and primary mixing chamber. After designing the layout of the discs via AutoCAD software, the patterns were exerted on the PMMS and PSA layers using CNC machining (Roland; mdx-40A) and a cutter plotter (Graphtec CE-6000), respectively. The first PMMA layer included the air vent and inlet holes, while the fourth PMMA layer did not contain any pattern and only acted as a substrate. Other patterns were exerted on the second and third layers. After applying the patterns on the layers, they were aligned using a hand-made aligner that took advantage of the two outer-radius pins. Afterward, the seven layers were compressed together using a manual press apparatus for approximately 1 day in order to bond the PMMA layers to each other. Prior to the biological tests, the functionality of the disc was tested by strobe imaging the food dye-filled disc using a fully customized platform (CD Imager K1000; Key Lead Solutions Inc., San Francisco, CA); this ensured the proper fluid movement and attained suitable rotational velocity and acceleration for the different steps.
Biochemical Concept and Reagent Prepration
In this study, the Hb concentration of EDTA-anticoagulated venous blood was measured by taking advantage of the HiCN method. 13 Drabkin’s is the main reagent of the HiCN method and is responsible for both the hemolysis and chemical reactions involved in this method. The protocol for preparing Drabkin’s reagent was explained in our previous study. 14 Briefly, one vial of Drabkin’s reagent (Sigma-Aldrich; D5941) was added to 1000 mL of double distilled water. Afterward, 0.5 mL of 30% Brij L23 solution (Sigma-Aldrich; B4184) was added to 1000 mL of reconstituted Drabkin’s reagent. Eventually, the final solution was mixed at 40 °C and then filtered to separate the probable solid particles.
Based on the HiCN method, 13 prepared Drabkin’s solution, which is composed of potassium ferricyanide and potassium cyanide (KCN), should be mixed with the whole blood in a defined ratio. In this stage, the RBCs are lysed by Drabkin’s solution, and consequently all the Hb molecules are released from the broken erythrocytes. The potassium ferricyanide oxidizes the iron in the heme portion from the ferrous state (Fe2+) to the ferric state (Fe3+) to form methemoglobin, which is instantly converted to stable HiCN through a chemical reaction between the methemoglobin and KCN. The principle advantage of this method is that all types of Hb molecules, excluding sulfhemoglobin, are converted to HiCN, which has an absorbance peak at 540 nm and strictly obeys the Beer-Lambert law. Hence, it is a reliable method for quantifying the amount of Hb. A schematic form of converting Hb to HiCN has been illustrated previously. 14
Calibration Curve and Preparing the Standard Solution
For plotting the Hb calibration curve, which was used to determine the Hb concentration in the unknown samples, a standard solution of HiCN was needed. The main obstacle encountered in this study was that the available commercial HiCN standard solutions were suitable for use in cuvettes with a 10 mm optical path length. However, the optical path length in the detection chamber of our designed microfluidic disc was 2 mm. Hence, these commercial solutions could not be detected by the spectrometer in our discs, and consequently we needed an appropriate standard solution with a detectable concentration in the 2 mm optical path length. Therefore, we prepared a HiCN standard solution using a normal venous blood sample with a specified Hb concentration. This procedure has been explained in our previous study. 14 Briefly, a standard solution was initially made with 20 g/dL Hb. Then, by diluting the standard solution using Drabkin’s reagent in 3:1, 2:2, 1:3, and 0:4 ratios, solutions with 15, 10, 5, and 0 g/dL, respectively, were obtained. Finally, the mentioned solutions were injected into the calibration disc, and their absorbance was measured three times using a spectrophotometer.
Detection Chamber
The absorbance readout step was one of the challenging parts of this study. In this experiment, Drabkin’s reagent was responsible for both the hemolysis step and the chemical reactions that led to converting the Hb molecules to HiCN, and the surface tension of the final solution was so low that we were confronted with severe bubble trapping. The presence of air bubbles in the detection chamber caused significant errors in the absorbance readout.19–22 So, we presented a novel type of chamber in the microfluidic compact discs resulting in a bubble-free detection chamber. This chamber easily eliminated the air bubbles from the final solution, and thus the readout procedure was done without any interruption. The structure of this chamber was such that the inertia force pushed the fluid into the chamber and filled it from the bottom to the top, and consequently the entering fluid pushed the available air in the chamber out of the disc using the embedded air vent. In this manner, the detection chamber was filled without the presence of any bubbles. In this step, the available inertia force was a result of stopping the disc abruptly. The operation of the described chamber is illustrated in Figure 3 .
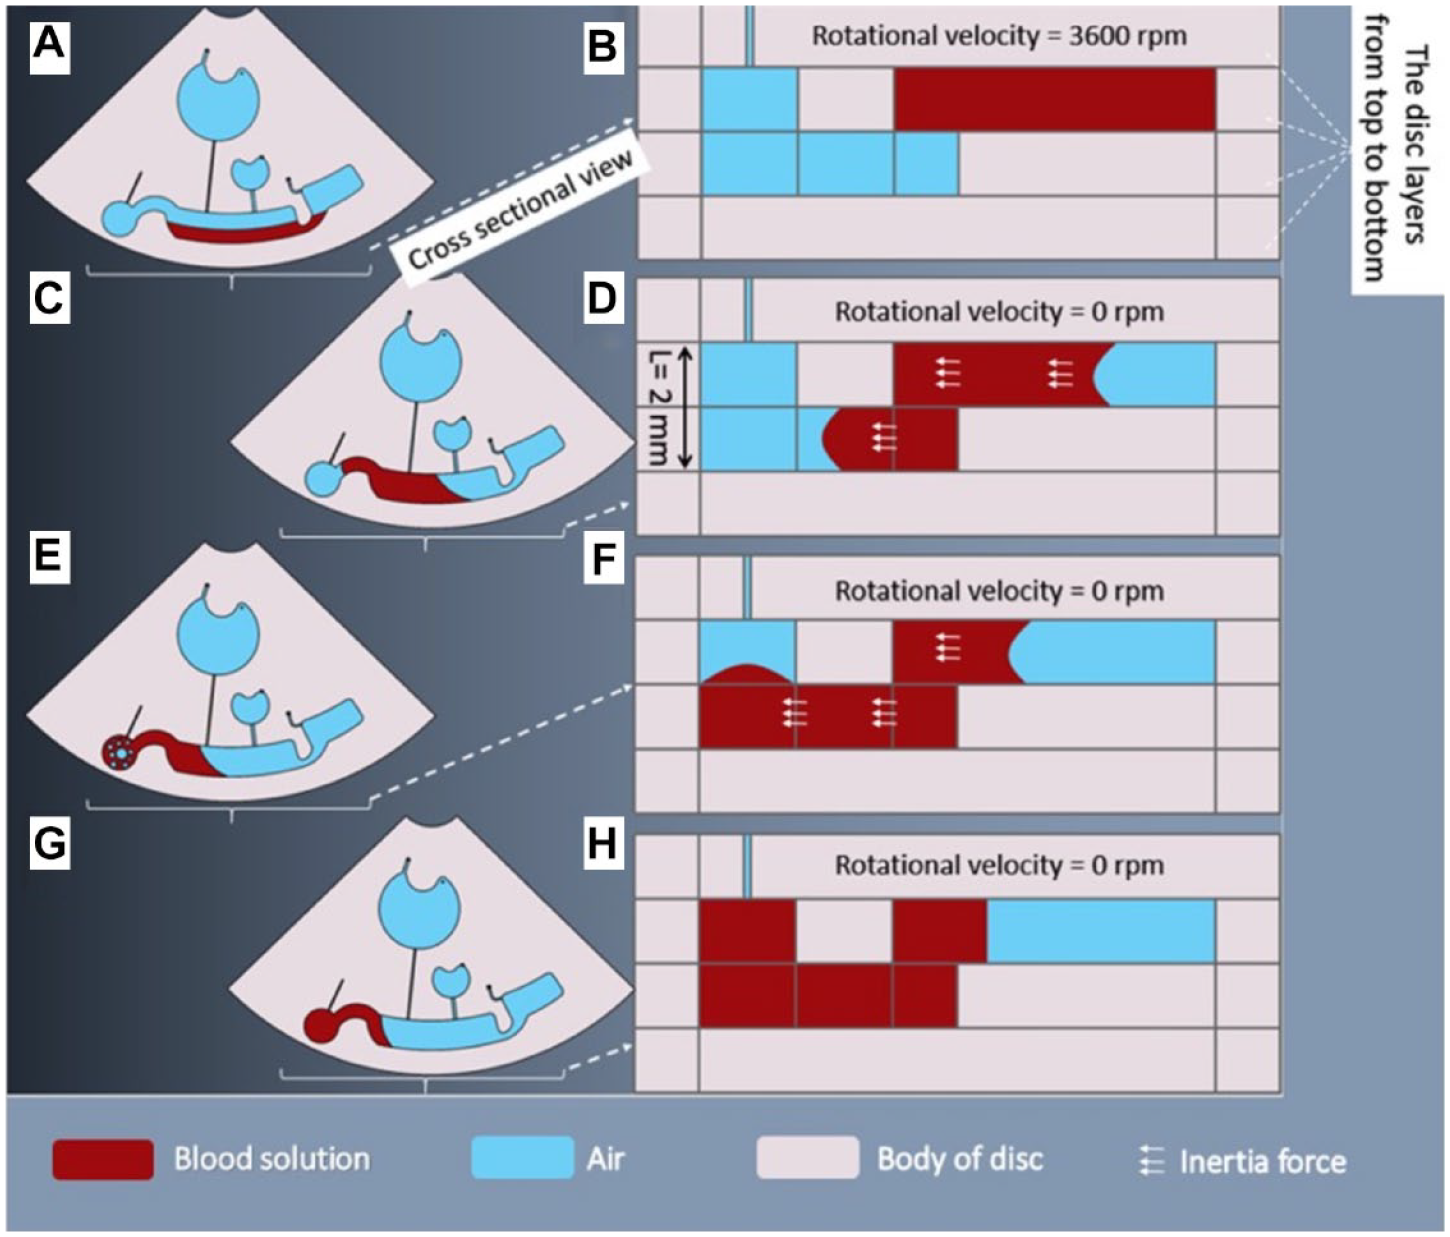
Performance of the detection chamber. (
Assay Protocol
In this study, injection of the blood sample and the reagent loading were done manually by pipetting. For this purpose, after mounting the Hb disc on the spinner, 2 µL of venous blood (which was collected in EDTA-coated tubes) was injected into the blood inlet chamber using a Hamilton syringe. Also, 120 µL of Drabkin’s solution was loaded into the reagent inlet chamber using a pipette. Afterward, the velocity profile, which was explained in our previous work,
14
was applied on the disc (
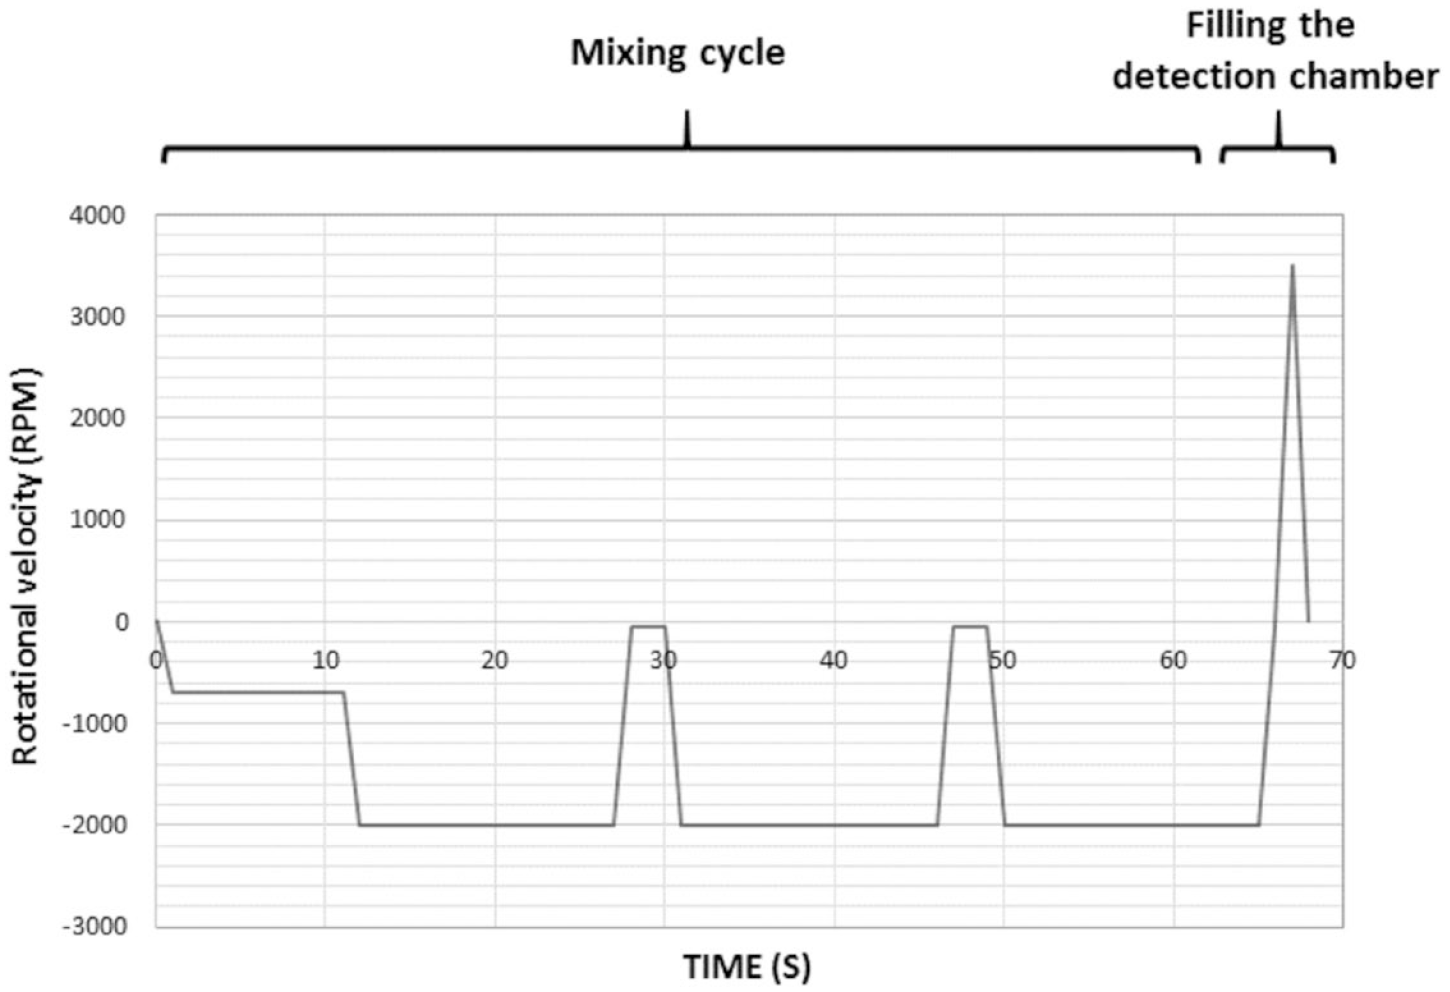
A schematic view of the applied rotational velocity profile of the Hb measurement disc. Positive and negative values of velocity are related to clockwise and counterclockwise rotational velocities, respectively.
Afterward, the inertial mixing procedure, obtained from hydrodynamic tests (
In the readout step (
(
Results
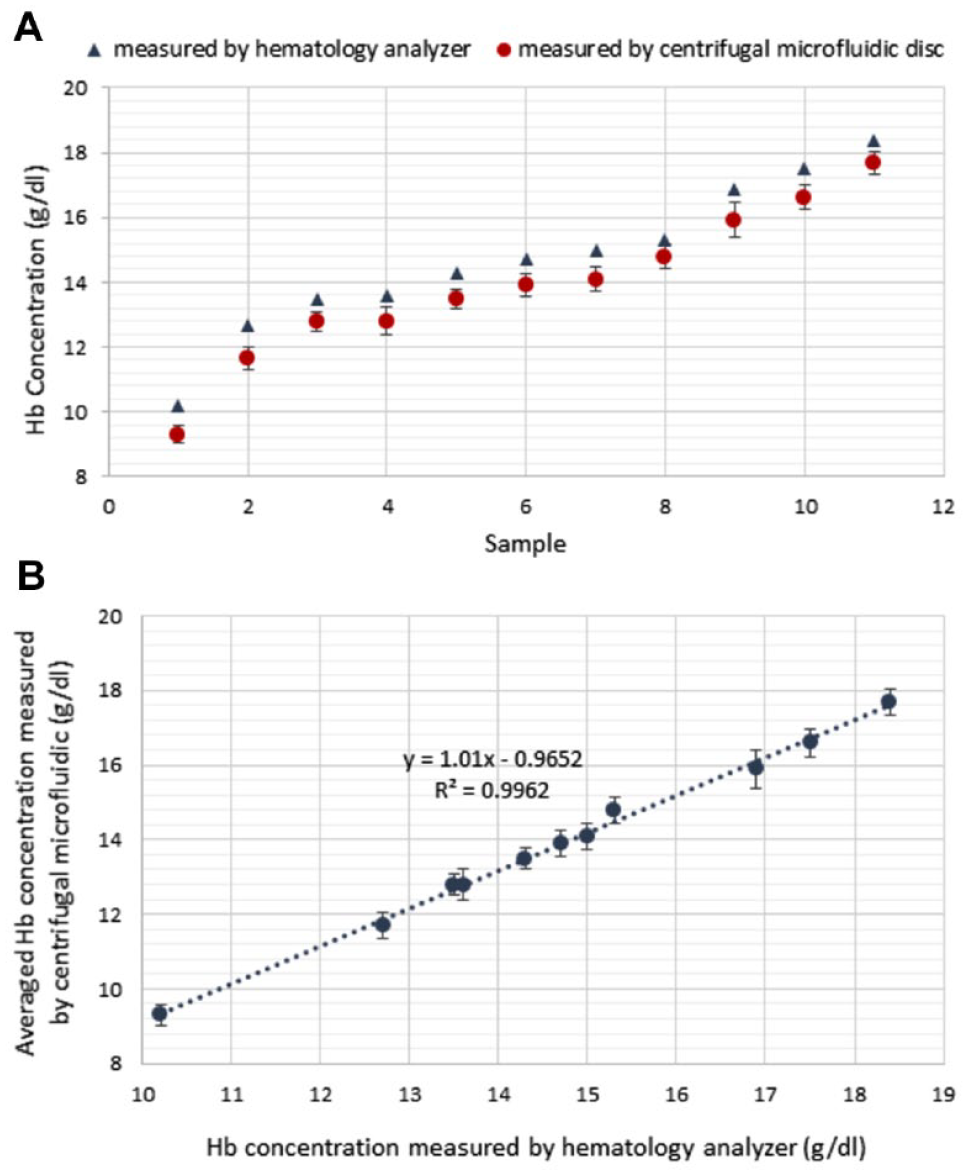
According to our previous study, 14 the absorbance variation of the final solution is really negligible within 1–5 min, which indicates that the hemolysis of the RBCs and the chemical reaction, which leads to converting the Hb molecules to the HiCN molecules, have been completed after about 1 min. So, we can consider this time the appropriate time for the absorbance readout. In most of the routine Hb measurement methods that are used in clinics, the previously mentioned steps are performed without a mixing process, and therefore this trial lasts almost 5 min. Figure 6A presents the results of the measured Hb concentration of 11 blood samples using the Hb compact disc in comparison with the clinic’s data. There is good conformity between the Hb measurement disc and the clinic’s data, which indicates the accuracy of the experiment. What is notable in Figure 6A is that all the reported values for the Hb concentration with the described method are almost a specified amount less than the clinic values. Actually, because there was a 3-day gap between the Hb measurement tests done in the clinic and those done in our laboratory, some Hb molecules were degraded in this time interval, which subsequently caused a decrease in the values obtained with the designed disc. Figure 6B presents good linearity between the averaged Hb concentration measured by the presented setup (which is equipped with a high-resolution spectrophotometer) and the Hb concentration reported by the clinic. Good linearity between the results of the clinic and Hb compact disc along with the low standard deviation endorses the accuracy and repeatability of the designed disc.
Results of Hb measurement procedure using the presented centrifugal microfluidic disc. (
Drabkin’s reagent, the main component of this assay, had a low surface tension because it contained a type of surfactant. Therefore, the presence of even one air bubble in the detection chamber would interrupt the absorbance readout step. Therefore, in this study, we eliminated all of the air bubbles in the readout step by using the newly designed detection chamber. As shown in Figure 7 , the chamber is filled entirely with the final solution. Also, a trained operator is not required for performing the assay; a computer controls all the steps, excluding injecting the blood samples and reagents. In addition, unlike other microfluidic devices, there is no need for any external instruments like a syringe pump.
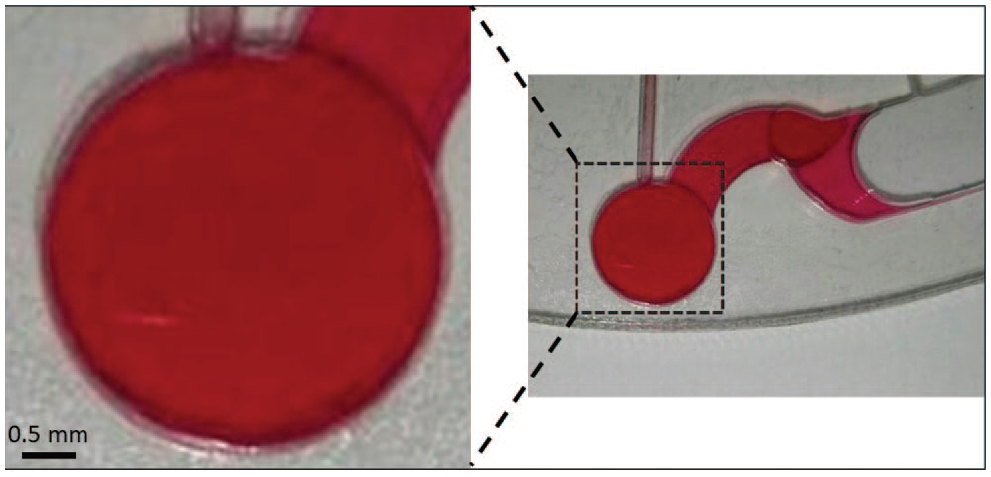
A photograph of the detection chamber after filling with the final solution. There are no air bubbles to interrupt the readout procedure.
Conclusion
In this study, a new geometric structure for the detection chamber on microfluidic discs was designed and fabricated. Since the presence of air bubbles in the readout step caused remarkable errors in the test results, this newly designed chamber was capable of enhancing the test accuracy by eliminating all of the air bubbles in the final solution. The chamber was designed in such a way that it was filled with the final solution from bottom to top due to the generated inertia force; consequently, all the available air in the chamber was pushed out through the embedded vent. This kind of chamber could be used as the absorbance or fluorescent readout step when a final solution with a low viscosity contains a type of surfactant. In such cases, any air bubbles in the solution could easily move through the solution and interrupt the detection procedure. Also, by using an appropriate standard solution and high-resolution spectrophotometer, it was possible to gain a linear calibration curve for measuring the concentration of the analysts in a compact disc with a 2 mm optical path length, even though a minimum 10 mm optical path length was suggested for use in the absorptiometry method. In order to evaluate the performance of this chamber, the Hb concentration of 11 blood samples was quantified without any interruption in the readout step and measured against the clinic’s data. The measured values had good linearity and conformity compared with the clinic data, and there were no air bubbles in the detection chamber in the detection step. In this study, the standard deviation and the turnaround time were ± 0.51 g/dL and 68 s, respectively. Therefore, the presented Hb disc is convenient for use as a rapid point of care.
Footnotes
Acknowledgements
We sincerely thank Mr. Nezami and Dr. Nafisi for their guidance and assistance in providing the materials and facilities needed to carry out this project.
Declaration of Conflicting Interests
The authors declared no potential conflicts of interest with respect to the research, authorship, and/or publication of this article.
Funding
The authors received no financial support for the research, authorship, and/or publication of this article.