
Abstract
Acoustic liquid handlers deliver small volumes (nL-µL) of multiple fluid types with accuracy and dynamic viscosity profiling. They are widely used in the pharmaceutical industry with applications extending from high-throughput screening in compound management to gene expression sequencing, genomic and epigenetic assays, and cell-based assays. The capability of the Echo to transfer small volumes of multiple types of fluids could benefit bioanalysis assays by minimization of sample volume and by simplifying dilution procedures by direct dilution. In this study, we evaluated the Labcyte Echo 525 liquid handler for its ability to deliver small volumes of sample preparations in biological matrix (plasma and serum) and to assess the feasibility of integration of the Echo with three types of bioanalytical assay platforms: microplate enzyme-linked immunosorbent assay, Gyrolab immunoassay, and liquid chromatography with tandem mass spectrometry. The results demonstrated acceptable consistency of dispensed plasma samples from multiple lots and species by the Echo. Equivalent assay performance demonstrated between the Echo and manual liquid procedures indicated great potential for the integration of the Echo with the bioanalytical assay, which allows the successful implementation of microsampling strategies in drug discovery and development.
Introduction
In the pharmaceutical industry, bioanalytical assays are critical for the measurement of therapeutic compounds (small and large molecule) to enable preclinical and clinical studies to assess safety, clearance, biotransformation, as well as detection or characterization of antidrug antibodies in biological matrices for immunogenicity. Bioanalytical assays are also used in biomarker studies of pharmacodynamic assessments for understanding mechanisms of action and patient stratification.
With the rapid advancement of analytical instrumentation and methods, the sensitivity of bioanalytical assays has been significantly improved, and the need for sample volumes for each measurement has been greatly reduced. 1 Furthermore, using smaller amounts of sample for each analysis could further simplify the analytical procedure and improve the assay performance. To fully use advanced analytical technologies, microsampling approaches that enable the collection and analysis of small sample volumes has been gaining increasing attention in the industry and regulatory agencies.2–4 Among these approaches, dried blood spot 5 and capillary plasma/serum sampling6,7 are routinely used in drug discovery and are being increasingly implemented during drug development.8,9
One of the key requirements for bioanalysis of samples collected in microliter volumes is to reliably transfer accurate volumes with diverse matrix components. The emerging availability of instruments to reproducibly deliver very small volumes has had a tremendous impact in biopharma and drug discovery, in particular, their use in bioanalytical quantitation of precious toxicology and clinical samples. 10 With the further development of immunoassays and liquid chromatography with tandem mass spectrometry (LC-MS/MS) assays and improved instrument detection sensitivities, the efficient use of robotics to deliver small sample volumes has become critical. 11 A robotic liquid transfer in the microliter (µL) and sub-µL range could expedite the quantitative analysis of a large number of samples using limited volumes of reagents and samples.12–14
Automated liquid-handling devices can be generally classified as either contact or noncontact dispense with regard to the droplet “touching off” onto a surface or “air dispense” depending on their delivery mechanisms. In general, the confirmation of dispensed volumes in automated liquid handlers is carried out using water or model fluids (with dyes) using gravimetric, fluorometric, or photometric approaches for quantitation. 15 The performance of liquid handlers can differ between liquids with different physical properties, such as surface tension, density, and viscosity. Calibration parameters optimized for water do not necessarily reflect the reality of pipetting different biological fluids. 16
Acoustic liquid handlers are widely used in the pharmaceutical industry with applications extending from high-throughput screening in compound management to gene expression sequencing, genomic and epigenetic assays, and cell-based assays.17–23 Acoustic liquid handlers accurately deliver small volumes (nL-µL) of multiple fluid types with dynamic viscosity profiling.1,24,25 Acoustic droplet ejection (ADE) has been thoroughly described elsewhere. 26 Briefly, the Echo 525 focused acoustical energy ejects small (25 nL) droplets of liquid into an inverted receiver plate in 96-, 384-, or 1536-well formats. Dynamic measurements of the well fluid allows calibration in real time to each well’s individual fluid property. Using this technology, the Echo system ejects a precise volume of fluid into the destination well.
We believe that the capability of acoustic liquid handlers to dispense multiple types of fluids of small volume could benefit bioanalysis, especially in the reduction of sample volumes and reagent/matrix. The capability of analyzing small volumes of biologic samples collected from animals or patients would not only reduce the cost of bioanalysis but also, more importantly, enable microsampling strategies in preclinical and clinical studies. To evaluate the feasibility of integrating the Echo into bioanalysis work, we conducted a series of experiments using the Labcyte Echo 525 liquid handler (Labcyte Inc., San Jose, CA), abbreviated as Echo in following text, with 3 commonly used platforms (microplate enzyme-linked immunosorbent assay [ELISA], Gyrolab immunoassays, and LC-MS/MS assay). Our objectives were to evaluate (1) the capability of the Echo to quantitatively transfer serum/plasma samples and (2) the feasibility of implementing the Echo in microplate ELISA and Gyrolab immunoassays for analysis of biologic therapeutics in serum and LC-MS/MS assays for small organic drug candidates in plasma matrices. This is the first report in the pharmaceutical industry showing the feasibility of this technology for bioanalysis of biological matrix samples.
Experimental
Materials and Equipment
Dulbecco’s phosphate-buffered saline (PBS) was from Lonza (Walkersville, MD). Blocker casein in PBS, 10% Tween 20, horseradish peroxidase–conjugated NeutrAvidin, Nunc Maxisorp 384-well black plates, 96-well PCR plates for use on Gyrolab, and SuperSignal ELISA Pico substrate were from Thermo Fisher Scientific (Rockford, IL). Ten percent bovine serum albumin (BSA) diluent was from SeraCare Life Sciences (Milford, MA), and animal matrices (plasma and serum) were from Bioreclamation (Westbury, NY). Polypropylene tubes were from Nova Biostorage (Canonsburg, PA). SpectraMax M5 and SoftMax Pro version 5.4.1 software to regress the raw data output from Gyrolab and 384-well ELISA was from Molecular Devices (Sunnyvale, CA). Gyrolab xP, Gyros Bioaffy 200 CDs, and Rexxip F buffer were purchased from Gyros Protein Technologies AB (Uppsala, Sweden). Gyros assay buffers, 1xPBS/0.05% Tween-20, and 0.5% sodium dodecyl sulfate in 50 mM glycine, pH 9.5, were from Chata Biosystems (Loveland, CO) and filtered immediately prior to use through a 0.22-µm filter from VWR (Radnor, PA). An IKA MTS 2/4 orbital shaker from IKA Works (Wilmington, NC) was used for sample mixing as needed. Assay buffer, 1xPBS/1% BSA/0.05% Tween-20 (PTB), wash buffer, 1xPBS containing 0.05% Tween 20 and blocking buffer, and 1xPBS/1% casein/0.05% Tween-20 were prepared from the reagents listed above. Hexane, ethyl acetate, methanol, acetonitrile, and formic acid were from Millipore Sigma (St. Louis, MO). Ammonium acetate was from JT Baker Chemicals (Phillipsburg, NJ). Ultrapure deionized water was generated on the water purification system from Barnstead (Dubuque, IA). Anti-peptide A monoclonal antibody (mAb), peptide A, biotinylated goat anti–peptide A polyclonal antibody (pAb), therapeutic protein B (TPB), biotinylated anti-TPB mAb and anti-hu IgG-Fc-Alexa 647 mAb, Compound C and stable isotopic-labeled [13C6]–Compound C were provided by Bristol-Myers Squibb (New York, NY).
A robotic liquid handler, Janus Mini, was from PerkinElmer (Waltham, MA). LC columns were Acquity UPLC BEH C18, 2.1 × 50 mm, 1.7 µm particle size, and were from Waters Corporation (Milford, MA). The LC system consisted of a Nexera LC-30AD ultra-high-performance liquid chromatography (UHPLC) pump and Nexera SIL-30AC autosampler from Shimadzu (Columbia, MD). The data were acquired on a TripleQuad 6500 triple quadrupole mass spectrometer from AB Sciex (Toronto, Ontario, Canada). The peak integration and quantitation were performed using Analyst software, version 1.6.2.
Echo 525 acoustic liquid handler and associated labware were from Labcyte.
Preparation of Standards, Quality Controls, and Other Evaluation Samples
LC-MS/MS
Preparation of 50 µg/mL of Compound C in plasma samples
The 50 µg/mL of Compound C in rat, mice, dog, rat, cynomolgus monkey, and human K2EDTA plasma was prepared by spiking Compound C stock solution into control rat, mice, dog, rat, cynomolgus monkey, and human K2EDTA plasma to obtain a final concentration of Compound C at 50 µg/mL.
Preparation of standard and QC samples
The stock solution of Compound C was diluted appropriately with control rat K2EDTA plasma to obtain standards with final concentrations of 25.0, 50.0, 250, 1250, 5000, 12,500, 18,750, and 25,000 ng/mL. Six levels of quality controls (QCs; lower limit of quantitation, low, geometric mean, mid, high, and dilution QC) were prepared similarly. The final concentrations of Compound C in rat K2EDTA plasma QCs were 25.0, 75.0, 1000, 12,500, 20,000, and 100,000 ng/mL.
Microplate ELISA assay
Preparation of standards
Peptide A concentration levels (300, 100, 30, 10, 3, 1, 0.3, and 0.1 ng/mL) of standards were prepared in polypropylene tubes via serial dilution by hand in an animal serum, aliquoted, and frozen at −70 °C before use. During the day of analysis, the frozen standards were thawed at room temperature and diluted in PTB buffer to a final minimum-required dilution (MRD) of 10-fold (comparing manual to the Echo).
For manual addition, 10 µL of samples was added to 90 µL of PTB buffer to achieve the 10% MRD, and 10 µL/well of the diluted samples was added to the assay plate in duplicate.
For the Echo addition, 9 µL/well of the PTB buffer was first added to the assay plate by hand, then 1 µL/well of sample was dispensed by the Echo to a final 10% MRD in duplicate wells.
Gyrolab immunoassays
Preparation of standards stock solution
TPB was spiked manually into mouse and cynomolgus monkey serum at the appropriate intermediate concentration (Int1), which was used to make further intermediates on the Echo liquid handler to prepare the full range of the standard curve and QCs to assess the feasibility of accurately achieving concentrations via direct dilutions in 25 nL increments.
Preparation of standards and QCs
Standards and QCs were prepared with blank serum and Int1, which were transferred in 25 nL increments to the designated wells. The number of 25 nL increments to be transferred was based on the targeted concentrations of the standards and QCs and were automatically calculated by the Echo software. The final volume for each standard and QC in an Echo-compatible receiving 384-well plate was 10 µL. For comparison, the standards and QCs were also prepared manually via serial dilution of the same Int1 used by the Echo into animal serum for a final volume of 50 µL in polypropylene tubes.
Preparation of MRD
Standards and QCs were further diluted to an MRD of 10-fold. For 10% MRD preparations on the Echo, 0.5 µL of each standard and QC in neat serum were transferred to a 96-well PCR plate first followed by 4.5 µL of MRD diluent (4 µL is the minimum sample volume required for Gyrolab). For manual 10% MRD preparations, 3 µL of each standard in neat serum was added to 27 µL of MRD diluent. MRD preparations were mixed by pipetting up and down four times. Five microliters of the manually prepared MRD was transferred manually to the PCR plate.
Experimental Procedure and Data Analysis
Sample extraction and UHPLC–MS/MS conditions for the bioanalysis of Compound C in rat K2EDTA plasma
A volume of 5 µL of 5% BSA in PBS was transferred to the Echo receiving plate using a pipette. The plasma samples were transferred to the receiving plate using the Echo. Twenty microliters of 5% BSA in PBS and 25 µL of internal standard working solution (1000 ng/mL of [ 13 C6]–Compound C in 40:60 [v/v] methanol/water) were added to the receiving plate using a pipette. The mixture in the receiving plate was then transferred to a 1.1 mL microtube on a 96 rack. Fifty microliters of extraction buffer (50 mM ammonium acetate in 1% formic acid in water) and 600 µL of extraction solvent (hexane/ethyl acetate [30/70, v/v]) were added to the mixture using a robotic liquid handler. The samples were shaken for 15 min and centrifuged at 4000 × g for 5 min. Then, 480 µL of supernatant was transferred into a 96-well plate using a robotic liquid handler and dried under a nitrogen flow. The dried samples were reconstituted with 400 µL of the reconstitution solution (40:60 [v/v] methanol/water). An isocratic solvent system using mobile phase A (10 mM ammonium acetate in 10:90 [v:v] acetonitrile:water) and mobile phase B (10 mM ammonium acetate in 90:10 [v:v] acetonitrile:water) was used. The isocratic elution of Compound C used 50% A in 1.5 min, followed with a column washing step using 100% B for 0.5 min and column condition using 50% B for 0.5 min (0–1.5 min 50% B; 1.51–2.0 min 100% B; 2.0–2.5 min 50% B, and run stopped at 2.5 min). The flow rate was 0.80 mL/min, and the injection volume was 5 µL. The selected reaction monitoring was m/z 526 → 294 for Compound C and m/z 532 → 300 for [ 13 C6]–Compound C.
Peak areas of analyte and internal standard were integrated using Analyst software, version 1.6.2.
Microplate ELISA assay
Concentrations of peptide A in PTB or animal serum were measured using a 384-well plate–based ELISA with chemiluminescence detection. On the first day, 384-well Nunc Maxisorp black plates were coated with 10 µL of the anti–peptide A mAb at 5 µg/mL overnight at 4 °C. On the second day, plates coated with the capture antibody were first washed three times with wash buffer and then blocked with 20 µL of blocking buffer for 1 h at 22 °C, followed by another washing step. Standards were added to the final 10% MRD in duplicate wells either manually or by the Echo as described above. The plates were incubated at 22 °C for 1 h, followed by another washing step. After the addition of 10 µL/well of the biotinylated goat anti–peptide A pAb at 1 µg/mL, plates were incubated at 22 °C for 1 h to allow the formation of a binding sandwich on the plates. After another washing step, 10 µL/well of the horseradish peroxidase–conjugated NeutrAvidin at 1 µg/mL was added, and the plates were incubated at 22 °C for 1 h. After a final wash, 20 µL/well of the SuperSignal ELISA Pico substrate was added, and the chemiluminescence intensity was measured with a SpectraMax M5 instrument.
Standard curves were evaluated using acceptance criteria for accuracy and a precision of ≤20%. The assay standard curves were generated based on the chemiluminescence values using a four-parameter regression model with 1/y2 weighting on Softmax Pro 5.4.1 software. The standard curve ranged from 0.1 to 300 ng/mL.
Gyrolab immunoassays
Each experiment consisted of three variants of analytical sample preparation: (1) fully automated (FA) Echo standard preparation in neat matrix and Echo MRD preparation; (2) partially automated (PA) manual standard, and QC preparations in neat matrix and Echo MRD preparation; and (3) manual (M) standard and QC preparations in neat matrix and manual MRD preparation.
Concentrations of TPB in mouse and cynomolgus monkey serum were measured on the Gyrolab xP platform using a three-step (Capture-Analyte-Detect) Gyrolab wizard method with two wash steps.
The Gyrolab assay format consisted of 100 µg/mL biotinylated capture reagent (prepared in 0.22 µm filtered 1% BSA/1xPBS/0.05% Tween-20) followed by samples and finally by addition of fluorescent detection reagent (anti-IgG-Fc-Alexa 647 at 1 µg/mL in Rexxip F buffer). All immunoassay steps were performed by Gyrolab. Mixing (if done) of Echo standards was performed on an IKA MTS 2/4 orbital shaker at 800 RPM for 2 min at 23 °C.
The well locations for all standards and QCs were defined by the Gyrolab load list. The order of the load list was based on how the instrument was programmed for each experiment. After each sample was added, the plate was then sealed, mixed on an orbital plate shaker (~500 RPM, 1 min, 23 °C), centrifuged at 1000 × g for 3 min at 23 °C, and loaded onto the instrument along with the reagent PCR plate and CD, followed by an automated run execution.
The experimental standard and QC concentrations were back-calculated from the fluorescence intensity as measured by Gyrolab workstation. A four-parameter regression model with 1/y2 weighting, processed with Softmax Pro 5.4.1 software, was used to regress and evaluate the data.
Results and Discussion
Experimental Design
Plasma and serum are routinely used biological matrices in a bioanalytical lab for sample analysis from clinical and nonclinical studies. Plasma and serum are complex and heterogeneous liquids, containing proteins, lipids, and salts. The chemical and physical properties of plasma can vary between subjects because of the variability of components in each individual’s plasma. Hemolysis is often observed during the generation of plasma, which can bring additional variations of components in plasma. As a result, bioanalytical labs often require transferring a minimum of 5 to 10 µL of samples per analysis to achieve the acceptance criteria of accuracy and precision of quantitation as required by health authorities. However, as the sensitivity of bioanalytical assays has been significantly improved, the need for sample volumes for each measurement can be greatly reduced. However, excess samples are often used for bioanalysis because of the large pipetting volumes required for most liquid handlers. For example, only 4 µL of sample is needed in Gyrolab immunoassays. However, at least 5 to 10 µL of biologics sample is often diluted in PTB buffer with MRD 10 or 100, and the resulting final volume is 50 to 100 µL. To achieve a large dilution factor (greater than 50), serial dilutions are often used rather than direct dilutions, such as in the preparation of standard curves and QCs and MRD steps. The capability of the Echo to handle small volumes of liquid can benefit bioanalytical assays in several aspects of (1) reduced biological sample volumes required per analysis, (2) reduced reagent volumes used in sample preparation, and (3) smaller number of dilution steps by using much larger dilution factors.
Figure 1 summarizes the steps of three commonly used bioanalysis formats. In this study, the Echo was integrated in the following steps: (1) aliquot biospecimen samples, (2) preparation of standard curve (STD) and QCs by direct dilution, and (3) sample dilution (MRD) and reagent addition in immunoassays. For LC-MS/MS assays, the Echo was used only for aliquoting samples, because the destination plate (96-well plate) is not capable of handling a large volume of organic solvent used for sample preparation step. For Gyrolab immunoassays, the Echo was used for both preparation of STD and QCs and sample dilution steps in a 96-well plate to achieve full automation of Gyrolab immunoassays. For microplate ELISA assays, the Echo was used for sample preparation steps, including sample dilution and addition of other reagents in a 384-well plate with reduced sample and reagent volume.
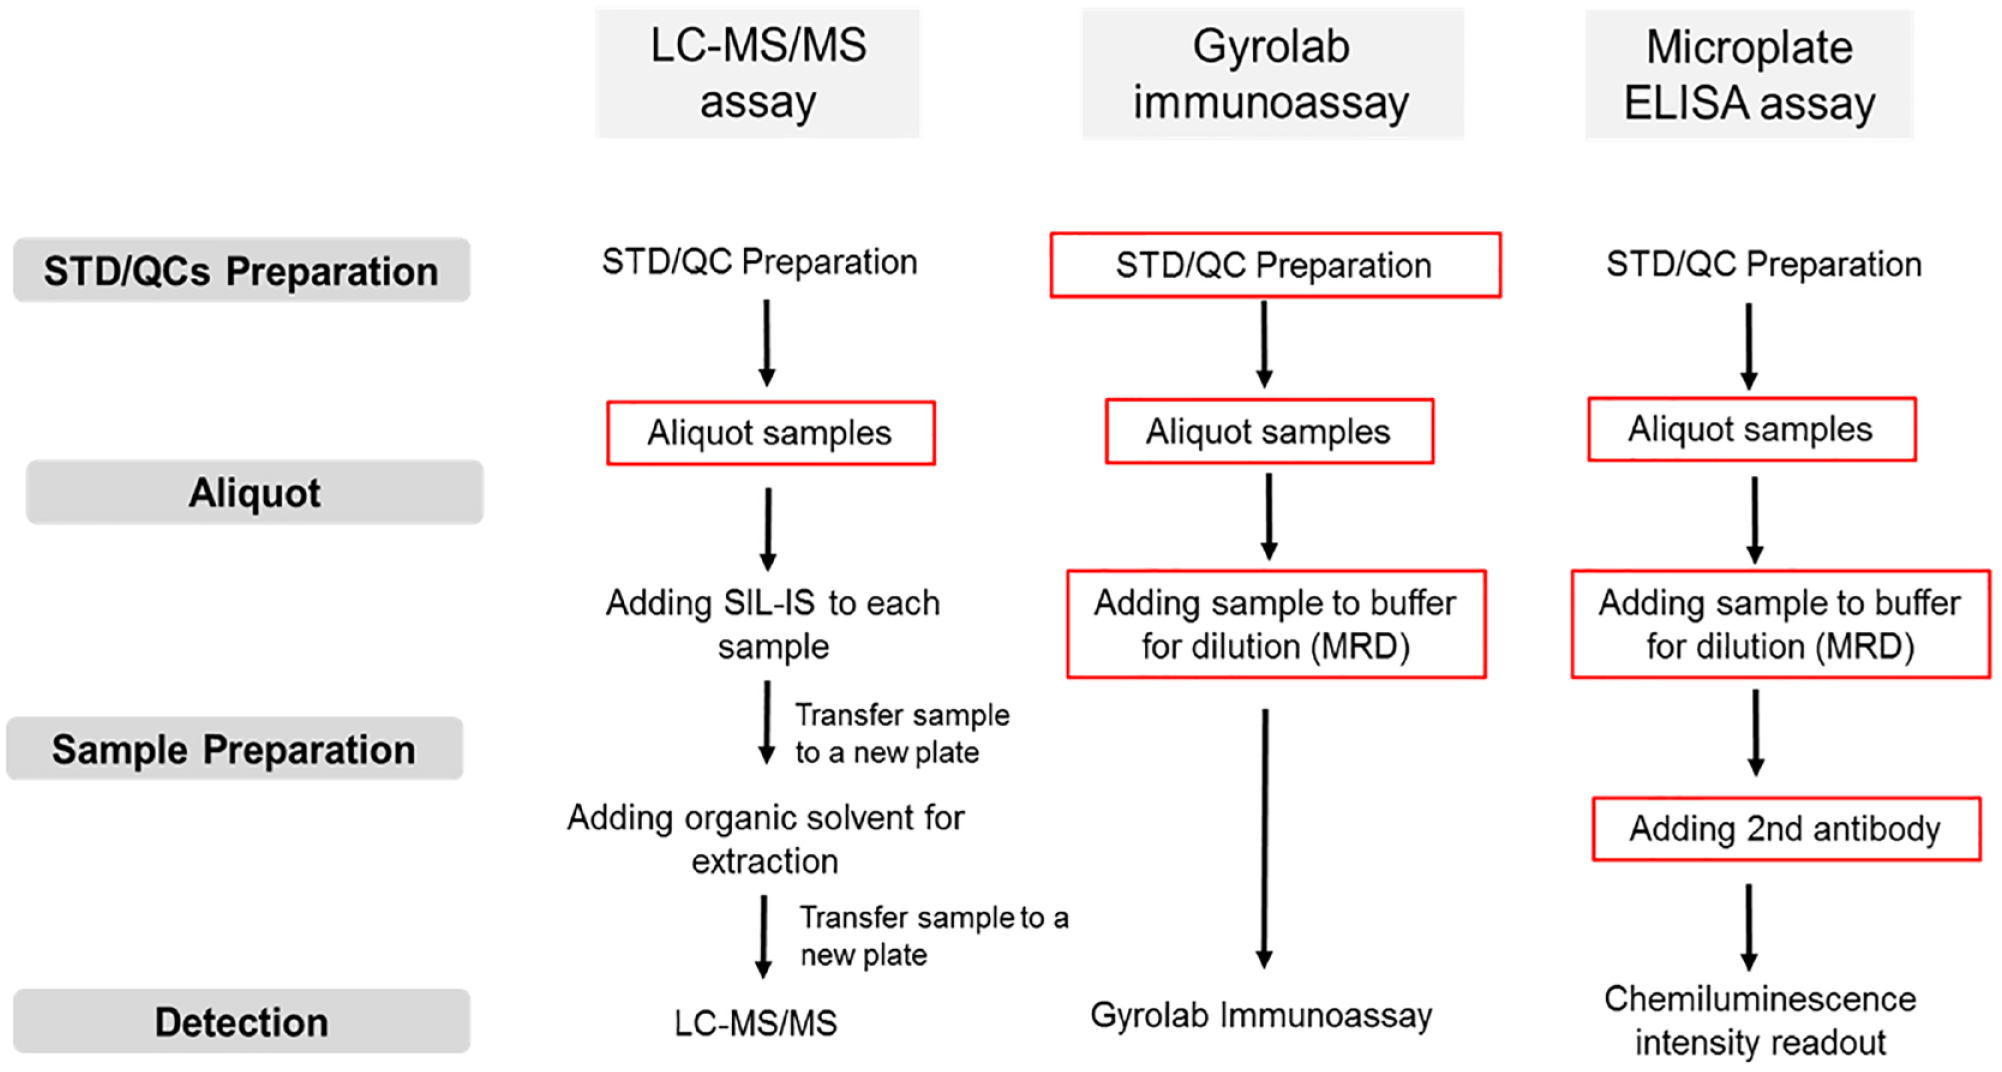
Workflow of integration of Echo into three bioanalysis assay platforms (liquid chromatography tandem mass spectrometry [LC-MS/MS], Gyrolab immunoassay, and microplate enzyme-linked immunosorbent assay [ELISA]). The major steps of the three commonly used bioanalysis formats include the following: (1) preparation of standard curve (STD) and quality control (QC) samples for quantitation; (2) aliquot the same volume of STD, QCs, and sample for analysis; (3) sample preparation steps, which in the LC-MS/MS assay is adding stable isotopic-labeled internal standard (SIL-IS) and organic extraction and in the Gyrolab immunoassay and microplate ELISA assay is dilution with buffer; and (4) LC-MS/MS detection, fluorescence-based detection (Gyrolab immunoassay), and chemiluminescence detection (microplate ELISA assay). For LC-MS/MS assays, Echo was used only for aliquoting samples. For Gyrolab immunoassays, Echo was used for both preparation of STD and QC sample dilution steps in a 96-well plate. For microplate ELISA assays, Echo was used for sample preparation steps, including sample dilution and addition of other reagents in a 384-well plate. The steps performed by Echo were in the red circle.
Because of the complexity and heterogeneity of plasma or serum samples, the variation of components in each plasma/serum sample might influence the ultrasonic acoustic energy needed to transfer a fixed volume. Before applying the Echo in the three assay formats, we first evaluated the consistency and capability of quantitatively dispensing plasma samples with the Echo by using an LC-MS/MS assay, especially with regard to the impact of the matrix on the precision the Echo dispenses. The reason we chose the LC-MS/MS assay for this evaluation is because the capability of normalization of variation from steps other than what the Echo dispenses and the matrix effect on the suppression of the instrumental response by stable isotopic-labeled internal standard.
Precision of Transfer of Individual Plasma Samples from Multiple Species
Plasma samples containing 50 µg/mL of Compound C were prepared by spiking Compound C into plasma samples of commonly used species in a bioanalytical lab, including rat, dog, mouse, rabbit, cynomolgus monkey, and human. Each species had four plasma lots. In addition, human plasma (labeled as Human S in Fig. 2 and Table 1 ) included two hemolyzed plasma lots (lot 1 and lot 2) and two hyperlipidemic plasma lots (lot 3 and lot 4). Each plasma sample was transferred from the source plate to the destination plate eight times (25 nL sample for each transfer) by the Echo using the same parameters in one batch. The same amount of internal standard ( 13 C6-labeled Compound C, internal standard) was added to each transferred sample in the destination plate to normalize the variation during sample preparation and LC-MS/MS analysis. Both Compound C and internal standard were extracted from plasma and detected using LC-MS/MS. Theoretically, the analyte concentration in each transferred sample should be the same, so the same peak area ratio between analyte and internal standard (the internal standard normalized peak area of analyte) should be expected for all transferred samples. Therefore, the precision of the internal standard normalized peak area of analyte was used to calculate the precision of the volume of the sample transferred to the destination plate by the Echo.
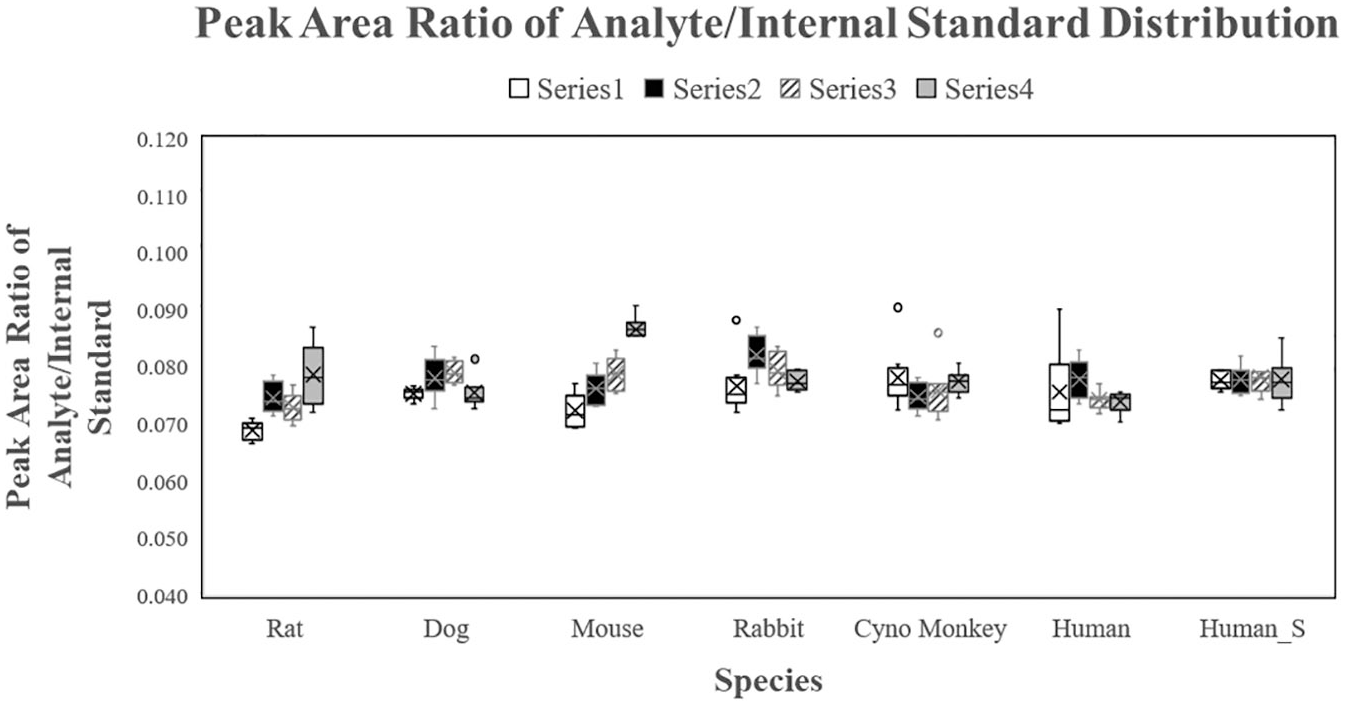
Distribution of the liquid chromatography (LC) peak area ratio of analyte/internal standard from the Echo sample transfer. A total of 1022 sample transfers were performed on 28 plasma samples containing the same concentration of analyte and internal standard from six species and hemolyzed and lipemic human plasma (Human_S) by Echo. Eight transfers were performed per sample. The LC peak area ratio of analyte/internal standard was determined by the concentration of analyte and internal standard in each Echo-transferred sample. Therefore, the same LC peak area ratio of analyte/internal standard is expected from each Echo-transferred sample. As a result, the precision of the internal standard normalized peak area of analyte was used to calculate the precision of the volume of sample transferred to the destination plate by Echo.
Summary of %CV of the Area Ratio of Analyte/Internal Standard Transferred by Echo and Analyzed by LC-MS/MS (n = 8).
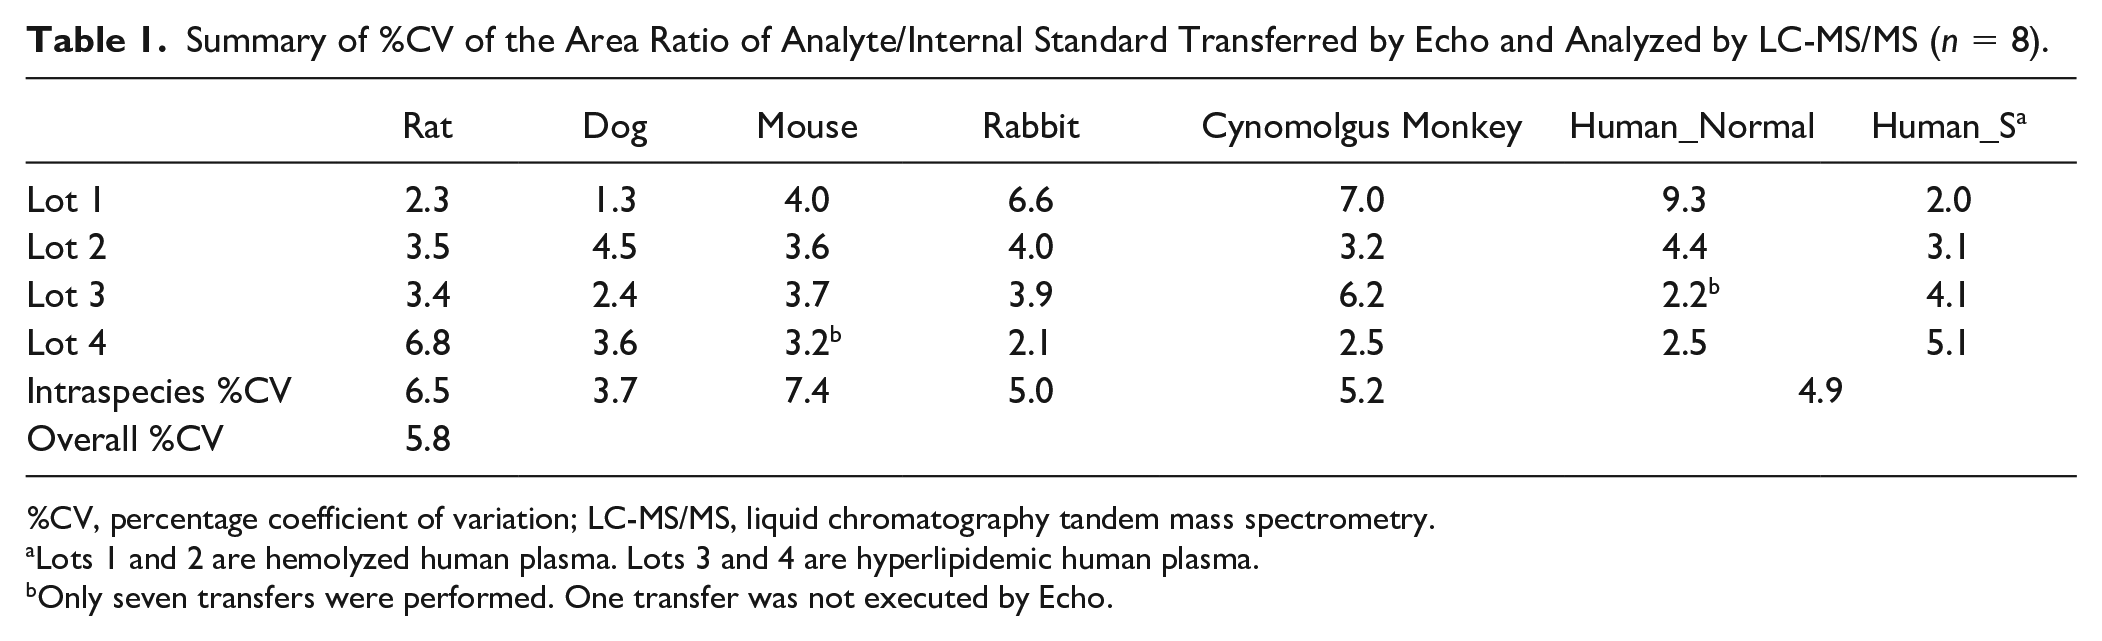
%CV, percentage coefficient of variation; LC-MS/MS, liquid chromatography tandem mass spectrometry.
Lots 1 and 2 are hemolyzed human plasma. Lots 3 and 4 are hyperlipidemic human plasma.
Only seven transfers were performed. One transfer was not executed by Echo.
A total of 1022 sample transfers were performed on 28 plasma samples from seven species by the Echo, with 8 transfers per sample, except for 1 mouse plasma sample (lot 4) and 1 human plasma sample (lot 3). Only seven transfers were executed for these two samples, for which no obvious reason was identified for the failed transfer. The distribution of the peak area ratio of analyte/internal standard from all sample transfers is shown in Figure 2 . The percentage coefficient of variation (%CV) of the peak area ratio of analyte/internal standard was calculated for eight individual transfers from the same sample (%CV of individual sample), all transfers from the same species (intraspecies %CV), and all 1022 sample transfers (interspecies %CV; shown in Table 1 ). The %CV of individual samples for all samples (a total of 28 lots, seven species) was less than 9.3%. The intraspecies %CVs were 6.5%, 3.7%, 7.4%, 5.0%, 5.2%, and 4.9% for rat plasma, dog plasma, mouse plasma, rabbit plasma, cynomolgus monkey plasma, and human plasma (including four lots of normal plasma, two lots of hemolyzed plasma, and two lots of hyperlipidemic plasma), respectively. The interspecies %CV was 5.8%. The precision of 27 of 28 samples and the precision of intraspecies and interspecies transfers were smaller than the Echo’s claim of a CV ≤8%. 27 The requirement for precision of most health authorities is to be within 15% for a validated LC-MS/MS assay; the precision of the individual sample, intraspecies, and interspecies transfers of the Echo was acceptable. The impact from the matrix effect on the precision of transfer plasma sample (intraspecies precision of human) by the Echo was acceptable.
The precision of the Echo transfer was also evaluated by direct transfer of mouse serum containing PE-STA, a protein carrying a fluorescence dye. The %CV of the Echo dispense was calculated using the readout fluorescence. The overall %CV of the 96-well transfer is 5.4%; however, two transfers have outstanding high bias (>25% difference from the mean). Because two transfers with high bias were also observed when the same sample was transferred manually, the bias is more likely from the variation of the fluorescence detector than the Echo dispense.
Evaluation of Quantitative Transfer Sample
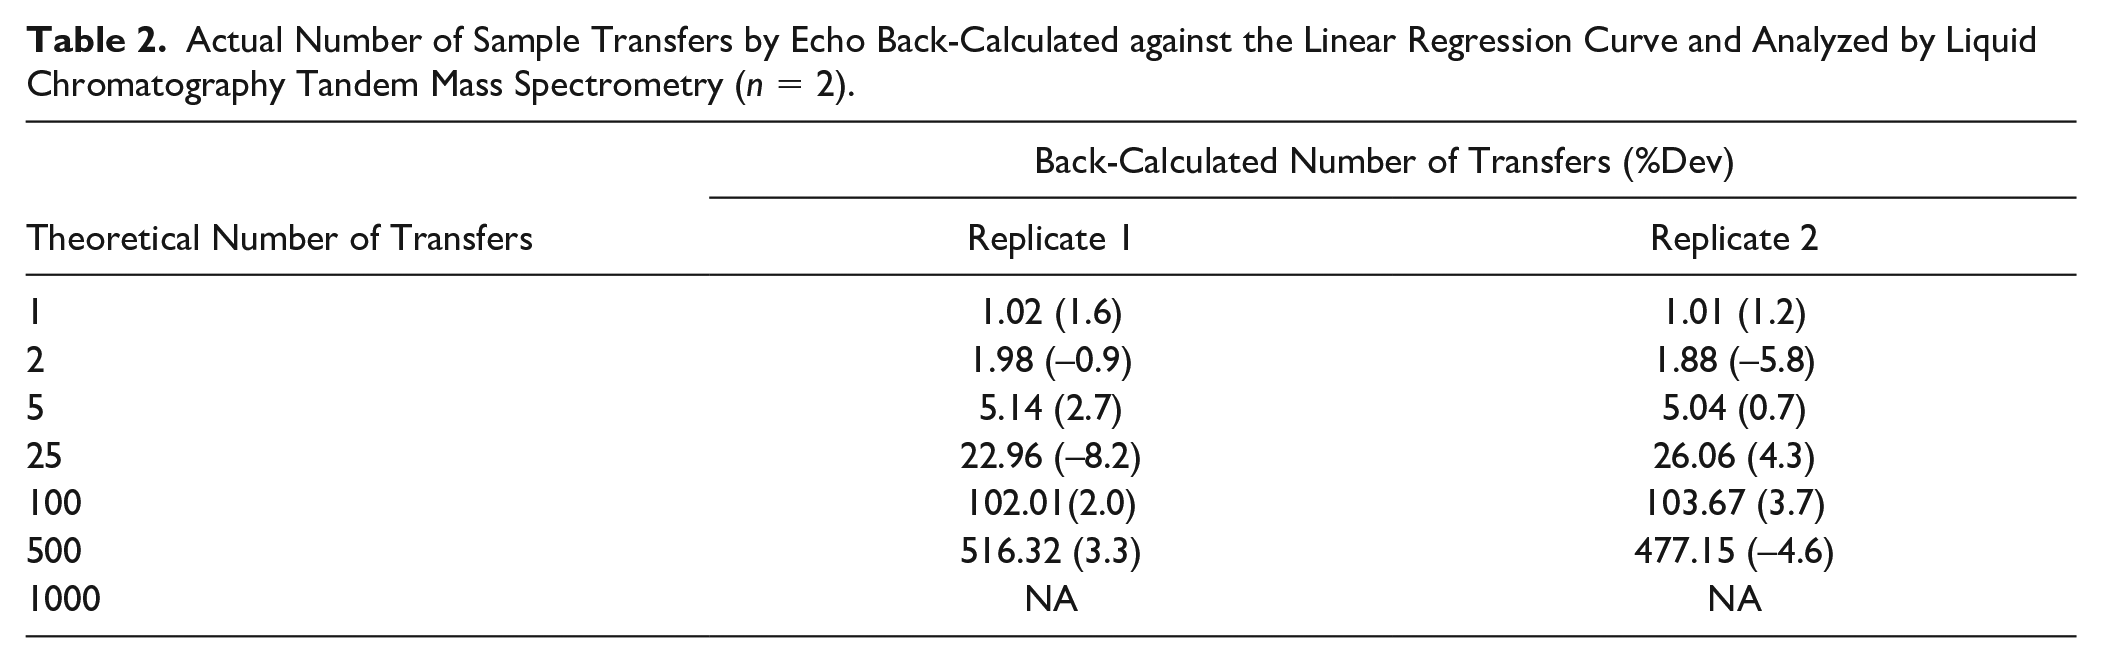
Various volumes of rat plasma containing 50 µg/mL Compound C were transferred from the source plate to the destination plate through multiple transfers by Echo to achieve the desired volumes. The same amount of 13C6–Compound C was added to each sample in the destination plate after transfer as internal standard. The Compound C and 13C6–Compound C were extracted from each sample and analyzed using LC-MS/MS. Because the concentration of analyte in the sample transferred to destination plate was proportional to the number of transfers (and therefore the volume), a linear regression was performed using the peak area ratio of analyte/internal standard for each sample against the theoretical number of aliquot transfers of each sample using Analyst. The actual number of sample transfers by Echo was back-calculated against the linear regression curve. The %Dev of the back-calculated number of sample transfers was used to evaluate the accuracy of volume via multiple aliquot transfers.
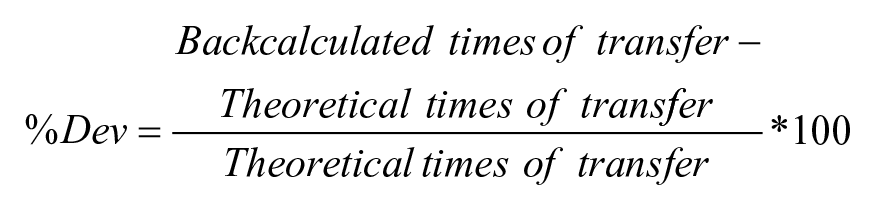
Twelve rat plasma samples with targeted volumes of 25, 50, 1250, 6250, 25,000, and 12,500 nL were transferred to the destination plate with aliquot numbers of 1, 2, 5, 25, 100, and 500, respectively, in duplicate. Compound C was not observed in samples with a targeted volume of 25,000 nL (1000 transfers), whereas the response of the internal standard in these two samples was similar to that of the other samples. The same amount of internal standard was added to all samples on the destination plate after Echo transfer. The detection of internal standard suggests that the sample extraction and detection were correct and there was no compound C sample in the destination plate. Because there were no error messages generated by the Echo for each sample transfer, we are unable to determine if the transfer of the 25,000 nL sample was executed by Echo. Based on our observation, the maximum plasma volume successfully transferred by Echo was 12.5 µL. The %Dev of the back-calculated number of all transfers performed by Echo was within ±10% (shown in Table 2 ).
Actual Number of Sample Transfers by Echo Back-Calculated against the Linear Regression Curve and Analyzed by Liquid Chromatography Tandem Mass Spectrometry (n = 2).
Integration of Echo in Microplate ELISA Assay
Our initial experiment was to test the assay performance when the Echo was used for performing only the sample dilution step (MRD) for the assay. Prior to the Echo additions, each well of the 384-well plate had 9 µL/well of the PTB buffer added manually. Echo was used to transfer 1 µL/well of standards prepared in rat or cynomolgus monkey serum into wells to achieve the final 10% MRD (10-fold dilution of the serum sample). The same standards in a premade 10% MRD format were manually added as 10 µL/well to the same 384-well plate for side-by-side comparisons. The addition of other reagents for the assay were performed manually. The responses of the standard curves are shown in Figure 3a and b , in which rat and monkey serum were used, respectively. The overlapping standard curves from the manual and Echo-assisted preparation processes demonstrate the capability of Echo to deliver a small volume of biological matrices with comparable precision and accuracy to a manual process. In addition, the Echo-facilitated direct in-plate MRD procedure helped with conserving sample and reagent volumes. According to our pipetting best practices, 10 µL is the smallest volume we typically pipet by hand. Therefore, to create a 10% MRD, a minimum of 10 µL of sample and 90 µL of buffer are required. With Echo, the volume requirement was reduced 10-fold (1 µL of sample and 9 µL of buffer) without losing transfer precision and accuracy. Approximately 25 min was required to transfer 10 µL of solution into a 384-well plate by the Echo.
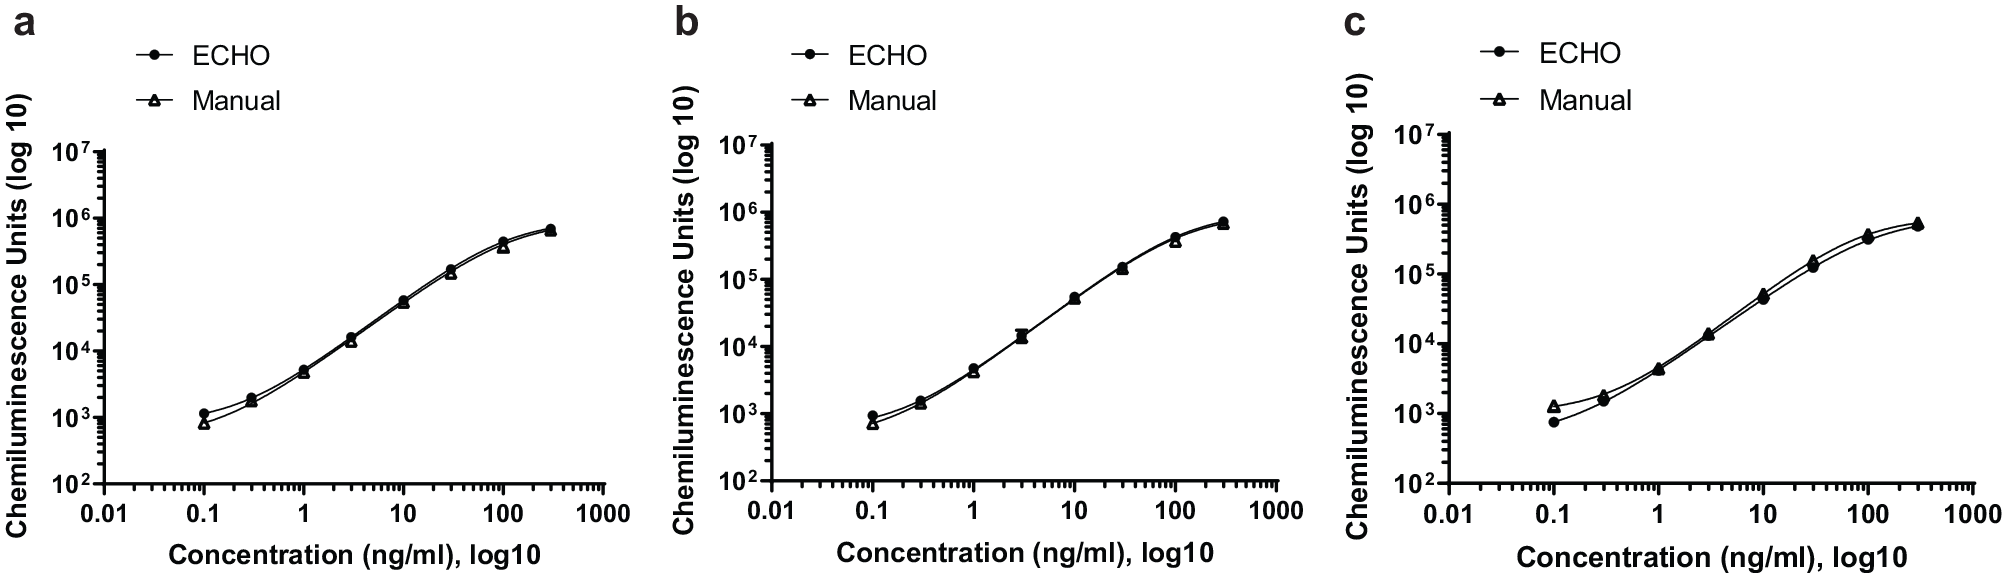
Comparison of the microplate immunoassay calibration curves between manual and Echo liquid transfer. All standard serial dilutions were prepared by hand in either rat or cynomolgus monkey serum. (
The next experiment was to use Echo to add all other assay reagents (10 µL or 20 µL/well) in addition to the MRD step for a set of samples prepared in cynomolgus serum. The results were compared with those obtained by manual transfers of all reagents, as shown in Figure 3c . The overlapping standard curves prepared from both processes demonstrated the Echo’s capability of dispensing different volumes of immunoassay reagents with acceptable accuracy. The results support the use of Echo in facilitating all reagent transfer steps within a 384-well plate-based immunoassay procedure.
Integration of Echo in Gyrolab Immunoassay
Three operation modes of standard and QC preparations were compared: FA, PA, and M, as described in the “Gyrolab Immunoassays” section. The Gyrolab immunoassay standard curve and QC responses were obtained for all three methods. A comparison of the standard curve responses is shown in
Figure 4
. Initially, the standard curve preparation from the FA experiment (
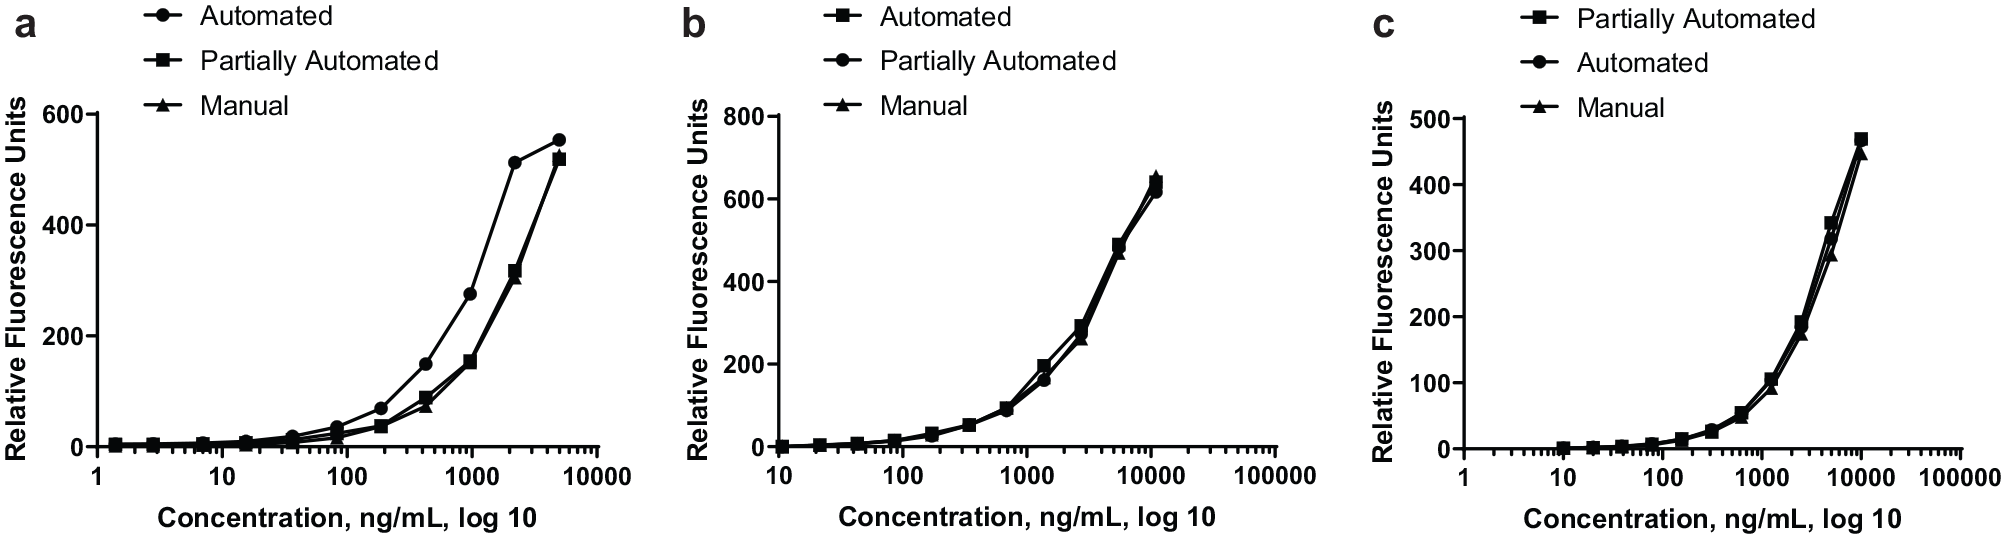
Comparison of Gyrolab immunoassay calibration curves. Preparation and associated minimum-required dilution (MRD) are either completely manual, partially automated, by Echo transfer of manually prepared calibration standards for MRD) or fully automated, Echo used for preparation of calibration curve and transfer for MRD). (
Accuracy of Standards Transferred by Echo, Analyzed by Gyrolab Immunoassay (n = 1).
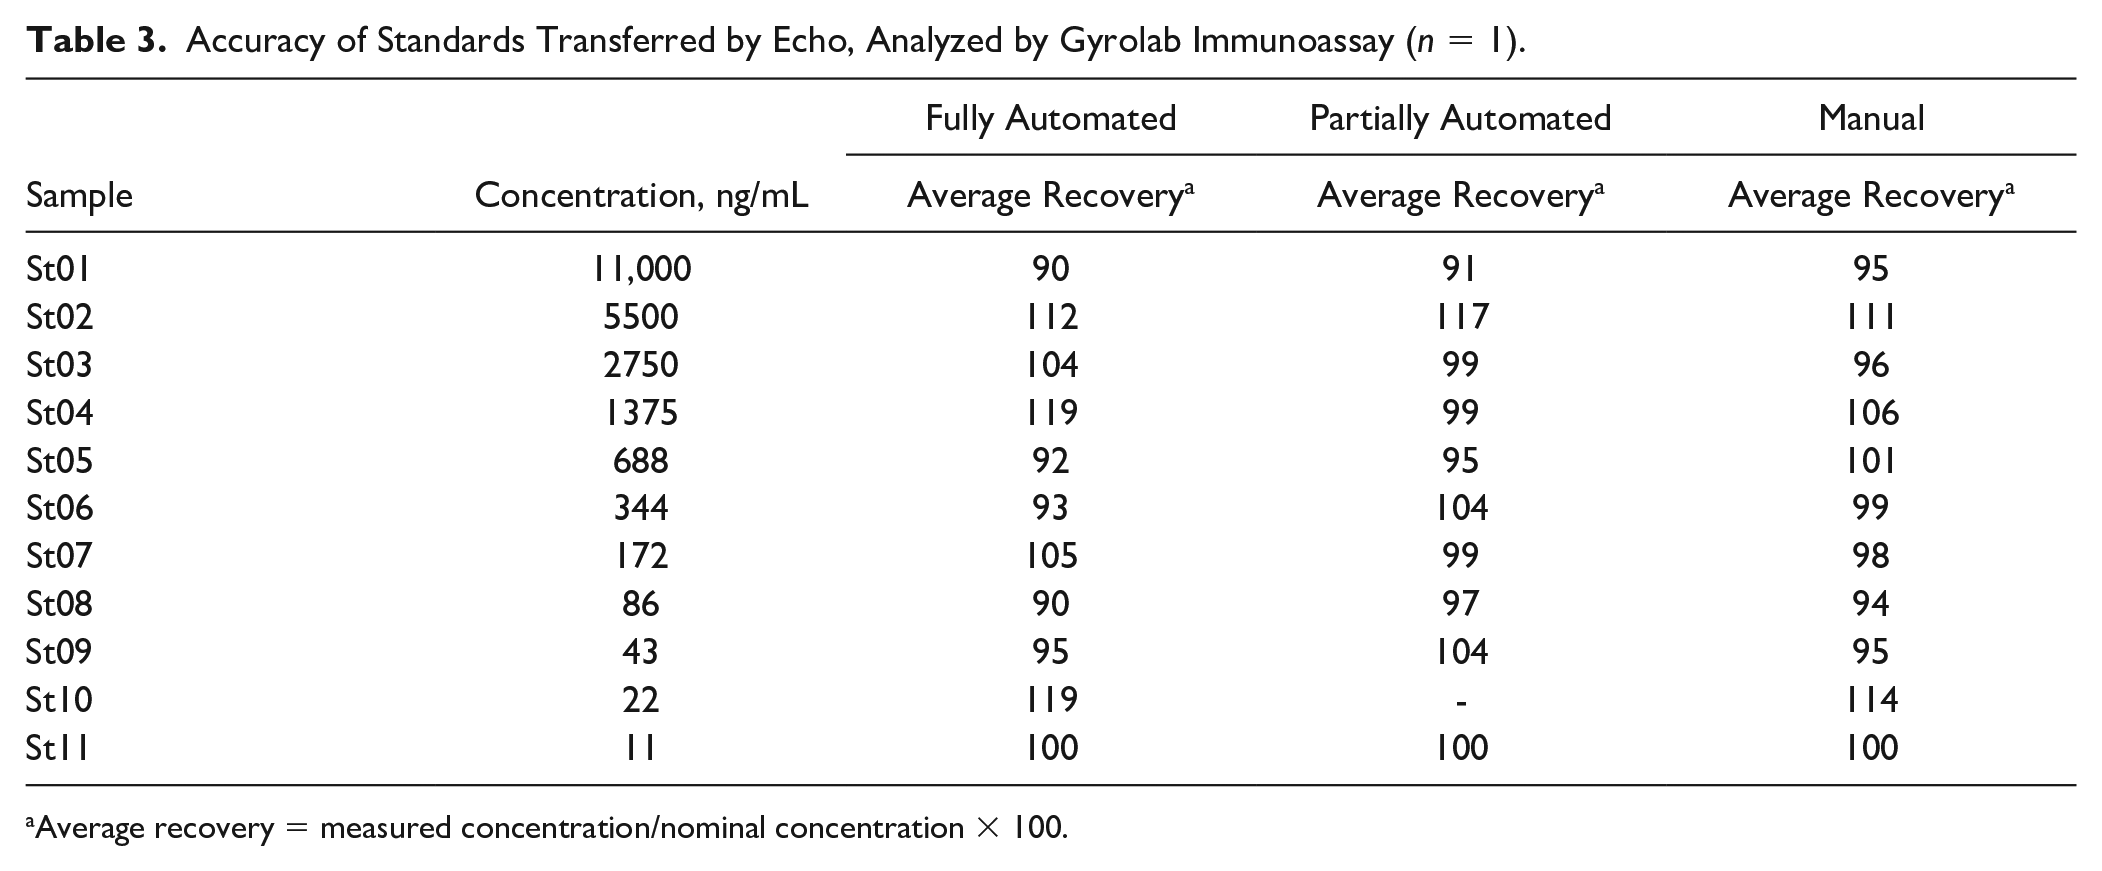
Average recovery = measured concentration/nominal concentration × 100.
Accuracy of QCs (n = 1) Transferred by Echo, Analyzed by Gyrolab Immunoassay.
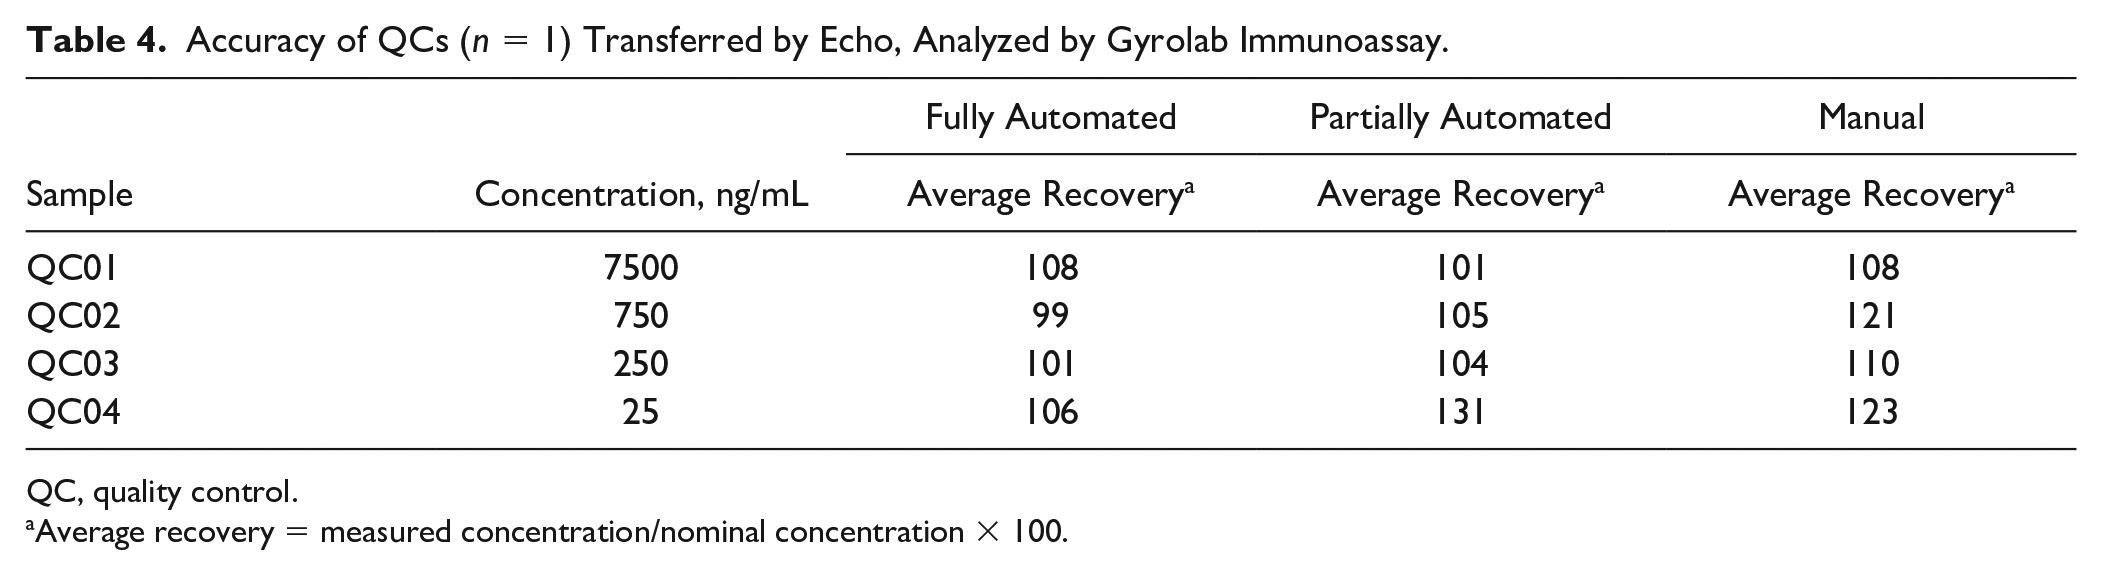
QC, quality control.
Average recovery = measured concentration/nominal concentration × 100.
Integration of Echo in LC-MS/MS Assays
Five-microliter volumes of standard curve and QC samples containing Compound C in rat plasma were transferred to the destination plate by Echo (each sample was transferred 200 times [200 × 25 nL = 5 µL] to achieve 5 µL). The dilution of quality control (Dil QC; DF = 100) was performed in-well by transfer of the Dil QC sample with two transfers and blank rat plasma sample with 198 transfers to the sample well on the destination plate by Echo. The same amount of 13C6–Compound C was added to each sample in the destination plate after Echo transfer as internal standard. Compound C and 13C6–Compound C were extracted from each sample and analyzed using LC-MS/MS.
As shown in Table 5 , the assay accuracy calculated on four replicates of QC samples at each concentration level, expressed as the mean %Dev, was within ±9.0% of the nominal concentration. The precision of four QCs (%CVs) was within 5.4%. The accuracy and precision were comparable with the same assay performed by manual sample aliquoting (%Dev within ±7.5% and %CVs within 8.1%). 6
LC-MS/MS Accuracy and Precision of QC Samples (n = 4) Transferred by Echo.
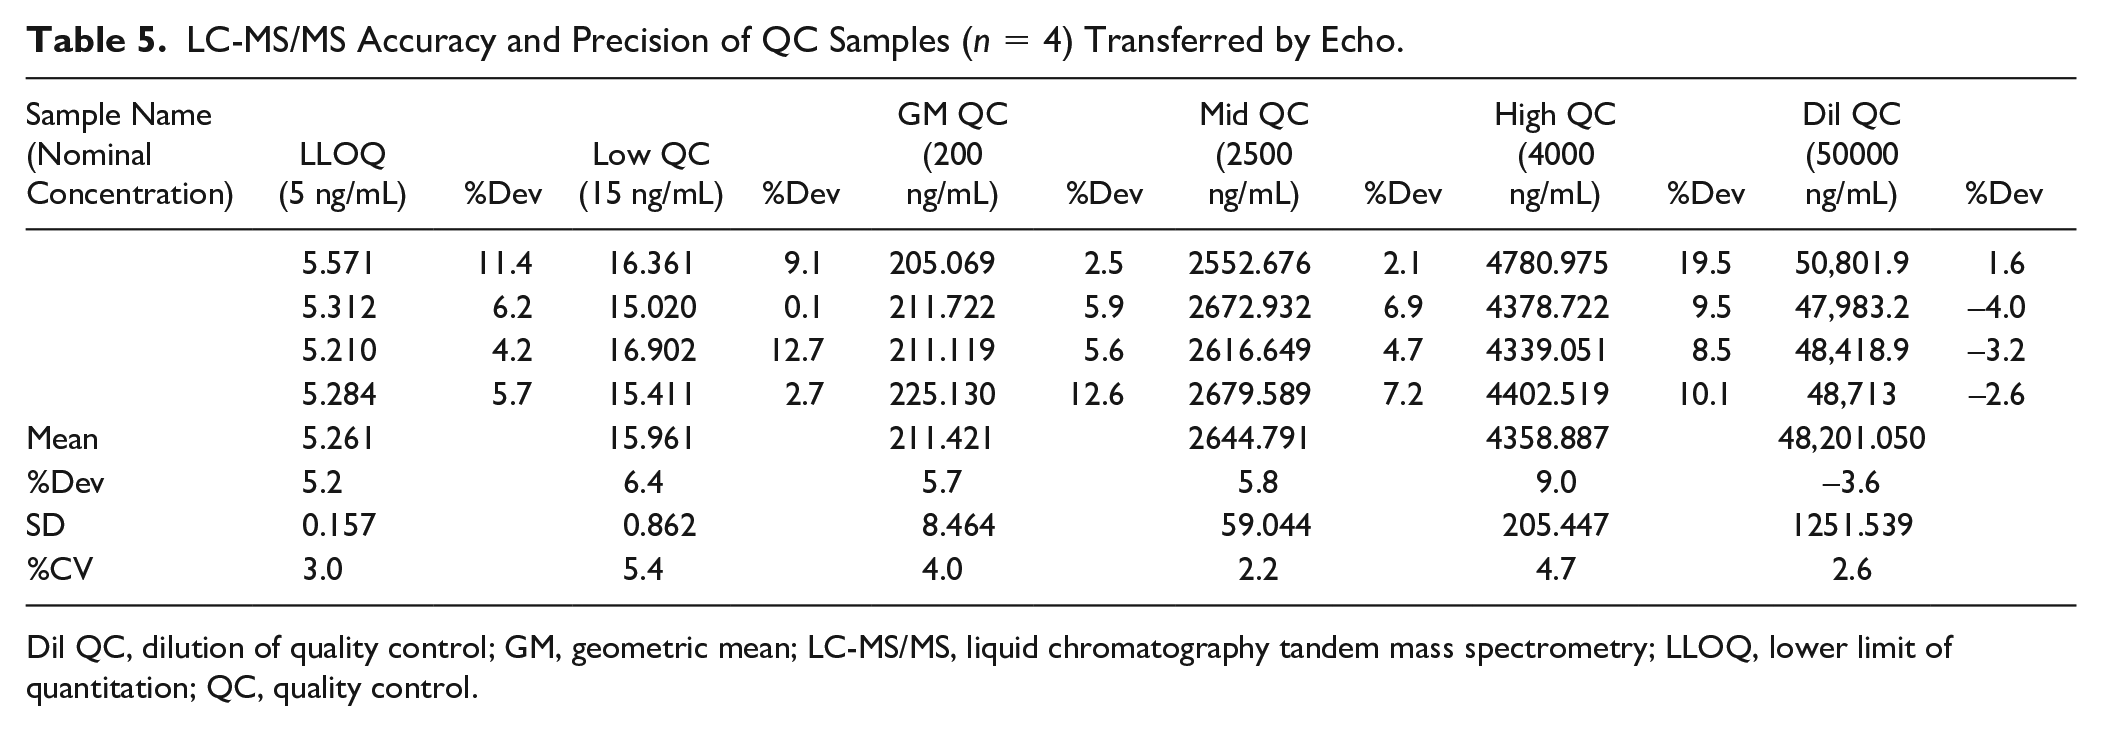
Dil QC, dilution of quality control; GM, geometric mean; LC-MS/MS, liquid chromatography tandem mass spectrometry; LLOQ, lower limit of quantitation; QC, quality control.
Summary and Future Direction
With extensive testing using an LC-MS/MS assay, Echo was evaluated for the precision of transferring individual plasma samples from different species, including plasma with hemolyzed blood and high lipid content. The precision of 27 of 28 samples and the precision of intraspecies and interspecies transfers was less than the Echo’s claim of a CV ≤8%. A comparison between Echo dispense and manual transfers was performed in the following situations: (1) Echo used for MRD preparations (rat and monkey serum) and the addition of all assay reagents (10 µL or 20 µL/well; monkey serum) into a 384-well plate when using the microplate ELISA assay platform. (2) Echo used for the preparation of STD and QCs as well as MRD steps in a 96-well plate to achieve full automation of Gyrolab immunoassays in mouse and monkey serum. We found that a mechanical mixing step is critical after preparation of STD or QCs by Echo to create a homogenous solution before aliquoting. (3) Echo used for aliquoting STD/QCs in LC-MS/MS assay. The equivalent assay performance of Echo for the transfer of biological samples and standards and QC preparation, reagents, and diluents for ligand binding assays demonstrated the feasibility of the integration of Echo into the bioanalysis workflow. The acoustic sample/reagent handling will enable quantitative bioanalytical assays with significantly reduced sample and reagent consumption and therefore may generate significant cost savings of valuable samples and expensive matrices.
Further optimization of workflows is needed to achieve the full advantages of this technology in bioanalysis. Sample integrity during sample transfer in the Echo needs to be further investigated for the small sample volumes collected, stored, and transferred. For example, the possible effects of evaporation, absorption, and so forth need to be mitigated. Additional sample transfers from the collection vials used at preclinical sites/clinical sites to an Echo-compatible plate are needed at a bioanalytical lab. A process that simplifies or eliminates the need for additional transfer steps should be further investigated. The current sample collection vials used at preclinical/clinical sites are usually individual vials, and each sample is currently labeled to meet compliance requirements for the chain of custody of the samples. An innovative tracking system needs to be in place to ensure the integrity of the sample identities. Additional investigation is needed for identifying and remedying the sporadic failures of sample delivery without alerts (as mentioned above) in a few instances (0.2%–2%). With the continued collaboration between industry and equipment manufacturers, the Echo could have a significant impact on drug discovery and development by enabling quantitative analysis of biological matrix samples with microvolume sample collections.
Footnotes
Acknowledgements
The authors would like to thank Yulia Kim and Ang Liu for their involvement in the evaluation. The authors also would like to thank Renuka Pillutla for management support.
Declaration of Conflicting Interests
The authors declared no potential conflicts of interest with respect to the research, authorship, and/or publication of this article.
Funding
The authors received no financial support for the research, authorship, and/or publication of this article.