
Abstract
Acoustic liquid handling uses high-frequency acoustic signals that are focused on the surface of a fluid to eject droplets with high accuracy and precision for various life science applications. Here we present a multiwell source plate, the Echo Qualified Reservoir (ER), which can acoustically transfer over 2.5 mL of fluid per well in 25-nL increments using an Echo 525 liquid handler. We demonstrate two Labcyte technologies—Dynamic Fluid Analysis (DFA) methods and a high-voltage (HV) grid—that are required to maintain accurate and precise fluid transfers from the ER at this volume scale. DFA methods were employed to dynamically assess the energy requirements of the fluid and adjust the acoustic ejection parameters to maintain a constant velocity droplet. Furthermore, we demonstrate that the HV grid enhances droplet velocity and coalescence at the destination plate. These technologies enabled 5-µL per destination well transfers to a 384-well plate, with accuracy and precision values better than 4%. Last, we used the ER and Echo 525 liquid handler to perform a quantitative polymerase chain reaction (qPCR) assay to demonstrate an application that benefits from the flexibility and larger volume capabilities of the ER.
Introduction
Acoustic droplet ejection (ADE) uses high-frequency sound waves that are focused on the surface of a fluid to eject droplets with high accuracy and precision. This method is especially effective at the nanoliter scale, where other more traditional methods for dispensing fluids, such as pipette-based methods, struggle to achieve accurate and precise volume transfers. The physics of ADE and its application has been an area of active research and development for nearly a century; 1 however, in recent decades, the application of ADE has made substantial contributions as a tool for the life sciences. Companies and researchers have developed methods to acoustically eject fluids for various applications, such as mixing compound libraries stored in DMSO,2–4 control cell patterning from single cell to multiculture,5,6 protein crystallography, 7 and the direct loading of small-molecule samples into a mass spectrometer (MS) for high-throughput screening (HTS). 8
Labcyte Inc. (Sunnyvale, CA; henceforth, Labcyte) takes a comprehensive approach in its implementation of ADE for life science applications. To provide a complete acoustic liquid handling solution, Labcyte integrates multiwell plate automation with acoustic droplet ejection of fluids with varying physical properties, such as DMSO and aqueous fluids, with software that helps manage the user’s workflows. Labcyte is introducing a new consumable product, the Echo Qualified Reservoir (ER), which enables users to transfer milliliters of volume (i.e., several microliters per well) to a multiwell plate using ADE ( Fig. 1A ). The ER is a two- by three-well, American National Standards Institute (ANSI) standard compatible source plate that has a maximum starting volume of 2800 µL of fluid per well and a dead volume of 250 µL per well. The ER paired with the Echo 525 liquid handler, which transfers droplet volumes in increments of 25 nL, enables workflows for life science applications that were previously less practical. However, transferring fluids acoustically at this volume scale presents several technical challenges.
Introduction to the Echo Qualified Reservoir (ER), Dynamic Fluid Analysis (DFA), and high-voltage (HV) grid. (
The two primary functional requirements for achieving robust volume transfers using ADE are (1) highly accurate and precise ejection of droplets having constant volume while maintaining good trajectory toward the destination plate and (2) coalescence of the transferred droplets at the destination plate to achieve the total target volume. The physics governing hydrodynamics at the fluid surface during ADE are complex and remain an active area of research. In a simplified static model, one can consider the ejection of droplets as a balance of forces between the incoming focused acoustic energy, the viscous properties of the fluid that dissipate the acoustic energy, and the surface tension of the fluid, which works to minimize its surface area to volume ratio. However, upon initiating a rapid (e.g., hundreds of times per second) acoustic transfer process, dynamic surface deformations such as the formation of capillary waves 9 introduce time-dependent complexity to the process. 10 Furthermore, the relative importance of forces acting on the fluid, such as surface tension and gravity, change as the fluid volume is depleted within the well.11,12 Therefore, successfully diagnosing the energy required to acoustically eject a droplet from the fluid surface requires frequent auditing of the fluids’ surface energy under dynamic transfer conditions.
Following the ejection of a droplet from the fluid surface, it must reach the correct destination well and coalesce with the previously transferred droplets. The trajectory of the droplet is governed, in part, by the electrostatic environment, the focus of the acoustic signal near the fluid surface, and velocity of the droplet toward its destination (discussed later in detail). Labcyte has several strategies for managing focus on the fluid surface,13,14 and we neutralize the electrostatic environment by using a deionization step prior to transfer. 15 Droplet coalescence at the hanging droplet is dependent on several factors, such as the physical properties of the fluid, diameter of the droplets, 16 and the electromagnetic field environment.16–18 Once two droplets within an electric field make contact, they produce a conical shape (so-called Taylor cone 19 ), which forms a liquid meniscus bridge between the two fluids. The fluid then reduces its surface free energy as quickly as possible by coalescing the two droplets into one, thereby minimizing the surface area. Droplet coalescence is less energetically favorable for fluids containing surfactants, which reduce the surface tension of the fluid and introduce surface elasticity from the surfactant monolayer. 20 Electrocoalescence of droplets in an electric field has previously been demonstrated in microfluidic assays as a method of merging multiple droplets together, usually aqueous droplets within an oil medium.21–23 However, droplets are usually geometrically confined within flow-based microfluidic channels or manipulated electrodynamically over an electrode array. 24 During acoustic droplet ejection, poorly stabilized droplets of dissimilar size impact in air, with the incoming droplet approaching at varying angles and velocities, which creates a more complex interaction for droplet coalescence to occur. Thus, achieving droplet coalescence using ADE becomes increasingly difficult for larger volumes (from dispensing larger diameter droplets), particularly for surfactant-laden or viscous fluids that are commonly used in the life sciences.
In this study, we highlight two Labcyte technologies—Dynamic Fluid Analysis (DFA) methods 25 and the high-voltage (HV) grid 26 —that enable accurate and precise acoustic liquid handling of aqueous fluids with varying physical properties. First, we demonstrate how DFA methods (described in detail in Hadimioglu et al. 1 ) are employed to dynamically audit the fluid during the course of a transfer and adjust the acoustic power applied to the fluid surface to meet changing energy requirements. Briefly, this is accomplished by sending a subejection pulse to create a perturbation at the fluid surface followed by an interrogation pulse, and the Echo 525 liquid handler analyzes the complex return signal; DFA algorithms either immediately identify the correct solution after this step, or the process is repeated, increasing the power of the outgoing acoustic signal to make increasingly larger perturbations on the fluid surface ( Fig. 1B ). Second, we show how the use of an HV grid enhances droplet coalescence at the destination stage ( Fig. 1C ). We use both volume measurements and the velocity of droplets in flight to characterize the implementation of these technologies. Last, we use the ER and Echo 525 liquid handler to perform a quantitative polymerase chain reaction (qPCR) assay. This example demonstrates a typical use case of a viscous, surfactant-laden fluid that would be difficult or impossible to transfer acoustically at this larger volume scale without these critically enabling technologies.
Materials and Methods
Solutions for Volume Characterization
Several different solutions were used varying in surface tension and viscosity. All solutions were doped with sodium fluorescein (Sigma-Aldrich, St. Louis, MO; PN F-6377), at a concentration of either 7.5 µM or 0.15 mM in 1× phosphate-buffered saline (1x PBS; Sigma-Aldrich; PN D1408). To vary surface tension of the fluid, Triton X-100 (Sigma-Aldrich; PN T9284) was added at concentrations of 0.001 to 0.042 v/v%; to vary viscosity of the fluid, solutions containing 0% to 30% glycerol (Sigma-Aldrich; PN G5516-1L) doped with sodium fluorescein (henceforth, fluorescein) were used. Two different methods were used to characterize the volume transferred into the destination plate from the ER. The first method used fluorescence of transferred fluids, which has been previously shown to accurately report the transfer volume. 27 Once the fluorescein-spiked solutions were transferred from the ER to the destination plate (Greiner Bio-One, Monroe, NC; PN 781096), 50 µL of 10 mM sodium hydroxide solution was added to each well. The plates were centrifuged at 190 g for 1 min, incubated for at least 5 min at room temperature, and read on a Synergy H4 microplate reader (Bio-Tek, Winooski, VT). Relative fluorescence unit (RFU) values were converted to volumes against a standard curve. For all volume read measurements, the coefficient of variation (CV) was found by dividing the standard deviation of the volume reported from the plate read by its average volume over the plate. The second volumetric method, used only when transferring 5 µL per well, required calculating the transferred volume based on the volume of fluid remaining in the ER well (a plate read method is currently in development). Once a transfer was completed, the remaining fluid was immediately reverse-pipetted from the well in 10-µL or 100-µL increments; 70 µL was then added to the calculation of the removed volume, as this was found to be a good estimate for unrecoverable fluid in the well for fluids transferred in this experiment. The sum of the reverse-pipetted solution and 70 µL yielded the total volume transferred to the destination plate. Based on gravimetric measurements, this method was found to be accurate within 5%.
Characterizing Acoustic Power Requirements for ADE
The Echo 525 liquid handler (Labcyte) was used to eject, or audit using DFA algorithms without ejection, a surfactant solution (as described in “Solutions for Volume Characterization”) containing 0.0029 v/v% Triton X-100 from the ER (Labcyte) to a 384-well destination plate. For measurements used to assess the droplet threshold for the “quiescent” fluid conditions, two methods were used. The first method incrementally increased the acoustic power delivered to fluid surface by 0.1-dB steps with DFA algorithms disabled, and the increments occurred between columns of the destination plate (every 16 destination wells). The droplet threshold was identified as the point where droplets began depositing onto the destination plate. For the second method, DFA algorithms were enabled and a transfer protocol was executed over 384 destination wells, but the instrument was set to only solve for the droplet threshold and not apply enough power to transfer droplets. For all measurements, each of the 384 power solutions prescribed by the DFA algorithms were averaged and reported as the droplet threshold. After these measurements were performed at the starting fluid volume (2.8 mL), 100 µL or 200 µL was removed using a micropipette, the solution was allowed to settle (at least 30 s), and another measurement was taken. To measure the droplet threshold for dynamic fluid conditions in a depletion mode, fluid was ejected at a repetition rate of 200 Hz, 6.65 µL per destination well to dispense through the working volume continuously in one 384-well assay plate. The droplet threshold as a function of fill volume is reported in decibels (dB) relative to the droplet threshold at 200 µL. The 6RES_AQ_GPSA2 calibration—designed to transfer aqueous fluids containing some surfactant out of the ER—was used for these experiments.
Imaging Droplets Using Camera
To measure droplet velocity as a function of droplet number dispensed, a high-speed camera (Point Grey Research, Richmond, Canada) and LED strobe (custom built) coupled to an Echo 525 liquid handler were used to illuminate and capture the droplets in flight. Custom software was used to interface the Echo 525 liquid handler with the camera and automatically analyze droplet velocities. Velocity vectors were then averaged and reported for each transfer condition. The standard error (SE) was calculated for each data point and described in captions as they were not visible as error bars. Fluid transfers were performed from A1, where the camera was focused, and dispensed to a Labcyte 384-well plate with a clear seal (GE Healthcare, Piscataway, NJ; PN 7704-0001) covering the surface of the plate. For experiments characterizing droplet velocity as a function of grid voltage, the ER was filled with 2 mL of solution, electrically neutralized by temporarily grounding to the Echo 525 liquid handler, and then 100 nL (four droplets) per destination well of 1× PBS with 0.003 v/v% Triton X-100 solution was dispensed. The same procedure was followed for experiments with DFA enabled or disabled, but 5 µL (200 droplets) per well was transferred. Variations of the 6RES_AQ_GPSA2 calibration were used for these experiments.
Droplet Bounce Experiments
The Echo 525 liquid handler was used to eject a surfactant solution (as described in “Solutions for Volume Characterization”) containing 0.0029 v/v% Triton X-100 from the ER to a destination plate under variable electric field strengths. The nominal potential of the HV grid was changed 0 to 1 kV in 100-V increments and then changed from 1 to 10 kV in 1-kV increments. Following each transfer, the fluid from the ER source plate was replaced and electrically neutralized to the grounded Echo 525 liquid handler prior to transfer. Starting fluid volume was 2 mL, and up to 2000 droplets (10 wells, 5 µL per well) were captured and analyzed for each data point. For experiments relating droplet velocity and HV grid potential for different power calibrations, the same fluids, starting volume, and electrical discharge methods were used, but only 100 nL per destination well was transferred from A1 of the ER. The identical transfer protocol was used for experiments determining droplet bounce for different power settings, but a 384-well destination plate was used to determine volume in the well. Droplet bounce was classified as having at least 20% of the target volume missing from the well (e.g., 75 nL instead of 100 nL). For droplet bounce experiments with variable surfactant concentration, the “Baseline” power calibration was used, and the HV grid was set to 1 kV. Average and SE for velocity vectors are reported. Each data point was measured three times (n = 3). Variations of the 6RES_AQ_GPSA2 calibration were used for these experiments.
Milliliter-Scale Depletions and Volume Characterization
The Echo 525 liquid handler and ER were used to transfer 3 µL per well of the 0.0029% Triton X-100 surfactant solution with 7.5 µM fluorescein to a 384-well destination plate. The solution was filled in A1 of an ER source plate, with a new source plate used for each transfer. The solutions were transferred using the RES_AQ_GPSA2 calibration, with DFA algorithms enabled/disabled, the HV grid enabled/disabled, or some combination of the two conditions. The volume characterization was conducted as described in “Solutions for Volume Characterization.” For the Qualification Test, 5 µL per well transfers from the ER were performed. The ER was filled with 2362 µL of solution, the plate was centrifuged at 190 g for 5 minutes, and the transfer volume was determined as described in “Solutions for Volume Characterization.” The 6RES_AQ_GPSA2 and 6RES_AQ_GPSB2 calibrations were used for the 5-µL per well transfer experiments.
qPCR Cross-Contamination Assay
An ER was filled with three different reagents to perform a qPCR assay to investigate the variation of crossing over points (Cp) as a measurement of transferred pUC19 plasmid deoxyribonucleic acid (DNA) amplification. The assay reagents were transferred to a Roche (Basel, Switzerland) 384 PCR plate, with 96 pUC19 plasmid DNA transfers per plate in a checkerboard pattern; a total of three qPCR plates were tested (n = 3). The reagents were transferred using two different calibrations on the Echo 525 liquid handler: 6RES_AQ_GPSA2 was used to transfer the Master Mix (MM), and 6RES_AQ_BP2 was used to transfer the pUC19 plasmid DNA and Tris EDTA (TE) buffer. The pUC19 plasmid DNA was diluted to 1 × 10⁻⁵ times its initial concentration prior to dispensing. A MM at 2× concentration and 300 nM primer mix was added first, followed by either a nontemplate control (NTC) solution containing 0.1% TE buffer or a DNA template-containing solution (final reaction condition of 1× MM, 150-nM primer). The following materials were used to perform the assay: DNAse/RNase free, PCR grade water (Roche; PN 03315932001); LightCycler 1536 DNA Green Master Mix (#05573092001); Roche LC480 sealing foil (#0472975700); LC1536 multiwell plates (#05358639001); pUC19 plasmid DNA (#SD0061); M13/pUC reverse sequencing primer (–46); 24-mer (#SO115); Tris Buffer, 0.3M solution (Fisher Scientific, Pittsburg, PA; #BP1761-1); and Roche 384-well plates (white, #04729749 001). The Lightcycler 480 (Roche; Indianapolis, IN) and Echo 525 instruments were used to perform the assay.
Results
Variable Acoustic Energy Requirements in ER
The acoustic energy needed to eject a droplet from a body of fluid changes depending on the surface energy of the fluid. The fluid’s surface energy results from a combination of factors such as the physical properties of the fluid—primarily its surface tension and viscosity, the geometry and surface energy of the fluid container, and surface fluid motion (e.g., capillary surface waves). Therefore, we sought to characterize the amount of acoustic energy required to eject a droplet out of the ER as a function of fill volume for two states of the fluid: (1) an undisturbed, or “quiescent” starting condition, where the fluid had not recently undergone ADE, and (2) a dynamic condition, where the fluid surface is repeatedly undergoing ADE at a high rate (i.e., hundreds of ejections per second). Two methods were used to characterize the quiescent state of the fluid. The first method relies on a sweep of the acoustic ejection energy, whereby the acoustic energy delivered by the instrument to the fluid surface was incrementally increased until the first droplets reached the destination plate. This determined the acoustic power required to begin ejecting droplets, or the droplet threshold. The second method employed DFA algorithms, which dynamically audits the acoustic energy requirements of the fluid to determine the droplet threshold and then adjusts the power settings of the instrument accordingly ( Fig. 1B ).
For the quiescent state, we found that the droplet threshold in the ER decreased as the fluid volume decreased ( Fig. 2A ). Thus, a power calibration that models the quiescent condition would require less power as the fluid is depleted from the ER. Furthermore, we found good agreement between the experimental determination of the droplet threshold and the algorithmic solution using DFA methods. In contrast to the quiescent fluid state, we found the droplet threshold increased as the fluid was depleted from the ER using ADE ( Fig. 2B ). Importantly, this result suggests that using a model for quiescent fluid conditions to identify dynamic states is not only incorrect, but the two states also have opposing trends. For example, the droplet threshold decreased by ~0.2 dB compared with the 2.8-mL starting volume after 2 mL of fluid was removed, and the fluid was allowed to settle to a quiescent state ( Fig. 2A ); however, when fluid was in a dynamic state during a fluid transfer using ADE, the droplet threshold increased by ~0.6 dB compared with the 2.8-mL starting volume ( Fig. 2B )—a difference of 0.8 dB between the two measurements.
Difference in acoustic power requirements as a function of fill volume in the Echo Qualified Reservoir (ER) between a “quiescent” fluid surface and dynamic “depletion mode” fluid surface. (
DFA Maintains Droplet Velocity over Milliliter-Scale Transfers
We sought to determine whether DFA methods were correctly predicting the droplet threshold by measuring the velocity of droplets in flight during ADE. We found that droplet velocity is a sensitive measurement of acoustic energy required for uniform droplet dispensing, as the relationship between the droplet velocity and acoustic power above the droplet threshold is linear for relevant ranges of power (
Dynamic Fluid Analysis (DFA) power adjustment required to maintain droplet velocity. (
Analysis of the velocity vectors showed that the velocity remained between 0.92 and 0.96 m/s for the first 30,000 droplets transferred when DFA methods were enabled ( Fig. 3B ). However, when DFA was disabled and a constant acoustic power was applied, the droplet velocity decreased from 0.96 to 0.76 m/s over the same transfer range. Note that the degradation in droplet velocity continued below 0.7 m/s ( Fig. 1A ), but velocities could no longer be determined using our tracking software once the droplets merged in the stroboscopic images. An inspection of the first 50 droplets transferred shows the droplet velocity decreased as the surface of the fluid entered a dynamic depletion state, but the DFA algorithm identified the shift in energy requirements and increased the voltage applied to the transducer, stabilizing the velocity at 0.92 m/s ( Fig. 3C ). These results demonstrate that an increase in acoustic energy is required during larger ADE transfers from the ER, and DFA correctly identifies this changing condition.
Droplet Bounce as a Function of HV Grid Potential and Surfactant Concentration
Following the ejection of a droplet from the fluid surface, the droplets must coalesce at the destination plate for robust acoustic liquid handling performance. We found that droplets tend to bounce (henceforth “droplet bounce” or DB) off of the hanging droplet at the destination plate when they are in a low electric field environment, but this failure mode was mitigated at higher electric fields (
Fig. 4A
and
High-voltage (HV) grid mitigates droplet bounce (DB). (
In addition to characterizing the relationship between HV grid potential and DB, we assessed the impact of increasing surfactant concentration on DB. We chose a power setting (baseline calibration) and HV grid potential (1 kV) that was sensitive to DB ( Fig. 4D ) and found that the frequency of DB tended to increase as the surfactant concentration increased ( Fig. 4E ). When the surfactant concentration was increased to well above the critical micelle concentration (CMC, 0.042 v/v% Triton X-100), DB occurred in a majority of the 384 destination wells.
DFA and HV Grid Enable Precise and Accurate Fluid Transfer
To show that the HV grid and DFA are required for accurate and precise transfer of aqueous fluids in ER, we performed a 1.15-mL depletion (3 µL per destination well) with the technologies enabled, disabled, or some combination ( Fig. 5A , B ). As expected, we found that the fluid transferred most accurately (average volume less than 1% deviation from nominal) and precisely (CV less than 2.5%) with DFA and the HV grid enabled. When either technology was disabled, low-volume outliers occurred during the depletion, likely due to droplets bouncing off of the hanging droplet. In the other conditions, the accuracy was 1.5% to 26% of the nominal volume; the CV range increased to between 3.9% and 26.4%. Qualitatively, poor droplet coalescence and fluid captures on the walls of the assay plate wells were observed when DFA and/or the HV grid were not enabled. Thus, despite maintaining reasonable accuracy and precision for the DFA-enabled, HV grid-disabled condition, the experiment benefited from bouncing droplets getting captured on the side walls of the assay plate and would not allow for robust acoustic liquid handling performance overall.
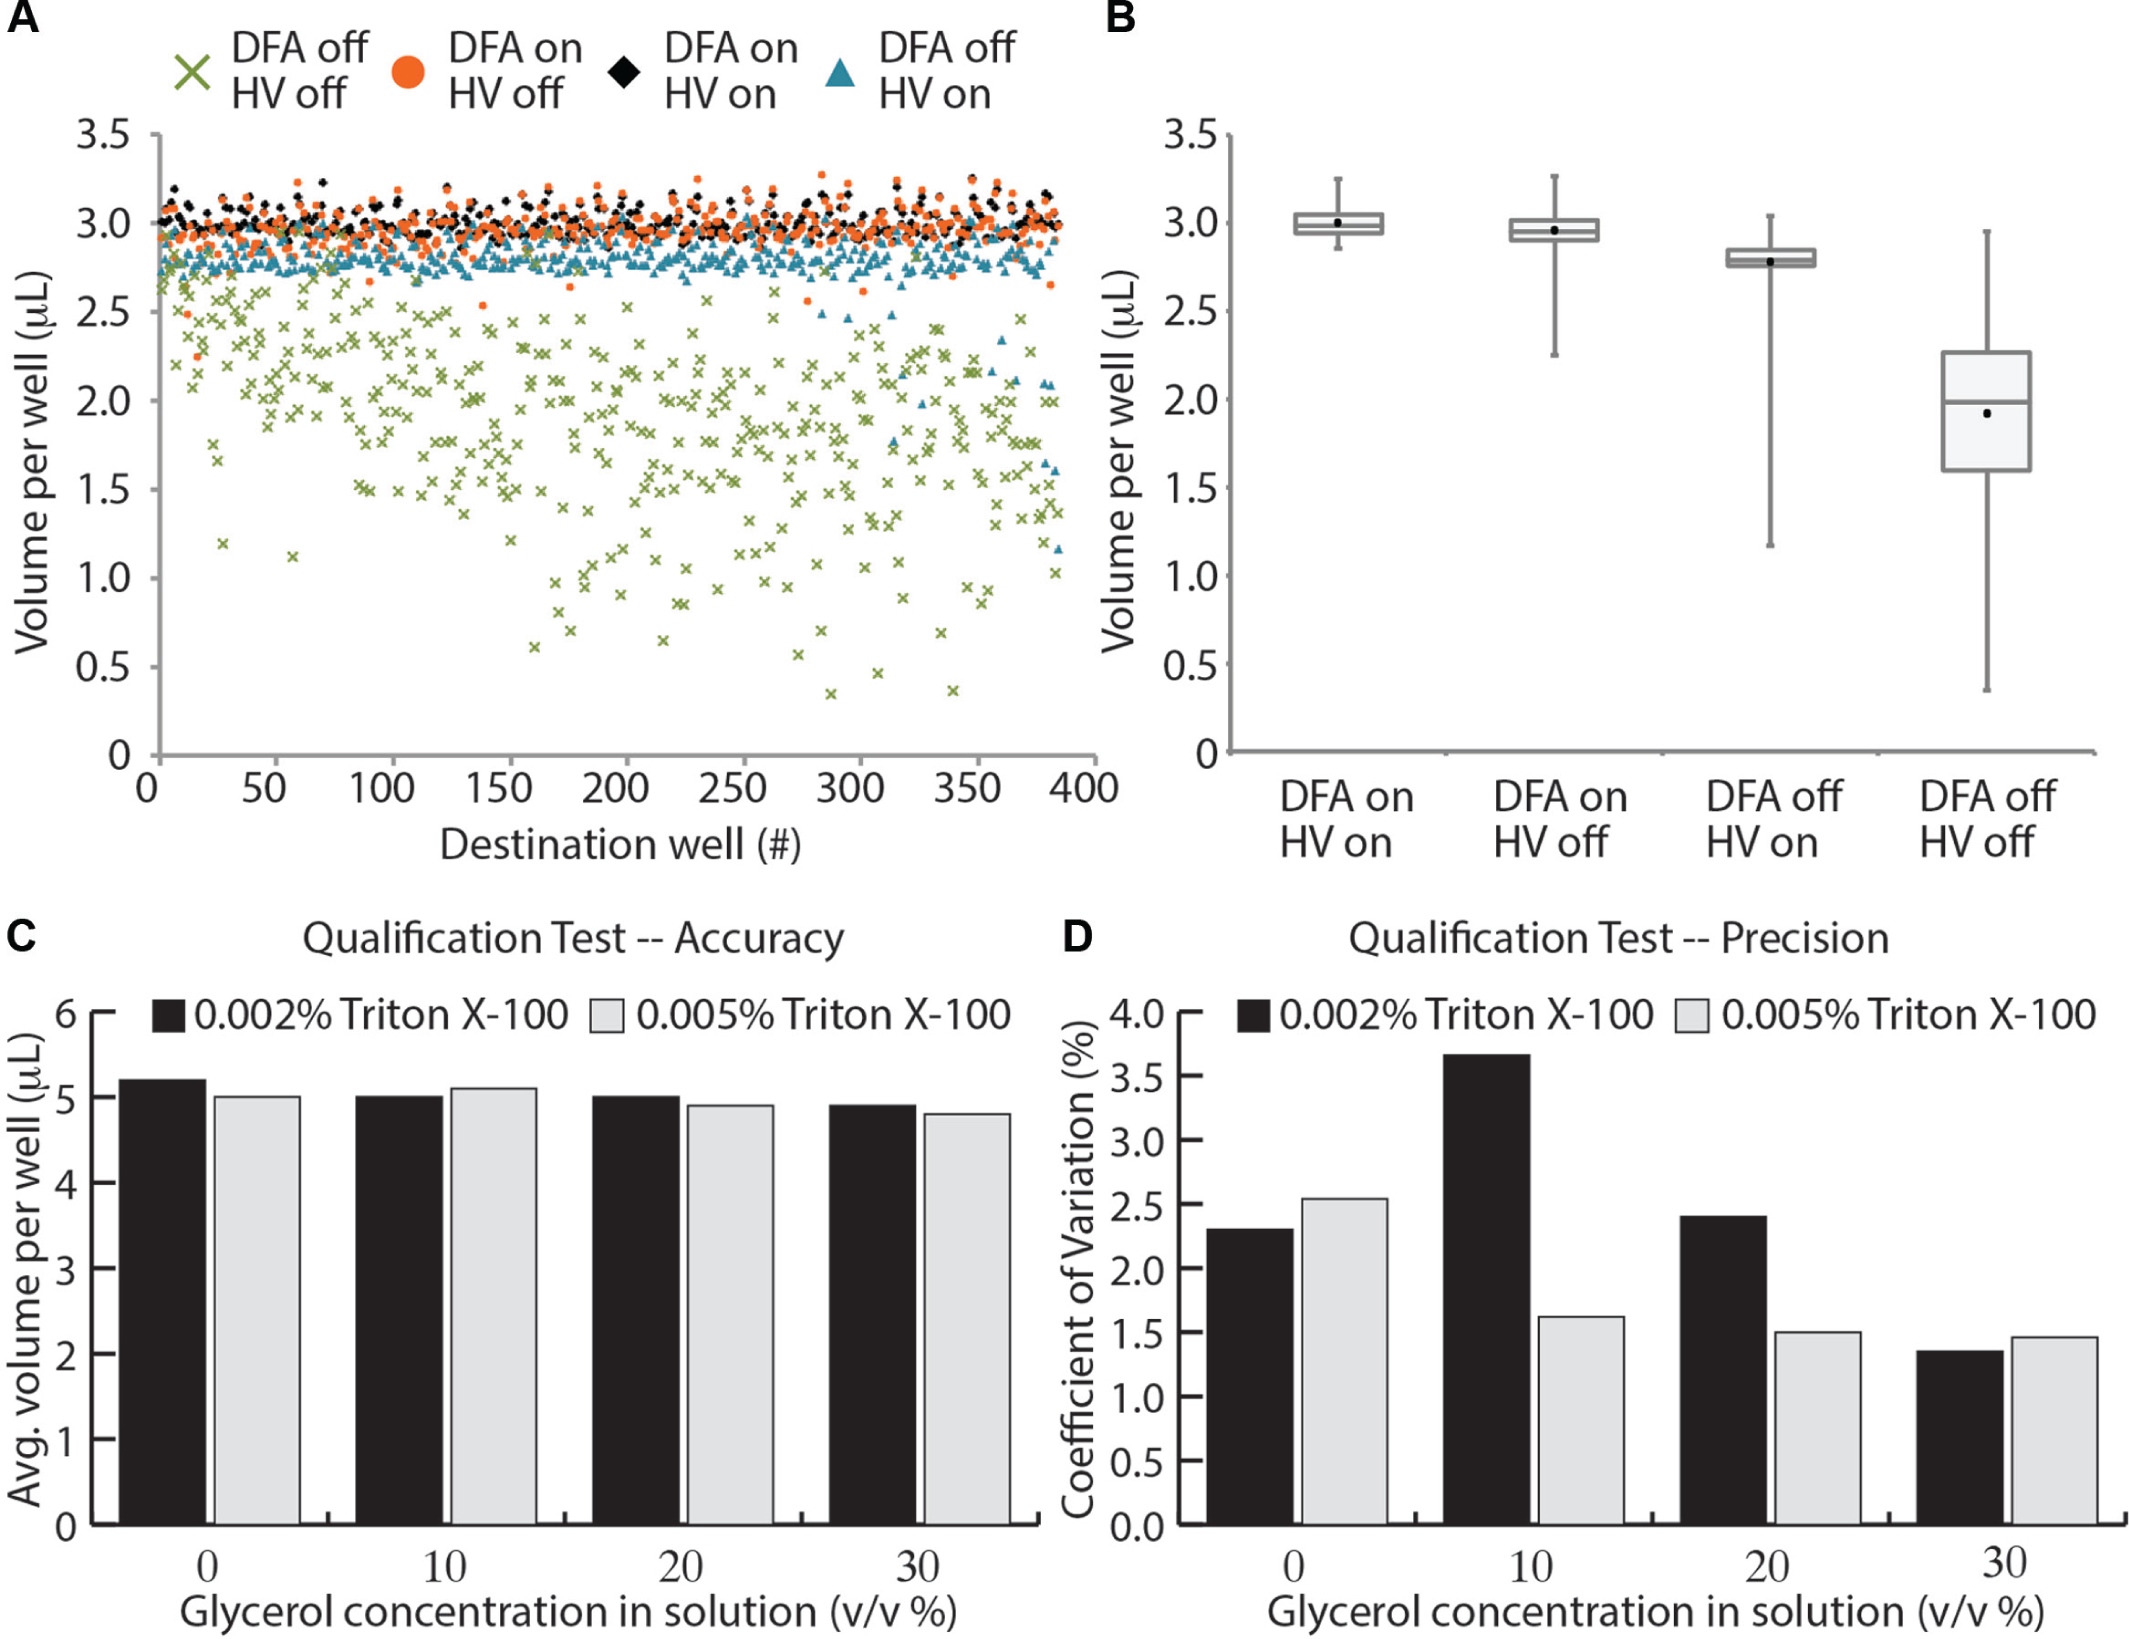
Dynamic Fluid Analysis (DFA) and high-voltage (HV) grid are required for milliliter-scale fluid depletions. (
To further demonstrate the capability of the ER to transfer fluids with varying physical properties, we conducted a Labcyte Qualification Test (see Materials and Methods) to assess the accuracy and precision for fluids with different concentrations of surfactant (10% and 25% CMC) and viscosity (0%–30% glycerol). We successfully transferred 5 µL per destination well for all fluids tested, with accuracy values ranging from 96% to 103% of the nominal value and CV values between 1.5% and 3.7%.
qPCR Assay Using ER
We used the Echo 525 liquid handler and ER to perform a qPCR assay, demonstrating a potential use case for the products. The assay was performed with the pUC19 plasmid DNA transferred in a checkerboard pattern (see Materials and Methods and
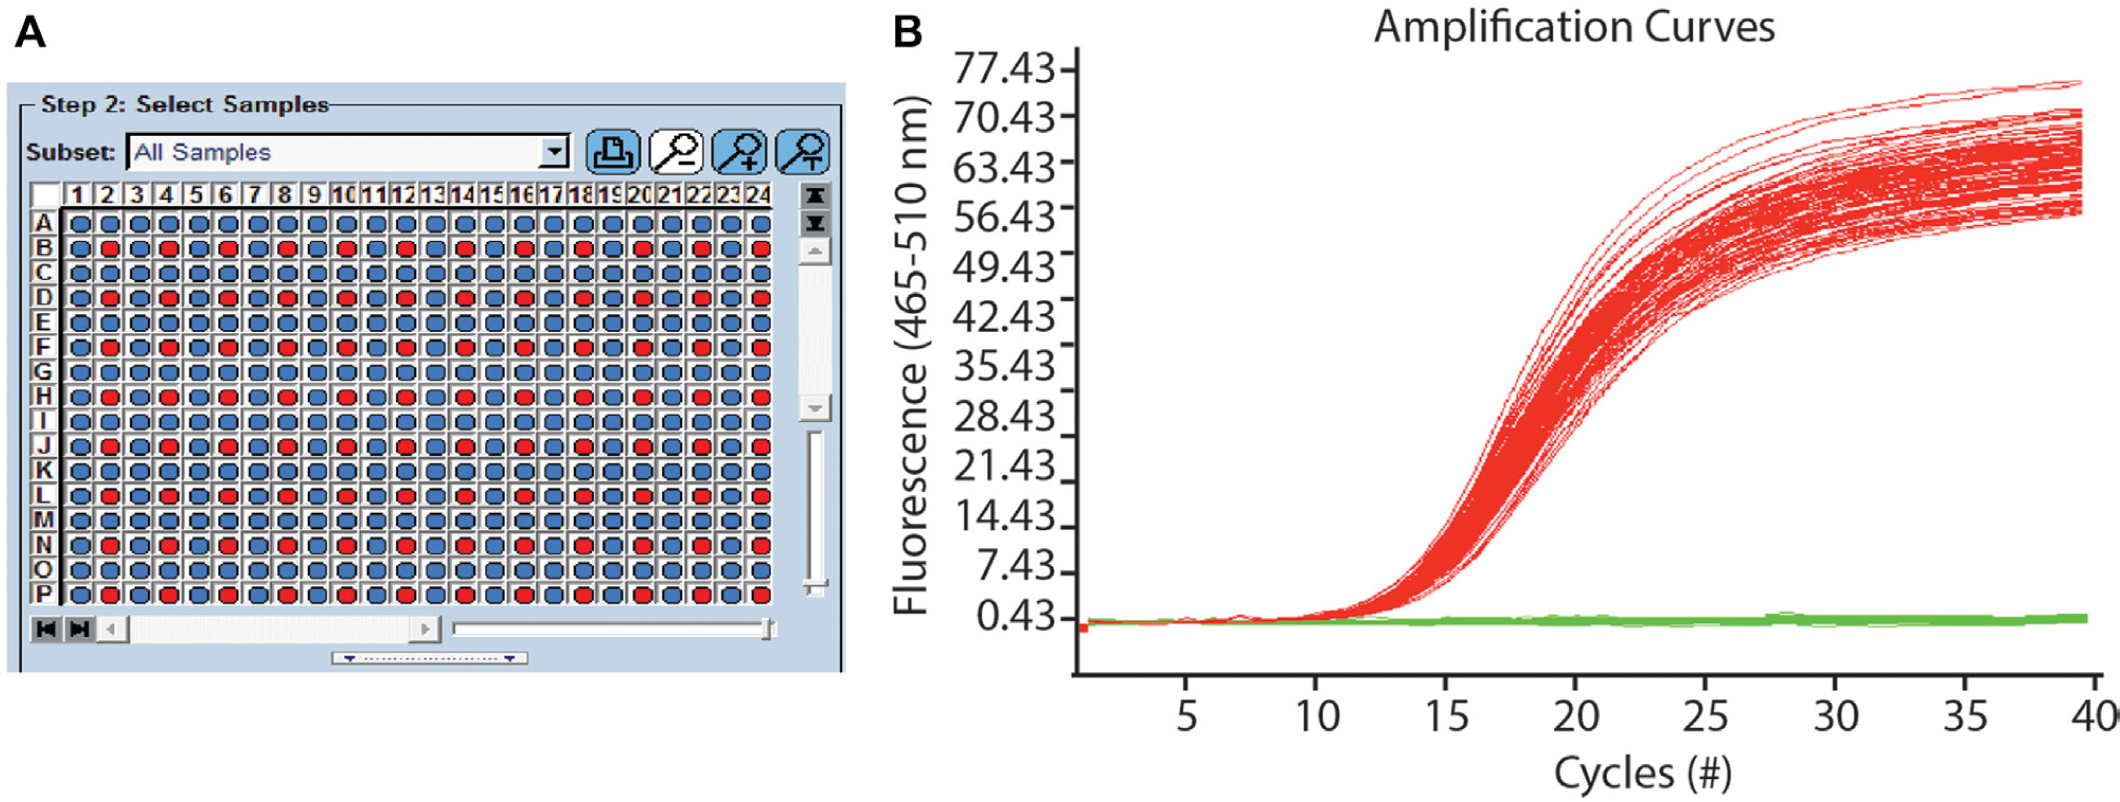
Echo Qualified Reservoir (ER) used for quantitative polymerase chain reaction (qPCR) assay to characterize cross-contamination. (
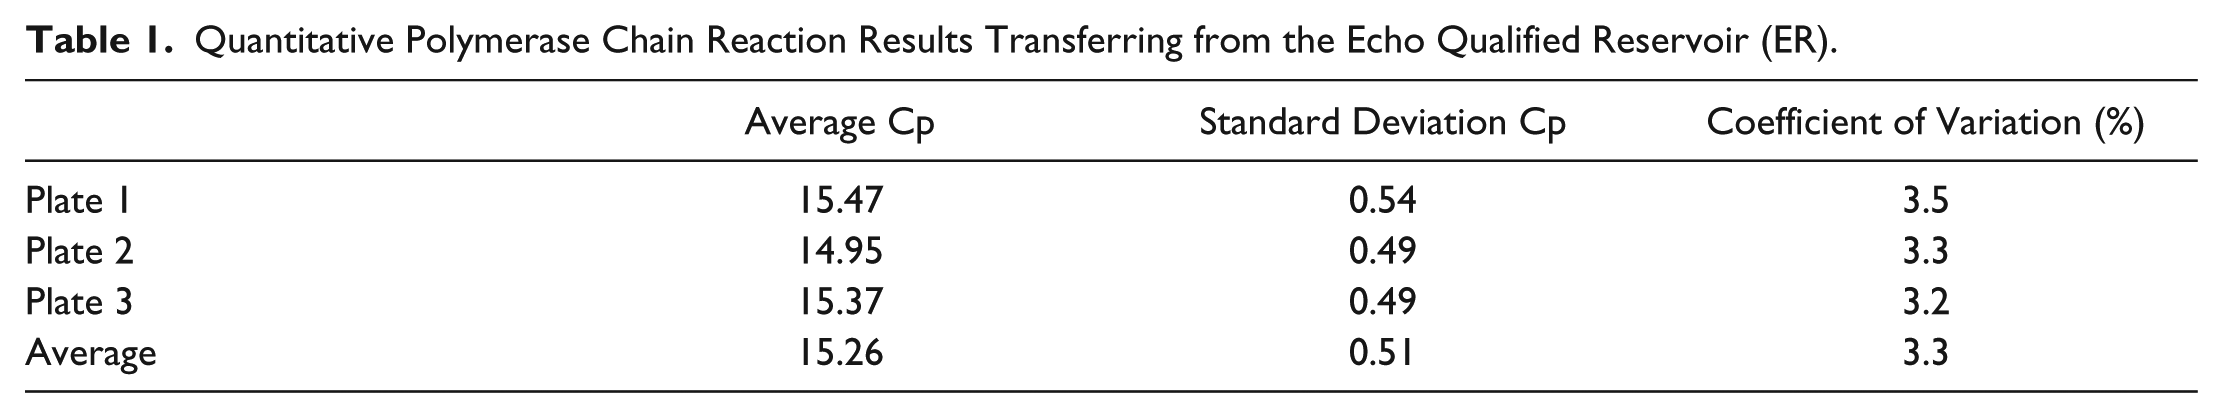
Quantitative Polymerase Chain Reaction Results Transferring from the Echo Qualified Reservoir (ER).
Discussion
Robust acoustic liquid handling requires accurate and precise ejection of droplets from fluids with varying physical properties, coalescence of the transferred droplets at the destination well, and hardware and software solutions to manage and perform the user’s workflow. Acoustic liquid handling solutions that meet these requirements have been available for several years for both DMSO- 28 and aqueous-based 29 fluids but have focused on smaller volume dispenses based on a 2.5-nL droplet. The Echo Qualified Reservoir targets workflows that benefit from a few source wells to many destination wells on the milliliter volume scale. However, we have found that both reliable ADE at the source well and droplet coalescence at the destination well led to additional technical challenges at this scale. Two somewhat related failure modes—low-velocity droplets and droplet bounce at the destination well—were readily observed during larger volume transfers.
In the ER, we observed that the acoustic energy required to eject a droplet from the fluid surface is dependent on, among several other factors, whether the fluid is undergoing rapid ADE and generating capillary waves or in a quiescent, undisturbed state. For instance, we found that the droplet threshold was about 0.8 dB higher when transferring 2 mL of fluid acoustically compared to when the fluid was removed with a micropipette and allowed to settle (
Fig. 2
). Even for calibration techniques used by Labcyte that are somewhat tolerant to changes in power for volume accuracy (
To characterize the relative contributions of both the charge on the droplet (or lack thereof) and lower velocity droplets to the incidence of DB at the destination well, we conducted a series of experiments modulating the power of the acoustic signal and HV grid. We found the incidence of DB at the destination wells decreased as the velocity increased for a given HV grid setting ( Fig. 4C ). Interestingly, taking the data presented in Figure 4B–D together, the dominant factor driving droplet coalescence appeared to be velocity of the incoming droplet, although charge on the droplet clearly improved coalescence. In these experiments, DB was only eliminated for each power setting when the droplet velocity reached ~1.25 m/s, although this value would likely change with the surfactant concentration of the fluid ( Fig. 4E ). This critical velocity was reached at lower HV grid voltage settings for droplets dispensed with more acoustic energy—3 kV for “BL + 0.7 dB,” 8 to 9 kV for the intermediate power settings, and 10 kV for the “baseline” power setting. However, DB was reduced for lower velocity droplets when charged by an electric field compared to higher velocity droplets without externally imparted charge. For instance, the velocity of droplets transferred using the “BL + 0.7 dB” power setting with the HV grid set to 0 kV was higher than all three lower power settings with the HV grid set to 5 kV, but the incidence of DB we observed at 0 kV was several times higher. Furthermore, higher acoustic power settings can lead to the formation of undesirable satellite droplets; thus, the electric field allows for the transfer of higher velocity droplets at lower power settings, which enhances droplet coalescence while reducing the likelihood of satellite formation. Note, the electric field environment of droplets transferred in this study (0–3.3 × 10⁵ V/m) are below the critical electric field (~5 × 10⁵ V/m) that others have shown reintroduces DB failures.17,18
Last, we demonstrated how the implementation of DFA methods and the HV grid enables accurate and precise fluid transfers ( Fig. 5 ) and performed a qPCR experiment to characterize cross-contamination in the ER ( Fig. 6 and Table 1 ). When DFA and the HV grid were both enabled, we achieved values ranging from 96% to 103% of the nominal value and CV values between 1.5% and 3.7%. We observed a degradation in accuracy and precision when either feature was disabled ( Fig. 5A , B ), generally due to low-volume wells caused by droplet bounce. This transfer performance was achieved for aqueous fluids varying in surface tension and viscosity, which are two dominant fluid properties governing ADE. 30 We then used the ER to perform a qPCR assay and observed excellent amplification curves and droplet placement for the assay ( Fig. 6 ). The average Cp for the data set was 15.3 cycle number, with a standard deviation of 0.51 cycle number. We observed one CC for a destination well in the checkerboard pattern (1 of 288 wells, across three PCR plates), although the event occurred at a Cp of 35 cycle number, or roughly 20 cycle number away from the average for the assay. The source of the CC was most likely a satellite droplet, possibly due to using a nonideal calibration; however, the size of the CC even (possibly one molecule level) means a typical user could easily disregard the data point. Here we have demonstrated one application of the Echo 525 liquid handler and ER; however, the relatively large fluid property space tested in the ER Qualification Test suggests that these products could be used for a variety of assays and workflows.
In conclusion, we have described two Labcyte technologies, DFA methods and the HV grid, which are critically important for accurate and precise transfer of aqueous fluids from the ER on the milliliter scale. We demonstrated failure modes encountered when these technologies were not enabled. For example, a low-velocity droplet failure mode was observed during milliliter-scale depletions using ADE. The DFA algorithms adjusted for the increased acoustic energy requirements during a depletion by frequently auditing the source fluid and dynamically adjusting transfer parameters. In addition, droplet bounce was observed in the absence of a sufficiently strong electric field and increased in frequency with the concentration of surfactant in the fluid. This failure mode was exacerbated when DFA methods were disabled, leading to regular low-volume outcomes during the course of milliliter-scale fluid transfer. However, when DFA methods and the HV grid were enabled, we successfully transferred fluids ranging in viscosity and surface tension with accuracy and precision better than 4%. Last, we conducted a qPCR assay and observed robust amplification of plasmid DNA (average Cp of 15.3 cycle number with standard deviation of 0.51 cycle number). We observed one cross-contamination event out of 288 target wells, although the amplification occurred ~20 cycle numbers from the average, which would typically be disregarded by the user. These results indicate that the ER and Echo 525 liquid handler provide robust liquid handling solutions for a variety of applications in the life sciences.
Footnotes
Acknowledgements
We thank David Harris, Deepshikha Angrish, Sree Rajeswari, Mike Miller, Luke Ghislain, Lisa Jungherr, Alex Pierson, and Rich Ellson for support and helpful discussions during the course of this study.
Declaration of Conflicting Interests
The authors declared the following potential conflicts of interest with respect to the research, authorship, and/or publication of this article: All authors are employed by Labcyte Inc., which sells products that were used to perform this study.
Funding
The authors received no financial support for the research, authorship, and/or publication of this article.
References
Supplementary Material
Please find the following supplemental material available below.
For Open Access articles published under a Creative Commons License, all supplemental material carries the same license as the article it is associated with.
For non-Open Access articles published, all supplemental material carries a non-exclusive license, and permission requests for re-use of supplemental material or any part of supplemental material shall be sent directly to the copyright owner as specified in the copyright notice associated with the article.