
Abstract
Increasing the solute concentration of a solution alters the speed of sound in the solution in addition to changing the fluid viscosity and surface tension. For liquid handling devices that transfer fluids with acoustic energy, the change in sound speed can impact the focus of the acoustic energy and ultimately the accuracy of the transfer volume. To determine the effects of increasing solute concentration on transfer accuracy and precision, we studied the change in sound speed in dimethyl sulfoxide with the addition of low-molecular weight compounds and in phosphate-buffered saline with protein. The impact of compound and protein concentration on transfer precision and accuracy was found to be minimal and ADE can be used to transfer fluids regardless of these additions. (JALA 2006;11:227–32)
Introduction
Focused acoustic energy ejects droplets from a fluid when the focal point is located near the surface. 1 The Echo 550 and Echo 555 liquid handlers (Labcyte Inc., Sunnyvale, CA) use this acoustic droplet ejection technique to transfer one or more nanoliter-scale droplets directly from the well of a microplate to a well in another microplate. Unlike many liquid-handling devices used for compound reformatting, acoustic droplet ejection has a transfer precision that remains relatively low (coefficient of variation under 3%) and constant over range of 5–50 nL. 2 The use of acoustics as a sonar device contributes to this performance by taking advantage of the acoustic impedance mismatch of the fluid in the well and its surroundings. This difference between acoustic energy to be reflected from the bottom of the fluid at the interface with the microplate and also at the top of the fluid where it meets the atmosphere. The depth of the fluid, and hence the location of the liquid surface, is determined by measuring the time it takes for the acoustic energy to traverse the fluid and multiplying this by the speed of sound in the fluid. Changes in fluid composition, such as the water content of dimethyl sulfoxide (DMSO) in compound libraries, have a significant impact on the sound speed in the fluid. 3 For example, the sound speed in pure DMSO (~1500 m/s) increases by more than 10% as it hydrates to 70% DMSO/30% water by volume, an equilibrium state achieved in many typical laboratory environments. The Echo liquid handlers measure water content in DMSO with an acoustic detection method requiring no prior knowledge to estimate the fluid sound speed. In this case, where the transit time and sound speed are known, the fluid depth is determined. These common changes posed the following questions: Can other changes in composition such as moving to a 100% water solvent or the addition of solutes (like proteins or small molecules) disable this detection method or otherwise alter the sound speed? Would these changes impact focusing and decrease the robustness of acoustic transfer?
Because the addition of solutes to solvent systems may alter the sound speed, a measure of the magnitude of this impact for various materials used in life sciences applications was desired and, in particular, for water and DMSO solvent systems. Sound speed measurements using some monovalent and bivalent electrolytes with molecular weights under 500 show nearly linear increases in sound speed over the tested range of 0-1Madditions to water. Even at the maximum concentration of 1 M, the increase in speed of sound was below 10% (or 150 m/s). 4 Testing of a broader range of materials identified some compounds such as citrates increasing sound speed by 12% (~180 m/s per M) in water over this range. All changes in the speed of sound were all in direct proportion to the concentration with the exception of some sugars. 5 Assuming similar impact on the speed of sound for high-throughput screening compound stocks, the addition of these compounds would be expected to elevate the speed of sound by less than 1%. Representative compounds were selected to test the validity of this assumption in DMSO. Also, speed of sound measurements were made in a model system composed of phosphate-buffered saline (PBS) and bovine serum albumin (BSA). Concentration of solutes varied by 100% about a 1X PBS and 25 mg/mL nominal.
The speed of sound in each fluid was determined by clocking the differential propagation time of acoustic waves over a known distance. Distances were controlled by positioning reflector pins at different depths in the well. Volume transfer performance was determined by measuring fluorescein intensity in 384-well microplates.
Speed of Sound Methodology
A pin reflector array was implemented to enable sound speed measurements for all of the wells in a 384-well microplate, as shown in Figure 1.
(a) Transducer coupled by water to a well of a microplate containing a pin-shaped reflector. TOF is measured for the acoustic wave to travel from the transducer to the reflector and back to the transducer. (b) The reflector is moved downward, and a new TOF is measured. (c) The change in the two TOFs represents the travel time for twice the distance the reflector moved. The speed of sound is calculated as 2 × distance/ΔTOF.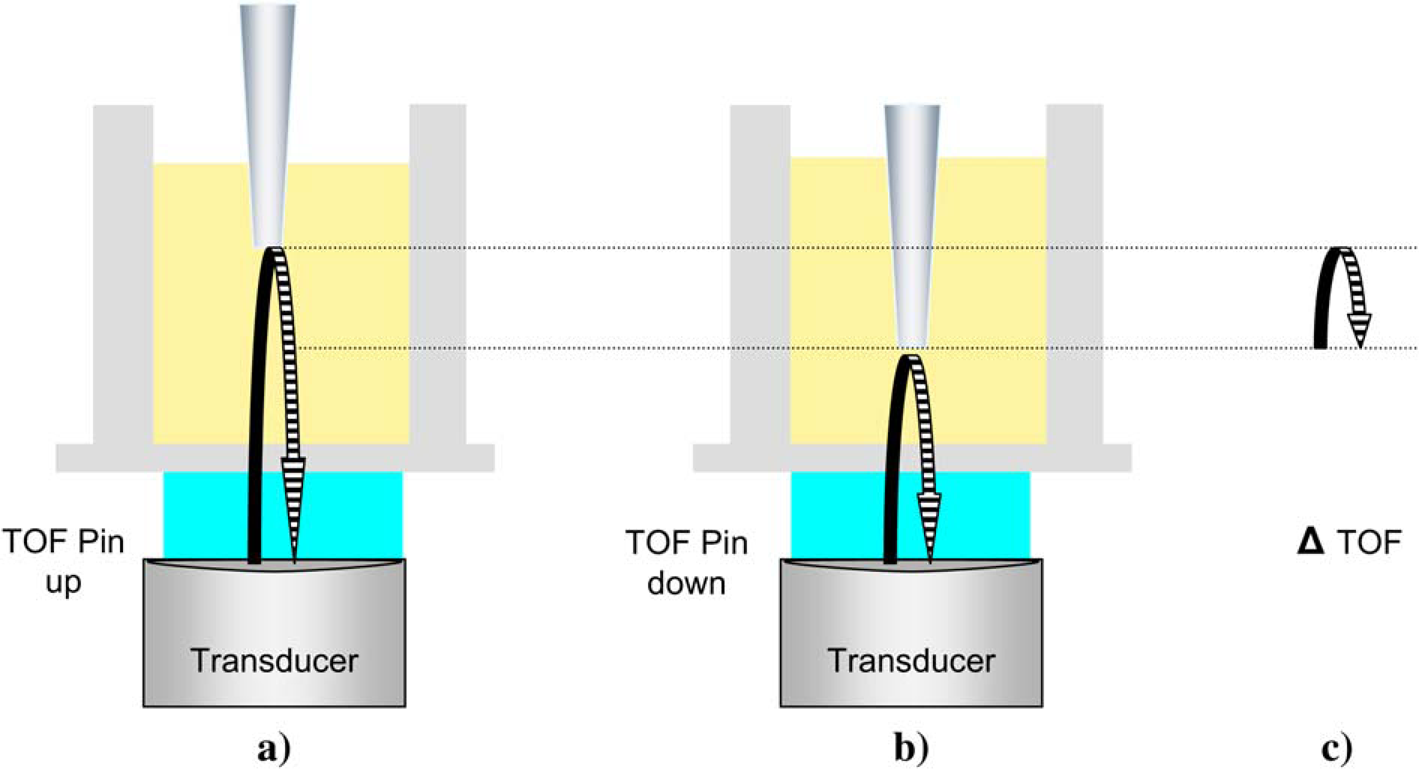
When the height of the pin is changed, the sound reflecting from it will take a different length of time to travel back to the transducer. The time difference and pin travel distance can provide accurate sound speed measurements. A 384-pin, polypropylene tool (VP248 Disposable, V&P Scientific, Inc, San Diego, CA) pictured in Figure 2 was modified for this purpose and adapted to be held in the destination plate gripper of the Echo 550, so that the vertical motion axis of the instrument could be used for precise pin movements.
A reflector pin array loaded onto a customized destination plate stage.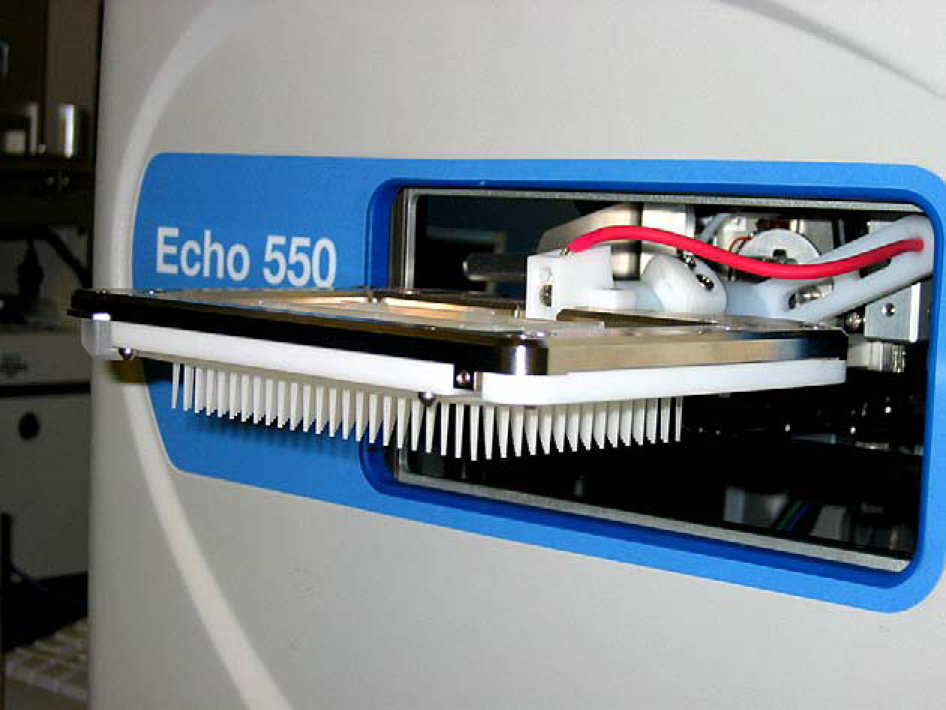
To test this method, two 384-well polypropylene, flat-bottom microplates (Labcyte P/N P-05525) were prepared with uniform contents. The first plate had 50 μL of water in each well. In order to allow longer pin travel distances in the second plate, each well was filled with 60 μL of 70% DMSO (Sigma-Aldrich, St. Louis, MO)/30% water by volume. The pins were lowered into the wells until they were wetted. Time-of-flight (TOF) measurements for sound reflecting from the pin were made as illustrated in Figure 1. Measurements were repeated three times in each well as the pin assembly moved in an up–down–up–down–up–down cycle, resulting in six TOF measurements for each well. The difference between the average up and average down measurement was used as the change in TOF or ΔTOF. The additional round-trip travel distance divided by the difference in travel time of up versus down yields the sound speed for each well. For the water-filled plate, a 1.0 mm displacement was used and resulted in an average speed of sound value for the 384 wells of 1495 m/s at approximately 22 °C, which is consistent with published literature values measured at 20–25 °C. 6 In the plate containing DMSO/water, a 1.5 mm pin travel gauged the average sound speed at 1690 m/s for the 384 wells with a similar agreement with literature values.2, 7 Note the coefficient of variation (CV) for the speed of sound measurements was under 0.3% based on 384 wells, where the calculated sound speed for each well was the average of three repeats.
Non-Uniform Test Plates
A 384-well plate with nonuniform contents of small-molecule compounds (Sigma–Aldrich, St. Louis, MO) was prepared. The compound locations and concentrations are shown in Figure 3. The molecular weight of each solute is listed in Table 1. All wells contained 70%/30% mixture by volume of DMSO and water with 0.15 mM fluorescein. All small-molecule compounds had peak concentrations of 30 mM. BSA (Sigma–Aldrich, St. Louis, MO) was included in the study to explore the behavior of larger protein molecules (over 50,000 Da) in DMSO. BSA was added in columns 2 and 14. A peak concentration of 66.5 mg/mL BSA was added in the eight wells located at rows A, E, I, and M of these two columns. These eight wells were then serially diluted by a factor of 3 in subsequent rows. The final test plate contained eight copies of 40 distinctive conditions. Columns 1, 12, 13, and 24 were controls, containing neither BSA or compound.
Optical scan of material test plate. All wells contain fluorescein at 0.15 mM and 70%DMSO/30%water. Noncontrol wells contain additional materials as shown. BSA peak concentration is 66.5 mg/mL and has a similar threefold dilution pattern. The difference in color of the wells is largely due to the drop in pH caused by the presence of the various compounds. Note that the wells with oxantel pamoate salt are clear at low concentrations and opaque white at 30 mM.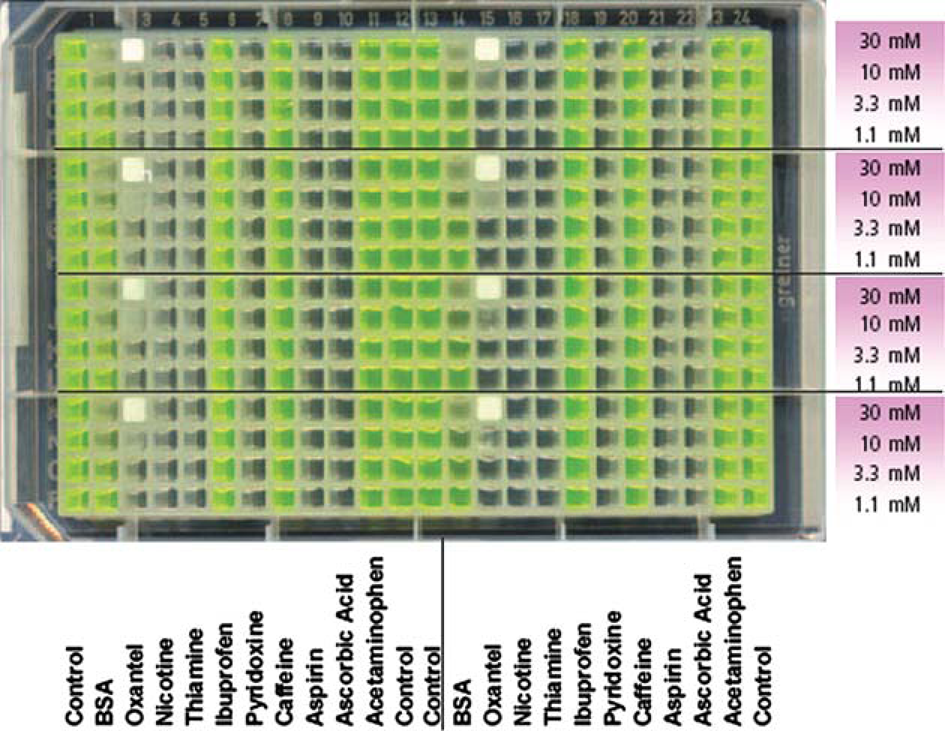
Molecular weight, concentration, and change in speed of sound
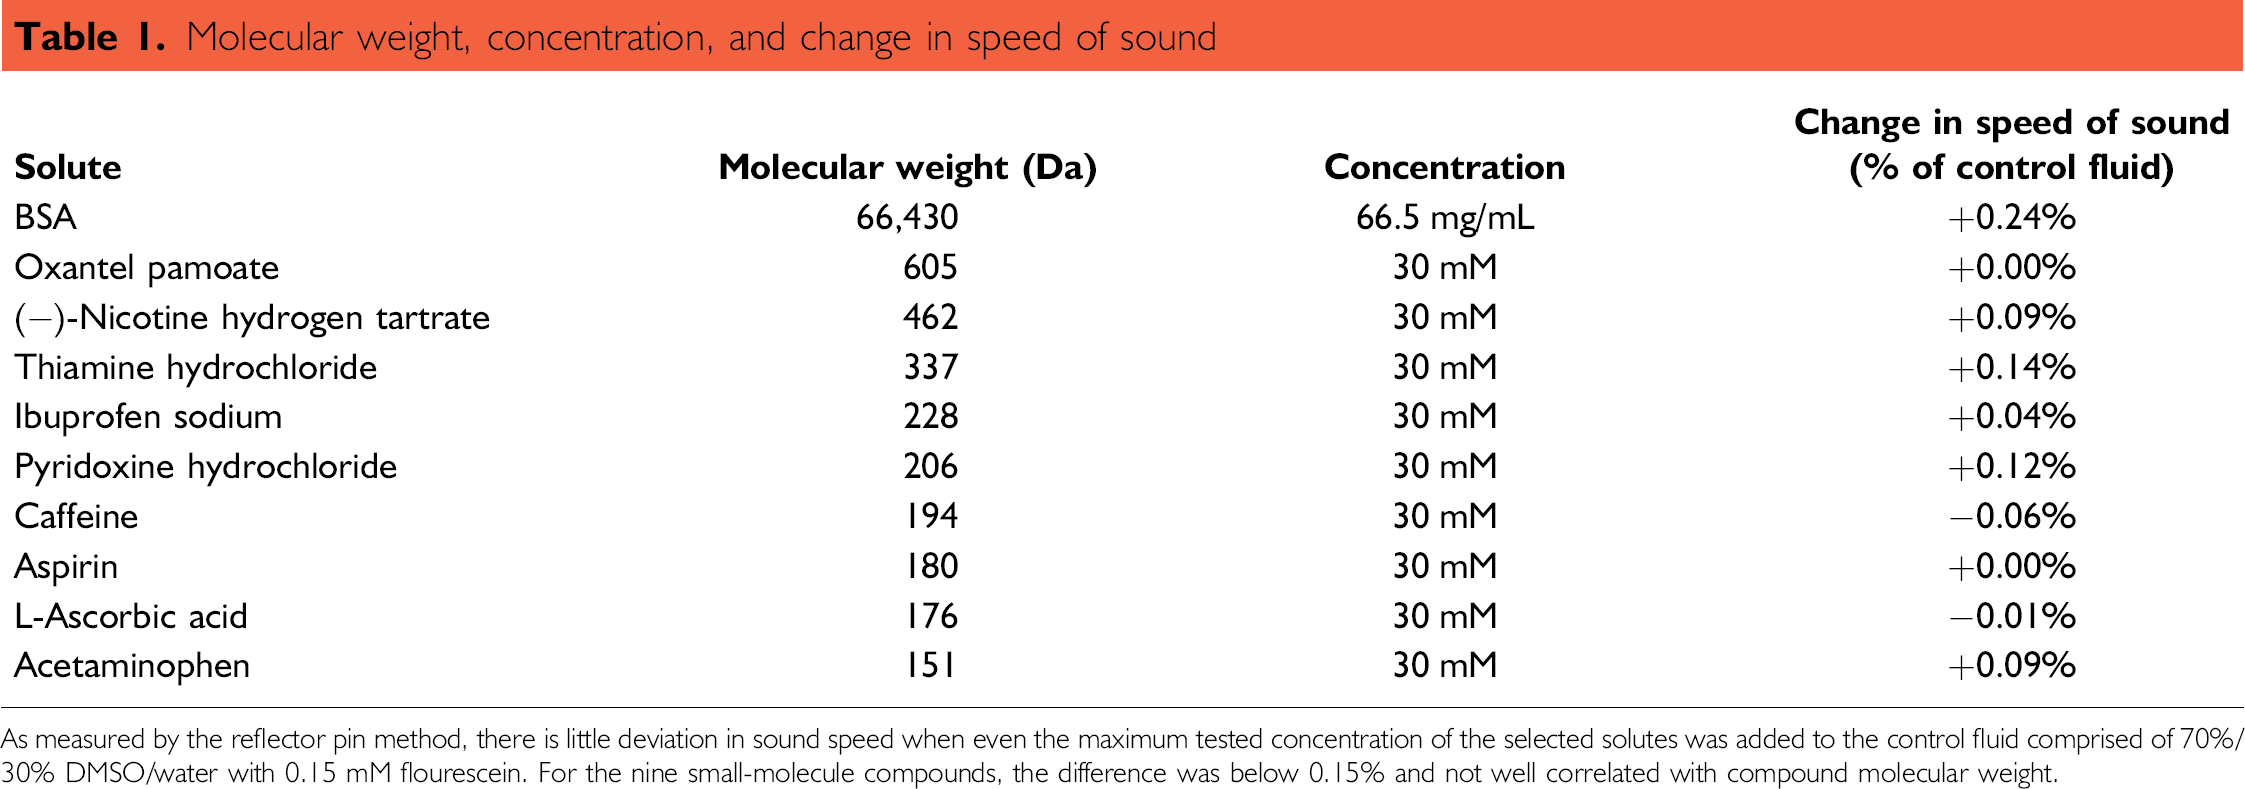
As measured by the reflector pin method, there is little deviation in sound speed when even the maximum tested concentration of the selected solutes was added to the control fluid comprised of 70%/30% DMSO/water with 0.15 mM flourescein. For the nine small-molecule compounds, the difference was below 0.15% and not well correlated with compound molecular weight.
A second test plate contained various concentrations of PBS (Dulbecco's PBS, cat# 14190-144, Invitrogen, Carlsbad, CA) and BSA. In test plate, columns 1, 7, 13, and 19 contained 50 mg/mL of BSA; from these four columns, BSA was serially diluted by a factor of 2 in subsequent columns using an eight-channel pipettor. Columns 5, 6, 11, 12, 17, 18, 23, and 24 did not have any protein in the solutions. Columns 6, 12, 18, and 24 contained no fluorescein and had either PBS or water. An annotated image is shown in Figure 4.
Optical scan of material test plate. PBS concentration increases from left to right, and within each concentration of PBS, the BSA concentration ramps down from 50 mg/mL for subsequent columns to the right. All wells except those in columns 6, 12, 18, and 24 contain fluorescein at 0.15 mM. Each combination of BSA and PBS concentration appears in all 16 wells of a column. Column 6 contains only deionized water and serves as a control for the speed of sound.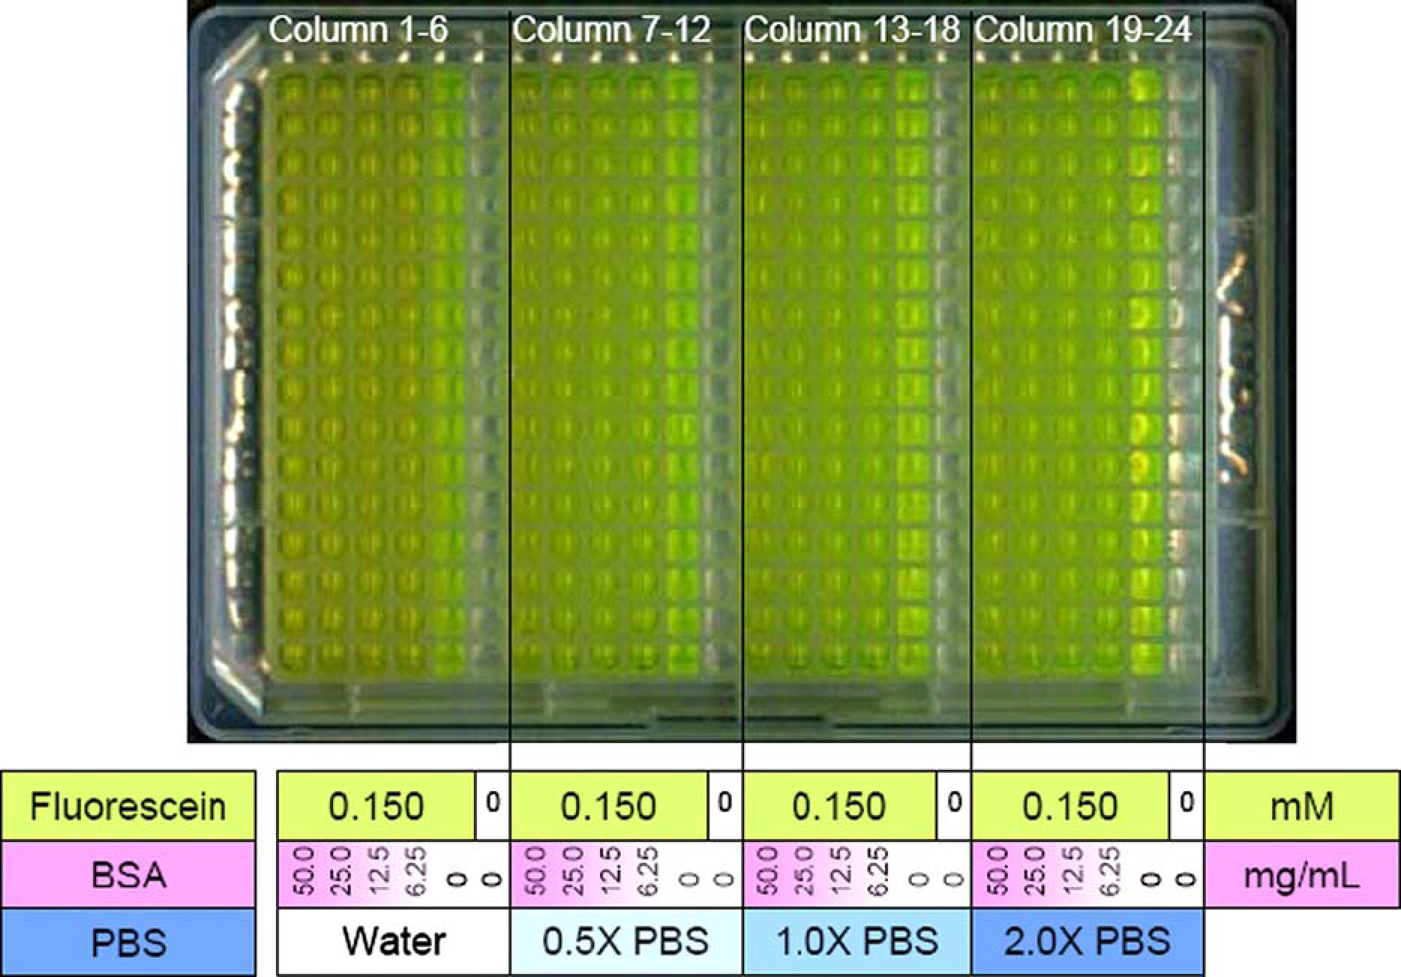
For both non-uniform test plates, the sound speed was determined by averaging results of all wells containing of the composition. This was 8 replicates in the microplate with the low-molecular solutes in DMSO and 16 wells (one column) in the microplate with the PBS/BSA solutions. As in the previous uniform plate tests, sound speeds were based on three up/down measurements per well and had similar CV's.
Sound Speed Results
Reflector pins were displaced 1.5 mm to measure sound speed in the DMSO microplate. Results in Table 1 indicate the difference in speed of sound for the compound containing wells relative to the control fluid (70% DMSO and 30% water with a sound speed of 1690 m/s). Wells containing compound were not significantly different from the DMSO/water control.
The CV for the speed of sound for the entire 384-well compound/DMSO plate was 0.34%, and outlier sound speeds were within 1% of the average value. Deviations in focus due to changes in sound speed would be expected to be minimal.
For BSA in PBS, results shown in Figure 5 indicate that the sound speed increases as the concentration of BSA or PBS in the solution increases. Comparing water to 50 mg/mL BSA in 2× PBS, sound speed increases roughly 3%. However, this change would not have a significant impact on focus. Adding fluorescein to the solutions did not impact the sound speed. The CV for the sound speed for the entire 384-well plate was 0.34%, and the maximum sound speed measured was within 2% of the average value.
Changes in speed of sound due to decreasing BSA concentration (left to right) are less significant than changes due to increasing PBS concentration (front to back). The CV within each of the 24 conditions is 0.34%. The maximum and minimum speeds of sound differ by about 3%.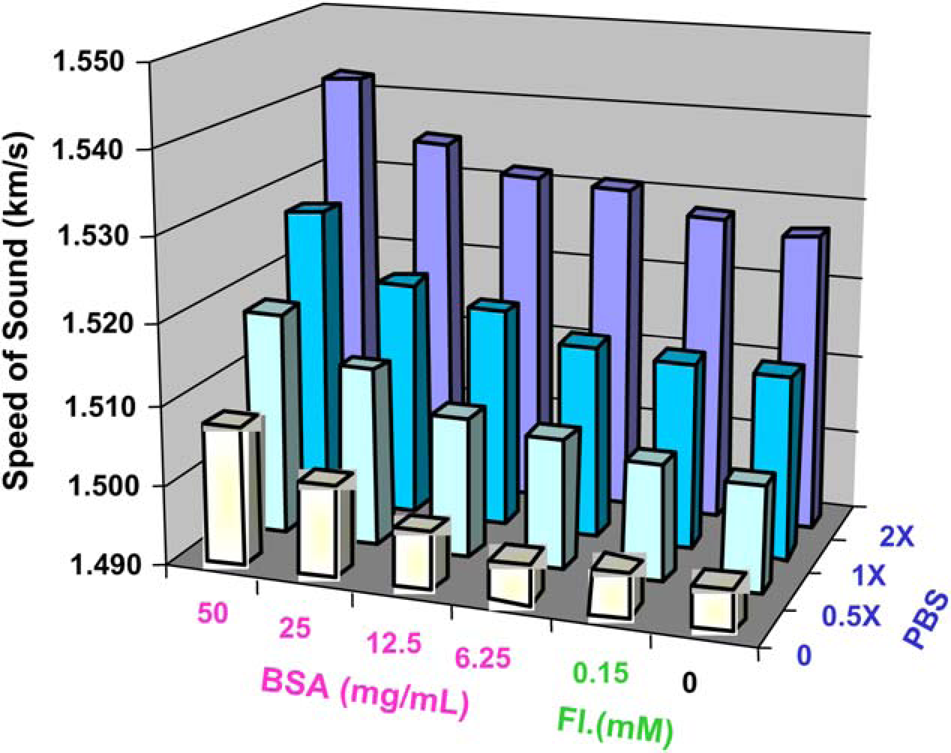
The reflector pins were then removed from the destination gripper and were replaced by a series of 384-well polystyrene destination plates to receive droplets for volume transfer performance testing.
Ejection Power and Focus Setting
Ejection parameters were modified from the typical DMSO/water calibration to accommodate the different properties of the PBS/water solutions. This included the power level and frequency of acoustic energy to ensure drops were ejected over the entire range of fluids in this test. The fluids ranged from pure water to 2× PBS.
Measurement of Transfer Precision
The Echo 550 liquid handler is designed to eject droplets of 2.5 nL. Larger volumes are transferred by ejecting more droplets. Destination plates were filled with volumes of 5, 10, and 50 nL. Drop volumes and transfer precision were determined by diluting the fluorescein-containing droplets in each well with 50 μL of 10 mM NaOH and analyzing the resulting fluorescence intensity.8, 9
The average transfer volume from the compound wells remained within 2% of the control DMSO wells. Transfer precision from most of the compound wells was less than 3% CV, whereas the control wells had approximately 2% CV. Wells containing 30 mM oxantel had the highest CV of 4%, which could be related to the opaque white precipitation as seen in Figure 3. Average transfer volumes appear to decline slightly with increasing compound concentration (see Figs. 6 and 7). At the highest concentration tested, the measured transfer volumes of solutions containing oxantel and BSA deviated from the expected transfer volumes by just over 4%.
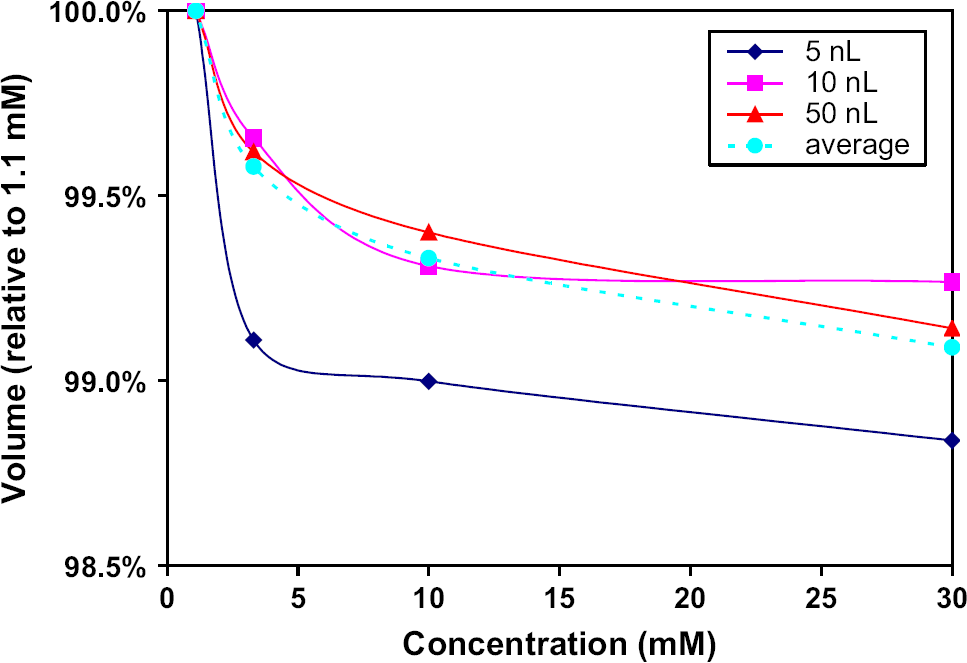
Average transfer volume normalized to the control fluid (70% DMSO/30% water) is shown for each compound and concentration. Eight replicate wells (see Fig. 3) are used to determine the average transfer volume. At 10 mM and below, the effect of concentration is minimal (~1% or less). Only solutions of oxantel at 30 mM and BSA at 66.5 mg/mL showed volume errors in excess of 4%. Average transfer volumes show 0.5–1.1% decline with increasing compound concentration. Similar trends are seen for 5, 10, and 50 nL transfers.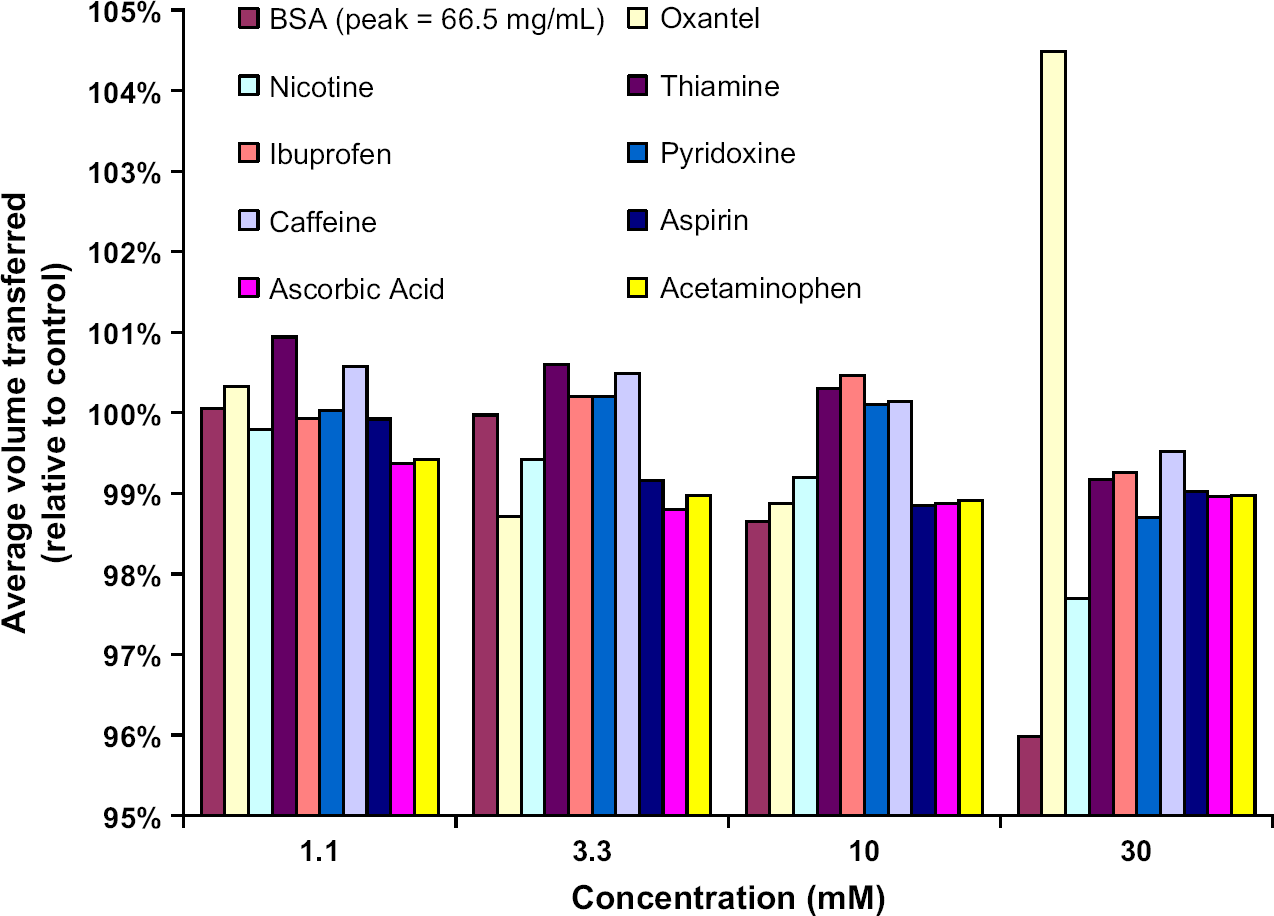
Transfer reproducibility was measured for the aqueous test plates. Parameters expected to result in the transfer of 2.5 nL were used for all of the transfer volume tests. Destination plate wells were each filled with 20 droplets for an expected total volume of 50 nL. The transferred volumes were then diluted with 50 μL of 10 mM NaOH and placed in a fluorescence reader to determine relative transfer volume variation. As shown in Figure 8, transfer precision was less than 8% CV regardless of the BSA and PBS concentrations; in the case of 1× PBS, CV values were less than 3% for all concentrations of protein.
The CV for the volume transfer of each of the 24 tested solutions was based on 50 nL transfers (25 droplet ejections) into sixteen wells. The system was calibrated for 1× PBS, and these solutions had CVs below 3%. Variations in solution and solvent concentration increased the CV up to 7.5%.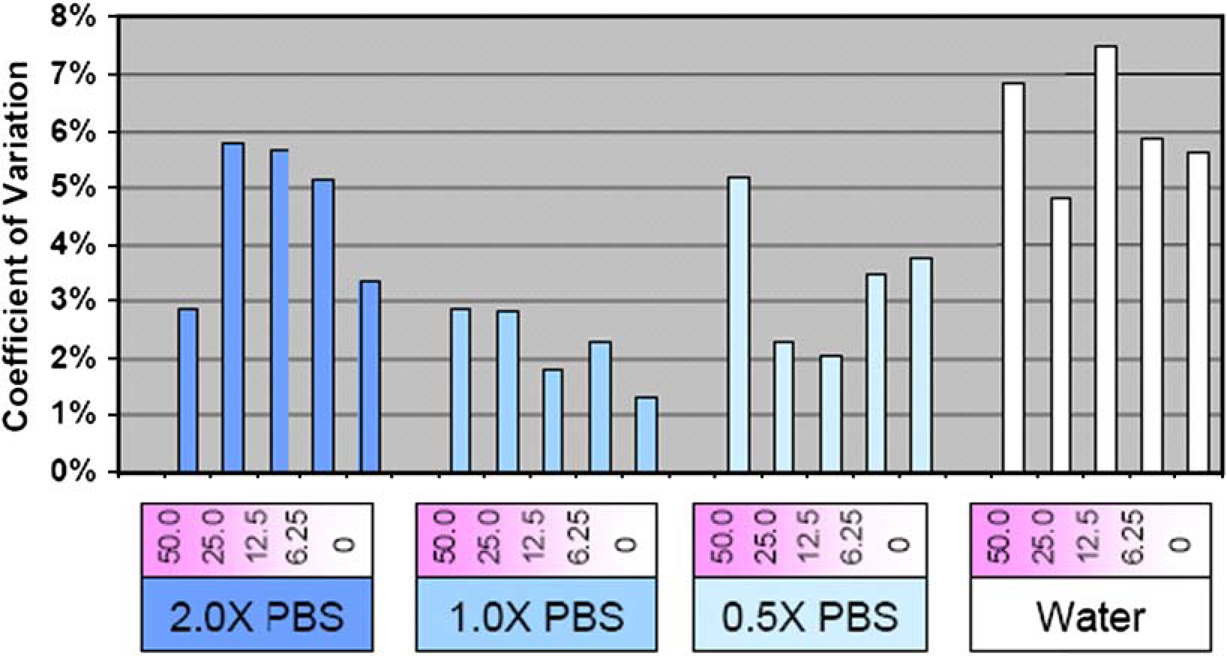
Conclusions
None of the nine small-molecule compounds altered the sound speed of DMSO by more than 0.14% at tested concentrations, and BSA at 1 mM only showed a slight change (less than 0.25%) in the sound speed. BSA and PBS did not increase the speed of sound in water by more than 4% even with the extreme case of 50 mg/mL of BSA in 2× PBS.
Because these variations in solute and solvent resulted in small changes in the sound speed, the impact on the acoustic drop ejection was expected to be minimal. For DMSO with compound concentrations of 10 mM and below, no significant impact on transfer volume was detected. Transfer precision was less than 3% CV, and average deviation from expected volume was below 2%. Only BSA at 66.5 mg/mL and oxantel at 30 mM deviated from the expected transfer volume by more than 4%, even though the sound speed in oxantel solution was the same as in the control solution. The 4% volume error observed in 30 mM oxantel solution might be related to the opaque, white precipitation, and additional studies need to be conducted. At the nominal concentration of 1× PBS and 25 mg/mL BSA, the variation of transfer volume was under 2%. Without any adjustment for the large change in composition of the BSA/PBS solutions tested, the CV of the transfer volume remained below 8%.