
Abstract
The quantitation of sugars, including glucose, the primary fermentable sugar; maltose (DP2); and maltotriose (DP3), is a standard procedure during the corn-to-ethanol fermentation process. The quantitation of glucose by the Megazyme Assay utilizing glucose oxidase and peroxidase enzymes (GOPOD) and UV-Vis detection, high-performance liquid chromatography with refractive index detection (HPLC-RID), and liquid chromatography mass spectrometry (LC-MS) with electrospray ionization (ESI) and selected ion monitoring (SIM) was studied. Three biological flask fermentation replicates were analyzed every 12 h beginning at 14 h of fermentation (T14) until near completion of fermentation (T62).
The method comparison results for glucose quantitation showed that the LC-MS SIM analysis had the lowest limit of quantitation (LOQ) at 2 ppm and the widest dynamic range of 2.7 orders of magnitude. The HPLC-RID analysis had a linear dynamic range (LDR) of 1.5 orders of magnitude with an LOQ of 1500 ppm. The Megazyme GOPOD analysis had an LDR of 0.9 orders of magnitude with an LOQ of 120 ppm.
The HPLC-RID method was ideal for glucose quantitation when it was present in high concentrations. In contrast, maltose and maltotriose components were found to be present in lower concentrations, such that simultaneous quantitation of the three analytes is difficult during fermentation. The LC-MS method was the only method able to quantify the concentration of glucose successfully and simultaneously with DP2 and DP3 in all the fermentation broth samples collected from T14 through T62 during the corn-to-ethanol fermentation process.
Introduction
Utilization of corn as a source for fuel ethanol production serves several purposes, including the increase of demand for farmers and thus the creation of jobs for rural communities, and access to a fuel supply that is sustainable, biodegradable, and environmentally friendly as fossil fuels become depleted.1,2 The corn-to-ethanol process results in the production of distiller’s dried grains with solubles (DDGS), which are commonly used as cattle and poultry feed due to its high nutritional content of protein, minerals, fat and fiber.3–8 The benefits of using ethanol produced from corn as a fuel source urge the industry to develop methods to maximize the amount of ethanol produced to make corn-to-ethanol fermentation a reliable process.
Glucose is the primary saccharide metabolized by yeast, where glucose produced from corn starch metabolism is termed dextrose.9,10 Monitoring sugar concentrations during the corn-to-ethanol fermentation process, especially glucose, is important for maximizing ethanol production because the levels of glucose and ethanol are inversely related. 9 Monitoring and quantifying the levels of other sugars, such as maltose, maltotriose, and dextrins, shows the progression of the breakdown of starch by the amylase enzymes used for fermentation.11–13
As the major sugars from corn-to-ethanol fermentation are produced from the breakdown of starch from the corn kernel, the sugar molecules are defined by degrees of polymerization of glucose, denoted as DP, followed by the number of glucose monomers present in the molecular chain.11,14–17 For example, maltose (mass: 342.1 Da), being the dimer of glucose (mass: 180.1 Da), can also be referred to as DP2; maltotriose (mass: 504.2 Da) can be indicated by DP3 as it is the trimer of glucose.3,15–17 However, the configuration of the hydroxyl groups or glycosidic bond(s) at the anomeric carbon(s) differentiates individual sugar molecules. Trehalose, another DP2 sugar, is a glucose dimer with an α,α 1-1 linkage as opposed to maltose with an α,1-4 linkage; this dimer can be produced during fermentation from Saccharomyces cerevisiae in reaction to high-stress environmental conditions.18,19 Sugar conformational isomers also exist for DP3. The differentiation of conformational isomers has been performed through the use of mass spectrometry (MS) detection; by using direct infusion into an MS with electrospray ionization (ESI), several pentoses, hexoses, and glucose disaccharides have been distinguished by metal-cation affinity and water adduction reaction studies.20–22 However, this analysis has not been performed with separation techniques performed prior to detection. MS promises to be a robust mode of detection due to its selectivity for analytes based on their mass; current methods of quantitation of glucose utilized by industry include assays with spectroscopic detection, and chromatographic techniques paired with various detection methods lack this type of selectivity but are simpler in procedure and more cost-effective.
The Megazyme Total Starch Assay Kit (or D-Glucose Assay Kit) can be purchased with prepared bottles of reagent to make a glucose oxidase and peroxidase (GOPOD) solution. Megazyme Assay kits and enzymes produced by Megazyme have been used in research for the quantitation of saccharides or for enzymatic conversion/digestion to produce other components.23–27 Additionally, glucose oxidase and peroxidase enzymes are commonly used for glucose determination.23,28–30 Assays utilizing GOPOD solution (steps a7–a10 in the K-TSTA-100A manufacturer’s procedure) quantify glucose based on the production of a dye that absorbs in the UV-Vis range. In the presence of GOPOD enzymes,
High-performance liquid chromatography with refractive index detection (HPLC-RID) is commonly used in the biofuel industry for component analysis of fermentation products.31,32 RID is ideal because it is universal and nondestructive; however, it is nonselective as any deviation or change in the path of the refracted light regardless of the material causes a signal to the detector. In complex matrices, if analytes elute simultaneously, the two analytes cannot be differentiated. Additionally, RID is sensitive to temperature fluctuation and has relatively poor sensitivity in the milligram per liter range. 33 These impediments eliminate the possibility of using gradient elution as the reference cell requires time for optical and thermal equilibration.33,34
There are several factors of selectivity gained by hyphenating LC with MS, such as the formation of ions and potential fragmentation. 35 Additionally, the use of internal standards in MS allows for quantitation by ratiometry as well as compensation for instrumental variation; this method of analysis cannot be utilized by the Megazyme GOPOD method or the standard HPLC-RID fermentation analysis to eliminate the drawbacks of their detection methods. Because of the great potential of MS for sugar identification and quantitation, the goal of this research is to adapt an isocratic industry HPLC-RID method to be compatible for MS analysis for increased selectivity and sensitivity for the quantitation of glucose and other sugar analytes at low concentrations throughout corn-to-ethanol fermentation using the MS features available on entry-level instruments that would likely be present in this industry.
Materials and Methods
Materials
Yellow dent corn (#2) was purchased from a local farm in Belleville, Illinois. Lactrol was purchased from Phibro (Teaneck, NJ). Ethanol Red Saccharomyces cerevisiae was purchased from Leaf-Lesaffre Advanced Fermentations (Durham, NC). Urea (99.6%) was purchased from Fisher Scientific (Pittsburgh, PA). Liquozyme LpH and Spirizyme Fuel HS were purchased from Novozymes (Franklinton, NC).
The Megazyme Total Starch Assay K-TSTA-100A kit was purchased from Megazyme (Chicago, IL). Bottle 3 contains the GOPOD Reagent Buffer with buffer (50 mL, pH 7.4) and 4-hydroxybenzoic acid and sodium azide (0.095% w/v). Bottle 4 contains a freeze-dried powder mixture of glucose oxidase, peroxidase, and 4-aminoantipyrine.
Dextrose (>99.8%) was purchased from Sigma-Aldrich (St. Louis, MO). Maltose monohydrate (99%), maltotriose (93%), ethyl alcohol (99.9%), glycerol (99.7%), lactic acid (99.9%), and acetic acid (99.9%) were purchased from Fisher Scientific. Maltrin M100 Maltodextrin (~95%), a starch-based, saccharide polymer, was purchased from Grain Processing Corporation (Muscatine, IA). Deuterated glucose (
Flask Fermentation and Sample Collection
Small-scale (250 mL) flask fermentation was performed according to the following method to mimic the large-scale fermentation performed at NCERC. All glassware used was autoclaved prior to use. A 4 mm sieve was used to remove debris from a corn sample, which was then ground using a Thomas-Wiley Laboratory Mill 4 (Thomas Scientific, St. Louis, MO) through a 2 mm screen. The milled corn and deionized (DI) water were added to three Labomat beakers to achieve 30% solids in the slurry mash. The mass of each of the beakers was recorded following each addition to the flask. Liquozyme LpH (α-amylase) enzyme solution was added to the slurry mash according to the manufacturer’s recommendations. The Labomat beakers were sealed with one beaker equipped with a temperature probe. A Labomat BFL-12 incubator (Werner Mathis AG, Oberhasli, Switzerland) was utilized for the liquefaction process, such that the Labomat parameters were set to 82 °C for 90 min, then cooled to 40 °C. The contents of each Labomat beaker were quantitatively transferred to sterile 250 mL Erlenmeyer flasks. The pH was adjusted to 5.0 ± 0.1 using 5 N sulfuric acid in an extra flask with the volume measured to the nearest 10 µL. The same volume of acid used was added to the rest of the flasks for pH adjustment.
Spirizyme Fuel HS (glucoamylase) was added to the corn mash for a final dosage for 0.030% w/w of corn. Yeast was rehydrated in warm (~37 °C) DI water. These materials were prepared by the manufacturer’s recommendation. A solution of urea (0.2 g/mL) was filtered through a 0.2-micron Nalgene Rapid-Flow Bottle Top Filter (Thermo Scientific). The urea, Lactrol antibiotic (2 ppm), and glucoamylase enzyme were added to the corn mash (for 0.030% w/w of corn, respectively). The hydrated yeast was added for a starting yeast cell count greater than 1 × 10⁷/mL. A sterile S-shaped airlock with stopper was filled halfway with DI water and placed on the flasks to vent CO2 produced during fermentation. The corn mash was fermented in an incubator at 32 °C and 200 rpm. The initial fermentation sample was collected after 14 h of fermentation, where the following samples were collected every 12 h. The mass of each flask was recorded before and after each sample collection. After the final sample was collected at 62 h of fermentation, the remaining material from the flasks was transferred to 50 mL centrifuge tubes and stored in a −20 °C freezer until transfer to a −80 °C freezer for long-term storage.
Fermentation samples from three flask fermentation trials were collected and denoted by T#, where # is the time in hours since the initiation of fermentation. Collection was performed using 25 mL sterile pipettes, transferring sample into sterile 50 mL centrifuge tubes. Samples were stored in a −20 °C freezer for 5−10 min to halt fermentation; the caps on the centrifuge tubes were left ajar to allow for CO2 to escape as fermentation halted.
After the allotted 5−10 min previously described, samples were removed from the freezer and allowed to reach room temperature, then centrifuged at 8422g for 10 min with a Sartorius Centrisart G16 Benchtop Centrifuge (Göttingen, Germany). The supernatant (fermentation broth) was filtered with a 5 mL syringe and 0.45-micron syringe filter to remove residual particulate matter. Sulfuric acid (1.11 N) was added in a volume of 9 µL per 1 mL of fermentation broth to denature enzymes and prevent any bacterial growth. All broth samples were stored in 15 mL conical tubes in a −20 °C freezer following sample collection until the samples were prepared for analysis.
Sample Preparation for Analysis
Broth samples were diluted into LC vials with type I water based on expected concentrations of glucose from previous HPLC-RID analysis of flask fermentation samples. T26 samples were analyzed with a dilution factor of 10 as well as undiluted, as previous studies have shown that glucose concentrations at this time during fermentation have the potential to fall outside the dynamic range for the HPLC-RID method of analysis. For the LC-MS studies, the samples were added in a 50:50 ratio to a deuterated internal standard (
Calibration Standards and Solvent Preparation
Acidified type I water (0.01 N sulfuric acid, 0.001% or 0.1% formic acid) was prepared and used as the solvent for the HPLC-RID and LC-MS analyses, respectively. The formic acid mobile phase of 0.001% concentration was utilized for preliminary studies of ion identification of sugars; the formic acid mobile phase of 0.1% concentration was used for quantitation analysis per the results for the highest ionization efficiency during method development.
Calibration standards containing glucose, maltose, and maltotriose were prepared for each of the analytical methods in concentrations appropriate for the instrument of analysis and detection. For LC-MS, calibrators ranged from concentrations of 1 ppb to 1000 ppm in a 50:50 ratio with the deuterated internal standard (
Check standards of various concentrations with respect to the calibration ranges of glucose, maltose, and maltotriose were analyzed by each method to determine the percent accuracy of each method. The concentration values of the check standards were evaluated, and the results were reported with respect to the calibration for each analytical method; at least two check standards were initially prepared for validation of each method, though some were not above the limit of quantitation (LOQ) after that was established. A check standard containing Maltrin-M100 maltodextrin, maltotriose (DP3), maltose monohydrate (DP2), anhydrous glucose, lactic acid, glycerol, acetic acid, and ethanol was utilized for the HPLC-RID method validation. The check standards were utilized to verify the accuracy of the methods as calculated by eq 1:
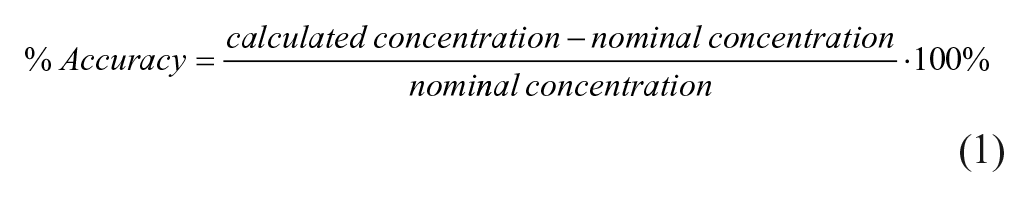
The check standards were also utilized for determining the precision of the methods by determining the percent relative standard deviation (RSD) for each check standard analyzed. The limit of detection (LOD) and the LOQ for each method for the respective analytes were calculated by determining the error of the slope for calibration and multiplying that value by 3.3 (LOD) and 10 (LOQ).
Megazyme GOPOD
Sugar standards of 100–1000 ppm concentration (without the addition of the deuterated internal standard) along with blanks of type I water were prepared and analyzed according to the Megazyme GOPOD analysis (steps a7–a10 in the K-TSTA-100A manufacturer’s procedure) by adding 0.1 mL of the sample followed by 3 mL of GOPOD solution to a test tube. The sample and solution were mixed by pipetting. The solution mixtures were incubated for 20 min in a water bath at 50 °C. Absorbance was measured using a Shimadzu UV-1800 Spectrometer with UVProbe 2.32 photometric software (Columbia, MD) at 510 nm. The diluted samples prepared for analysis were processed and analyzed according to the GOPOD procedure. Each standard and sample were prepared by the Megazyme procedure in triplicate, and each prepared replicate was analyzed in triplicate technical replicates.
HPLC-RID
HPLC-RID analysis was performed on a Shimadzu LC-20AT Prominence Liquid Chromatograph, with a Shimadzu SIL-20AC HT Prominence Auto Sampler, a Shimadzu CTO-20A Column Oven, and a Shimadzu RID-10A Refractive Index Detector. Shimadzu LabSolutions (5.84) data management software was used. The HPLC-RID parameters include use of a Supelcogel C610-H ion-exclusion column (300 cm × 7.8 mm, 9 μm particle size, PS-DVB packing material; Sigma-Aldrich) and a 0.600 mL/min isocratic flow rate of 0.01 N sulfuric acid at 60 °C with a 10 μL injection volume. As buffers are not used in any of the analysis, the ion-exclusion property of the column is not utilized, and the size-exclusion property dominates. Calibration standards were analyzed once, and samples were analyzed in triplicate technical replicates, per NCERC protocol.
LC-MS SIM
The LC-MS analysis was performed using an Agilent Technologies 6460 Triple Quadrupole LC-MS ESI with Agilent Jet Stream Technology (Santa Clara, CA) and an Agilent 1290 Infinity Quaternary Pump (G4204A), an Agilent 1290 Infinity Sampler (G4226A) with an Agilent 1290 Thermostat (G1330B), and an Agilent 1290 Temperature-Controlled Column Compartment (TCC) (G1316C) with 0.1% formic acid in water as the isocratic mobile phase. The LC portion of the LC-MS analysis mimics that of the HPLC-RID analysis except for the change in acid added to the mobile phase, as well as a 1 μL injection volume for the standards and samples.
Results and Discussion
Glucose Method Validation and Quantitation
The three flask fermentations are considered biological replicates and are therefore not necessarily expected to have the same results for sugar quantitation. With this, the biological species during each of the fermentation trials, such as yeast and enzymes, may exhibit different rates under similar conditions.36,37 With the analysis of the calibration standards and check standards, the method validation parameters were able to be calculated.
Results for the Method Validation of Glucose Quantitation for Megazyme GOPOD, HPLC-RID, and LC-MS SIM.
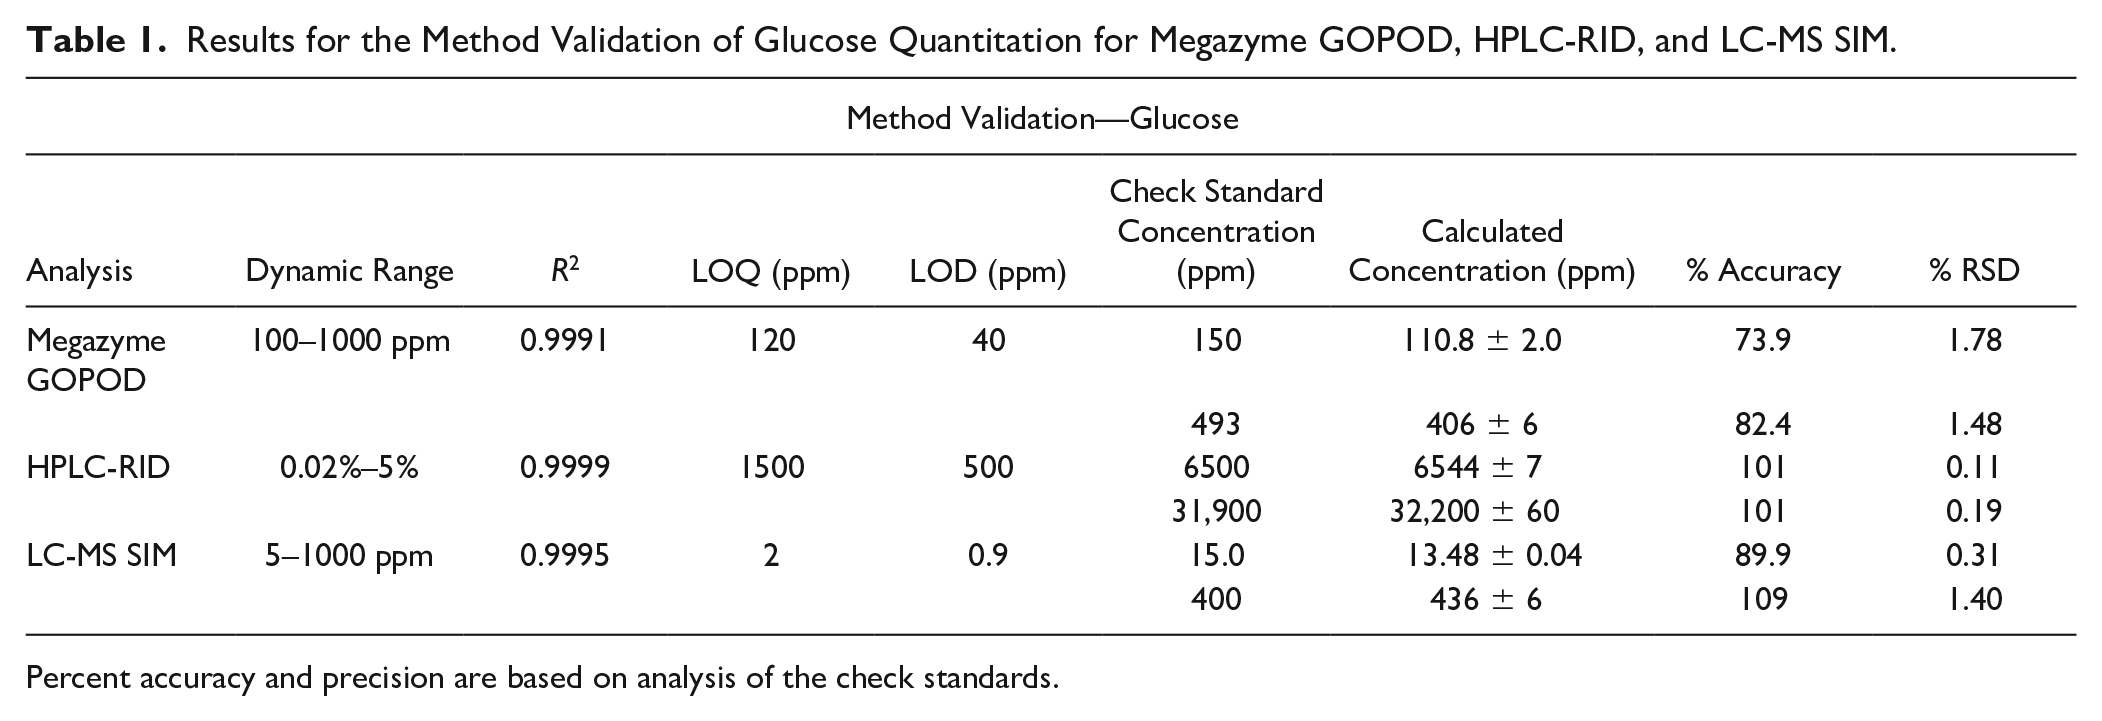
Percent accuracy and precision are based on analysis of the check standards.
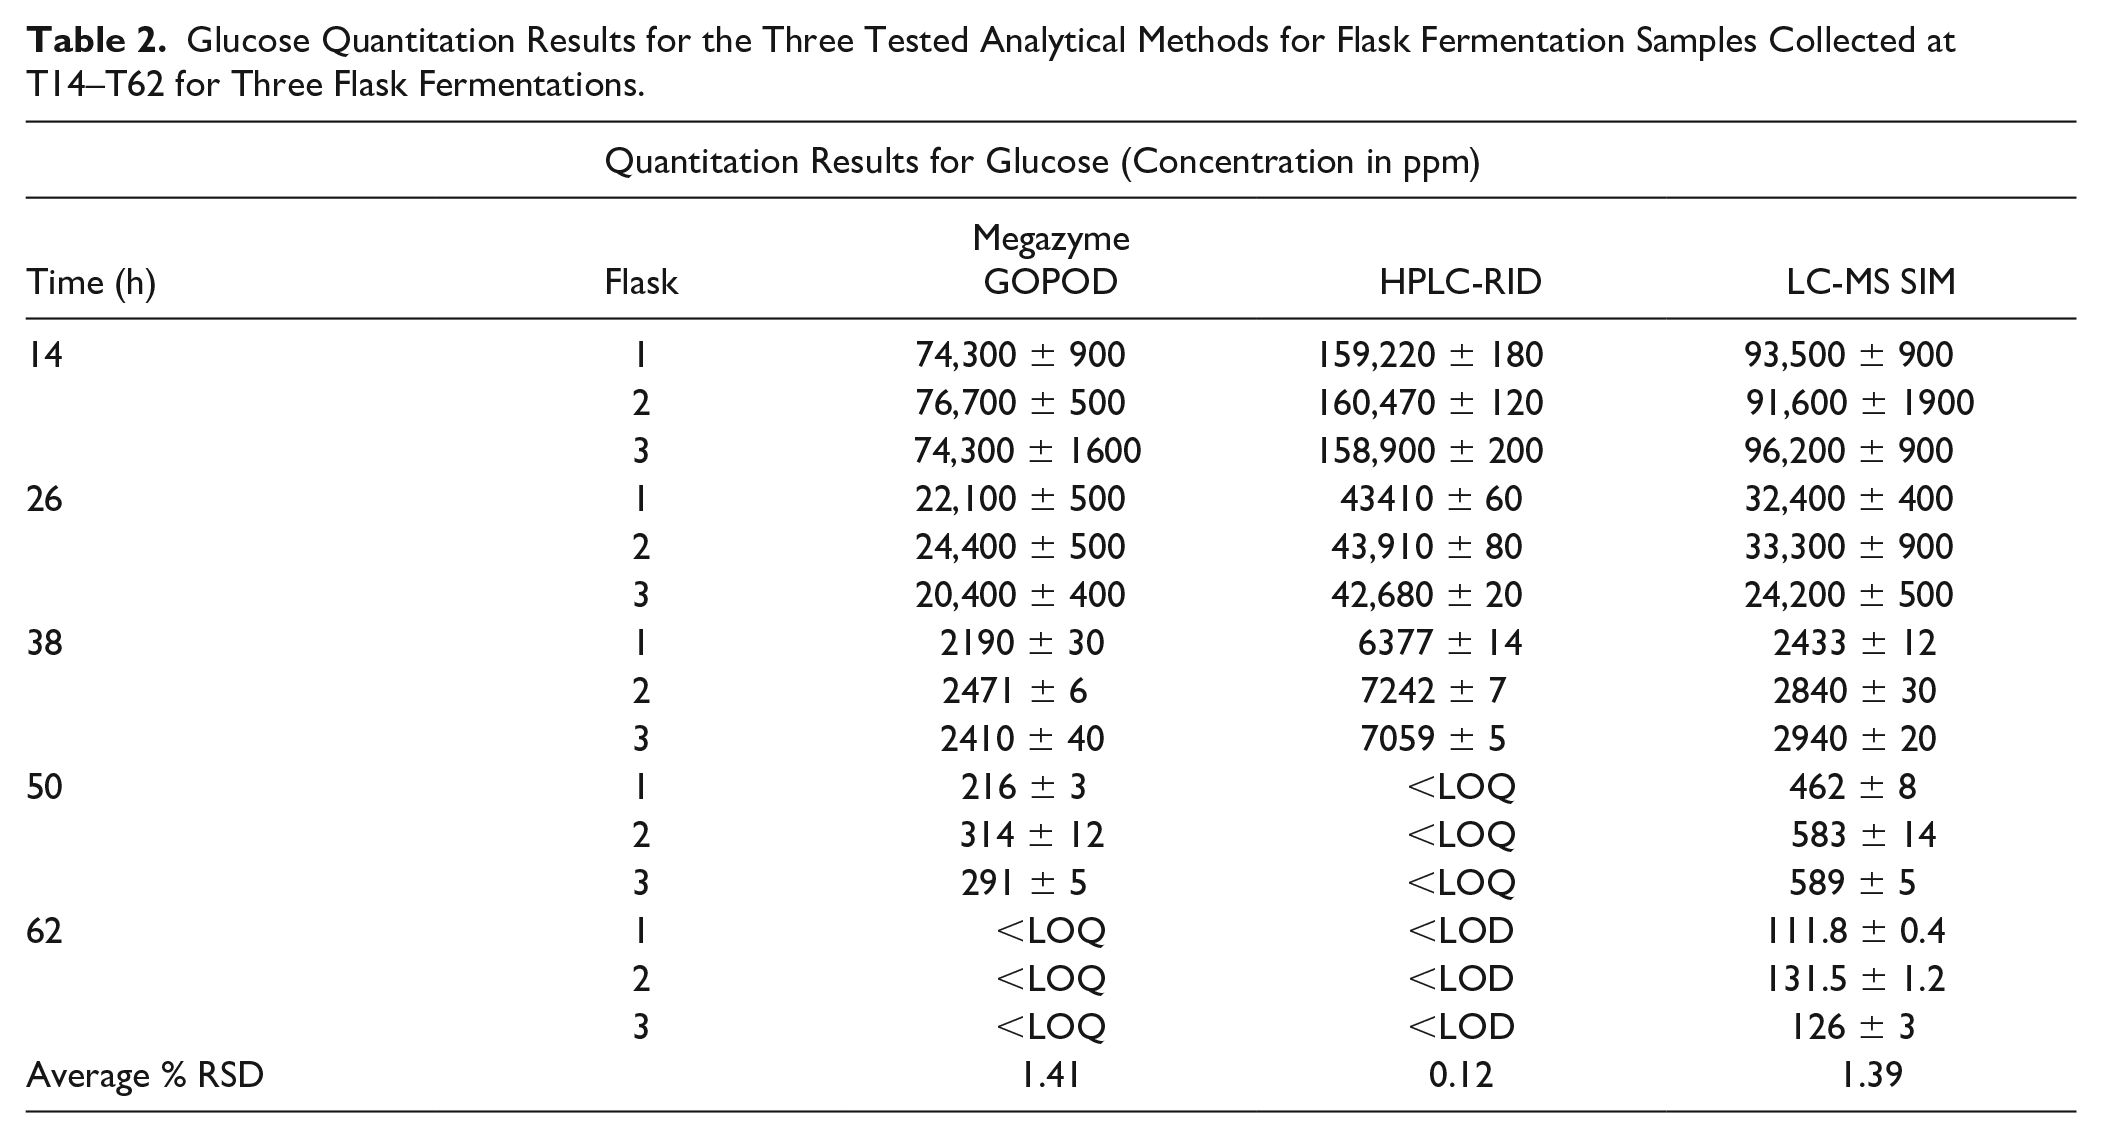
Following the method validation, glucose was quantified using each method.
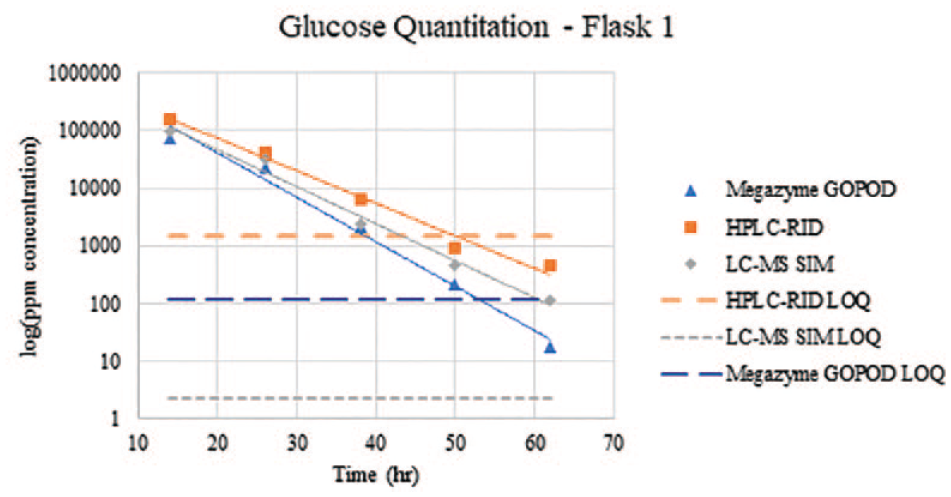
Decay of glucose concentration during the corn-to-ethanol fermentation process for flask 1 from T14 to T62. The y axis is in log scale to enhance visualization of the LOQ of the three analytical methods and the data points that fall below it. The data plotted are of raw data values, some of which were not reported due to results outside of the quantifiable range.
As shown in the Figure 1 , the concentrations of glucose in T50 and T62 are unable to be quantified by HPLC-RID as the concentrations fall below the LOQ. The glucose concentration in T62 was also unable to be quantified by Megazyme GOPOD due to being below the LOQ of the method. In contrast, the glucose concentrations were able to be determined for all fermentation samples collected from T14 through T62 by the LC-MS SIM method due to the lower LOQ.
Glucose Quantitation Results for the Three Tested Analytical Methods for Flask Fermentation Samples Collected at T14–T62 for Three Flask Fermentations.
Megazyme GOPOD Validation and Quantitation of Glucose
The calibration trend for glucose with the Megazyme GOPOD analytical method was linear over the 100–1000 ppm range, as expected by the UV-Vis detection of sugars and by the description of the Megazyme Assay procedure. The GOPOD analysis showed underestimation of glucose concentration in the middle (493 ppm) and low (150 ppm) regions of the calibration curve with percent accuracies of 82.4% and 73.9%, respectively. The accuracy results for glucose in the lower calibration region fell outside of the desired ±20% range. The Megazyme GOPOD analysis was not effective in determining the concentration of T62, as the results fell below the LOQ. Moreover, the concentration for each sample compared with the results of the other methods is underestimated, which can be expected based on the method validation results for accuracy. The GOPOD results are approximately half those of the HPLC-RID analysis.
HPLC-RID Validation and Quantitation of Glucose
The HPLC-RID calibration curve was linear over the linear dynamic range (LDR) 0.02%–5% glucose. The HPLC-RID analysis possessed the best coefficient of determination (COD; R2) of 0.9999, the best accuracy, and the best precision for standards within the high and medium region of the calibration curve. The check standard prepared to analyze the lower region of the calibration curve (400 ppm) for the HPLC-RID analysis fell below the LOD (500 ppm), so it could not be evaluated. The HPLC-RID has the best average precision for sample analysis (0.12%); however, results for T50 and T62 fell below the LDR.
LC-MS Preliminary Analysis and Method Development
Before the analysis for glucose could be performed by LC-MS SIM analysis, the ions produced by the positive-mode ESI of glucose needed to be identified. A glucose standard was analyzed by full-scan LC-MS to identify the most abundant ions produced by ESI under the set of parameters for which the results are presented in
To ensure that the identity of the analytes in the fermentation broth can be identified by these characteristic ions using positive-mode ESI, the broth was analyzed by full-scan LC-MS. Because identification of analytes by HPLC-RID analysis is performed by retention time comparison, it was important to observe the retention time of the analytes in a complex sample matrix versus a pure standard.
By using the HPLC-RID method of identification—retention time comparison of a standard with that in a sample—the retention times of the analytes as analyzed by full-scan LC-MS in a standard were compared with those observed for the fermentation sample (
LC-MS SIM Analysis Validation and Quantitation of Glucose
The LC-MS SIM analysis resulted in a calibration curve for glucose with a quadratic trend, where the signal intensity and concentration values were plotted in log–log scale. The nonlinear trends exhibited by MS detection are not abnormal, as a fundamental mathematical relationship between the analyte and detector response is not defined. The LC-MS SIM analysis resulted in the largest dynamic range in terms of orders of magnitude (5–1000 ppm) and the lowest LOQ (2 ppm) and LOD (0.09 ppm) values, which shows that this method has the lowest LOQ for glucose of the three tested. The LC-MS SIM analysis showed overestimation of glucose concentration in the higher region of the calibration curve (400 ppm) with a percent accuracy of 109%, but an underestimation in the lower region of the calibration curve (15.0 ppm) with a percent accuracy of 89.9%. It should be noted, though, that the calculated concentrations as determined by the LC-MS SIM method are approximately half those as determined by HPLC-RID and closer to those from GOPOD.
Glucose Quantitation Statistical Analysis
The statistical analysis performed to compare the quantitation results between the biological flask replicates and between methods for each of the target analytes employed a paired sample t test of the results. All statistical tests were performed with the IBM SPSS Statistics software (version 25; Armonk, NY). With a 95% confidence level (α = 0.05), the means were compared to see which results were statistically different, such that the null hypothesis (HO) is that the results are equal, and the alternate hypothesis (HA) is that the results are statistically different. The paired sample t test measures the difference between means of a data set but does not account for large orders of magnitude differences among data sets; because of this, the quantitation results were analyzed in log scale to compress the data into a smaller ordinal region.
The paired sample t test comparing the flasks and samples resulted in p ≥ 0.05 (
Preview of Analysis of Higher-Order Sugars: Future Direction
Methods are currently being studied for the quantitation of maltose (DP2) and maltotriose (DP3) by LC-MS analysis. These analytes are also commonly analyzed by the HPLC-RID method featured in this research, while glucose was the only analyte analyzed by Megazyme GOPOD because the chemical reaction is specific to
Results for the Method Validation of Maltose and Maltotriose Quantitation for HPLC-RID and LC-MS SIM.
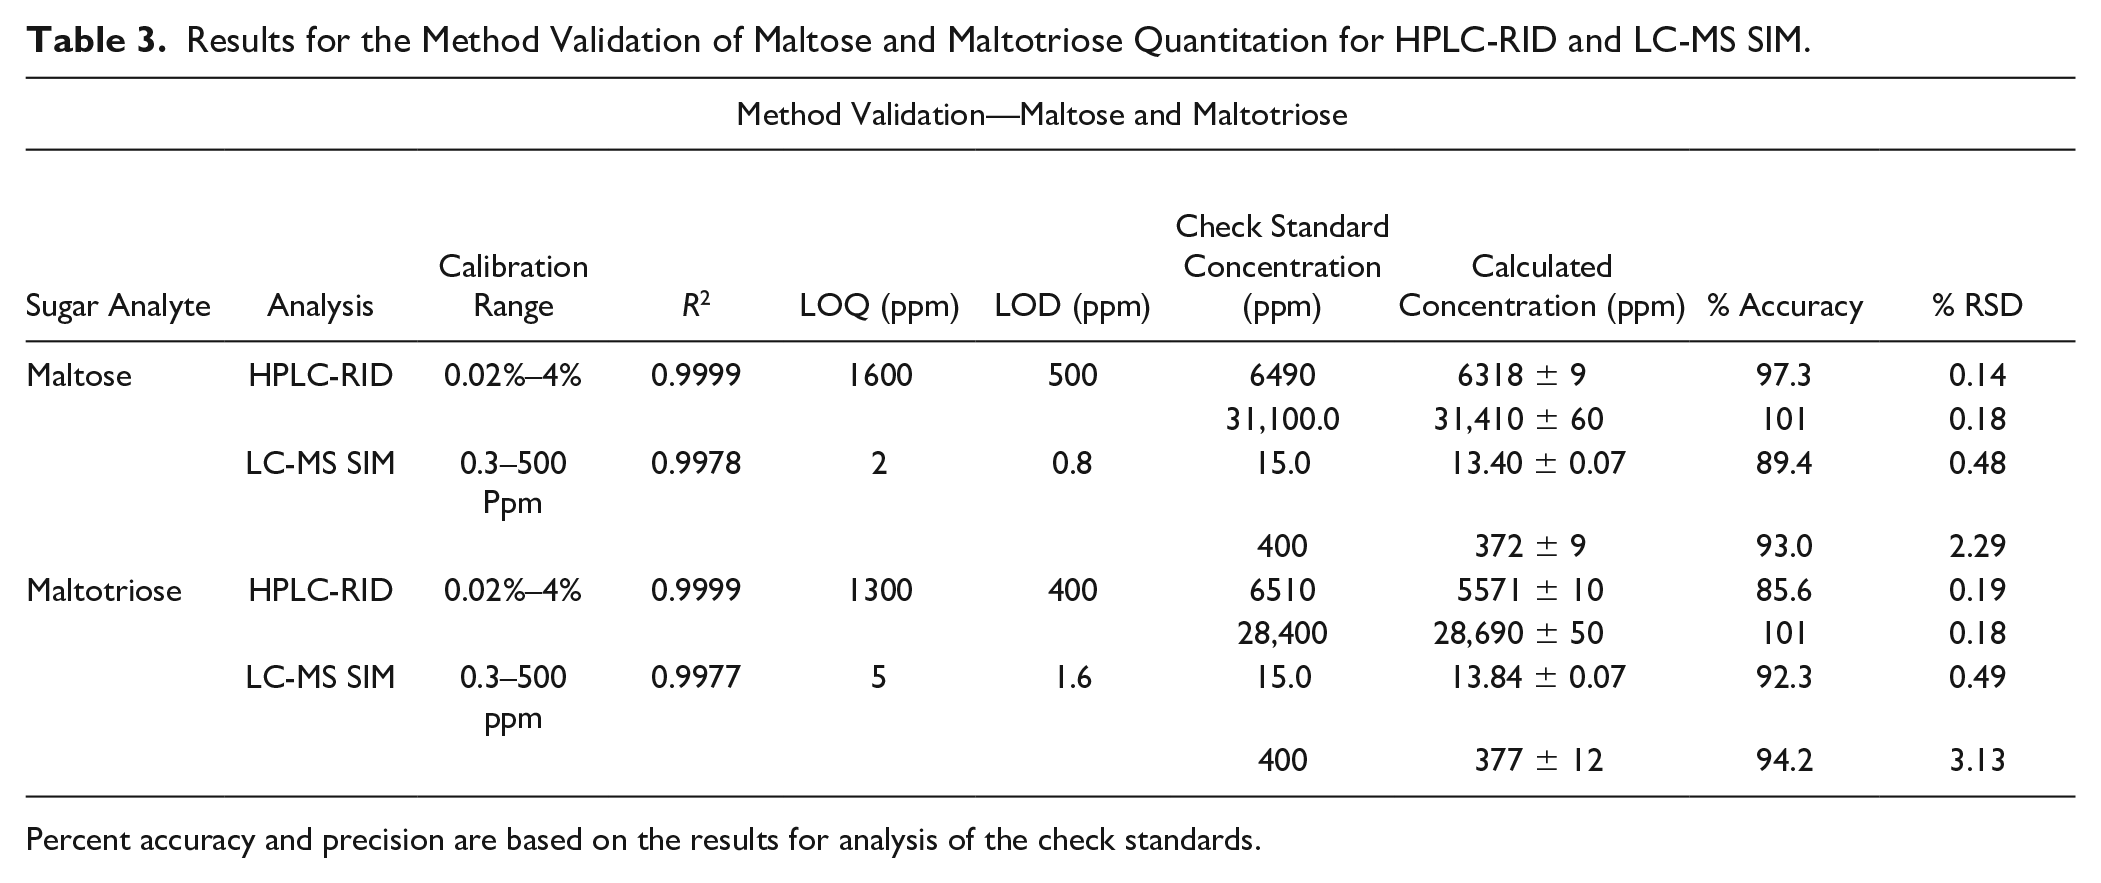
Percent accuracy and precision are based on the results for analysis of the check standards.
The calibration for the HPLC-RID analysis was linear over the dynamic range for maltose and maltotriose, as it was for glucose, while the calibration curves for the LC-MS SIM analysis of glucose, maltose, and maltotriose were all found to be quadratic in log–log scale over their respective dynamic ranges.
As for glucose, the method validation for the quantitation of maltose showed that the HPLC-RID method resulted in the best R2 (0.9999) and the best accuracy (97.3% and 101%, respectively) and precision (0.14% and 0.18% RSD, respectively) in the middle and high ranges of its calibration. The LC-MS SIM analysis had the largest dynamic range (>3 orders), high precision (<3%), and significantly lower LOQ and LOD values (2 and 0.8 ppm, respectively) than the HPLC-RID analysis, and had accuracy within ±11%.
While the results for the lowest LOQ and LOD, greatest COD, and largest dynamic range for the maltotriose quantitation method validation mimic those of the maltose quantitation validation, one major difference was seen for the maltotriose quantitation as compared with the quantitation methods for the other sugars: the percent accuracy for the HPLC-RID analysis decreased to 85.6%, whereas the accuracy had been within ±4% for glucose and maltose in the regions of the calibration curves tested. With this, the average percent accuracies for the HPLC-RID maltotriose quantitation method and the LC-MS SIM quantitation method were both 93.3% for check standards analyzed at concentrations in the middle and high ends of the calibration range, though the LC-MS SIM analysis showed greater consistency in the percent accuracies (92.3% and 94.2%, respectively) than the HPLC-RID analysis (85.6% and 101%, respectively).
Following the method validation for maltose and maltotriose quantitation by HPLC-RID and LC-MS SIM, the methods were applied to quantify the DP2 and DP3, which occurred simultaneously with glucose quantitation. The quantitation results for the HPLC-RID method and the LC-MS SIM method are featured in
DP2 and DP3 Quantitation Results for the Two Tested Analytical Methods for Flask Fermentation Samples Collected at T14–T62 for Three Flask Fermentations.
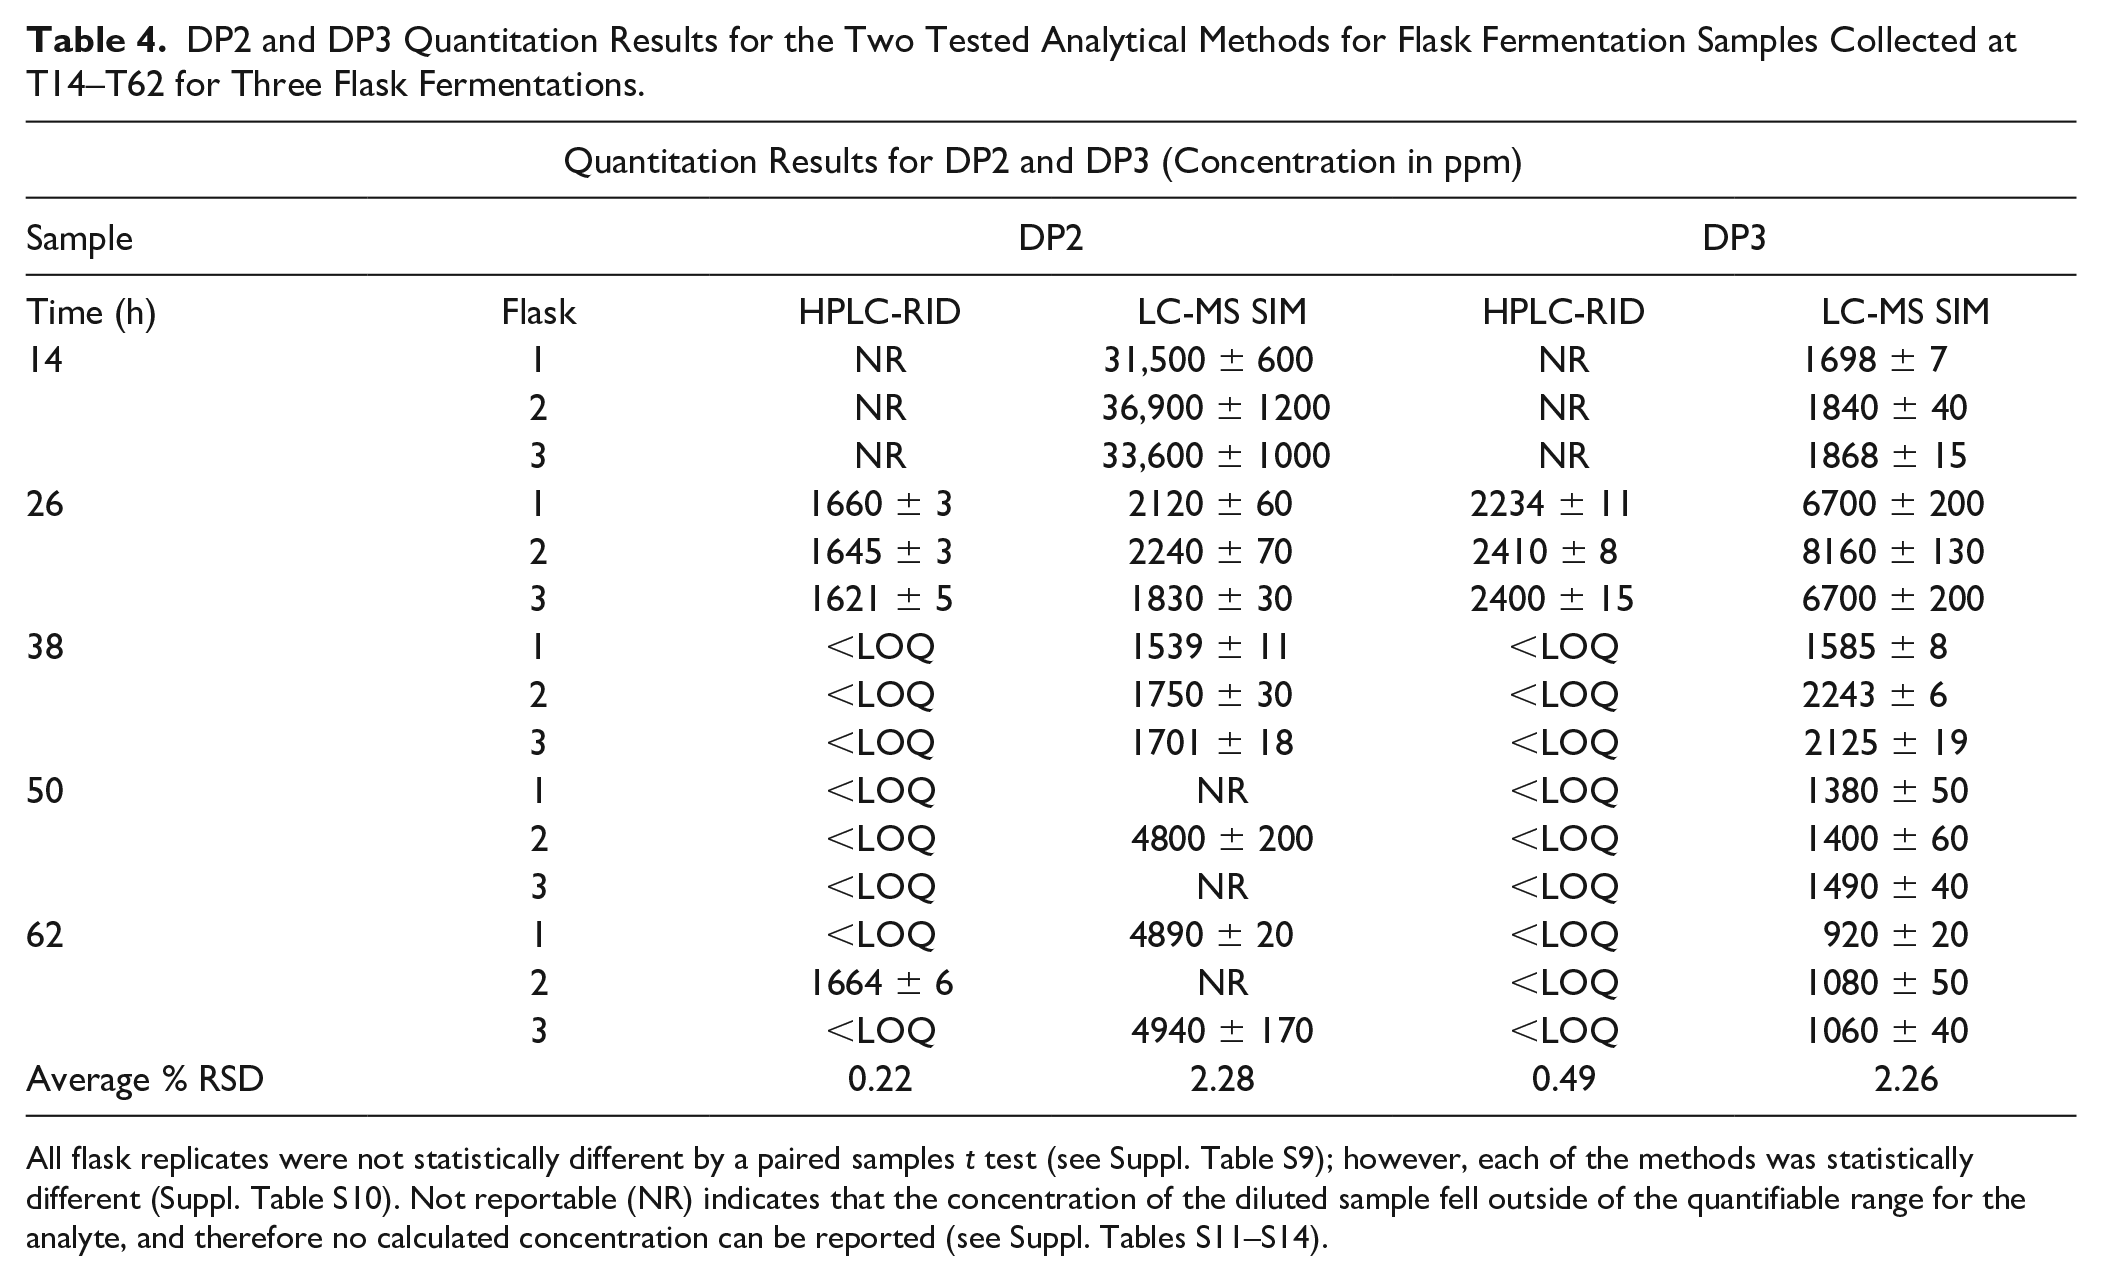
All flask replicates were not statistically different by a paired samples t test (see Suppl. Table S9); however, each of the methods was statistically different (Suppl. Table S10). Not reportable (NR) indicates that the concentration of the diluted sample fell outside of the quantifiable range for the analyte, and therefore no calculated concentration can be reported (see Suppl. Tables S11–S14).
The LC-MS SIM method was able to quantify all samples at T14–T38, where the calculated concentrations of DP2 for samples from T50 (flasks 1 and 3) and T62 (flask 2) were greater than that of the highest calibrator. The HPLC-RID method was only able to quantify all samples from T26, whereas the calculated concentrations for all other samples (except T62 flask 2) fell below the LOQ and the diluted concentration of DP2 at T14 fell below the LOD (see
While there is a known pattern of exponential decrease in glucose during fermentation, the trend of maltotriose or DP3 concentration during the process is less defined. The concentration of DP3 is dependent on a quasi-equilibrium state between larger molecules’ (starch, DP4+, etc.) hydrolysis and the hydrolysis of itself into small saccharides that are readily metabolized (glucose). Because DP3 is not directly metabolized by fermenting species and its concentration is dependent on other biological components (enzymes), the rate of depletion, and thus the concentration of DP3 throughout the corn-to-ethanol fermentation process, is variable.
Similar to the DP2 quantitation results, the HPLC-RID method was only able to quantify all samples from T26, whereas the calculated concentrations for all others fell below the LOQ and the diluted concentration of DP3 at T14 fell below the LOD (
Conclusions
The use of MS coupled to HPLC for the analysis of glucose, maltose, and maltotriose was successful in determining the presence of the analytes in corn-to-ethanol fermentation samples. Additionally, the identity comparisons between LC-MS and HPLC-RID showed the potential for misidentification of the sugar analytes by retention time comparison of standards and the sample. As shown in
Using the Agilent 6460 LC-MS with positive-mode ESI, common ionization products for glucose, maltose, and maltotriose were identified. The optimization of ionization production led to the quantitation of glucose by Megazyme GOPOD, HPLC-RID, and LC-MS SIM. All three analytes were quantified using the same sample unless otherwise stated, where dilutions made prior to analysis were based on the NCERC protocol (T14 and T26 for HPLC-RID). Because of this, and the LOD and LOQ values for each method, the HPLC-RID analysis was unable to quantitate all three analytes simultaneously for any sample except T26; prior to analysis, T26 was both diluted by a factor of 10 and analyzed as the original sample. Despite HPLC-RID resulting in the best accuracy and precision, its high LOD and LOQ make it impractical for detecting three analytes that exist at vastly different concentrations from each other at different points in the fermentation process.
The LC-MS SIM analysis met all method validation parameters with calibration curves that covered 2.5–3 orders of magnitude, LOQ values all below 5 ppm, and accuracy values all within ±11%. The precision of DP3 quantitation resulted in the largest percent RSD for a value of 3.13% for the check standard of 400 ppm quantitation, just outside of the desired range. However, glucose and DP2 quantitation per method validation and the sample quantitation results for all three analytes gave precision results of <3% RSD. Also, the LC-MS SIM method allowed for quantitation of all analytes in all samples, except T50 flasks 1 and 3 and T62 flask 2 for DP2 analysis, where the concentration was found to be just above the highest calibrator (i.e., >500 ppm). This can be accounted for with dual analysis of the sample with different dilution factors or adjusting the concentration of the highest calibrator.
This research has shown the disadvantages of using chromatographic techniques paired with RID for the identification and quantitation of sugar analytes in fermentation broth samples. While MS shows great promise in being an ideal detection and quantitation method for these goals, other alternatives to RID could be explored, such as evaporative light scattering detection (ELSD). ELSD would allow for the use of gradient elution as the response is independent solvent composition and is not sensitive to temperature fluctuation, unlike RID.38,39 As ELSD, like RID, is not a selective detection method, the ability to utilize gradient elution would allow for various chromatographic techniques and parameters to be explored for the separation of carbohydrates in fermentation samples.
The same variations in chromatographic technique could be applied with the MS technique currently being utilized in this study for further optimization of the quantitation analysis for glucose, as well as maltose and maltotriose. Further optimization of the LC-MS methods, such as stationary phase and mobile phase, would lead to improvements in the separation of all the analytes present and minimization of matrix effects. While size-exclusion chromatography can separate analytes based on size and shape, the elution of molecules of similar molecular weights and structures may cause signal interference if there is overlap or near-simultaneous elution. Additionally, the distinction between other sugars that could be present in the fermentation mixture of similar molecular weight to the analytes discussed in this research, such as fructose and trehalose, has not been made with ion identification. Utilization of different HPLC parameters and analysis of these saccharides could further optimize LC-MS analysis for the identification and quantitation of target sugar analytes.
Supplemental Material
Supporting_Information_Bilskey_et_al_Revision_2 – Supplemental material for A Comparative Analysis of Methods for Quantitation of Sugars during the Corn-to-Ethanol Fermentation Process
Supplemental material, Supporting_Information_Bilskey_et_al_Revision_2 for A Comparative Analysis of Methods for Quantitation of Sugars during the Corn-to-Ethanol Fermentation Process by Sarah R. Bilskey, Samantha A. Olendorff, Karolina Chmielewska and Kevin R. Tucker in SLAS Technology
Footnotes
Acknowledgements
We acknowledge Dr. Yanhong Zhang and her team from the National Corn-to-Ethanol Research Center at Southern Illinois University Edwardsville for their assistance on the project.
Supplemental material is available online with this article.
Declaration of Conflicting Interests
The authors declared no potential conflicts of interest with respect to the research, authorship, and/or publication of this article.
Funding
The authors disclosed receipt of the following financial support for the research, authorship, and/or publication of this article: Southern Illinois University Edwardsville: start-up funds, research grants for graduate students, and the Undergraduate Research and Creative Activities Program.
References
Supplementary Material
Please find the following supplemental material available below.
For Open Access articles published under a Creative Commons License, all supplemental material carries the same license as the article it is associated with.
For non-Open Access articles published, all supplemental material carries a non-exclusive license, and permission requests for re-use of supplemental material or any part of supplemental material shall be sent directly to the copyright owner as specified in the copyright notice associated with the article.