
Abstract
Single-cell isolation and cloning are essential steps in many applications, ranging from the production of biotherapeutics to stem cell therapy. Having confidence in monoclonality in such applications is essential from both research and commercial perspectives, for example, to ensure that data are of high quality and regulatory requirements are met. Consequently, several approaches have been developed to improve confidence in monoclonality. However, ensuring monoclonality using standard well plate formats remains challenging, primarily due to edge effects; the solid wall around a well can prevent a clear view of how many cells might be in a well. We describe a method that eliminates such edge effects: solid confining walls are replaced by transparent fluid ones, and standard low-cost optics can confirm monoclonality.
Introduction
Single-cell isolation and cloning are critical steps in many high-value biological workflows, including the production of monoclonal antibodies,1–3 stem cell therapy, 4 and gene editing. 5 For these applications, it is of paramount importance that a selected colony derives from a single progenitor. The method of limiting dilution is commonly used to isolate single cells;6–10 a cell suspension is dispensed into wells of a microtiter plate using a distribution of less than one cell per well. Cell numbers per well follow Poisson’s distribution. However, assurance that there is one, and only one, cell per well is challenging, so users often take cells from the resulting colony and perform a second round of cloning to increase confidence in monoclonality—adding significant time and cost to the workflow.
The challenge of ensuring monoclonality has been well documented by regulatory authorities, 11 who note that it is insufficient to show a single colony in a well during a cloning round. Instead, it should be demonstrated that only a single cell was originally plated in a well, ideally by imaging the entire well with sufficient resolution to identify the single progenitor. Identification of single cells in flat-bottomed well plates becomes complicated in the region where the well base meets the vertical wall. This junction produces an “edge effect,” which usually manifests itself as dark/blurred regions due to artifacts resulting from the effects of refractive index and curvature; this makes single-cell identification both challenging and time-consuming. Fluorescent labeling is commonly used to determine if just one cell is present, but this brings additional cost and may adversely affect cell viability—and so may not be suitable for some workflows. Another difficulty when utilizing well plates is cell settling time; this can be reduced using a centrifuge, but this may also be harmful and laborious.
Many methods, more advanced and costly than limiting dilution, are routinely used or currently in development, to facilitate, automate, and accelerate cloning in standard microplate formats. The most established is fluorescence-activated cell sorting (FACS),12,13 which allows fluorescently labeled cells to be sorted rapidly and efficiently. However, cell labeling plus the high pressure and shear rates involved may adversely affect viability,14,15 especially of sensitive cells. Other methods include inkjet printing,16–18 manual cell picking, and the use of optical tweezers or laser microdissection; 15 some use label-free optical methods, and deposition into wells to give a higher fraction containing single cells than is achievable using limiting dilution—allowing one to “beat” Poisson’s limit. However, most provide confirmation that a single cell is present prior to deposition into a well, rather than after deposition. A wide range of microfluidic devices have also been developed for single-cell cloning,15,19,20 but have disadvantages associated with cell proliferation rate, colony retrieval, and nonstandard formats that are not easily integrated into existing workflows.
We now describe a simple microfluidic method that can provide confidence in monoclonality and is microplate compatible. Critically, rather than working around difficulties associated with edge effects, cell labeling, and spin-down requirements, we eliminate them by confining liquids within fluid walls rather than solid ones. In its simplest form, a sessile drop of media (perhaps containing a single cell) is placed on a standard polystyrene dish used for tissue culture, and some of the media is withdrawn by an automated aspirator. This leaves a relatively flat drop pinned to the dish by interfacial forces. The drop is bounded on the lower side by polystyrene and on the upper side by an air/media interface. This interface is optically transparent, and—after collecting an image using a standard microscope—one can obtain a clear view of whether the drop contains a single cell. Optical clarity can further be enhanced by overlaying the drop with an immiscible liquid that has a refractive index closer to that of the medium; we use a biocompatible fluorocarbon, FC40. Arrays of square droplets—which we call GRIDs—are easily made with chambers arranged in any chosen format and which can hold volumes from a microliter down to a few nanoliters.21–23 For proof of concept, we study GRIDs with 256 individual chambers sitting in a standard 60 mm tissue culture dish. In principle, the method can be incorporated into high-throughput workflows by increasing chamber density in a 60 mm dish (by 256-fold 22 ) or surface area (e.g., using a standard one-well microplate 22 ).
Materials and Methods
Theory
The maximum angle, µm, for which light rays are accepted by a microscope objective in air can be calculated with knowledge of the numerical aperture (NA):

Rays with angles exceeding µm do not reach the image plane and so result in dark regions.
24
As rays pass through the curved liquid surface of a sessile drop, the change in refractive index results in refraction according to Snell’s law. Consider a drop of water (refractive index n = 1.33) sitting on the bottom of a well in a polystyrene microplate (n = 1.58) in air (n = 1). If the drop radius is less than the capillary length (
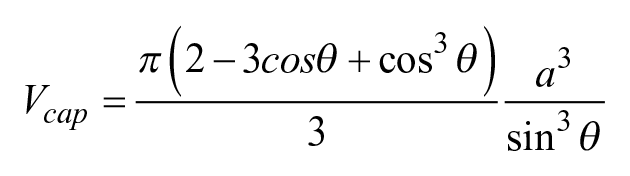


For a known volume and footprint area, the entire drop geometry can be evaluated. Then, the angle between a tangent at any point on the surface and the horizontal, α ( Fig. 1A , B ), is given by

Using this angle, the trajectory of a light ray through a sessile drop can be determined using Snell’s law. Figure 1B illustrates paths of parallel rays through a drop on polystyrene as they pass through air/water interfaces (continuous lines) or FC40/water interfaces (dashed lines). If the rays are refracted such that their exit angle, µ, exceeds µm, then the image will appear dark in the regions shown in Figure 1C , where Ra coincides with µ = µm. In white regions, µ < µm, and in dark regions, µ > µm. When the drop is overlaid with an immiscible fluid such as the fluorocarbon, FC40, with n = 1.29, µ is lower than in air due to the higher refractive index (green paths in Fig. 1B ).
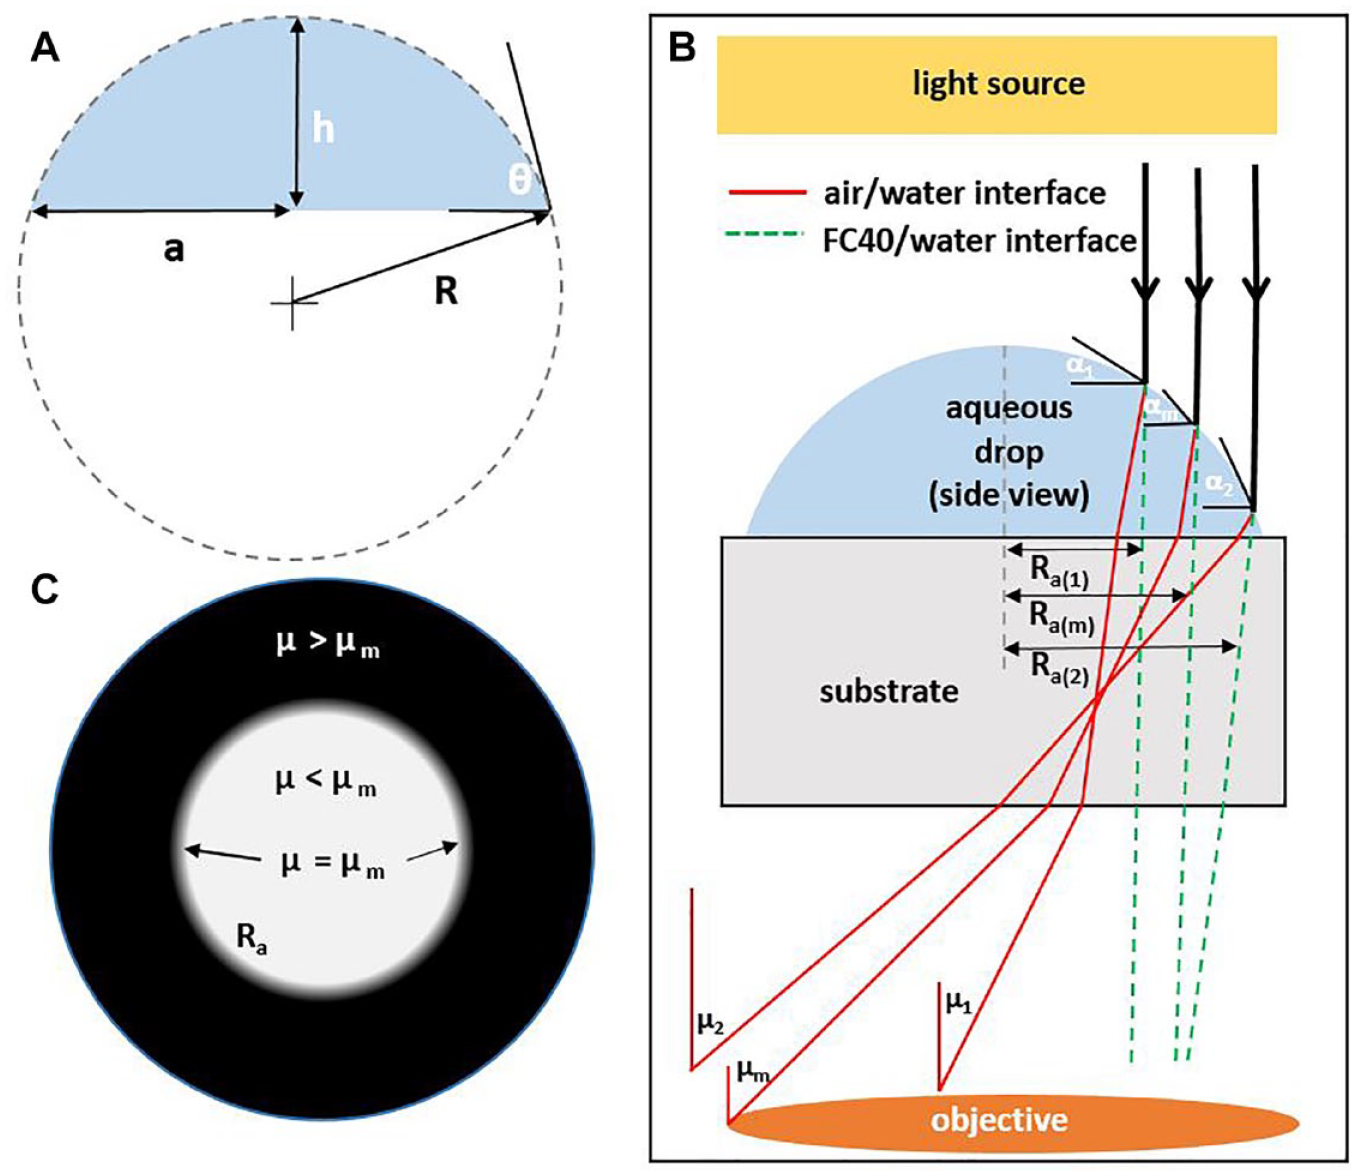
Schematics illustrating drop parameters. (
Reagents and Equipment
All reagents and materials were purchased from Sigma-Aldrich (St. Louis, Missouri), unless otherwise specified. Matrigel (Corning, cat. 3542777) was used for Figure 5A , iii . FC40 was supplied by iotaSciences Ltd. (Oxford, UK). All GRIDs and sessile droplets were made on 60 mm tissue culture-treated cell culture dishes (Falcon, cat. 353002). Where indicated, droplets contain Allura Red dye.
All fluidic arrangements were created and manipulated using a custom mini-printer (iotaSciences) and custom software. This printer consists of a three-axis traverse, which holds a Teflon rod (used to create fluid walls of FC40) and a dispensing needle connected to a syringe pump that is used to add or remove liquids to or from chambers in GRIDs and droplets.
Cell Culture
All cell lines were grown routinely in cell culture flasks at 5% CO2 at 37 °C. Preliminary tests to demonstrate reliable single-cell identification in droplets (
Figs. 2
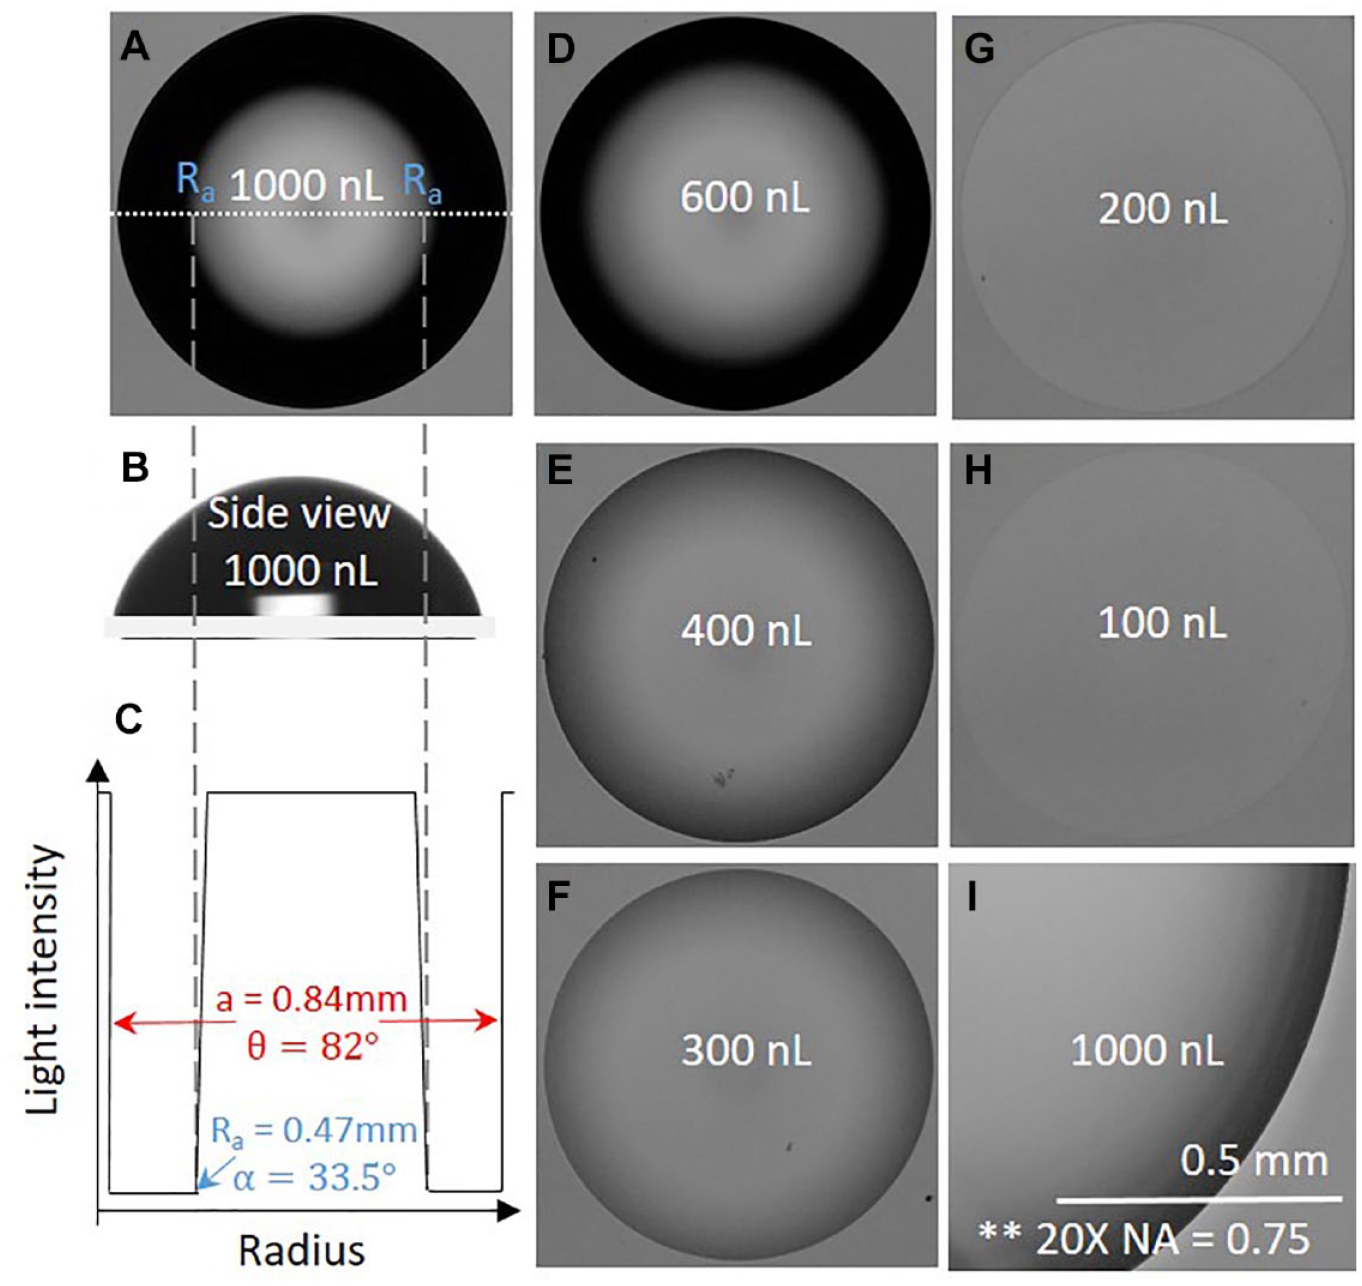
Images of drops of media with different volumes but identical footprints sitting in air on a polystyrene dish. Drops of 1000 nL were deposited and 0–900 nL removed. Footprints remain identical (diameters 1.68 mm) because media is firmly pinned to the dish as the receding contact angle is never reached (as that angle is sufficiently low). (
Identifying cells in sessile drops. All drops have the same footprint area but contain 1000 or 400 nL ± HEK cells. Images were collected immediately after plating, so cells had not yet adhered to the surface. Images were collected with a 10× objective (NA = 0.25). (
Cells were plated by “scanning” 22 in 1.9 × 1.9 mm chambers in GRIDs that contained 400 nL of medium, at densities of 0.1 and 1 cell/chamber. In assays assessing the effects of different feeding regimes ( Suppl. Figs. S2B and S3 ), replenishment was done by removing 350 nL of old medium and adding the same volume of fresh medium, using the custom-built mini-printer.
Imaging Droplets
To identify single cells in standard 96-well plates, it is important that the entire region in the well where cells might have been deposited can be imaged clearly; in general, enhanced optical clarity lowers microscopy and labor costs. We will show that replacing the solid walls that confine cells with liquid ones improves optical clarity obtained using standard low-cost microscope objectives. This method was validated by placing eight 1 µL sessile drops of cell media (DMEM + 10% FBS) on a standard polystyrene petri dish used for tissue culture. Fluid was extracted from seven drops using a syringe pump, leaving drops with 100–1000 nL ( Fig. 2 ). All drops have the same footprint area, as FBS prevents the pinning line from receding, 26 and drops with the lowest volumes have the smallest contact angles. Drops were imaged for less than 10 s after formation to minimize evaporation using a Nikon D610 DSLR mounted on an IX53 inverted microscope (Olympus), operating in bright-field mode, and fitted with a 10× objective (Olympus A10 PL; NA = 0.25). The method works in both bright-field and phase-contrast modes, although the former was exclusively used here. Contact angles, θ, were calculated using equations from the Theory section above from the measured footprint area (obtained using the calibration ruler in the microscope) and volume. They were also measured directly by the sessile drop method using the First Ten Angstroms (FTA) instrument and software. For the latter method, drops were formed by ejecting a 1 µL drop using a needle (33G blunt NanoFil needle; World Precision Instruments) connected to a syringe pump (Harvard Ultra) through a Teflon tube. Drops were gently transferred to the surface of a square cut from the base of a Corning 60 mm suspension culture dish made from polystyrene, and then imaged from the side. The resultant equilibrium contact angles in air were ~82° and ~80° using the analytical and sessile drop methods, respectively.
Imaging GRIDs
Supplemental Figure S1A illustrates how GRIDs in standard tissue culture dishes are created, using a dispensing needle mounted on a three-axis traverse system. Cells are plated in individual chambers in a GRID using a swift scanning motion. Due to the low volumes contained within these chambers (i.e., 400 nL) and the FC40 overlay, the rectangular footprints yield similar optical clarity to droplets in Figure 3C,ii .
For Figures 4A , 4B , 5A,iii , and 5B the same inverted microscope and objective was used to image each individual chamber.
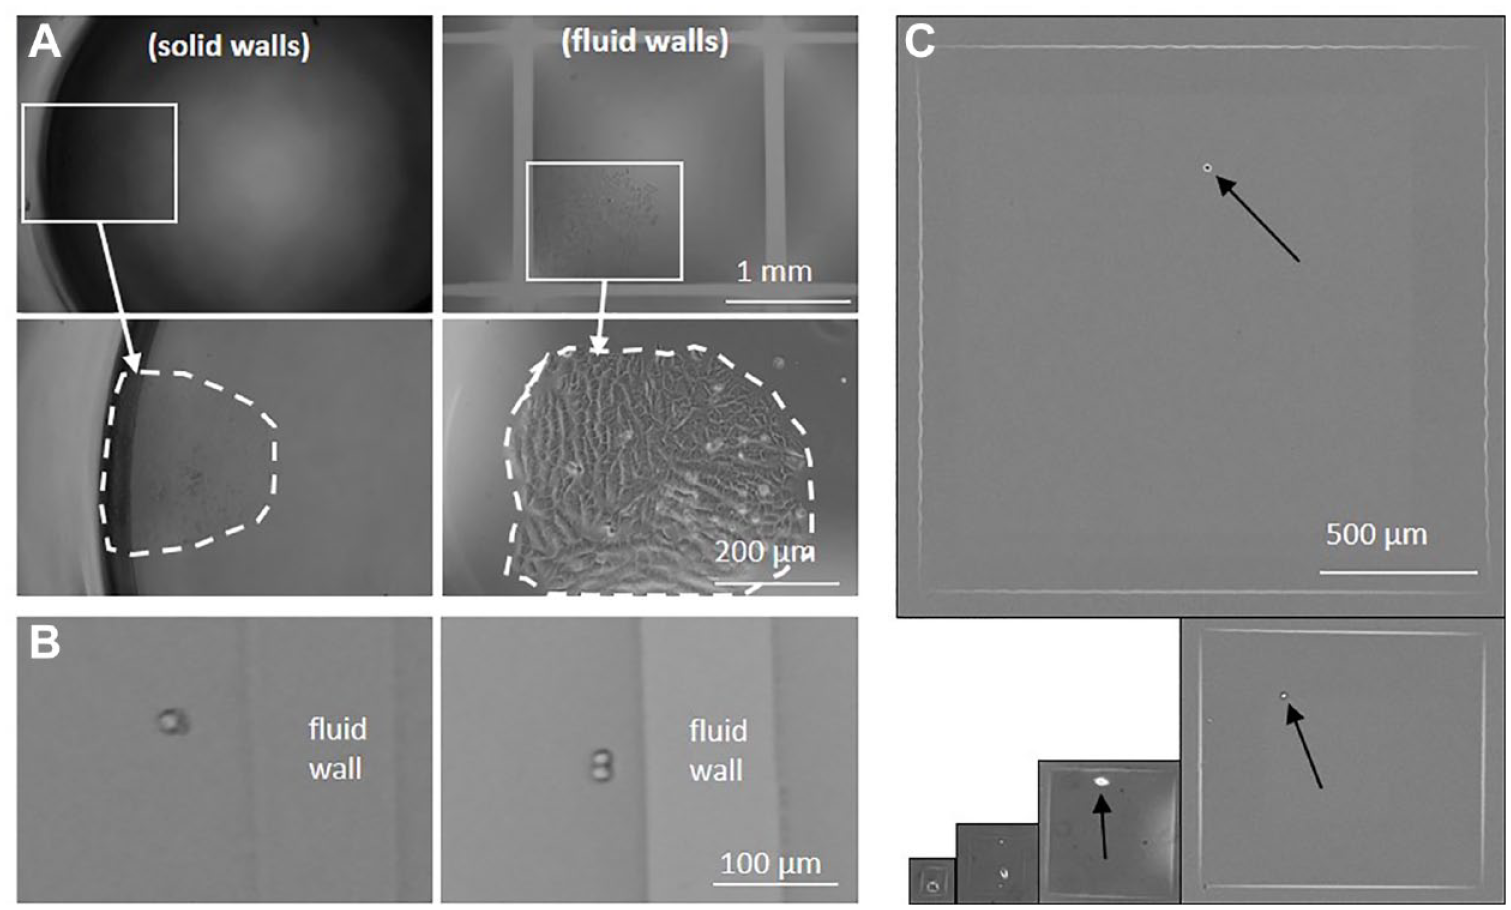
Comparing optics in chambers with solid and fluid walls. (
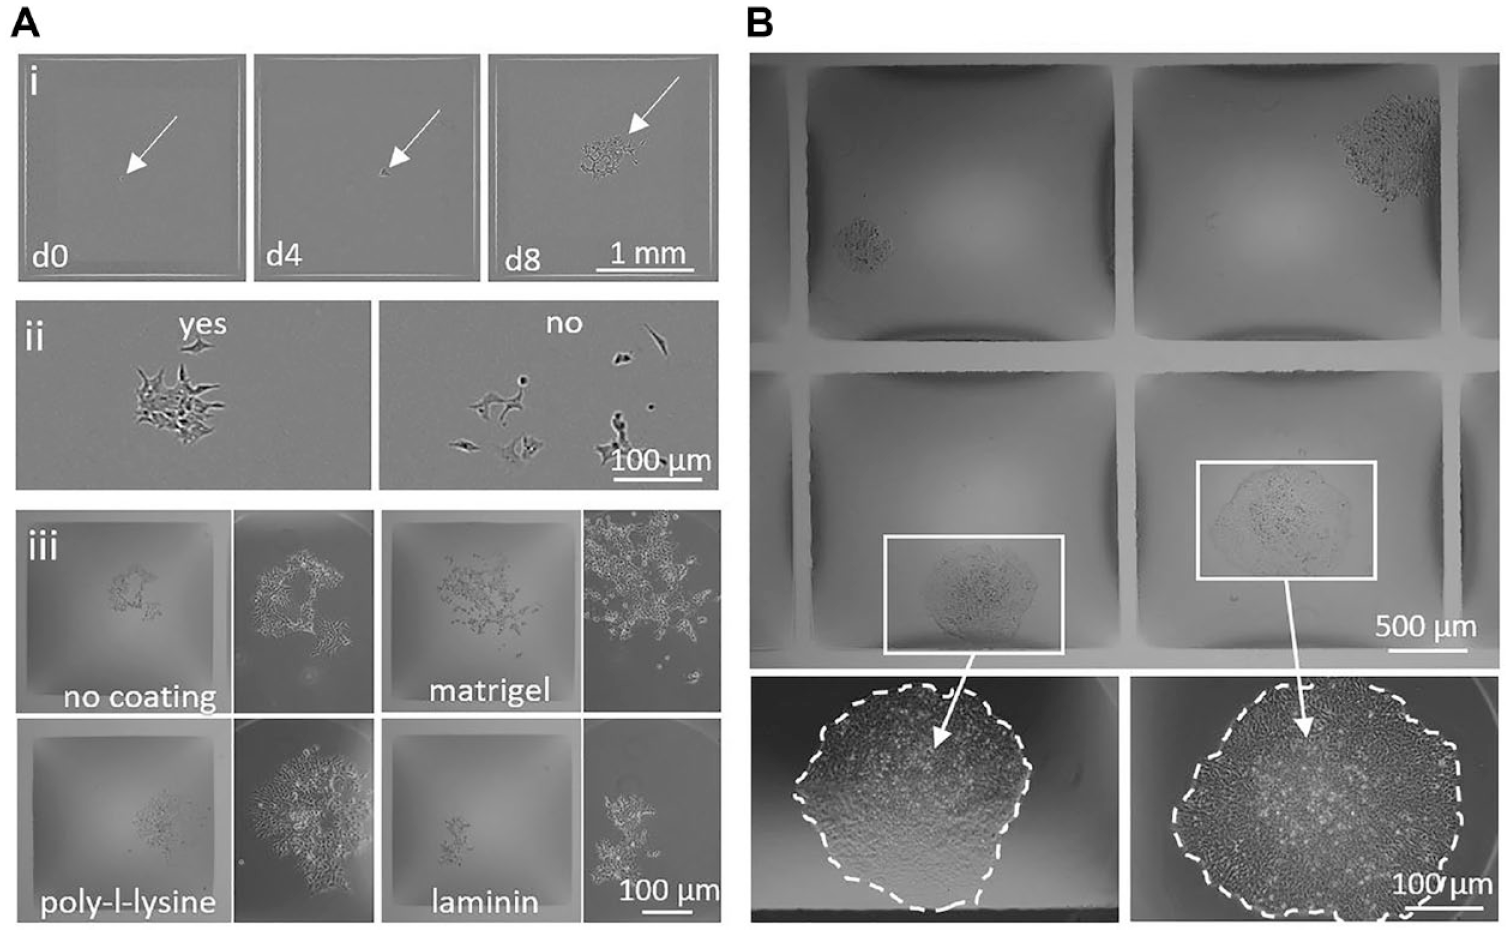
Cloning in chambers (1.9 × 1.9 mm) with fluid walls. (
Images in Figures 4C , 5Ai , and 5Aii were taken using an IncuCyte ZOOM, a commercial live-cell imaging system (Sartorius, Gottingen, Germany). Data illustrated in Supplemental Figures S2 and S3 was collected using the IncuCyte and a second commercial imaging system, cytoSMART Omni (cytoSMART, Eindhoven, Netherlands). For these experiments, GRIDs were imaged immediately after plating single-cell suspensions. Images were analyzed to locate chambers containing single cells and cells in the chambers were fed using the regimes indicated ( Suppl. Figs. S2B and S3 ); colonies were imaged after 8 days.
Results
Consider the image in Figure 2A of a 1000 nL drop of tissue culture medium sitting on a polystyrene petri dish in air. A black ring surrounds the gray central area. As the drop radius is less than the capillary length (see Materials and Methods), the drop’s shape is that of a spherical cap ( Fig. 2B ). The radius, Ra, at the transition point between bright and dark regions was measured ( Fig. 2C ), and then light-ray paths and diffraction angles were calculated ( Fig. 1B ; Materials and Methods); some results are shown in the first row of Table 1 .
Geometric Parameters Calculated for Drops Like Those Shown in Figure 2 Assuming Their Shape Is Equivalent to the Cap of a Sphere.
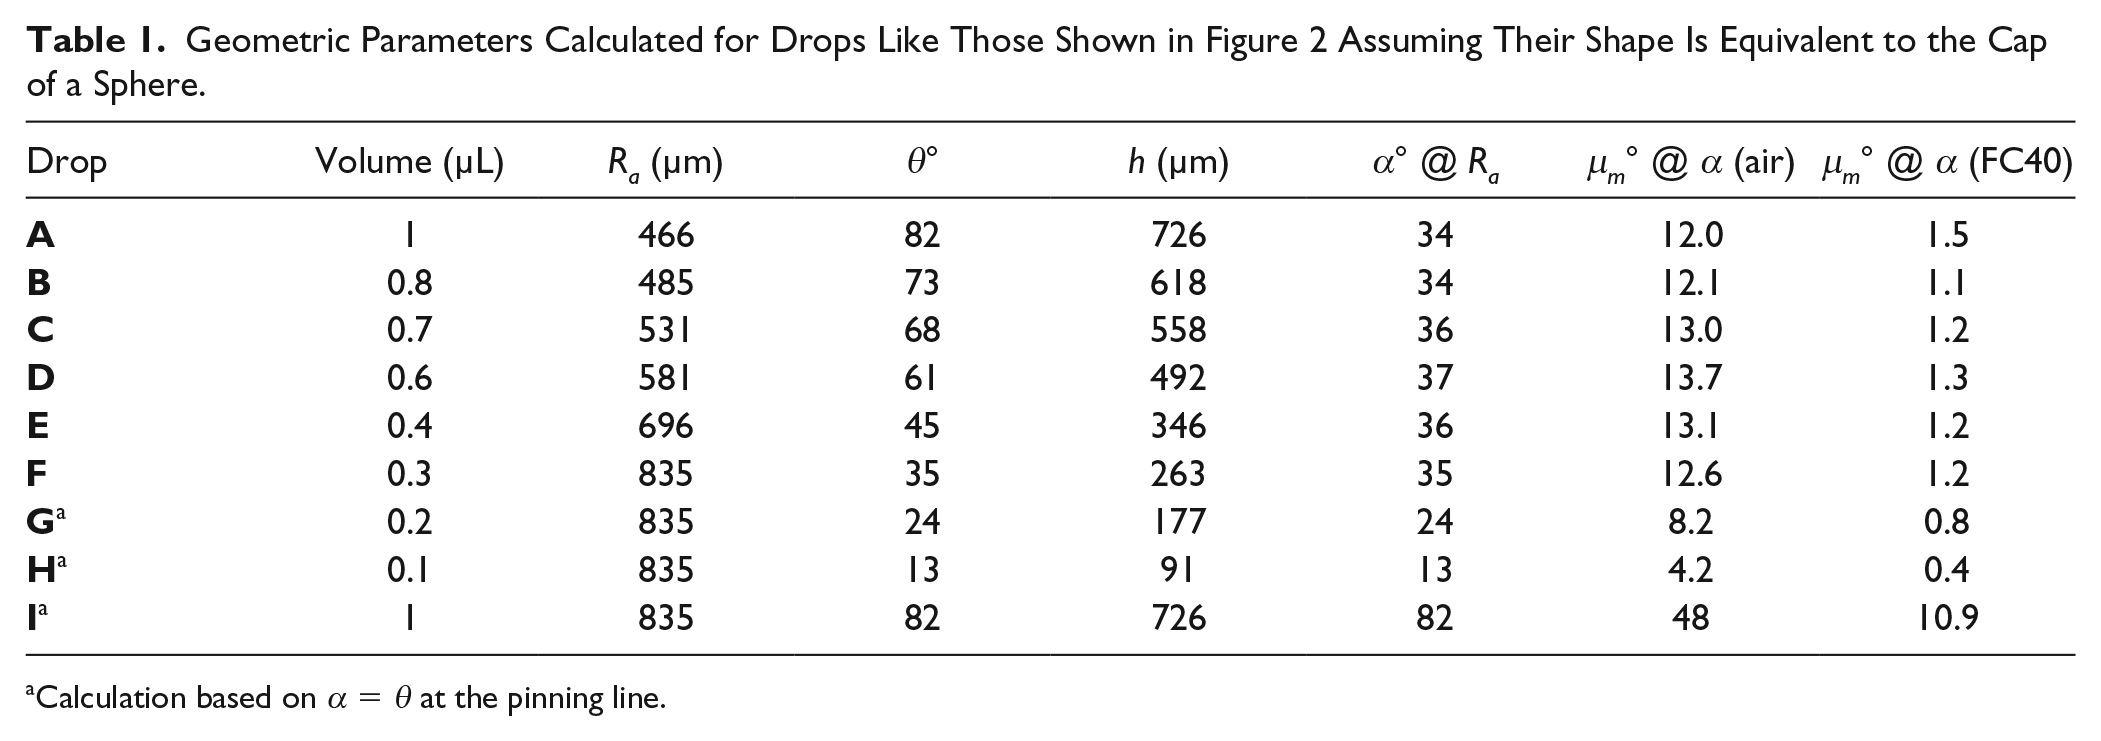
Calculation based on α = θ at the pinning line.
Drops with smaller volumes but similar footprints were made by depositing 1000 nL and then removing up to 900 nL (
Fig. 2D–H
). Footprints remain unchanged on removal because the receding contact angle is sufficiently low thus is never reached; consequently, the media does not recede and remains firmly pinned to the dish,
22
as illustrated in
Imaging Cells in Sessile Drops
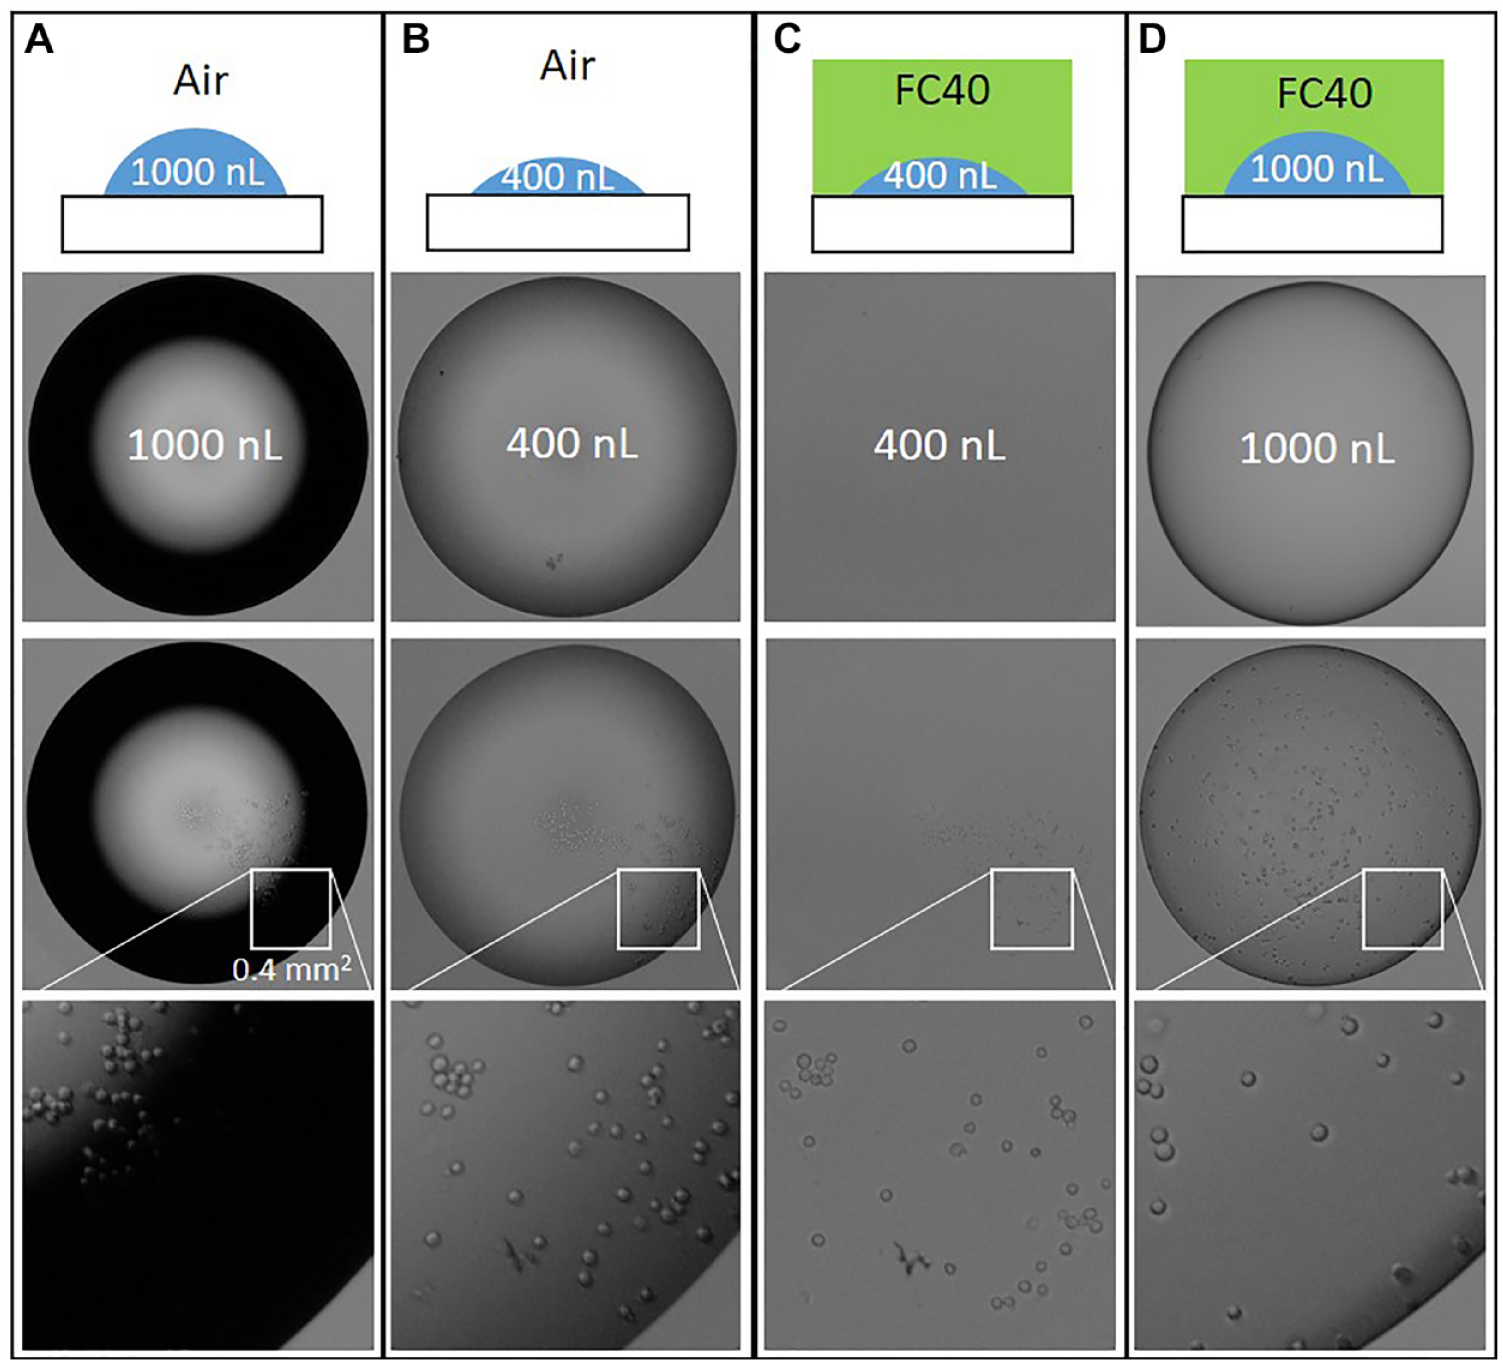
To evaluate whether individual cells can be seen clearly in such drops, drops (now containing HEK cells) with constant footprints but varying volumes were prepared on tissue culture-treated dishes and imaged immediately using a standard low-cost 10× objective ( Fig. 3 ). As before, decreasing the volume and adding an FC40 overlay reduces the width of the dark ring, and the combination eliminates it completely; consequently, cells throughout the volume can be seen clearly. Of course, use of higher magnifications and numerical apertures further increases resolution. As 1000 nL drops have a substantial height ( Table 1 ), some cells may not have settled on to the bottom when images are collected; however, they can still be detected, even though they may be out of focus (e.g., arrowed cells in Fig. 3D,iv ). Of course, using drops with smaller volumes (and so heights) brings essentially all cells in the volume into sharp focus ( Fig. 3C,iv ). These results show how the slight edge effects associated with the use of fluid walls, and problems associated with the failure of cells to settle rapidly, are easily mitigated.
Comparing Optics in Conventional Wells with Their Equivalents Made with Fluid Walls
Although arrays of sessile drops under FC40 that have circular footprints are made easily,
21
we now prefer to use alternatives with square footprints.
22
This geometry is useful for creating a high number of chambers efficiently, while maximizing the surface area used. We call such arrays GRIDs. GRIDs are made by reshaping media and FC40 already sitting in a dish (
Suppl. Fig. S1
22
). First, the bottom of a standard petri dish is covered with a thin film of media (approximately 50 µL), a 1 mL FC40 overlay added to prevent evaporation, and a Teflon stylus (approximately 100 µm wide) lowered on to the bottom of the dish. As FC40 wets the stylus and polystyrene better than media, it runs down to the substrate. Moving the stylus sideways then “prints” a fluid wall of FC40 that is tightly attached to that substrate, held by interfacial forces. Drawing more lines then creates a GRID, in which neighboring chambers containing media are separated by liquid walls of FC40. GRIDs with hundreds to thousands of chambers containing volumes down to a few nanoliters can be made, using the custom mini-printer. Here, we use GRIDs with 256 chambers made on 6 cm dishes in less than 90 s.
22
Liquids can be added to, and removed from, individual chambers simply by pipetting through the liquid FC40 walls; then, within wide limits determined by advancing and receding contact angles, the fluid walls morph above an unchanging footprint. The walls also prove robust during handling;
22
for example, a dish containing a GRID can be inverted (so essentially all FC40 drains out of the dish, leaving only a thin layer covering the wells and fluid walls—approximately a few microns high), but all chambers (and their aqueous contents) remain tightly attached to the dish (
Suppl. Fig. S1B
). Cells are deposited into chambers using a high-speed scanning motion
22
performed by the mini-printer, in which a dispensing needle moves at constant speed and height above the chamber as it infuses a cell suspension. Each chamber receives the same volume (
Figure 4A illustrates images of two colonies of adherent HEK cells, one growing near the solid wall of a microplate well, the other at a fluid wall in a GRID. The solid wall gives a significant edge effect (the dark annulus), and individual cells in the clone cannot be resolved even in the digital zoom. In contrast, there are few edge effects near the fluid walls (which appear as light gray lines in the top panel), and individual cells throughout the colony are easily resolved in the zoom. It is even possible to distinguish between a single cell and two sitting side by side close to a fluid wall ( Fig. 4B ). Moreover, chamber dimensions are easily shrunk to the user’s needs (by printing fluid walls closer together), without affecting cell visualization ( Fig. 4C ).
Cloning
As well as providing excellent optics for single-cell identification, GRIDs offer a suitable environment for cloning. After plating HEK cells in a GRID, an image scan across the GRID allows chambers containing single progenitors to be identified rapidly, and subsequently their growth into colonies can be tracked similarly ( Fig. 5A,i ). In addition to ensuring monoclonality, cloning efficiencies can be determined by identifying formed colonies soon after plating. For example, we used an arbitrary threshold of ≥16 cells derived from a single progenitor to call a clone the group of cells on the left in Figure 5A,ii (but not the group on the right). This call was made after 8 days, which contrasts with the 21 days we generally use with these cells in a well in a conventional microplate. The versatility of the platform also enables chambers to be made with different coatings, prior to seeding single cells ( Fig. 5A,iii ; the different coatings have complex effects on cell morphology, growth rate, and colony compaction 27 ). Additionally, the excellent optics and small chamber size even allow multiple colonies to be identified in a single image obtained with a standard 4× objective ( Fig. 5B ). Here, note the dark areas next to the fluid walls that vary in thickness (and are nonexistent at the corners). The chamber shape approaches the cap of a perfect sphere at the center, but this cap sits on a square footprint. Consequently, the contact angle along the pinning line varies from a minimum at each corner to a maximum halfway between each pair of adjacent corners; this underlies the variations in thickness of the dark areas ( Fig. 1 ). As in the case of drops with circular footprints ( Fig. 3 ), thickness at any specified point can be reduced by reducing the contact angle at that point (by withdrawing medium from the chamber). Notwithstanding these dark areas, it still generally remains possible to identify single cells and clones at any point in a chamber (as in the case of the clone in the chamber at the top right in Fig. 5B ).
The process of dispensing cell suspensions into GRIDs is rapid. For example, it takes less than 90 s to plate cells into the 256 chambers in a GRID used here, 22 and resulting cell distributions follow Poissonian statistics ( Suppl. Fig. S2A ). The same printer used to make GRIDs and plate cells can also replace spent media, and so feeding protocols are easily varied. For example, in Supplemental Figure S2B we show that frequent feeding has little impact on cloning efficiency, suggesting that the 400 nL media initially present in a chamber is sufficient to support colony growth for 8 days. However, different feeding regimes can have slight effects on colony size ( Suppl. Fig. S3 ). In addition, retrieval of colonies (after adding trypsin) and transfer into other GRIDs or conventional microtiter plates (by aspirating the detached cells) are also done using the printer. Retrieval efficiency was assessed by transferring colonies from fluid chambers to 96-well plates and 56 out of 57 samples reattached and grew.
Conclusion
Single-cell isolation and cloning is a core part of many workflows, and there is a growing need to ensure monoclonality. Unfortunately, this proves to be difficult and time-consuming when imaging wells in microplates, as solid walls obscure regions at the periphery, making it difficult—if not impossible—to ensure the well contains only one cell. As a result, methods for in-well identification of single cells usually require plates to be spun to settle cells, fluorescent tagging, or expensive optics. Here, we present a simple method to eliminate issues associated with edge effects, cell labeling, and settling time that uses standard bright-field or phase-contrast optics. Importantly, obscuring solid walls used conventionally to confine liquids are replaced by transparent fluid ones. Then, contact angles of the resulting drops are reduced so that the obscured region shrinks until contents of the whole drop become visible. Adding an overlay of the fluorocarbon, FC40, both prevents evaporation of small volumes and improves optical clarity, as its refractive index more closely matches that of the aqueous phase than air. Arrays of drops/chambers with fluid walls were created in which single cells and their resulting clones are identified easily. The method provides an in-well method for confirming monoclonality that is user-friendly, versatile, biocompatible, and easily adapted to high throughput.
Supplemental Material
Revision2_Supplemental_Material_for_Fluid_walls_for_single-cell_monoclonality_by_Soitu_et_al – Supplemental material for Using Fluid Walls for Single-Cell Cloning Provides Assurance in Monoclonality
Supplemental material, Revision2_Supplemental_Material_for_Fluid_walls_for_single-cell_monoclonality_by_Soitu_et_al for Using Fluid Walls for Single-Cell Cloning Provides Assurance in Monoclonality by Cristian Soitu, Cyril Deroy, Alfonso A. Castrejón-Pita, Peter R. Cook and Edmond J. Walsh in SLAS Technology
Footnotes
Acknowledgements
We gratefully acknowledge the financial and technical support of iotaSciences. We thank the labs of Elizabeth Robertson (for mouse ES cells), David Greaves (for access to the IncuCyte live-cell imager), and cytoSMART (for allowing us to test the Omni).
Supplemental material is available online with this article.
Declaration of Conflicting Interests
The authors declared the following potential conflicts of interest with respect to the research, authorship, and/or publication of this article: Oxford University Innovation—the technology transfer company of the University of Oxford—has filed provisional patent applications on behalf of C.S., P.R.C., and E.J.W. partly based on this study. P.R.C. and E.J.W. each hold equity in, and obtain remuneration from, iotaSciences Ltd., a company that is exploiting this technology. iotaSciences Ltd. provides scholarships for C.S. and C.D.
Funding
The authors disclosed receipt of the following financial support for the research, authorship, and/or publication of this article: This work was supported by iotaSciences Ltd. (C.S., C.D.), the European Commission for a 7th Framework Marie Curie Grant contract no. 333848 (E.J.W.), a Royal Society University Research Fellowship (A.A.C.-P.), the Impact Acceleration Account of the Biotechnology and Biological Sciences Research Council (E.J.W., P.R.C.), the Medical Research Council for a Confidence in Concept award MC_PC_15029 (E.J.W., P.R.C.,) and award MR/K010867/1 (P.R.C.).
References
Supplementary Material
Please find the following supplemental material available below.
For Open Access articles published under a Creative Commons License, all supplemental material carries the same license as the article it is associated with.
For non-Open Access articles published, all supplemental material carries a non-exclusive license, and permission requests for re-use of supplemental material or any part of supplemental material shall be sent directly to the copyright owner as specified in the copyright notice associated with the article.