
Abstract
Here, we have developed a set of fluorophore-labeled microspheres named rainbowarray microspheres. Based on the spectrally encoded microspheres, we further developed a liquid hybridization approach for multiplex target detection. Different from the prototype Luminex xMAP array, this technology enables feasible, flexible, and cost-efficient microsphere labeling and multiplex detection in a timely and high-throughput manner. To demonstrate the practicability of this technology, quantitative measurement of microRNA regulation was performed during the differentiation of 3T3-L1 cells, in which the expression of two microRNAs was determined at a 2 h interval during a process of 2 days. The flexibility and the timely and high-throughput properties of the technology enable it to be widely implemented in clinical testing.
Keywords
Introduction
The gene detection assay is an essential tool in basic and clinical research. As a pioneering example of such technology, Northern blot established a foundation for follow-up platforms such as diverse microarray assays. Due to their solid phase–based property, however, these approaches have limited sensitivity, detection range, and reproducibility. Taking advantage of the potent amplification capability of PCR, greater sensitivity and dynamic detection range are achieved by reverse transcription PCR (RT-PCR). Modifications of this method, such as competitively quantitative RT-PCR (qRT-PCR) and quantitatively real-time RT-PCR, have been introduced to enhance the sensitivity and accuracy of target detection. 1 Even though low multiplex capacity is a major shortcoming of these PCR-based approaches,2–5 to overcome this disadvantage, a sequencing-based gene expression assay has been developed. 6 Although desirable properties such as high throughput, high precision, and reproducibility are achieved by these novel approaches, the time and cost to screen a large set of samples are still prohibitive. For clinical practice with these approaches, sample amplification is a double-edged sword and brings a potential risk of sample contamination.
Therefore, for certain clinically relevant scenarios, solutions to gene expression assays remain to be established, taking into consideration the need of throughput, preferably amplification-free, and the cost and operation time per assay. For these aspects, the Luminex xMAP array (Luminex, Austin, TX) provides a microsphere-based system. Using a set of pre-color-coded microspheres, this technique can simultaneously detect up to 100 analytes using one fluorescent reporter. Taking advantage of liquid hybridization, the Luminex array shows great technological improvement and has been used in a variety of clinical diagnosis.7–10 To further improve this technology, we have developed a novel set of fluorophore-labeled microspheres, as well as a liquid hybridization approach for multiplex gene detection. Different from the Luminex array, we have enabled feasible, flexible, and cost-efficient microsphere labeling and multiplex detection in a timely and medium-throughput manner.
Results
Rainbowarray Microsphere-Based Gene Detection
Gene coding is a fundamental technique for multiplex gene detection. In a solid phase–based microarray assay, a position-dependent coding approach is used; for sequencing-based assays, diverse barcoding approaches are imple-mented. In the case of the Luminex array, gene coding is made by fluorescent labeling of a set of microsphere vectors on which specific capture probes are attached. Therefore, for the development of a multiplex gene detection assay, a highly consistent, flexible, and cost-efficient gene-coding approach is of great importance.
In the present study, a set of fluorophore-labeled microspheres was developed and named rainbowarray microspheres. Based on these spectrally encoded microspheres, a liquid hybridization assay was further developed for multiplex gene detection. The procedure of the assay is presented in Figure 1 and consists of five sequential steps: fluorescent coating of sepharose microspheres, loading of capture probes, labeling of RNA sample, liquid hybridization, and image capture and data analysis.
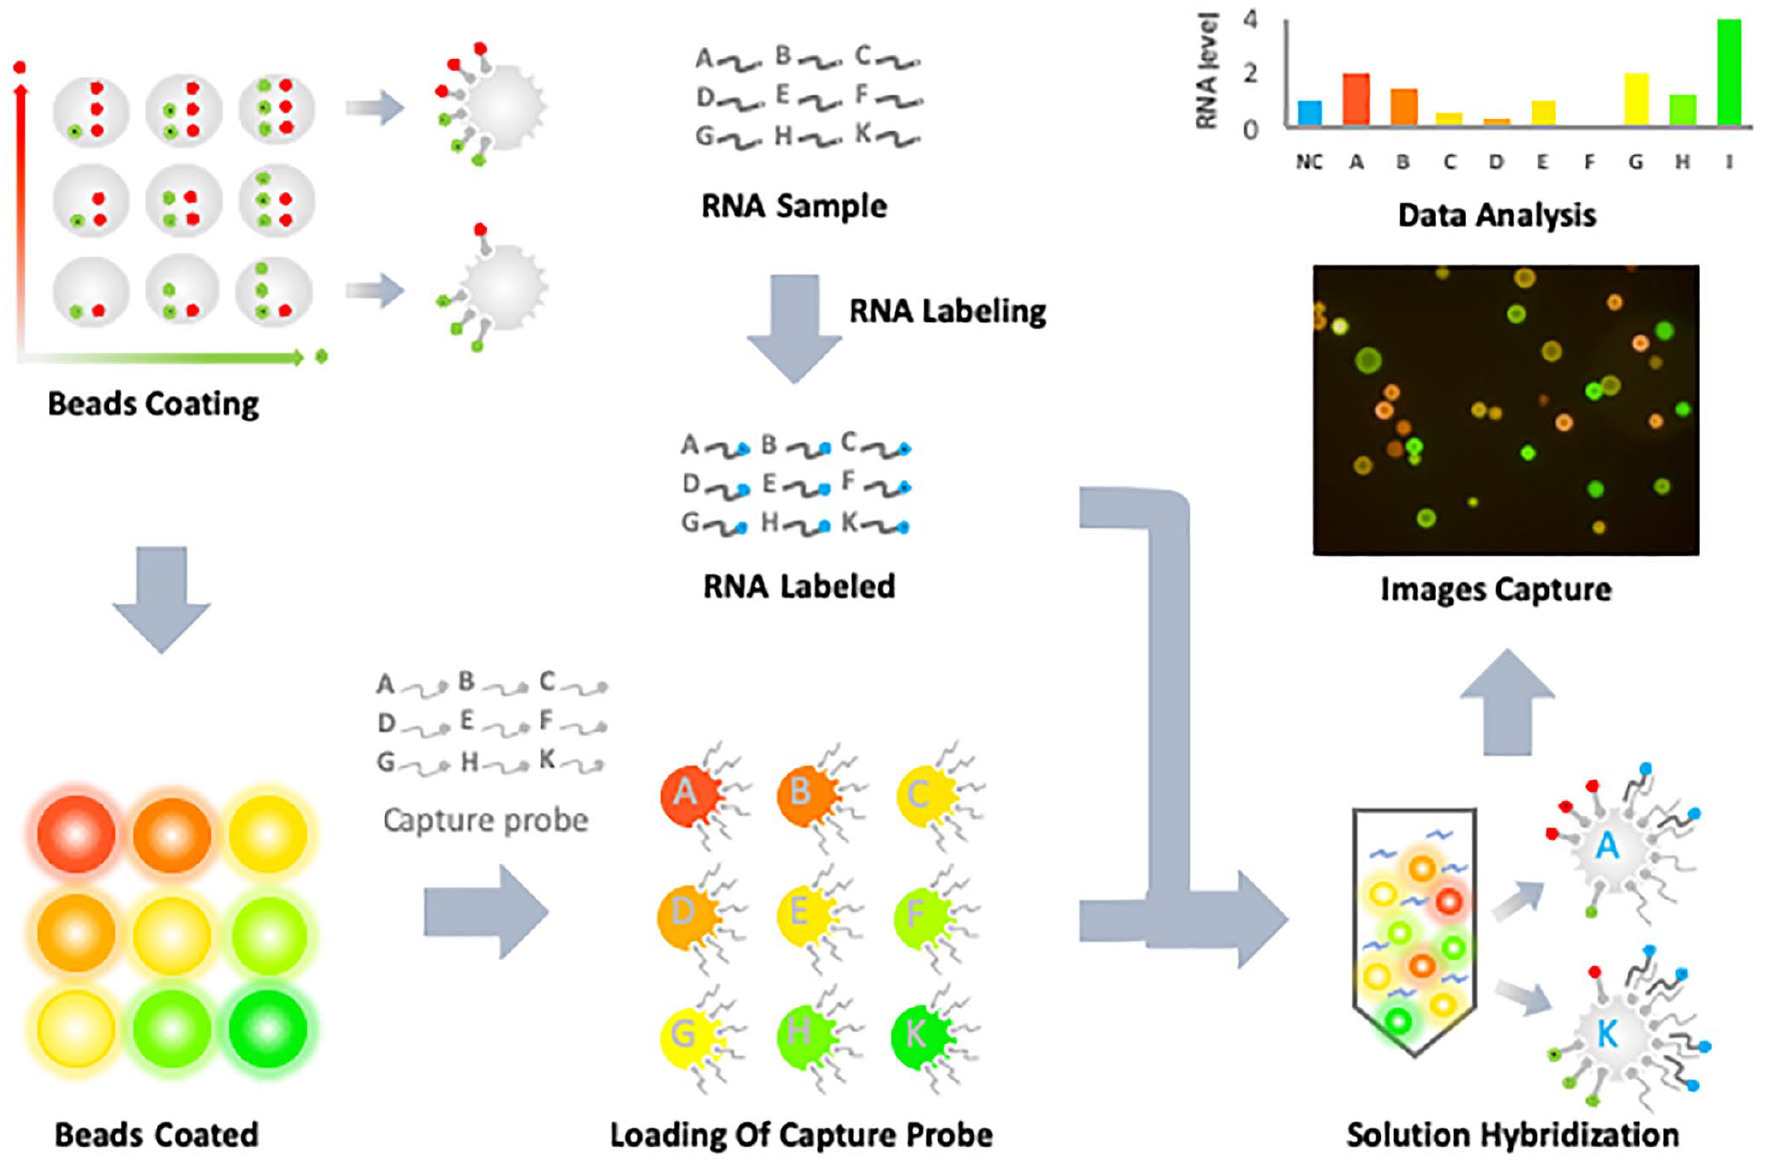
Flowchart of the rainbowarray assay. The procedure of the rainbowarray assay comprises five sequential steps: fluorescent coating of commercially available sepharose microspheres, loading of capture probes, labeling of RNA sample, liquid hybridization, and image capture and data analysis.
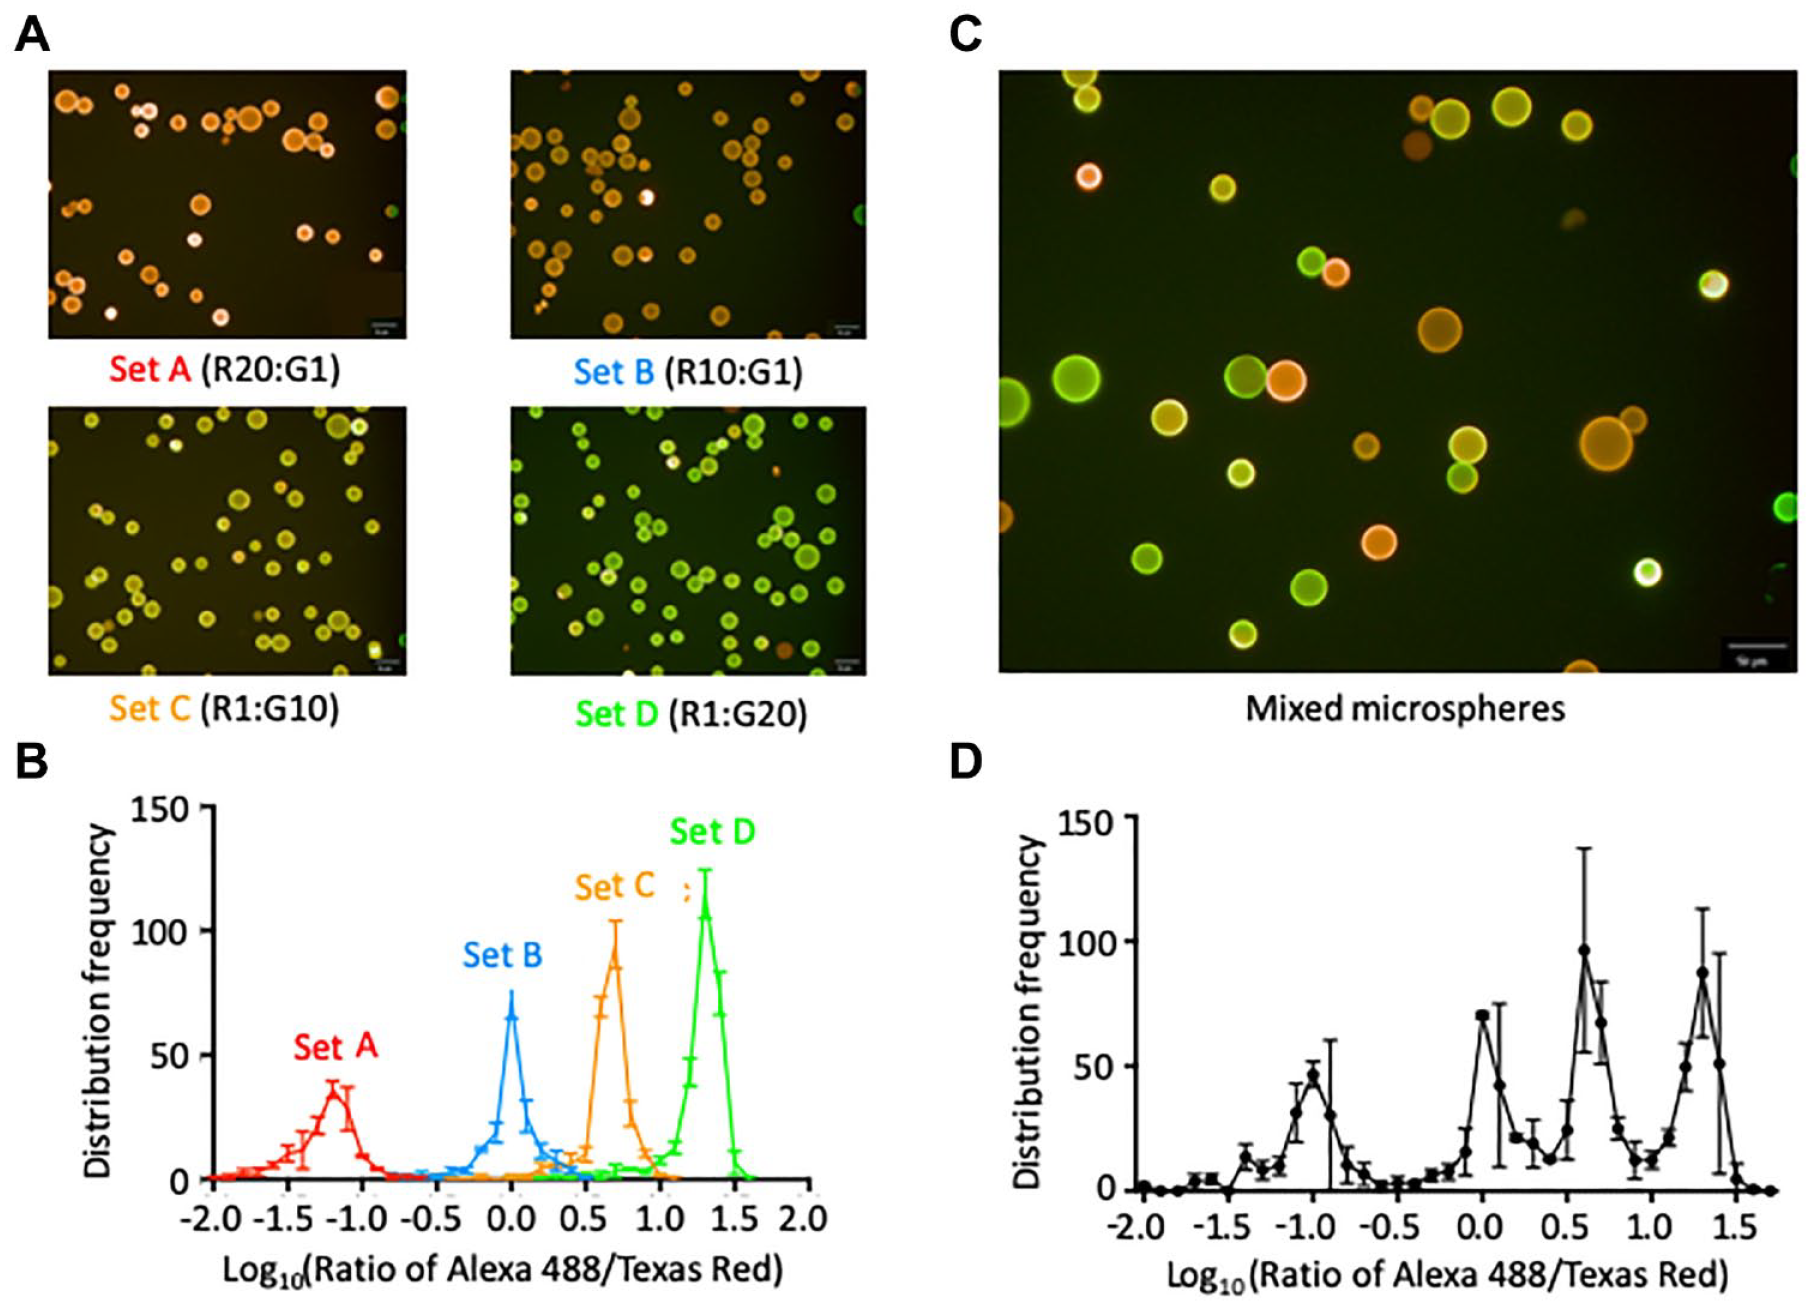
For proof of concept, the rainbowarray assay was first performed with four synthetic target RNA oligonucleotides, each representing a mature form of murine microRNA. To set up the assay, two coding DNA oligonucleotides were designed to have a biotin molecule at the 3′ end; and at the 5′ end conjugate, a fluorophore chosen from Texas Red (R) or Alexa 488 (G). For gene coding, four coding mixtures were prepared by mixing the two coding oligonucleotides at a ratio of R20:G1, R10:G1, R1:G10, or R1:G20, and complexed individually with a set of streptavidin-conjugated sepharose microspheres. This therefore established a fluorescent code for each set of microspheres, rendering them spectrally distinguished from each other. To examine their distinguishability, fluorescence detection assays were performed with each microsphere set individually, or with mixed microspheres comprising an equal amount of the four microsphere sets. The fluorescence of Texas Red or Alexa 488 was quantified independently for each microsphere. Then, a ratio of Texas Red–Alexa 488 was calculated to determine its identity. Results showed the four sets of microspheres are readily distinguished from each other by their spectroscopic characteristics (
Fluorophore coating of sepharose microspheres. Commercial sepharose microspheres were coded with a mixture of two fluorophore-conjugated DNA oligonucleotides. The microspheres were then examined using an Operetta High Content Screening and Analysis Reader (PerkinElmer). (
By means of the procedure illustrated in
Figure 1
, detection of four synthetic target RNA oligonucleotides was further performed. For each target RNA, a fully complementary capture probe was synthesized and conjugated to a set of different color-coded microspheres. Prior to the detection, target RNA oligonucleotides were chemically labeled by Cy5 fluorophores. For each reaction, a certain amount of mixed microspheres was added, which comprised equal amounts of the four microsphere sets. Detection was then performed with target RNA of 2.5 pmol individually, or mixed target RNAs (2.5 pmol/each). As shown in
Figure 3
, reproducible measurements were obtained for individual or mixed targets, showing the assay’s potency in multiplex detection. In addition, to the four-microsphere set, beads discrimination was further examined with a nine-microsphere set (
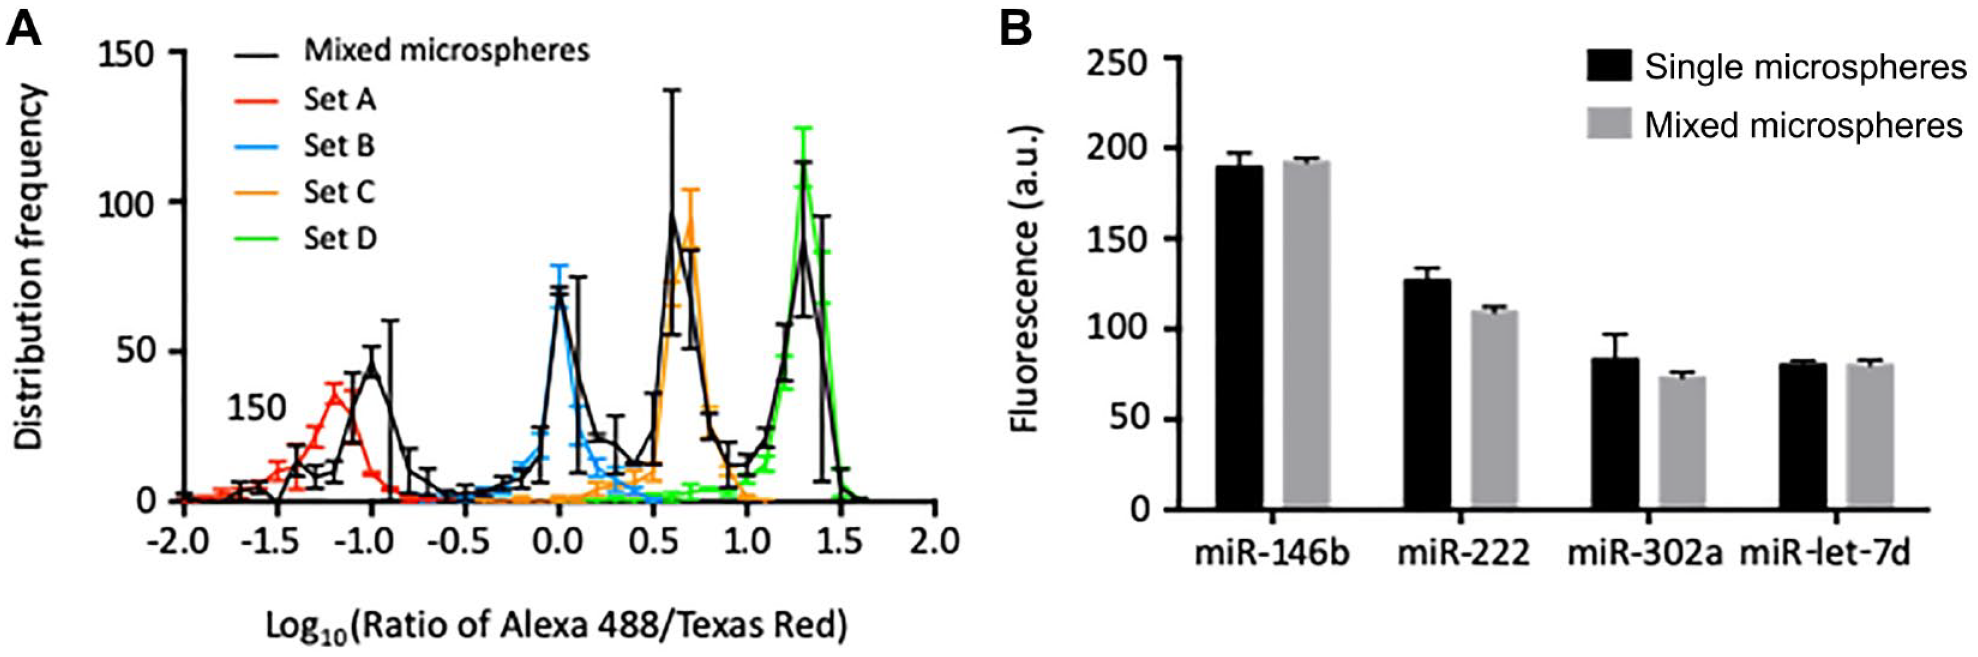
Rainbowarray assay performed with single or multiple target RNAs. Single or multiple target RNAs were fluorophore-labeled and hybridized with a microsphere mixture comprising four sets of microspheres, each loaded with an individual capture probe. (
Optimization of Reaction Parameters
To improve the sensitivity of the detection, several reaction parameters were optimized, including the density of microspheres, the temperature and time of the hybridization, and the volume of the reaction system (
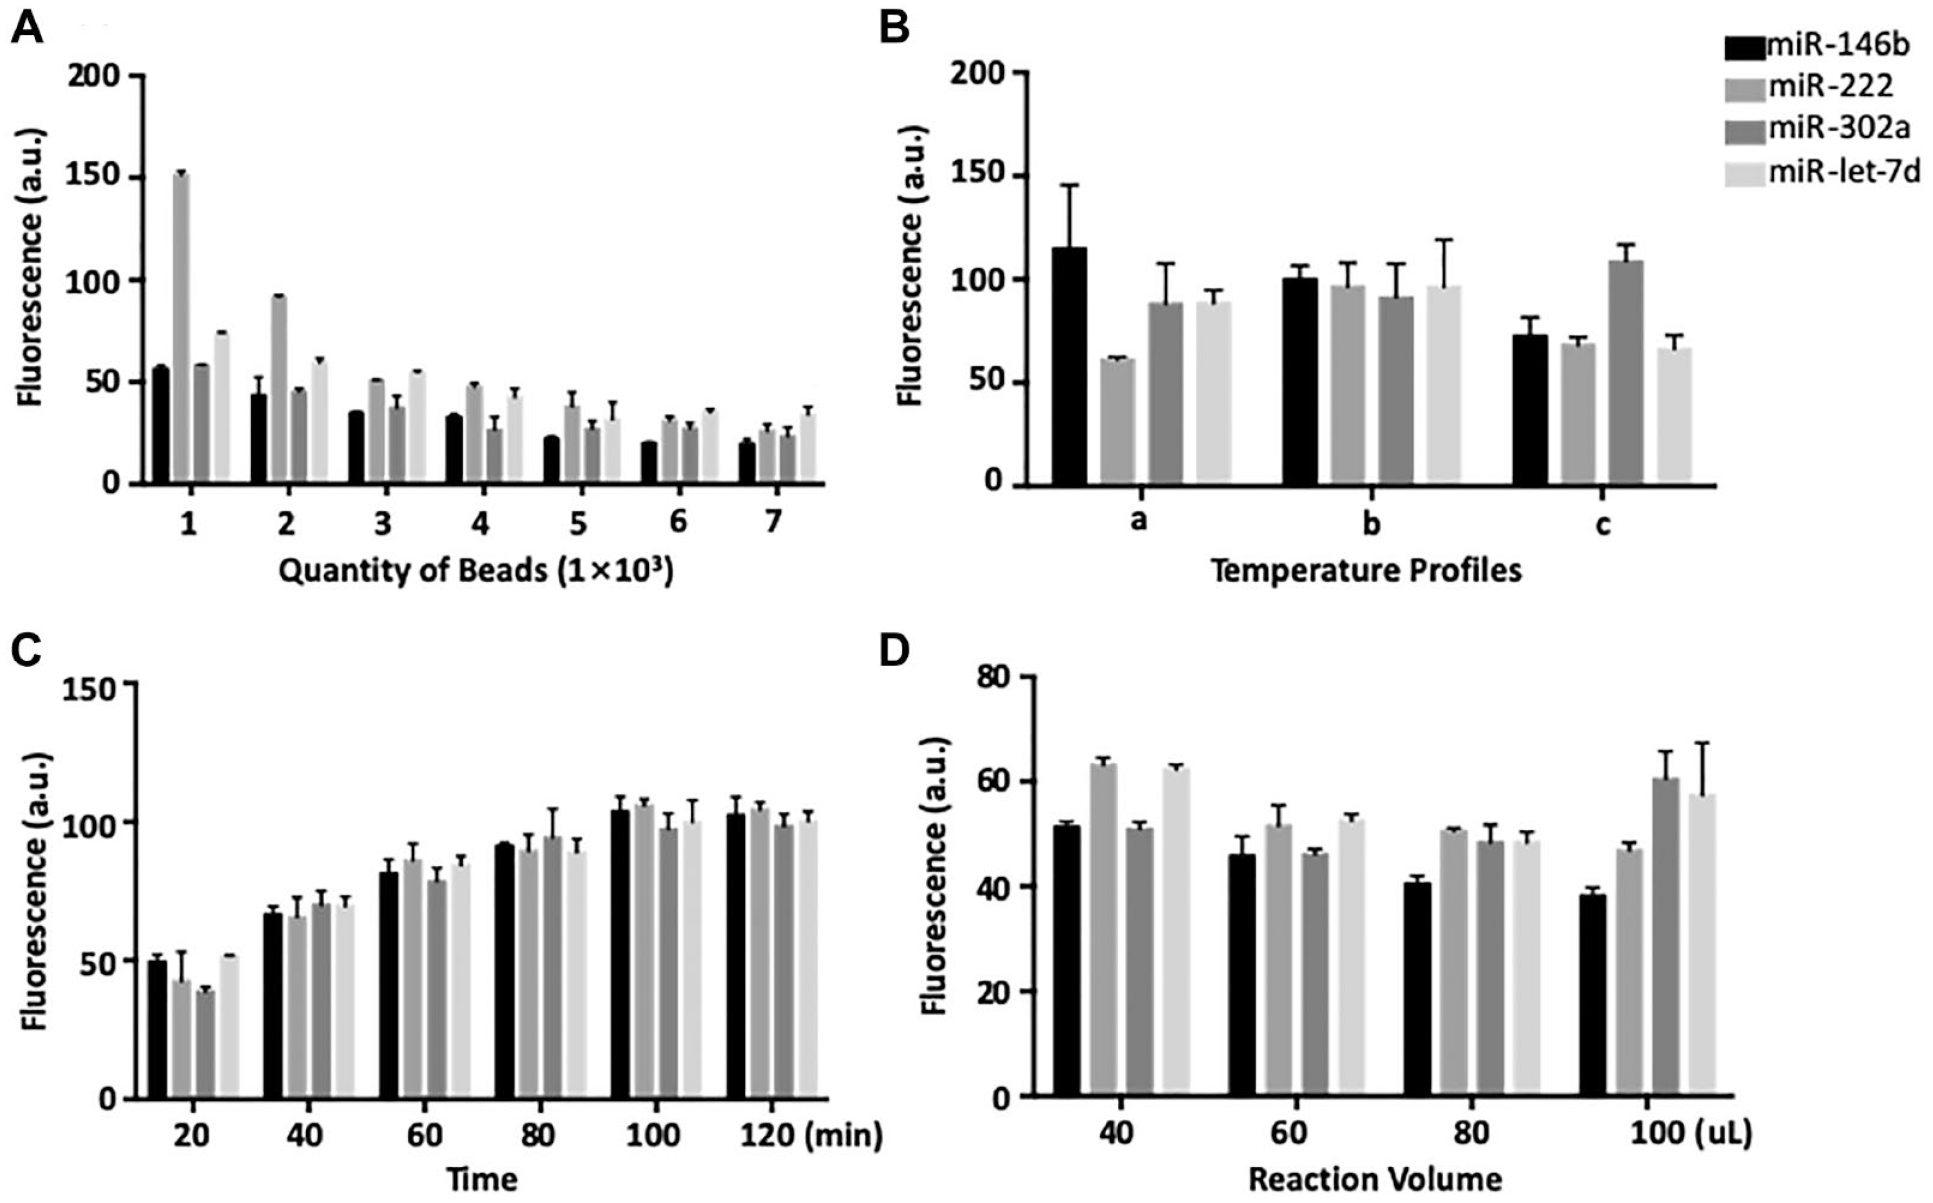
Optimization of the experimental conditions. For all the assays, target RNAs were fluorophore-labeled and hybridized with a microsphere mixture comprising four sets of microspheres of equal amounts, each loaded with an individual capture probe. Target detection was determined using an Operetta High Content Screening and Analysis Reader (PerkinElmer). (
Theoretically, the fewer microspheres in a reaction, the more targets that will be captured for a given microsphere, leading to a higher fluorescent signal. To our expectation, target fluorescence decreases gradually with the increasing microsphere density (
Specificity and Sensitivity of the Assay
With optimal conditions, the specificity and sensitivity of the detection were examined. The specificity assay was performed by hybridizing a specific target RNA with mixed microspheres (
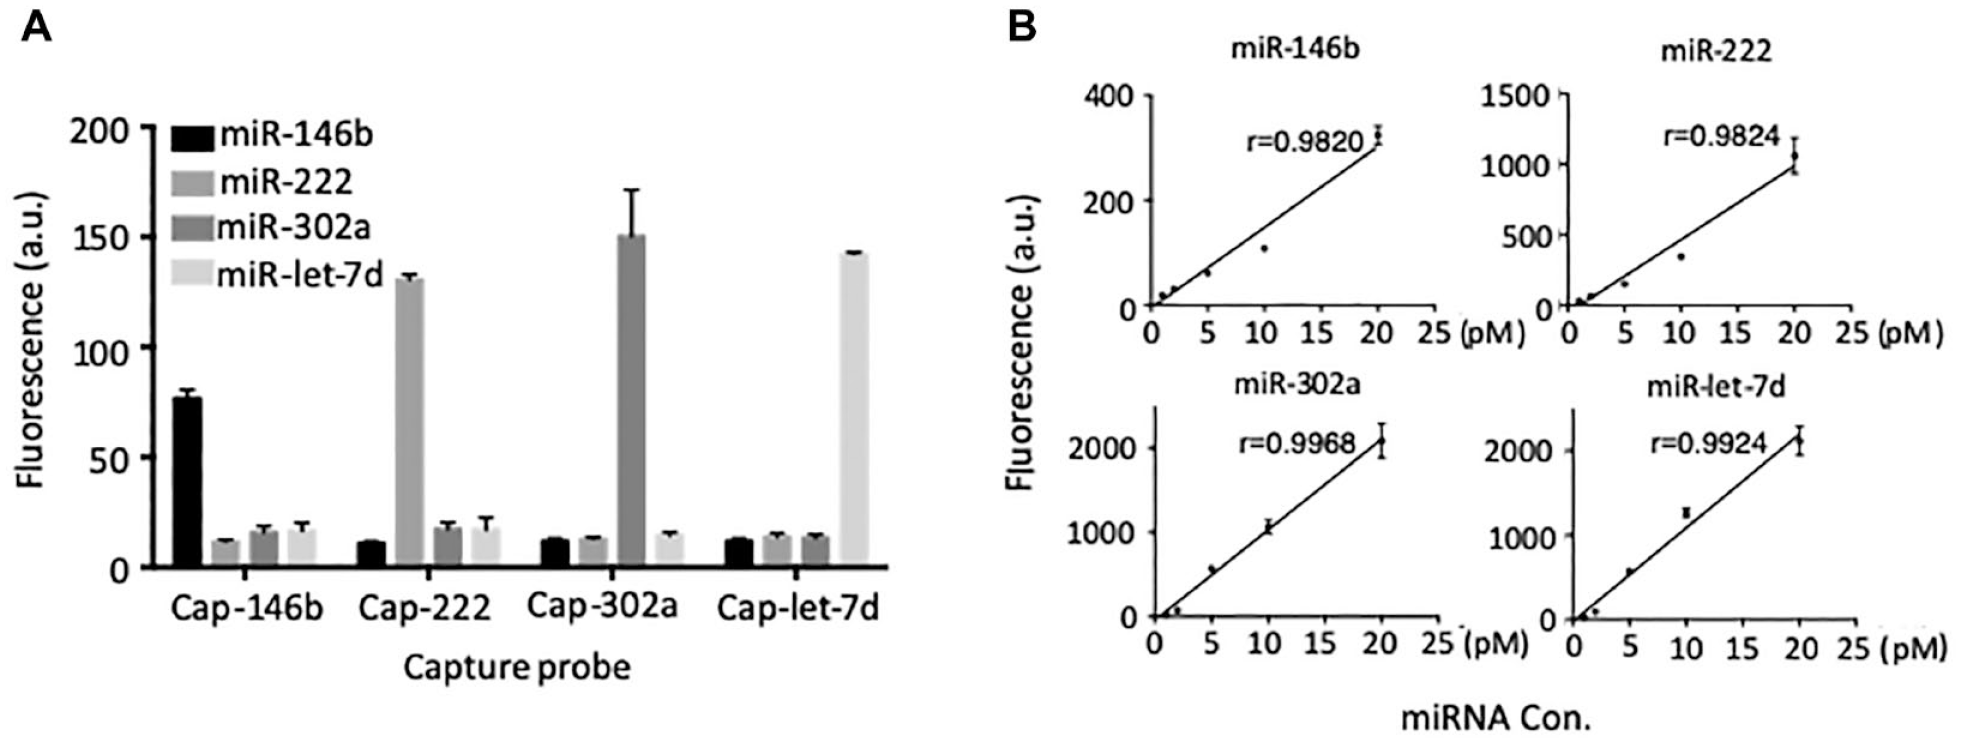
Specificity and sensitivity of rainbowarray assay. (
Sensitivity assays were examined with varying target RNA concentrations. As shown in Figure 5B , good correlations of fluorescence intensity and target concentration were observed, in which a linear range was found between 1 and 20 pM for all four measurements. For curve fits, R values were determined between 0.9820 and 0.9968.
Cross-Platform Comparison
To evaluate the system with complex biological samples, the assay was further performed with RNA samples derived from adipocyte differentiation of 3T3-L1 cells. For comparison, parallel experiments were also carried out by PCR-based miRNA detection and a commercial microarray assay. For monitoring the progress of the differentiation, Oil Red O staining was performed to examine the production of cellular lipid (
From these cells within differentiation, total RNA samples were extracted for a gene detection assay. To reduce the complexity of the samples, total microRNA was further purified. As shown in Figure 5 , when PCR-based miRNA detection was performed with total RNA or total miRNA samples, evident difference was observed. This may disclose the influence of sample complexity on PCR-based approaches.
If we take PCR-based gene detection of total microRNA as a standard, comparable profiles were found with the rainbowarray assay (
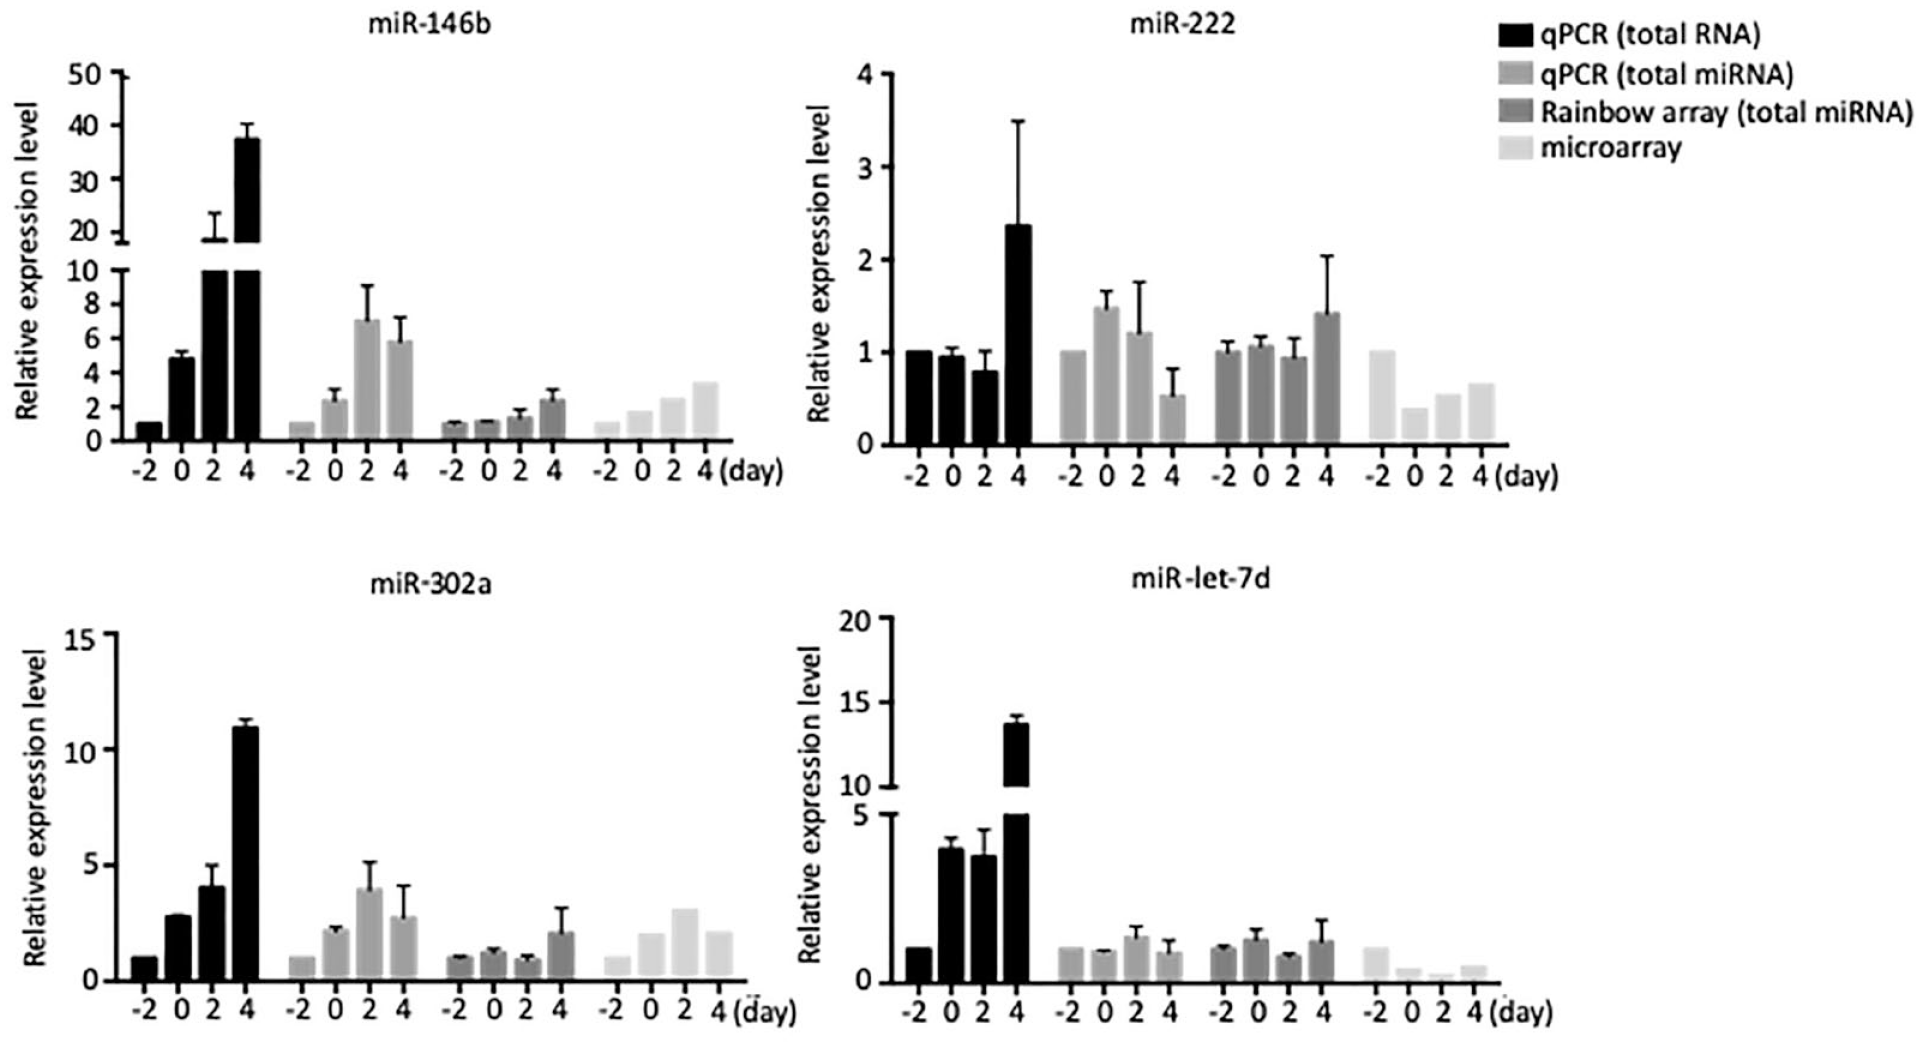
Cross-platform comparison. Expressional profiles of four microRNAs were determined by means of the quantitative reverse transcription PCR (qRT-PCR), rainbowarray, and microarray assays. The qRT-PCR assay was performed with total RNA and total microRNA samples. The rainbowarray assay was performed with total microRNA samples. The microarray assay was performed with total microRNA samples.
Application in MicroRNA Study
Regulation of gene expression is one of the most dynamically biological processes. During the early stage of adipocyte differentiation, dramatic regulation of gene expression has been recorded. For gene regulation study, PCR-based approaches are the most used. Relative to these approaches, a rainbowarray assay has better flexibility and research throughput.
To explore these advantages, regulation of two anti-adipogenic microRNAs, miR-196a and miR-223, was investigated during the initial stage of adipocyte differentiation. Therefore, during a period of 24 h around the hormone induction, cell samples were collected at an interval of 2 h. From this, total miRNAs were extracted, labeled with Cy5, and subjected to a rainbowarray assay. As shown in Figure 7 , dynamic regulation of miR-196a and miR-223 was revealed during the differentiation, with a general trend of downregulation.
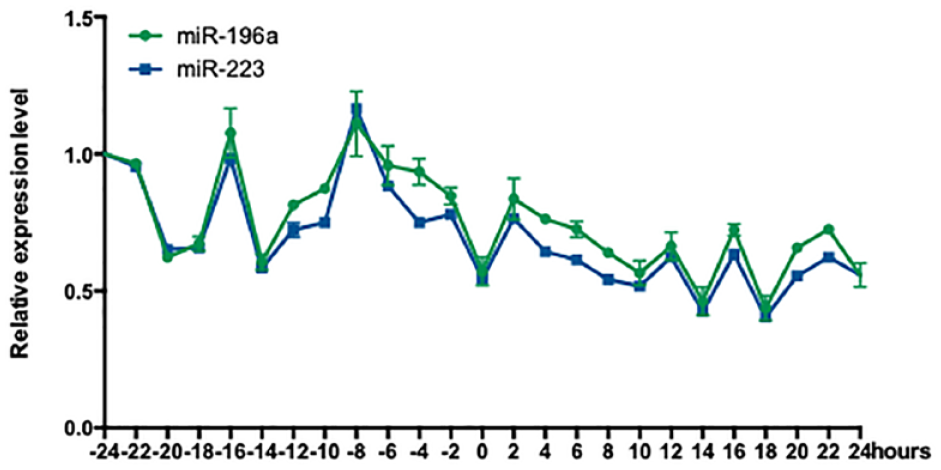
Temporally regulatory profiles of miR-196a and miR-223.
Discussion
Among well-known technologies for the detection of oligonucleotides, PCR and qRT-PCR are generally accepted as golden standards, showing super sensitivity and specificity. The processing steps, however, including nucleic acid extraction, amplification, and calibration, are time-consuming and labor-intensive, in particular not being easily multiplexed. 11 More recently, a number of new methods, including droplet digital PCR (ddPCR), nanopore-based detection, sequencing, and electrochemical sensing methods, have also been developed for the detection of miRNAs.12–15 The pretreatments or preliminary amplification steps, however, compromise their accuracy to a large extent. Recently, particle-based suspension assays such as the Luminex xMAP array assay have been developed and applied clinically. They provide high-efficiency approaches for nucleic acid detection, offering high flexibility, easy probe set modification, efficient mixing steps, and high degrees of reproducibility. 16 Therefore, depending on the particle-based suspension assay and oligonucleotide hybridization, our research group developed an assay named rainbowarray.
In this system, sepharose microspheres were used as the solid phase for probe binding, due to their high affinity for a variety of biomolecules, fast binding kinetics, and sphere morphologies to facilitate liquid hybridization. For multiplex detection, a novel coding approach for microspheres was developed by using two fluorophore-conjugated DNA oligonucleotides.
To demonstrate the potency of the rainbowassay, a cross-platform comparison was performed with commercial miRNA detection kits and microarray assays. Although not exactly the same results could be obtained by another two of the assays performed, comparable microRNA profiles were obtained by the rainbowarray assay and PCR-based detection of total microRNA. Compared to PCR-based approaches and the Luminex xMAP array, our technology enables feasible, flexible, and cost-efficient microsphere labeling and multiplex detection. The detection limitation was determined to be 1 pM for the multiplex model. Moreover, proven by the feasibility of designing concepts, a medium throughput of multiplexing detection is expected to be reached. These properties are critical to certain clinically relevant scenarios. To demonstrate the practicability, quantitative measurement of microRNA expression was performed during the differentiation of 3T3-L1 cells, in which dynamic regulation of two microRNAs was established at a 2 h interval during a process of 2 days. With the assay being straightforward, sensitive, and multiplexed, we can foresee it holding potential in both ordinary laboratory research and clinical diagnosis for detection of miRNAs.
Materials and Methods
Oligonucleotides
DNA oligonucleotides were from Invitrogen (Beijing, China). RNA oligonucleotides were from RiboBio (Guangzhou, China).
miRNA oligo sequence
miR-146b-5p (5′-3′): UGAGAACUGAAUUCCAUAGGCU
miR-222-3p (5′-3′): AGCUACAUCUGGCUACUGGGU
miR-302a-3p (5′-3′): UAAGUGCUUCCAUGUUUUGGUGA
miR-let-7d-5p (5′-3′): AGAGGUAGUAGGUUGCAUAGUU
Capture probe sequence
capture-146b-5p (5′-3′): GCCTATGGAATTCAGTTCTCA
capture-222-3p (5′-3′): ACCCAGTAGCCAGATGTAGCT
capture-302a-3p (5′-3′): TCACCAAAACATGGAAGCACTTA
capture-let-7d-5p (5′-3′): AACTATGCAACCTACTACCTCT
capture-196a-2-3p (5′-3′): UCGGCAACAAGAAACUGCCUGA
capture-223-5p (5′-3′): CGUGUAUUUGACAAGCUGAGUUG
Rainbowarray Assay
The rainbowarray assay procedure consists of five sequential steps: fluorescent coating of commercially available sepharose microspheres, loading of capture probes, labeling of RNA sample, liquid hybridization, and image capture and data analysis.
Fluorescent coating of sepharose microspheres. For each target molecule to be detected, a set of sepharose beads (Streptavidin Sepharose High Performance; GE Healthcare Bio-Sciences AB, Uppsala, Sweden) was encoded by a mixture of two coding oligonucleotides of a defined ratio. Both of the coding oligonucleotides are ~20 nt long, modified at the 5′ end by a biotin molecule and at the 3′ end by a fluorophore chosen from Alexa 488 or Texas Red (RiboBio). The coating reaction was performed in a phosphate-buffered saline (PBS) solution of 100 µL, containing 5 µL sepharose microspheres and a mixture of coding oligonucleotides of 0.2 pmol/µL.
Loading of capture probes. Fluorescently encoded sepharose microspheres were loaded with a capture probe of 100 pM. Capture probes are oligonucleotides that are ~20 nt long and complementary with target molecules.
Labeling of RNA sample. Total RNAs were extracted and fluorescently labeled by using a kit (Label IT Cy5 Kit; Mirus Bio, Madison, WI).
Liquid hybridization. Liquid hybridization was performed in a 40 µL volume at 25 °C for 40 min, with 2 × 10³ capture probe–loaded microspheres and fluorophore-labeled RNA.
Image capture and data analysis. Fluorescent images were captured using an Operetta High Content Screening and Analysis Reader (PerkinElmer, Waltham, MA), with a 20× objective. Image analyses were carried out using a Columbus Image Data Storage and Analysis System (PerkinElmer).
Cell Culture and Methylisobutylxanthine–Dexamethasone–Insulin (MDI) Induction
3T3-L1 preadipocytes were cultured in Dulbecco’s modified Eagle medium (DMEM) supplemented with 10% newborn calf serum (Gibco, Waltham, MA) and passaged at 70–80% confluence. Adipocyte differentiation was performed 2 days after cells reached confluence. Cells were induced to adipocyte differentiate by changing the culture medium to differentiation medium, comprising DMEM supplemented with 0.5 mM 3-isobutyl-1-methyxanthine (Sigma-Aldrich, St. Louis, MO), 1 µM dexamethasone (Sigma-Aldrich), and 167 nM insulin (Sigma-Aldrich). Differentiation medium was replenished every 2 days during the following process. Cells grow to confluence on day(−2) and enter into a 2-day growth-arrested stage from day(−2). After MDI induction on day(0), cells proceed to a mitotic clonal expansion stage from day(0) to day(+2), then enter into a terminal differentiation stage after that. Cells were collected at day(−2), day(0), day(+2), and day(+4), representing preadipocytes, growth-arresting cells, differentiating adipocytes, and differentiated adipocytes.
Oil Red O Staining
Oil Red O staining was performed to monitor the progress of the differentiation. In brief, cells were collected and washed three times with PBS, fixed in 70% ethanol for 5 min, and incubated with Oil Red O solution (0.5% Oil Red O in 60% isopropyl alcohol) for 1 h at room temperature. Excess stain was removed by washing with 70% isopropyl alcohol and tap water. Stained fat droplets within the cells were visualized by light microscopy and photographed.
MicroRNA Profiling
Total RNA was isolated using TRI Reagent (Sigma-Aldrich). miRNA profiling was performed by KangChen Bio-Tech (Shanghai, China), using an LNA mouse miRNA microarray (Exiqon, Vedbaek, Denmark) comprising probes for 1896 mouse miRNAs. For each assay, 100 ng total RNA was used in array hybridization, the resulting hybridization signals were quantified using an Axon GenePix scanner (model 4000B; Molecular Devices, San Jose, CA), and data extraction and analysis were performed using GenePix Pro6.0 software (Molecular Devices).
Quantitative RT-PCR
Total RNA was isolated using TRI Reagent (Sigma-Aldrich). miRNA assay kits from RiboBio were used. cDNA was synthesized using a random primer kit (Tiagen Biotech, Beijing, China). Quantitative PCR was performed using the SYBR Green PCR mix and an MX3005P Real-Time PCR System (Agilent Technologies, Santa Clara, CA). Relative gene expression was calculated with the comparative CT (ΔΔCT) method, using U6 as an internal control.
Statistical Analysis
Data are presented as mean ± SEM, unless otherwise stated. Difference between groups is considered significant if P-values ≥ 0.05 (*), 0.01 (**), 0.001 (***), or 0.0001(****). Graphs were created using GraphPad Prism (version 5.0).
Supplemental Material
supplemental_fig – Supplemental material for Rainbowarray Microsphere-Based Gene Detection Assay
Supplemental material, supplemental_fig for Rainbowarray Microsphere-Based Gene Detection Assay by Ying Xu, Pei Zhang, Fan Yi, Jing Wei and Quan Du in SLAS Technology
Footnotes
Supplemental material is available online with this article.
Declaration of Conflicting Interests
The authors declared no potential conflicts of interest with respect to the research, authorship, and/or publication of this article.
Funding
The authors disclosed receipt of the following financial support for the research, authorship, and/or publication of this article: This work was supported by grants from the National Natural Science Foundation of China (31571403) and Beijing Natural Science Foundation (2171001).
References
Supplementary Material
Please find the following supplemental material available below.
For Open Access articles published under a Creative Commons License, all supplemental material carries the same license as the article it is associated with.
For non-Open Access articles published, all supplemental material carries a non-exclusive license, and permission requests for re-use of supplemental material or any part of supplemental material shall be sent directly to the copyright owner as specified in the copyright notice associated with the article.