
Abstract
Clinical laboratory regulations require temperature monitoring of facilities, reagent and specimen storage, as well as temperature-dependent equipment. Real-time specimen temperature detection has not yet been integrated into total laboratory automation (TLA) solutions. An infrared (IR) pyrometer was paired with a complementary metal oxide semiconductor (CMOS) laser sensor and connected to an embedded networked personal computer (PC) to create a modular temperature detection unit for closed, moving clinical laboratory specimens. Accuracy of the detector was assessed by comparing temperature measurements to those obtained from thermocouples connected to battery-operated data loggers. The temperature detector was then installed on a pre-analytic laboratory automation system to assess specimen temperature before and after processing on an integrated thawing and mixing (T/M) robotic workcell. The IR temperature detector was able to accurately record temperature of closed, moving specimens on a pre-analytic automation system. The effectiveness of the T/M workcell was independently verified using the temperature detector. Specimen reroute on the pre-analytic automation track was identified as a potential risk for frozen specimens being inadvertently delivered to future, connected instrumentation. Automated IR temperature detection can be used to verify specimen temperature prior to instrument loading and/or sampling. Such systems could be used to prevent frozen specimens from being inadvertently loaded onto analytical instrumentation in TLA solutions.
Introduction
Temperature monitoring of laboratory facilities and equipment such as refrigerators, freezers, water baths, and incubators is critical to ensuring that processes are conducted under appropriate conditions and in guaranteeing that specimens and reagents are stored appropriately.1,2 Analytical instrumentation also frequently includes temperature-controlled mechanisms to stabilize reaction conditions or as a fundamental component of testing (e.g., PCR). Given the importance of temperature on laboratory processes, federal regulations under the Clinical Laboratory Improvement Amendments of 1988 (CLIA’88) require that laboratories define and monitor temperature conditions appropriate for storage of reagents and specimens, and in the operation of test systems, as applicable. 3 Temperature monitoring is therefore included as a requirement of CLIA-approved laboratory accreditation organizations such as the College of American Pathologists (CAP) Laboratory Accreditation Program, 4 and environmental conditions such as temperature are also addressed in standards included in ISO 15189. 5
For example, specimen storage temperature is specifically highlighted in requirements regarding appropriate handling of referred specimens (e.g., CAP checklist item GEN.40125). 4 Indeed, numerous pre-analytic processes involve moving specimens between different temperature conditions. In the reference laboratory setting, specimens are often received and/or maintained at different temperature conditions [e.g., room temperature (20–25 °C), refrigerated (2–8 °C), and/or frozen (less than −10 °C)] based on unique requirements of the testing that was ordered. Specimens are then delivered to the appropriate laboratory section(s) and, if frozen, thawed prior to analysis.
ARUP Laboratories has previously developed automated thawing and mixing (T/M) robotic workcells, which are directly connected to a customized pre-analytic automation system that receives specimens from our specimen receiving department.6,7 These workcells are used to bring specimens to room temperature and then mix them thoroughly prior to delivery to laboratory section–specific sorters. Along with a goal for increased direct-from-track total laboratory automation (TLA), we recognized the need for a modular temperature detection unit that could assess the temperature of moving, closed-tube specimens on our automation track. The present article describes the development and testing of an infrared (IR) temperature detector designed to meet this goal. While online temperature monitoring is commonly used in both manufacturing and food processing, this is the first report of integration for this purpose into clinical laboratory pre-analytic automation. As such, it has relevance for both TLA solutions and potential integration into analytical instrumentation.
Materials and Methods
General
This project was administratively reviewed by the University of Utah Institutional Review Board, which determined that it did not meet federal definitions of human subject research.
Hardware and Software
The temperature detector processing unit (
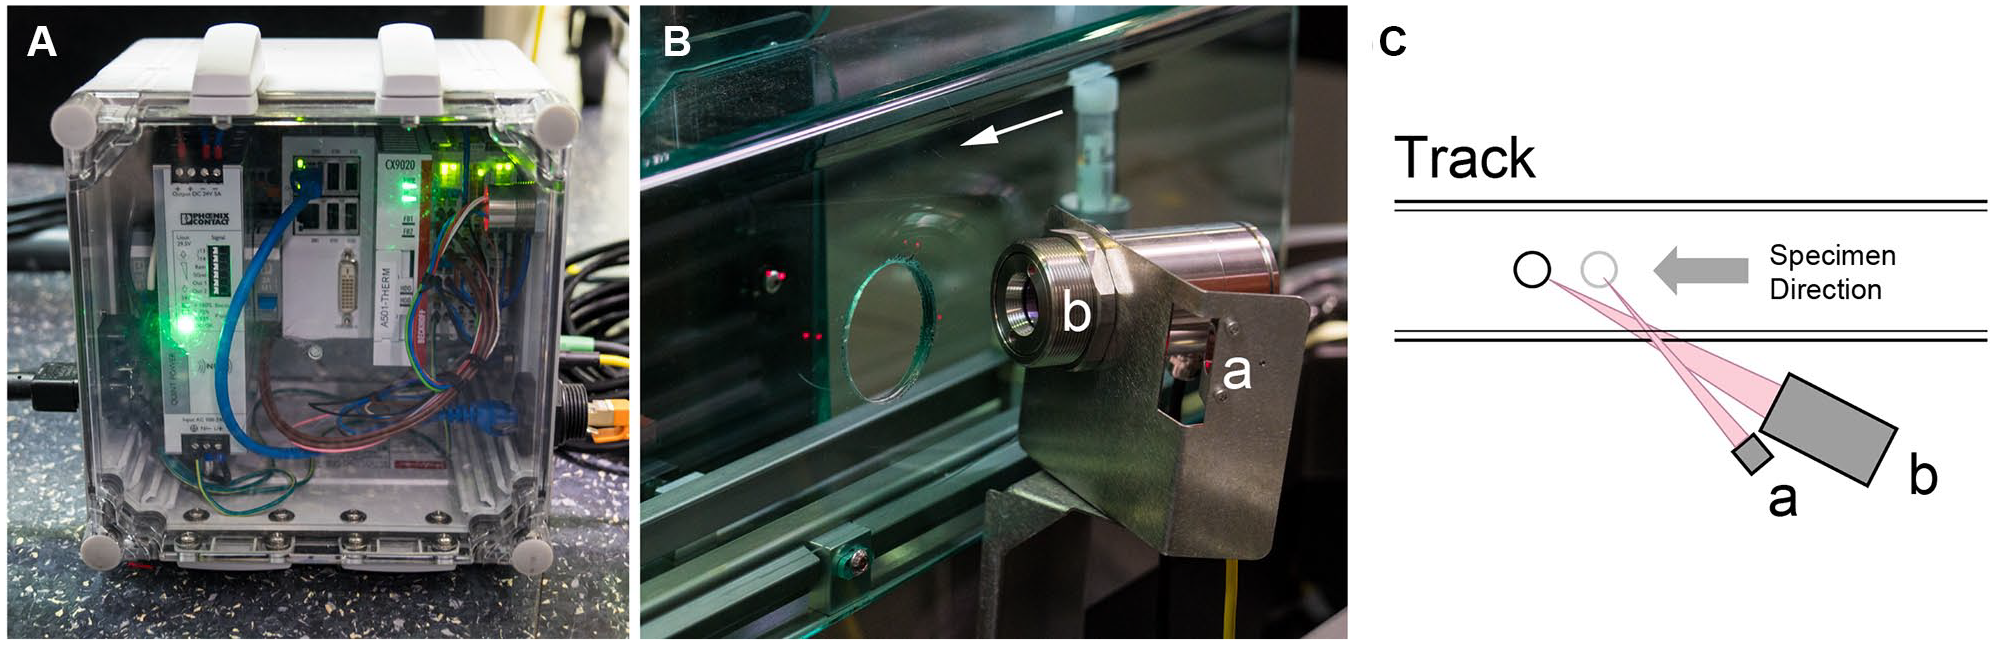
Infrared (IR) temperature detection system. (
Event Triggering, Temperature Detection, and Data Recording
The process for triggering tube events and recording temperatures is as follows. When a moving tube on the automation track passes in front of the tube detector beam, this trigger event signals the program to wait 10 ms (for the temperature detector response time), then begin collecting data from the temperature detector through the following processes: (1) An analog 0–10 VDC (voltage direct current) signal is recorded at 10 kHz and placed in an array, (2) an analog input module runs an infinite impulse response filter on the data array at 1 kHz intervals and then passes those data to the main program running on the embedded PC, and (3) the main program collects all of these data into an array and then averages that for the final value when the tube detector sensor turns off.
A network application connects via Ethernet to the device’s embedded PC and monitors several variables, including connection integrity, failure logging, and user recording (e.g., start and stop) commands. When a user presses the device push-button, the application creates a new comma-separated value (CSV) file for data logging. When connected and running, the application watches for changes in a program “count” variable, retrieves the latest temperature measurement from the embedded PC, and enters a new record into the output CSV file. Each record in the CSV file contains the current date and time, the tube count value, and the temperature in degrees Celsius.
Verification of Temperature Detector: Nonconveyed Specimens
To verify that the temperature detector accurately measures temperature in liquid-filled aliquot tubes routinely used by our laboratory, the following experiment was conducted. Four ARUP standard transport tubes (polypropylene, cat no. 62.612; Sarstedt, Nümbrecht, Germany) were filled with demineralized distilled water (ddH2O) and capped. Type K thermocouple probes (beaded thermocouple wire probe, −40 to 250 °C, cat no. P-01; REED Instruments, Wilmington, NC) were inserted through a small hole in the cap and positioned within the center of the fluid. Tubes were then frozen upright at −80 °C. Immediately prior to the experiment, the separate thermocouple wires were connected to a four-channel thermocouple thermometer/data logger (cat no. SD-947; REED Instruments) calibrated to a National Institute of Standards and Technology (NIST)-traceable thermometer. Tubes were then removed from dry ice and placed into nonmoving pucks on a circular research and development automation track (MagneMotion; Rockwell Automation, Devens, MA). Every 3 min, tubes were manually moved sequentially in front of the IR temperature detector, and the temperature for each tube was simultaneously recorded from the IR detector liquid crystal display (LCD) window and the REED thermometer. Temperature recordings were made every 3 min for 2 h.
Verification of Temperature Detector: Moving Specimens
To verify that the temperature detector accurately measures temperature from moving specimens, K-type thermocouple probes were frozen at <10 °C in ARUP standard transport tubes filled with ddH2O. Immediately prior to experiments, a tube was removed from the freezer, and the thermocouple wire was connected to a Digi-Sense USB battery-operated temperature data logger (cat. no. DO-20250-44; Davis Instruments, Vernon Hills, IL) mounted to the back of a movable specimen puck on the research and development automation track. The data logger was positioned on the back of the puck so that it was out of the focal area of the IR detector. The data logger was configured to record temperature every 6 s. The puck, tube, and data logger were then circulated on a test track that can operate at variable speeds of 0.2 to 2.0 m/s, repeatedly past the mounted IR temperature detector with each loop. Data from the USB data logger were then imported into Excel 2016 (Microsoft, Redmond, WA) and aligned by time stamp to data acquired by the IR temperature detector. The thermocouple adjustment period (due to plugging the connector end of the frozen probe into an ambient data logger) was excluded from analysis.
Temperature Measurements from the Clinical Laboratory Automation Track
The temperature detector was then mounted on our clinical laboratory pre-analytic automation track at positions before (
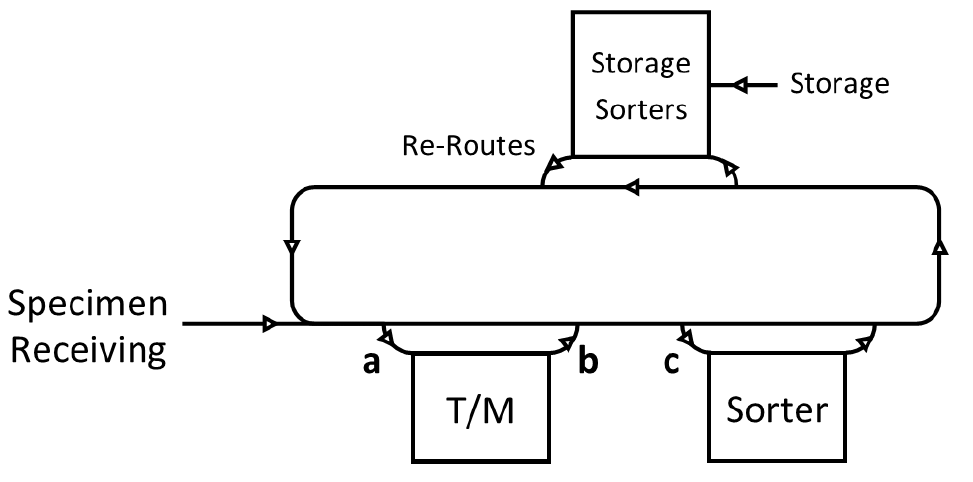
Simplified diagram of the pre-analytic automation track and installation locations for the temperature detector. Specimens are loaded by the specimen receiving department onto the pre-analytic automation track (left). Specimens are then transported to thawing and mixing (T/M) robotic workcells if appropriate for ordered tests. Specimens are next transported to sorters designated for different laboratory sections, and subsorting into standardized racks occurs. Once testing is complete, specimens are loaded in standardized racks into storage sorters, which transfer tubes to both temperature-specific (room temperature, refrigerated, or frozen) and storage duration–specific racks for offline storage. If additional testing is pending on a specimen tube, it is rerouted back onto the track and delivered to its next assigned destination laboratory sorter. Positions marked (
Analysis
Data analysis was conducted in Excel 2016 (Microsoft) and SigmaPlot 13 (Systat, San Jose, CA). Graphs were generated using SigmaPlot and Publisher 2016 (Microsoft). Statistical significance was assessed using the Wilcoxon signed-rank test in SigmaPlot. P-values < 0.05 were considered significant.
Results
A comparison of temperature measurements from the IR temperature detector versus thermocouples frozen in ddH2O-filled standard transport tubes as they thawed in nonconveyed pucks on the research and development test track is shown in
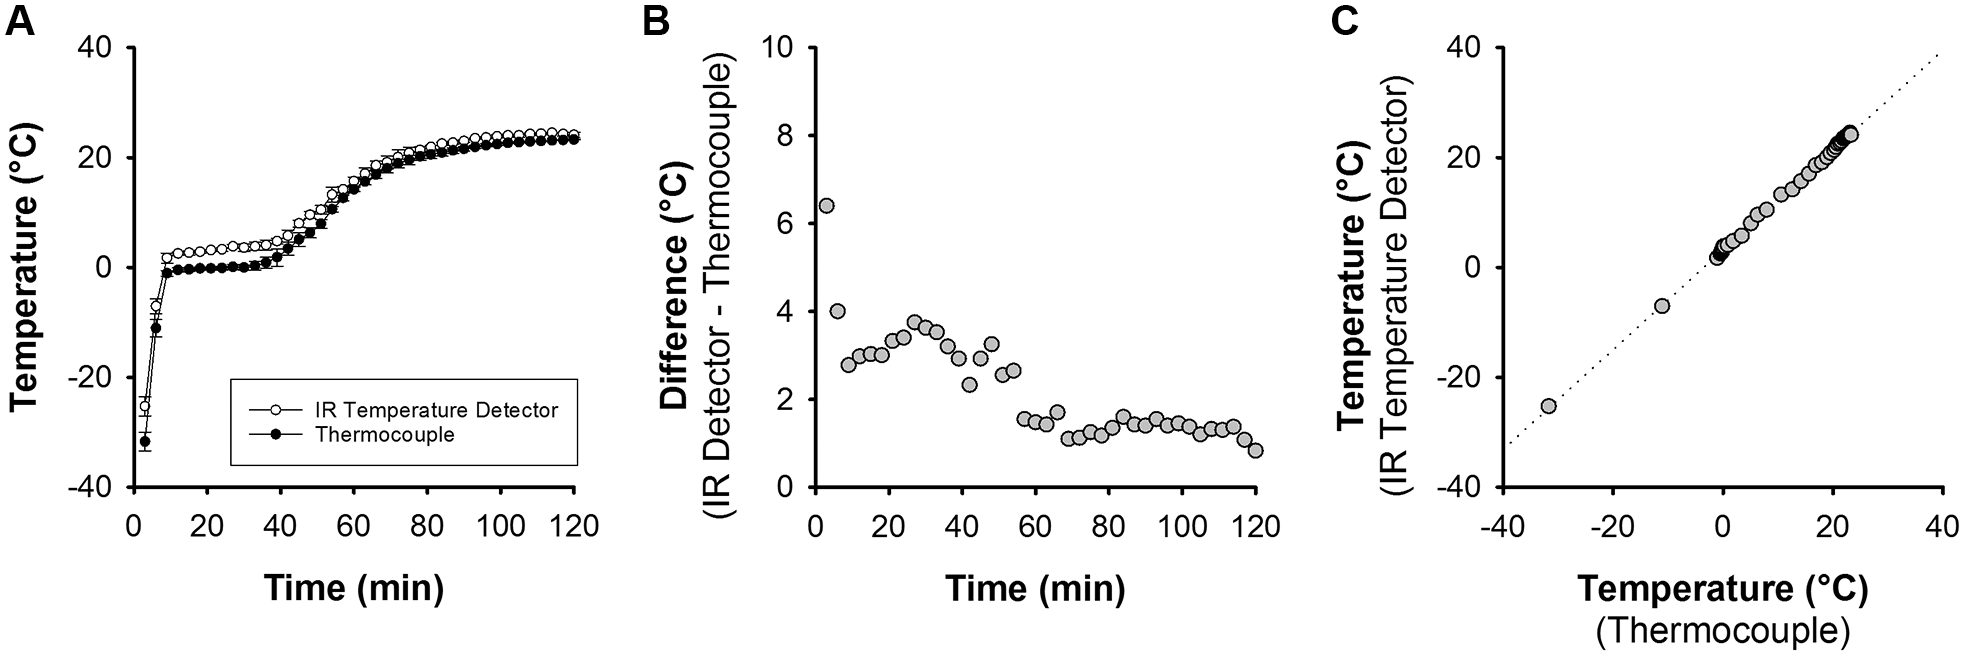
Temperature measurements from the infrared (IR) temperature detector versus thermocouples in nonconveyed containers. (
The IR temperature detection system was then tested on moving tubes on the research and development automation track.
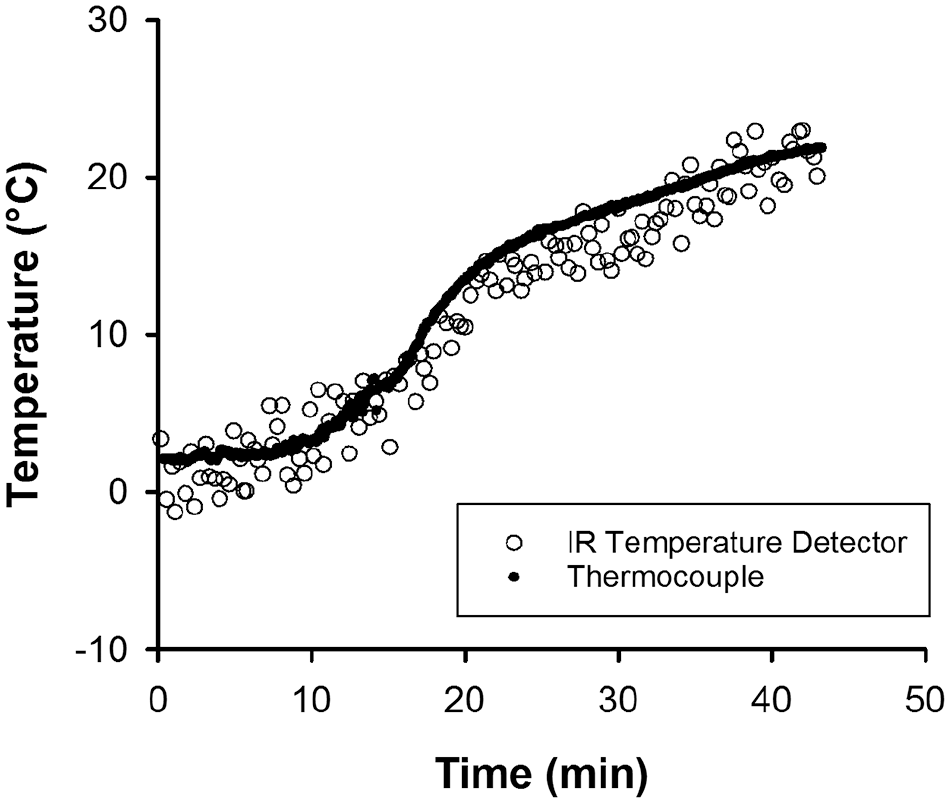
Temperature measurements from the infrared (IR) temperature detector versus a thermocouple in a moving container. (
To assess how the IR temperature detection system would perform in a clinical laboratory setting, the device was then installed in three different locations on our clinical laboratory pre-analytic track (
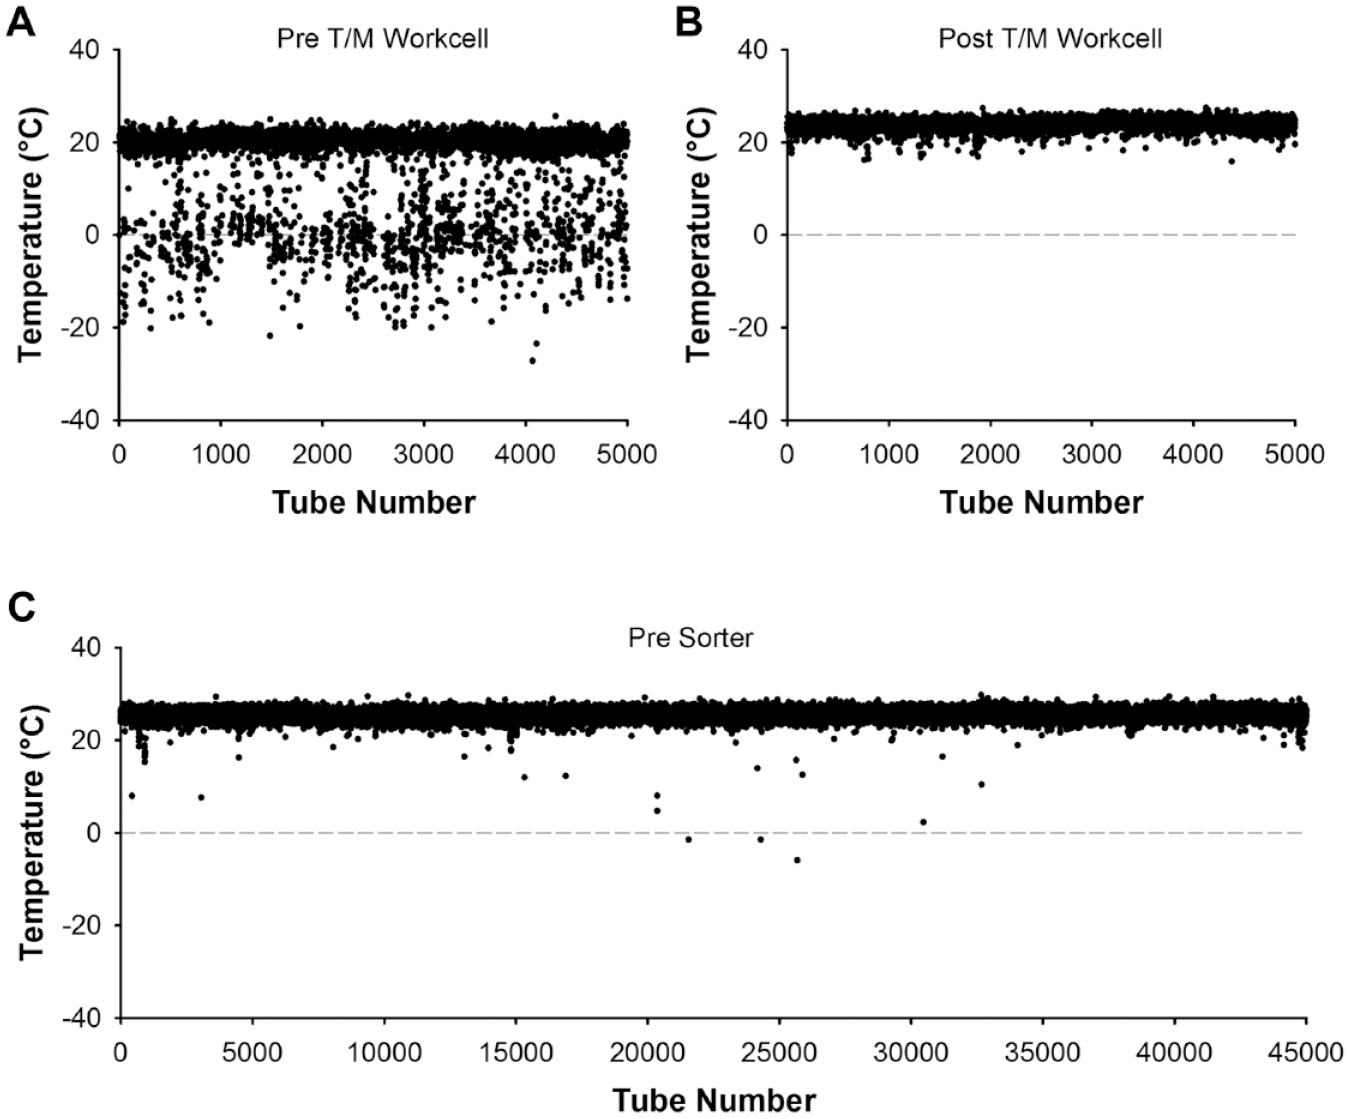
Temperature measurements from the infrared (IR) temperature detector placed before and after a thaw–mix (T/M) workcell. (
The temperature detector was then installed near the input of a final sorter (i.e., a rack-based destination for tubes for one of the automated laboratories; see
Discussion
This article describes the development of a closed-tube IR temperature detection system that was installed and tested on a custom clinical laboratory pre-analytic automated track. While specimen integrity checks (e.g., hemolysis, lipemia, and icterus), liquid level detection, and even phlebotomy tube type detection (e.g., cap color recognition) have been incorporated into analytical and/or TLA systems, we are unaware of any other implementation of specimen temperature detection in a clinical laboratory automation track. This article demonstrated the risk of inadvertently loading frozen specimens onto an automation system, and proposes a mechanism to detect (and ultimately divert) such specimens in future TLA solutions.
Loading of a frozen specimen on an automated direct-from-track TLA system (or onto an instrument directly) could lead to instrument probe crashes and/or inaccurate specimen sampling. This may affect analysis from not just the frozen specimen, but also subsequent specimens if a probe is not functioning properly and the malfunction is not quickly identified. Temperature detection systems could mitigate this risk, ideally being used to divert frozen specimens to appropriate robotics (e.g., T/M workcells) or holding lanes if such robotics are unavailable. In analytical instrumentation, automated detection of frozen specimens could be used to prevent subsequent probe crashes.
IR temperature detection methods are limited by inherent background noise associated with data acquisition. While installation of a flat panel (e.g., cardboard) behind the moving specimens helped to reduce background noise, initial experiments demonstrated that very short acquisition times combined with quickly moving specimens could lead to erroneously high temperature measurements. Installation of the temperature detector on slower segments of the track (e.g., input/output lanes; see
The present studies also demonstrated that there could be differences between the external temperature of a specimen tube and the internal specimen temperature. While these were usually relatively small (see
While precise measurement of specimen temperature may have limited value in a routine clinical laboratory setting (where freezing of specimens is not a part of pre-analytic processes), send-out testing to referral laboratories frequently requires frozen specimens to preserve sample stability during transportation. Because more reference laboratories are implementing direct-from-track TLA solutions to improve turnaround time, this may inadvertently confer an increased risk of frozen specimens being loaded onto automated analytical systems. IR temperature detection systems could mitigate this risk and provide specimen-specific temperature monitoring with far greater resolution than current systems, which focus primarily on the environment or temperature-specific equipment but not the specimens themselves.
Footnotes
Declaration of Conflicting Interests
The authors declared no potential conflicts of interest with respect to the research, authorship, and/or publication of this article.
Funding
The authors disclosed receipt of the following financial support for the research, authorship, and/or publication of this article: This project was supported by the William L. Roberts Memorial Fund at the ARUP Institute for Clinical and Experimental Pathology.