
Abstract
Diluting a sample to obtain a measure within the analytical range is a common task in clinical laboratories. However, for urgent samples, it can cause delays in test reporting, which can put patients’ safety at risk. The aim of this work is to show a simple artificial neural network that can be used to make it unnecessary to predilute a sample using the information available through the laboratory information system. Particularly, the Multilayer Perceptron neural network built on a data set of 16,106 cardiac troponin I test records produced a correct inference rate of 100% for samples not requiring predilution and 86.2% for those requiring predilution. With respect to the inference reliability, the most relevant inputs were the presence of a cardiac event or surgery and the result of the previous assay. Therefore, such an artificial neural network can be easily implemented into a total automation framework to sensibly reduce the turnaround time of critical orders delayed by the operation required to retrieve, dilute, and retest the sample.
Introduction
The clinical laboratory as a source of the bottleneck of the health care system throughput has been a long-time issue.1,2 In this regard, clinicians have always been hindered by the poor predictability of the laboratory process, an aspect they mostly rely on in critical care. However, the advent of total laboratory automation (TLA) has progressively changed this situation, and published research has proven the modern automated laboratory not only to no longer be a bottleneck in throughput but also to promote the overall efficiency and quality of health care.3–5
The advantage of automation over the human operator with respect to repetitive tasks typical of laboratory processing is utterly simple to understand: automation is faster, more precise, tireless, and can carry out several different actions in parallel. However, automation is a kind of “one-track-mind” operator, whose output is rigid and cannot adapt to particular ongoing changes or momentary needs. Although this makes the automated output stable enough to support high-throughput processing, it strongly limits flexibility, thereby making the intervention of the human operator still necessary.
One of the most peculiar tasks of laboratory testing is sample dilution, which is necessary whenever the amount of analyte in the sample exceeds the linear range of the assay. It is noteworthy that samples are always assayed undiluted first, so that the gain of information about dilution always happens at the expense of a testing cycle. Considering that dilutions are always set at precise intervals (e.g., 2-fold, 5-fold, 10-fold, etc.), a result for a highly concentrated analyte is produced through an iterative procedure, which wastes as many tests as the dilutions necessary to achieve the final results.
However, in some situations, the human operator can arbitrarily decide to dilute the sample without first testing it. For instance, this can happen when starting from a prediluted sample is necessary to deliver a critical result in time, and the information available leads to the supposition that the sample most probably will exceed the analytical range. Nonetheless, such a method of approaching sample management relies on the possibility of gathering and properly integrating some useful information such as the medical condition of the patient, the last result available, and the time elapsed from the previous assay with respect to the analyte’s half-life.
That is, an automated system cannot do this by itself and necessarily relies on the heuristics of the human operator to overcome such a limitation because of its mechanical nature. However, the operator’s heuristics can sometimes be false and may rely on the support of automatic logic.6,7 The aim of this work is to show how it is possible to improve the management of the sample dilution such that TLA is capable of inferring whether to predilute a sample before assaying it. To show the relevance of our findings with respect to laboratory timeliness, we used an artificial neural network (ANN) based on the Multilayer Perceptron (MLP) to model the data regarding the cardiac troponin I (CTNI) test ordered by hospital departments.
Materials and Methods
Laboratory Setup and CTNI Assay
The automated laboratory setup consisted of a 24 m long linear single-track FlexLab conveyor belt (Inpeco, Lugano, Switzerland), with an online bulked input module for automated check-in, an input/output module for sample sorting, two centrifuges, a tube decapper, an automated specimen aliquoter, and a tube sealer. The clinical chemistry lineout was represented by three Siemens Vista 1500 (Siemens Healthcare, Milan, Italy), one of which was dedicated to urgent (STAT) testing. The middleware Nemo (Inpeco) was used for process control and results validation.
The CTNI test was performed with the Siemens immunochemical CTNI test (Siemens Healthcare) according to the manufacturer’s instructions. In particular, the assay range was up to 40 ng/mL, and the run time was 10 min. With respect to the sample processing, samples were assayed undiluted at first and then were automatically diluted fivefold by the chemistry analyzer using the sample aliquot stored internally. If this dilution also failed to give a result in the range, the sample tube was retrieved from the storage by the operator, which proceeded with a 10-fold manual dilution using the appropriate diluent provided with the kit. If this second dilution also failed to provide a result in the range, a result of >400 ng/mL was reported for the assay.
Data
The core laboratory information system (LIS; ModuLab version 2.2.07, Systelab Technologies S.A., Barcelona, Spain) of the Tor Vergata University Hospital of Rome was queried for STAT CTNI tests ordered between May 1, 2014, and May 1, 2015, by both emergency department (ED) and other hospital departments (non–emergency department [NED]). Raw data were formatted and filtered using an Excel spreadsheet (Microsoft, Redmond, WA) to obtain the quantitative and qualitative variables.
Quantitative variables were the time from the previous sample and the value of the previous sample, whereas the binary qualitative variables were the actual dilution status (1 = diluted, 0 = no), the ordering department (1 = cardiological intensive care unit [CICU], 0 = other), and the presence of a cardiac event/surgery in the patient (1 = yes, 0 = no). In particular, the actual dilution status refers to a generic dilution and does not distinguish between the “first” in-line 5-fold or the second off-line 10-fold dilution performed in our laboratory.
Statistical Analysis
A first qualitative and descriptive analysis was performed to gather information on the frequency of diluted samples, with respect to the ordering department and the dilution level. A further descriptive analysis was performed to compute the median and 90th turnaround time (TAT) and the outlier percentage (TAT-OP) at 60 min with respect to the level of dilution and the ordering department. All of the calculations were performed with an Excel 2010 spreadsheet (Microsoft).
The main analysis was conducted by using an ANN to infer the generic dilution status of the incoming sample on the basis of some information available through the LIS. 8 To simulate this process, we used the MLP-ANN implemented in SPSS 20.0 (IBM Corp., Armonk, NY) running on a desktop personal computer, providing the necessary information to build the inferring model (inputs) through the qualitative and quantitative variables described previously. 9 In particular, using the actual dilution status variable as the target of inference (or output), the synaptic nodes and connections within the MLP-ANN were built through an in-line procedure with the gradient descent method, which iteratively updates the weights of the synaptic connections after every single training session. 10 In this regard, the data set was randomly partitioned into 70% for training and the remaining 30% for testing the MLP-ANN network in order to achieve the minimum inference error with respect to the output. Concerning the model architecture, the choice of the best one was achieved through automatic selection, constraining at five the maximum number of allowed units in the hidden layer, which is the neurons layer that integrates the different inputs to produce the output. The goodness of classificatory/discriminatory power was provided by receiver-operating characteristic (ROC) curve analysis. The relative importance (or strength of association) of a specific explanatory variable with respect to a specific response variable was determined according to the algorithm formerly proposed by Garson. 11 The result of this analysis is an absolute value that ranges from 0 (no importance) to 1 (maximum importance), along with a normalized score, which gives the relative importance of the inputs considered in the model.
Results
Frequency and the Dilution Level
A total of 30,923 CTNI test orders were retrieved. Of these, 46.0% were from the ED and 54.0% from NED. The STAT samples were 99.9% of the ED and 80.5% of NED. The amount of samples that required dilution for completion was 2.9%, of which 92% were from NED and 8% from the ED. Of the samples with dilution, 11.8% were a first sample and 88.2% were a second or successive sample; of all the samples submitted, 85.9% required one dilution, whereas 14.1% required a second dilution. The samples requiring one dilution were 77.8% of the ED and 86.5% of NED. With respect to the ordering department, the Cardiology and Interventional Cardiology generated 25.6% of all NED orders, followed by the 19% from the CICU belonging to the same department. However, 20.7% of the CICU samples required at least one dilution, which corresponded to the 79.8% of all the NED samples requiring dilution. The results are detailed in Table 1 .
Order Statistics. a
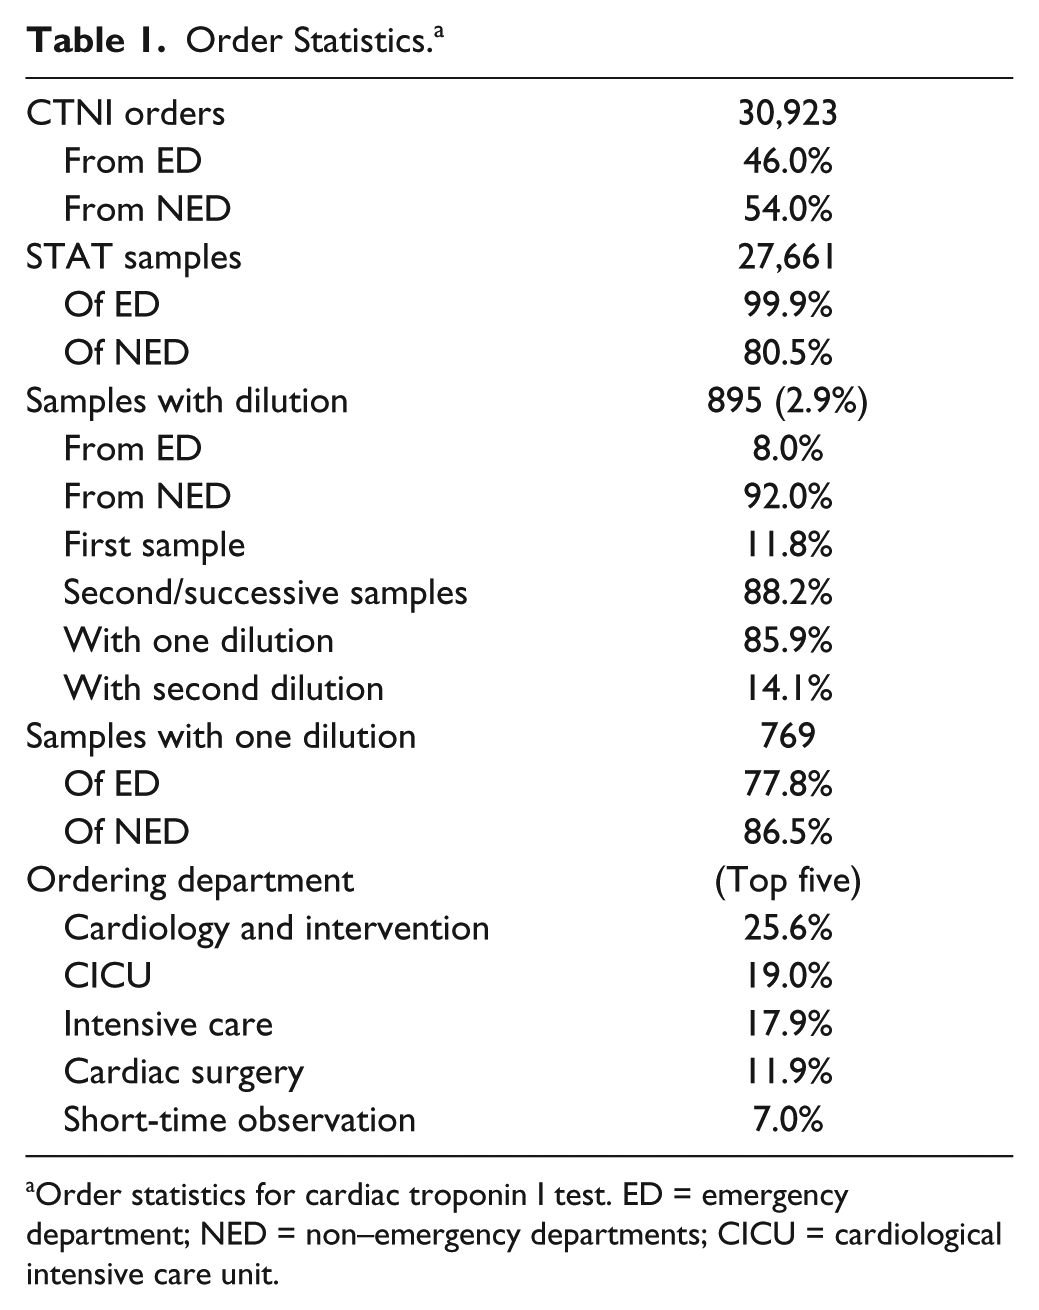
Order statistics for cardiac troponin I test. ED = emergency department; NED = non–emergency departments; CICU = cardiological intensive care unit.
TAT of Diluted Samples
For the ED samples, the median TAT of the undiluted samples was 39.0 min, which increased to 53.0 min after a first dilution, reaching up to 89 min for the second dilution. It is noteworthy that the TAT-OP passed from 12.4% of undiluted samples to 75% of samples diluted twice.
For NED samples, the median TAT of the undiluted samples was 48 min, which increased to 60 min after a first dilution, reaching up to 113 min for the second dilution. For undiluted samples, the TAT-OP was 29.5%, whereas it topped 96.0% for the samples diluted twice. The results are detailed in Table 2 .
TAT of CTNI Test (May 2014–May 2015). a
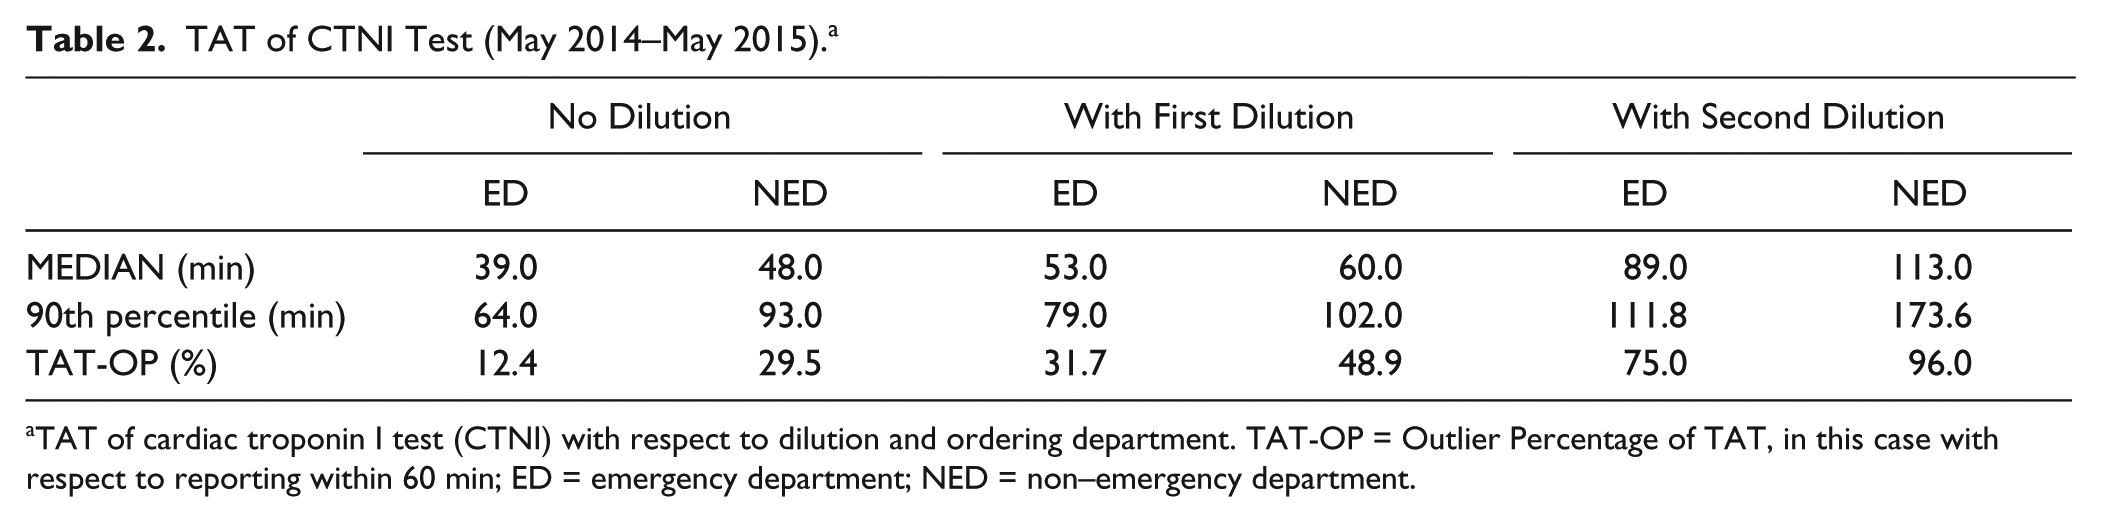
TAT of cardiac troponin I test (CTNI) with respect to dilution and ordering department. TAT-OP = Outlier Percentage of TAT, in this case with respect to reporting within 60 min; ED = emergency department; NED = non–emergency department.
Inference of Sample Dilution Status
The valid entries for ANN building were 16,105. The best MLP-ANN consisted of a three-layer network, with a single hidden layer of two elements ( Fig. 1 ). The hidden layer activation function, which delivers the input activating the elements in this layer, was the hyperbolic tangent, whereas the output layer activation function, which activates the layer giving the final inference, was the normalized exponential (Softmax) function. With respect to classification, the training set correctly classified 100% of samples not requiring dilution and 86.4% requiring dilution. In the testing data set, these results were 100% and 86.2%, respectively. Therefore, the discriminatory power of this classificatory/inferring model corresponded to an area under the ROC curve of 0.992 (99.2%). It must be remarked that the inclusion of the variable accounting for the previous sample value restricted the inference only to second or successive samples.
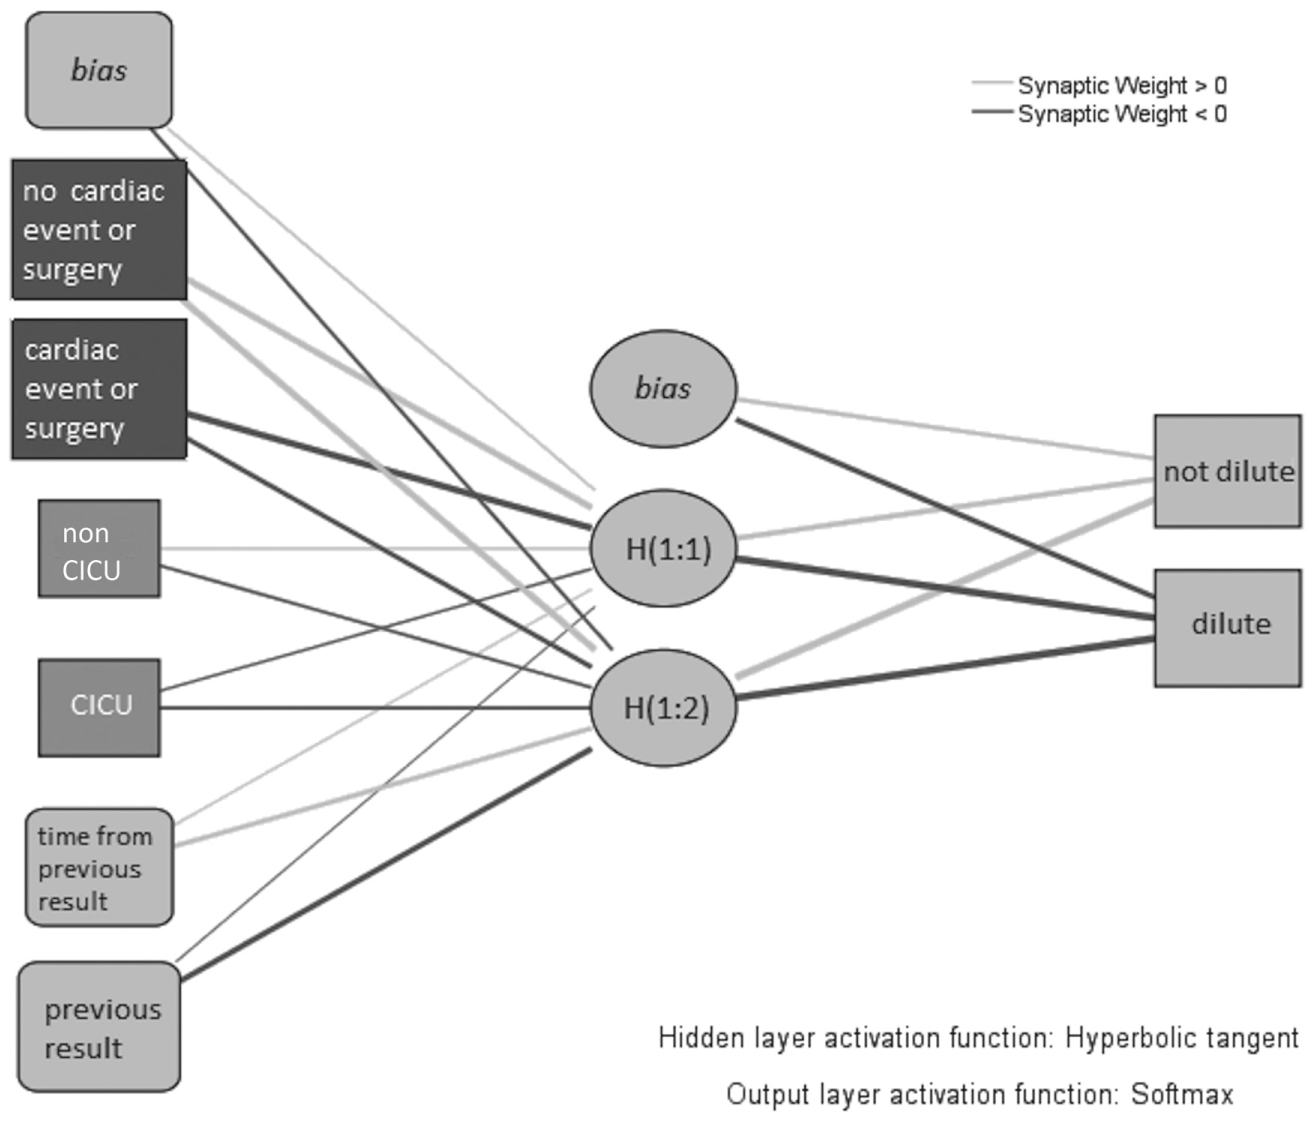
Neural interpretation diagram. The architecture of the Multilayer Perceptron–artificial neural network is graphically shown. The first layer (left side) comprises inputs, the middle layer is the so-called hidden layer, and the last layer (right side) is the output layer, which gives the classification outcome. Solid lines are the neural connections, whose thickness represents the weight, whereas the color provides the sign of the effect (gray for positive and black for negative). Therefore, the more a neural connection is thick, the more it is positively associated with the node in the layer if gray or negatively associated if black.
With respect to the importance of the MLP-ANN inputs, the cardiac event/surgery was the most relevant with an absolute value of 0.422, followed by the value of the previous sample with 0.330, the time from the previous sample with 0.220, and finally the ordering department with 0.028 ( Fig. 2 ).
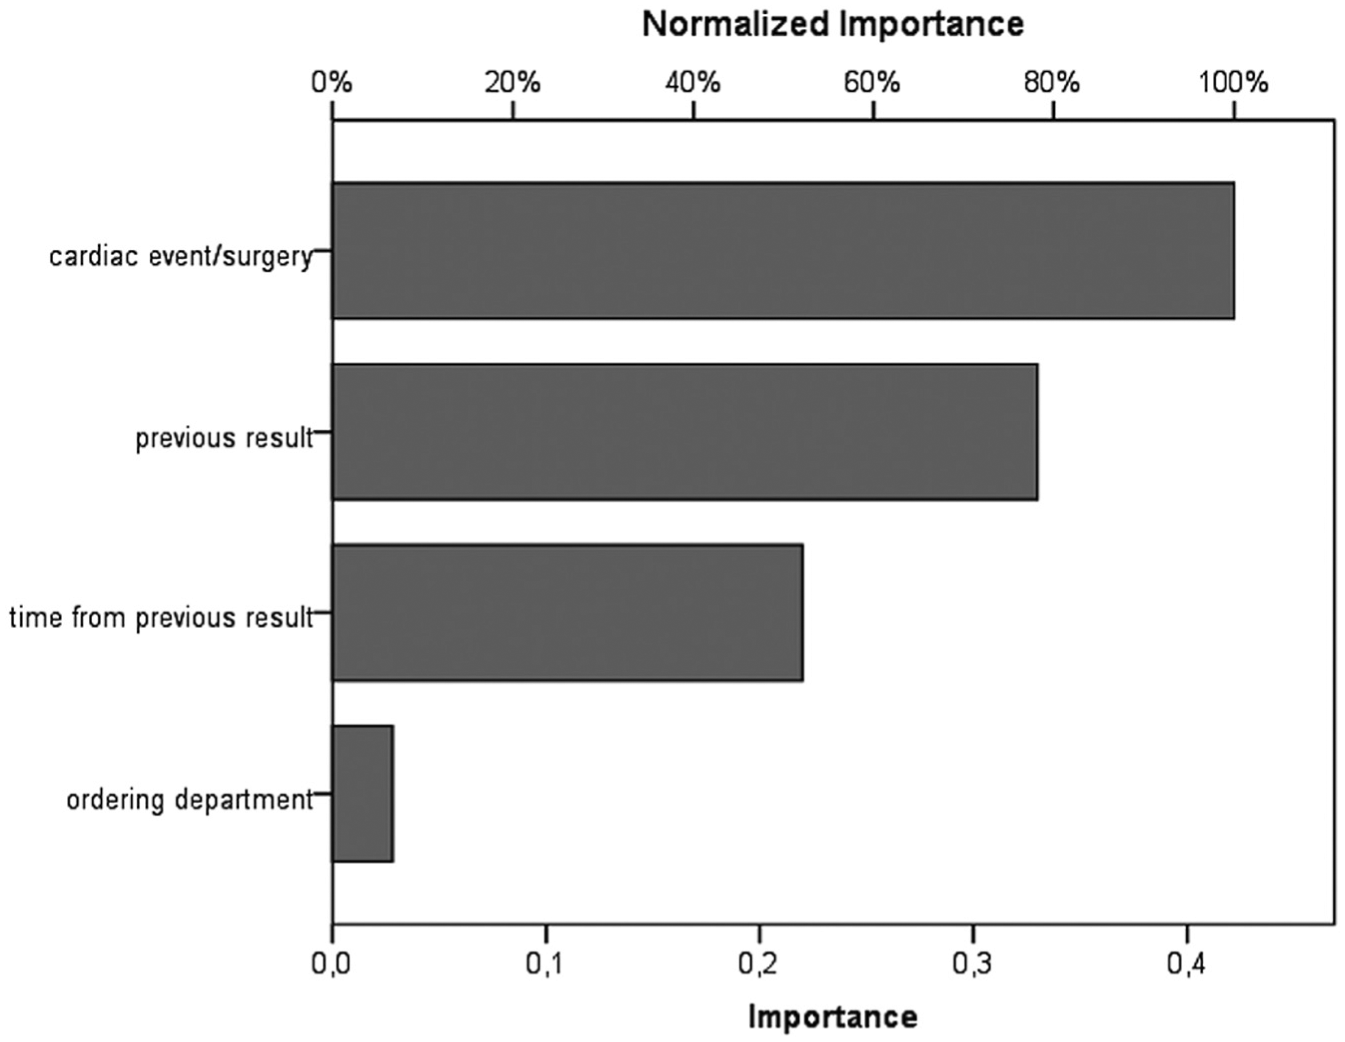
Input relevance diagram. The bar chart shows the absolute (bottom line) and normalized (relative) importance of neuronal inputs (models predictors). The absolute importance represents the effect produced by the predictor on the result outcome and, in turn, the weight the information it delivers has in the decisional outcome.
Discussion
Managing the sample dilution with adequate efficiency can be crucial considering the constraints due to the STAT timeliness. Anticipating the need for dilution is thus mandatory to make the laboratory able to effectively fulfill the requirements of critical care. In this article, we have shown that the implementation of an ANN can be used to enable the TLA to decide whether or not to predilute the sample.
The architecture we have presented herein can be considered very simple and basic with respect to the complexity that MLP-ANN can reach, in that it accounts for a binary outcome, just four inputs and a single hidden layer with only two integrating neurons. Notwithstanding that, this model was shown to reach a discriminatory power of 99.2%, which resulted in 100% of correctly recognized samples for no predilution and 86.2% of samples for predilution. In this regard, it must be said that our model was intentionally constrained to a very simple architecture for the ease of representation, and this happened at the expense of two major limitations, in that the inference referred to a “generic” dilution status and excluded any first samples submitted. However, if we consider what the frequency was of different dilutions in our 1-y CTNI data set ( Table 1 ) and their TAT ( Table 2 ), just applying this basic ANN and starting with the fivefold dilution, we would have significantly reduced the TAT of up to 80% of all the CTNI orders requiring a dilution. Notably, if we consider the TAT-OP, such an intervention would have doubled the amount of results delivered within the 60 min limit. Thus, although our data set comprised a very small number of samples with dilution, and also taking into consideration that the ANN we built was constrained to a very simple structure, we can regard these results as satisfactory with respect to our aim. Therefore, there are some issues that deserve a broader discussion regarding methodology and the possible impact on the automated clinical laboratory.
First, the use of classificatory algorithms to infer or screen the nature of a sample by automated equipment is not a completely new concept.
12
There are several different approaches that can be undertaken to classify and infer the class attribution, among which the most known are the logistic regression and the decision trees. Logistic regression has gained popularity as it allows one to extend the usual regression framework to the classification issue. Therefore, it is easier to understand because of its output relying on coefficients with a straightforward interpretation in terms of odds. On the other hand, decision trees have the great advantage of an immediate visualization of the decisional path, which makes them very familiar to the researcher regardless to any specific background. Moreover, decisional trees can be trained, which means that the more they experience data, the more they can improve performance. Although less immediate and easy to visualize, ANNs conjugate the possibility of extending the framework of regression to classification issues, with the benefit of a greater efficiency in dealing with complex relationships and the possibility of being trained.13,14 Growing an ANN algorithm means enriching the number of connections and neurons within its architecture. Although it can be inviting and helpful to undertake an analysis of complex models, it must be carefully managed for the risk of an overgrowth of the model itself. Indeed, a preliminary simulation we performed showed, for the purpose of discriminating between the 5-fold and 10-fold predilution, that the ANN required a hidden layer with up to four neurons (
Our work also shows that communication between wards and laboratories can provide a determinant contribution to improving the overall efficiency of health care. Most often, the laboratory is addressed as the cause of missed timeliness in patient management, with the clinician expecting TAT considerably shorter than what is realistically achievable.
1
It is noteworthy that the cardiac event/surgery variable was shown to be the most relevant input for the model, on which the largest part of the reliability of inference relied (
Fig. 2
). It is remarkable that such an input was among those we previously recognized as laying outside laboratory control rather than depending on the faculty of the medical staff to make it available by filling an appropriate field within the order entry. In this regard, an MLP-ANN built with the same basic architecture and the binary output, but without the information of the cardiac event or surgery, produced a correct inference for only 64.3% of the samples necessitating a predilution (
Finally, we address the actual impact of this approach with respect to timeliness in test reporting. Our statistics ( Table 1 ) have shown that the amount of CTNI samples requiring dilution for completion is considerably small at less than 3% in a year. However, this raw number does not show the criticality that lies behind each of these samples. Indeed, it can be seen that almost all of the samples with dilution belong to a small number of patients who are experiencing a major event such as cardiac surgery or infarction. In the case of CICU patients, almost all the samples from the same patient required at least one dilution, which caused a relevant systematic delay in the test reporting. If we take into consideration the statistics on TAT ( Table 2 ), we can see that for certain patients, it was almost impossible to perform reliable monitoring, regardless of the efforts made to accurately assay the CTNI. 2 Therefore, although few, the samples requiring dilution are burdened by patient safety, and thus the efforts spent in their regard would greatly contribute to improving laboratory proficiency with respect to critical care.
Conclusions
TLA is effective in improving the handling of critical samples if supported by an ANN that recognizes concentrated samples prior to their assay. Such a system can be implemented in the automation middleware and can help to sensibly reduce the TAT of critical orders delayed by the operation required to retrieve, dilute, and retest the sample.
Footnotes
Declaration of Conflicting Interests
The authors declared no potential conflicts of interest with respect to the research, authorship, and/or publication of this article.
Funding
The authors received no financial support for the research, authorship, and/or publication of this article.
References
Supplementary Material
Please find the following supplemental material available below.
For Open Access articles published under a Creative Commons License, all supplemental material carries the same license as the article it is associated with.
For non-Open Access articles published, all supplemental material carries a non-exclusive license, and permission requests for re-use of supplemental material or any part of supplemental material shall be sent directly to the copyright owner as specified in the copyright notice associated with the article.