
Abstract
During process development, the experimental search space is defined by the number of experiments that can be performed in specific time frames but also by its sophistication (e.g., inputs, sensors, sampling frequency, analytics). High-throughput liquid-handling stations can perform a large number of automated experiments in parallel. Nevertheless, the experimental data sets that are obtained are not always relevant for development of industrial bioprocesses, leading to a high rate of failure during scale-up. We present an automated mini bioreactor platform that enables parallel cultivations in the milliliter scale with online monitoring and control, well-controlled conditions, and advanced feeding strategies similar to industrial processes. The combination of two liquid handlers allows both automated mini bioreactor operation and at-line analysis in parallel. A central database enables end-to-end data exchange and fully integrated device and process control. A model-based operation algorithm allows for the accurate performance of complex cultivations for scale-down studies and strain characterization via optimal experimental redesign, significantly increasing the reliability and transferability of data throughout process development. The platform meets the tradeoff between experimental throughput and process control and monitoring comparable to laboratory-scale bioreactors.
Keywords
Introduction
High-throughput (HT) screening facilities have evolved to perform thousands of experiments in parallel, generating experimental data at incredible speed. These liquid-handling stations (LHS) have accelerated drug discovery, sequencing, protein design, and analytics among others. Unfortunately, typical screening procedures do not provide sufficient information to assess cell performance at industrial process conditions. 1 The big difference in environments during cultivation in microwell plates (MWPs) and biomanufacturing in large fed-batch reactors is an important factor for failure in bioprocess development. 2 It is essential that strain and process engineering are done considering industrial conditions, because cultivation regimes have a significant effect on the metabolism of the producer strain. 3 Hence, keeping conditions comparable to the production scale while going through the development stages (from microliter to liter systems) decreases the risk of failure during scale up. 4
In contrast, early process development is currently mainly focused on miniaturization and throughput maximization, sacrificing monitoring and control of the cultivations. 5 By this, development often follows a trial and error strategy based on batch experiments with endpoint evaluations.6,7 Today, MWPs are the preferred vessels for small-scale microbial cultivation, 8 and its application for screening has become standard practice in industry. 9 Using MWPs as cultivation systems has several drawbacks, such as the unknown conditions inside the wells (by the lack of sensors) and a limited sampling capacity, due to the small volumes (mostly one sample). Such experiments are hardly comparable with industrial processes, because monitoring and active controls (e.g., pH) 10 as well as typical perturbations at industrial scale (e.g., reactor heterogeneities) 11 are missing. Furthermore, cultivations in batch are known to lead to different outcomes in the screening phase compared with typical fed-batch in biomanufacturing.
Different automated approaches are tackling HT screenings in MWPs for early process development. Some examples are the automated enzyme characterization of mutant libraries, with cell growth and protein production in MWPs 12 ; the integration of the BioLector (m2p-labs, Baesweilter, Germany), for up to 48 parallel cultivations in a modified MWP with feeding, online monitoring, event triggers, 13 and analysis after cultivation 14 ; the BioLector Pro with feeding and pH control via microfluidic addition of fluids for each cultivation well in up to 32 parallel cultivations 15 ; and parallel laboratory evolution in MWPs at different stress conditions. 16
Still, the experimental conditions in MWPs are far from emulating substrate, pH, or temperature heterogeneities present in large bioreactors. The response of the cells to these environmental stresses has been shown to have a significant impact on the substrate uptake and the intracellular fluxes.17,18 Moreover, cell-to-cell heterogeneity is increased, having also a severe impact on productivity. 19 For a robust scale-up, the physiological conditions inside the cell and the space-time dynamics of the environmental parameters have to be investigated. 20 Therefore, it is necessary to have dynamic experiments and high-frequency data to understand the behavior of a biological process. 21
Fed-batch processes require monitoring and control, which are difficult to implement in ultra-HT, as performed in molecular target screenings 22 or droplet single cell.23–25 On the other hand, liter-scale bioreactors consume high material volumes and require manual intervention, hampering parallelization in large numbers. Miniaturized stirred-tank bioreactors offer a good tradeoff between the experimental throughput and quality of the generated process data. Examples are the ambr 15 system (Sartorius AG, Göttingen, Germany), the bioREACTOR 48 or 8 systems, and the explore HEL system.26,27 In addition, via the combination with automated liquid-handling systems, the throughput and parallelization of microbial cultivations in small-scale stirred tank systems is increased. 28
There is also work on automation of experimental facilities toward “smart” platforms. One way of achieving this is the sequential design method, by which experimental data are processed by algorithms to design the following experimental round.29,30 Unfortunately, these technologies are still focused on static experiments with mainly endpoint measurements and no investigation of bioprocess dynamics. Fed-batch and scale-down experiments require some understanding of the dynamics of the cultivation and resulting cell responses. 31 To these ends, feedback operation methods have been developed 32 with online optimal experimental redesign strategies to fit macro-kinetic differential equation model of Escherichia coli.33,34 Nevertheless, these complex approaches require a fully automated and efficient workflow of different laboratory devices, data exchange, and management, which has not been achieved before. In previous publications, the solutions were tailored to a specific process, less flexible, relied on proprietary data formats and one-way data transfer, and included manual steps. In this article, we present a fully automated and highly modular facility based on a novel concept for the interaction of (1) laboratory equipment, (2) data, (3) smart services, and (4) the operator. The robotic facility presented here enables us for the first time to perform parallel small-scale experiments with fully automated process handling, at-line sample analysis, and closed-loop process control. In addition, optimal experimental designs, model-based screenings, and scale-down experiments are possible.35,36 This was achieved by the physical and virtual interaction of two LHSs and a mini bioreactor (MBR) system. A central database is used for the integration of all units into a continuous workflow, which allows for end-to-end automation 37 and operation of the parallel experiments. This automated “smart” experimental facility is a step toward advanced bioprocess development phasing toward the digitalization of biomanufacturing and Industry 4.0. 38
Materials and Methods
Concept and Structure of the Platform
To ensure robustness, flexibility, and dynamic of the MBR platform, we used a central database as a data master. All measurements, sampling IDs, set points, process parameters, or any other data generated or necessary during the cultivation were stored in a structured manner, independent of the source or scope. Data transfer lines were avoided as much as possible, all the data were trasferred to the database on a direct way and can be read out from every entity involved in the framework. Direct communication between the MBR platform devices is needed for the execution of triggering events for certain tasks.
During the cultivation, all of the generated data from each MBR cultivation are saved in the database, such as the liquid-handling steps and the online and at-line values. On the other hand, set points for the culture handling regarding feeding, pH, stirring speed, and aeration are written to the database and read by the corresponding devices. The database backbone was designed by infoteam (Software AG, Bubenreuth, Germany) during the BMBF AutoBio project. 37
The setup of the robotic MBR platform centers around the integration of the bioREACTOR 48 mini bioreactor system (2mag AG, Munich, Germany), which enables 48 cultivations in parallel, with a Tecan Freedom EVO 200 LHS (Tecan Group Ltd, Männedorf, Switzerland). The Tecan robot system performs the cultivation handling, process control, and sampling in an automated and parallel manner. Via the use of an electric linear transfer unit, the combination with a Microlab Star LHS (Hamilton Company, Bonaduz, Switzerland) is enabled ( Fig. 1 ). Samples of the parallel cultivations are taken into MWPs on the Tecan deck and carried via the transfer unit to the Hamilton deck, where the at-line analytics are performed. By the use of an integrated Synergy MX microwell plate reader (BioTek Instruments GmbH, Bad Friedrichshall, Germany) photometric measurements of the recently taken samples are performed. The optical density (OD600) of the parallel cultivations, enzymatic-based tests, as well as fluorescence signals are measured.
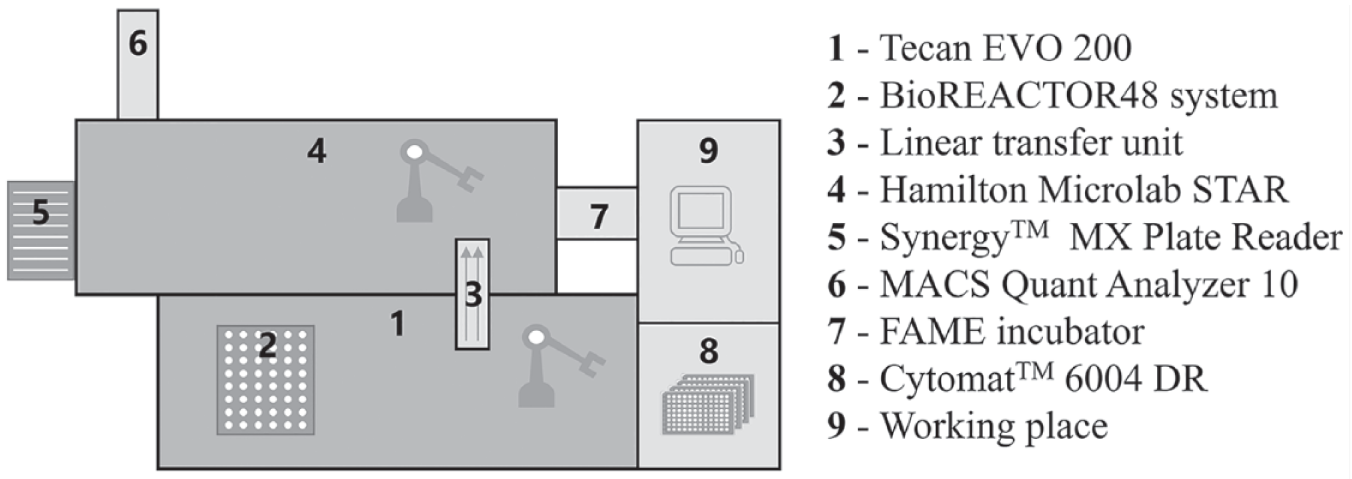
Setup of the robotic platform with the combination of two liquid handlers via a linear transfer unit. Further integrations of labware devices such as a plate reader for photometric analysis, a Cytomat as plate storage, an incubator for plate cultivations, and a flow cytometer for single-cell analysis are shown. The working place contains three computers, two for the control of the liquid-handling stations and one for the monitoring of the parallel cultivations.
Devices Used in the Robotic Platform
Parallel mini bioreactor system
Microbial cultivations are performed in the bioREACTOR 48 system, which enables HT parallel cultivation in up to 48 baffled single-use bioreactors, each with a working volume of 8 to 14 mL. The system can easily be integrated into liquid handlers and offers a good gas transfer, which is critical for microbial cultivations. Via the embedding of fluorometric sensor spots (PreSens Precision Sensing GmbH, Regensburg, Germany) in each MBR, the pH and dissolved oxygen tension (DOT) are measured in real time with an interval as low as 10 s. This allows for a close culture monitoring and results in large data sets. During a cultivation with all MBRs, 34,560 data points for every hour of the experiment are created, alone already for pH and DOT. The stirrer speed, aeration, and temperature are controlled for the whole system uniformly. The temperature in the reactor block is measured via a Pt 100 sensor and controlled through the interplay of a water bath and a cooler. The mixing of the liquid in the MBRs is provided by hollow shafts with magnetically driven stirrers. This causes an induced draft mechanism, by which the air is sucked from the headspace into the liquid phase. The system can reach a volumetric mass transfer coefficient (kLa) of up to 0.4 s−1. 39 The power input and local energy dissipation are comparable to standard stirred-tank bioreactors and computational fluid dynamics simulations showed similar hydrodynamics to bench-top stirred bioreactors on a liter scale. 40 In the lid of the system, the supplied air is distributed to the headspace of each single bioreactor. The surplus of air leaves through ports in the lid above each bioreactor, ensuring sterility by a continuous outflow of sterile air. The lid of the bioreactor system is cooled to 4 °C to minimize evaporation during cultivations. In preliminary tests, the maximal evaporation rate was determined with 50 µL per hour (data not shown), which is in good agreement with the literature. 41 The ports in the lid enable access to each MBR with the steel needles of the Tecan liquid handler, allowing automated culture handling and control as well as automated sampling.
Gas-mixing station
A Red-y gas-mixing station (Vögtlin Instruments GmbH, Aesch, Switzerland) was installed upstream of the bioREACTOR 48 system for flexible and precise control of the aeration supply. The exact inflow can be controlled as well as the composition of the aeration through the addition of pure nitrogen or pure oxygen to the pressurized air. This can be controlled via a graphical user interface developed in LabView (National Instruments, Austin, TX), which enables manual control or automatic control through the database. Thus, an aeration profile can be automatically applied to the cultivations. The sterility of the system is guaranteed via a Midisart 2000 air filter (Sartorius AG, Göttingen, Germany), which is installed between the gas-mixing station and the MBR system.
Liquid-handling stations
On the deck of the Tecan LHS, the bioREACTOR 48 system, trays for the liquids needed for sterilization of the needles, feeding, pH control, a cooled carrier for the sample plates, an Eppendorf tube carrier for offline samples, and a washing station for the steel needles are placed ( Fig. 2A ). Moreover, an adaptive carrier of the Cedex Bio HT analyzer can be placed for direct sampling into the corresponding tubes. The system is equipped with a robotic manipulator arm (RoMa) for plate transport and a liquid handling arm (LiHa) with eight fixed steel needles. The Tecan liquid handler is used for performing all necessary steps for the parallel cultivation handling in the MBRs including feed addition, pH control, sampling, and volume balance. Moreover, a Cytomat 6001 (Thermo Scientific, Berlin, Germany) is connected to the robot, which functions as a plate storage for the sample plates. Via the Tecan Freedom Evoware, the Cytomat can be controlled, and a new plate is transferred to the deck when needed. The test for sterility of the housing of the Tecan liquid handler with a sterile hood and the test for sterility in place of the steel needles, to ensure that cross-contamination is avoided, were performed according to the method of Rohe et al. 13
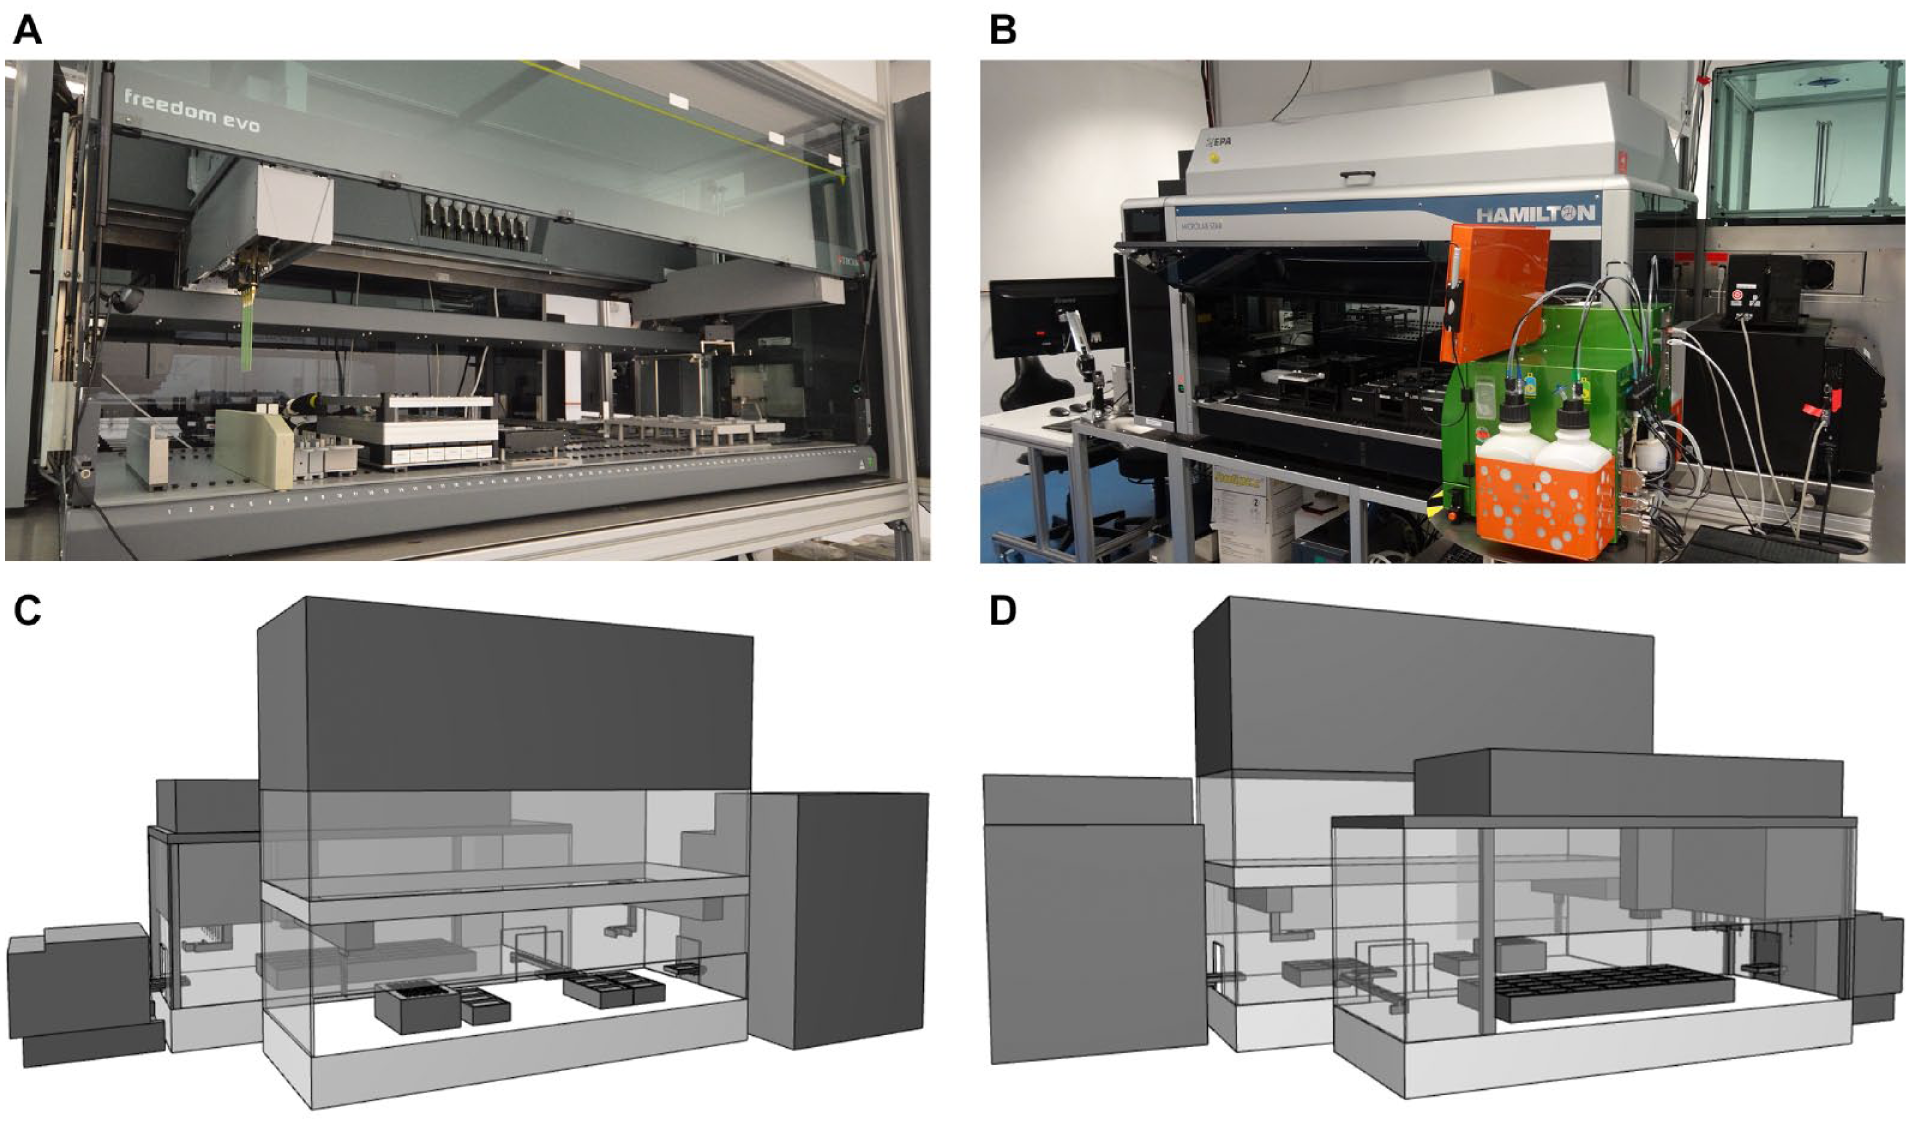
Presentation of the integrated robotic facility. The Tecan liquid-handling station (LHS) with the mini bioreactor (MBR) cultivation platform (A) is connected to the Hamilton LHS (B) on the other side of the platform with the incubator, the MACS Quant flow cytometer, and the plate reader (spectrophotometer). (C, D) Schematic three-dimensional representation of the platform from both sides.
The Hamilton LHS is used for the at-line processing and analysis of the samples taken during the course of an experiment. The Hamilton system is suitable for sample analysis, because it can process a high number of samples in parallel through the 96 multi probe head with single-use tips, the integration of a vacuum station for filtration, and the integration of a plate reader ( Fig. 2B ). After a sample plate reaches the Hamilton deck via the linear transfer unit, the first operation is the measurement of the OD600. For further analysis, the rest of the sample is filtrated to separate the cells from the supernatant. Scale-down of enzymatic tests for glucose and acetic acid concentration in 96-well plates allows for fast and HT analysis of samples in parallel to the cultivation. 42 Further downstream processing applications can be performed on the Hamilton LHS if needed (e.g., chemical cell lysis 43 ) or protein affinity purification in prepacked 96-well plates. Moreover, other enzymatic assays, which are evaluated photometrically, can be scaled-down and performed on the Hamilton liquid handler. Single-cell at-line-analytics are possible with the MACS Quant Analyzer.
Standard Cultivation Workflow
Prior to the inoculation of the MBRs, a two-staged batch phase is performed. The first batch phase is executed in Ultra Yield Flasks (Thomson Instrument Company, Oceanside, CA) directly after inoculation from cryo stocks. After adaptation to the medium for 4 h, the cells are transferred to PreSens shake flasks with online monitoring of pH and DOT. The cells are collected during the exponential growth phase, which can be evaluated by the DOT profile. The active cells are diluted with fresh medium to a low OD600 of about 0.1 to 0.5 in one batch, and subsequently, each MBR is inoculated with 10 mL of that batch. This enables similar conditions between biological replicates to enable good batch-to-batch reproducibility. The number of biological replicates depends on the number of strains used. Until now, a maximum of eight strains was handled in parallel.
In the beginning of the cultivation, a batch phase is performed to reach comparable ODs600 within the different bioreactors. After a steep increase in the DOT, which signals the exhaustion of the substrate and end of the batch phase, the fed-batch phase is started. Each MBR can be fed individually based on the OD600 in the bioreactor and the set growth rate (µset). With the use of computational modeling, industrial feeding strategies can be performed: a batch phase at the start of the experiment, followed by an exponential fed-batch phase and a constant feeding after induction. It is possible to use different types of substrates or substrate concentrations; therefore, multiple cultivation conditions in one run can be executed. Feeding can be realized in two ways, either via a small bolus glucose addition every few minutes or continuously via the use of a substrate release system (e.g., by the EnBase technology; Enpresso GmbH, Berlin, Germany). 44 This enables a slow glucose release over time based on enzymatic degradation of a polymer and is similar to a fed-batch with a constant glucose feed rate. 45 Also, exponential fed-batches can be performed with this system through semicontinuous additions of enzyme.
The pH control is based on a PI controller programmed in LabView, which calculates the addition of base or acid based on the parameters entered in the database for each bioreactor individually. The control is performed for each bioreactor accordingly, and the parameters for control can be changed over the course of a cultivation, such as the maximum amount of acid or base added in one control step. The pH control can be executed as a two-sided or a one-sided control; during the latter, only base is added to the cultivations. This is especially useful during handling of micro-organisms with cycling acid metabolism, such as E.coli. 46
Sampling is performed in an alternating manner with culture handling to ensure a steady process control. In between two sampling steps, substrate addition and pH control are executed. After sampling of five columns, the plate is transferred to the Hamilton LHS for at-line analysis, and a new plate is provided by the Cytomat. It is possible to have different sampling procedures included in the script, whether offline samples are needed aside from the at-line samples. To keep the volume constant during a cultivation, a subroutine for volume balance is executed. This LabView application considers all volume changes, namely, (1) sampling, (2) feeding, (3) pH-controlling additions, and (4) evaporation, and it calculates the volume deficiency, which is corrected with fresh culture medium. The calculated volume deficiency is saved in the database, read by a LabView application, and performed by the Tecan LHS.
To control the DOT during the cultivations, two stirrer control modes are possible. Either a cascade control is applied, in which the stirrer speed increases when the DOT in one of the MBRs reaches a critical lower threshold, or set points are given, which can be read directly from the database. In this way, preprogrammed agitation profiles can be accurately executed over the whole cultivation. The scripts in the Tecan Freedom Evoware are written in a modular way, where each action of the LHS is saved in subroutines, so that scripts for each phase of the cultivation are easily modifiable. This modular setup of the robotic platform allows for fast execution of new experimental runs and adaptation of the developed scripts to new experimental requirements.
At-Line Analytics
For the at-line analytics 200 to 300 µL samples are taken out of each MBR into a sample plate. In advance, 15 µL 2 M NaOH is added to each well of the sample plate and dried. The addition of the sample results in the dissociation of the dried NaOH and an increase of the pH (pH approximately 10), which, in combination with cooling of the MWP carrier to 4 °C, stops the metabolism of the cells. It could be shown that over the course of 3 h, there was no metabolic activity with this inactivation method. 32 For the OD600 measurement, a maximum of 20 µL of the sample is taken, which leaves at least 180 µL for filtration. Afterward, 2 × 20 µL is used for the enzymatic test in duplicate measurements, and the remaining 140 µL can be used for further offline analyses. The script for at-line analysis of the samples takes about 45 min, which includes the incubation times of the assays, the measurement of OD600, fluorescence signal, and glucose and acetic acid concentration in up to 48 samples in parallel.
Optical density and fluorescence measurement
OD600 is the first at-line measurement performed on the Hamilton liquid handler. Before the measurement, the samples are automatically diluted with 0.9% sodium chloride in 96-well flat-bottom MWPs. Different dilution factors are applied, to stay within the linear range of the measurement over the course of the cultivation. The needed amounts of liquid to be pipetted are calculated by the Hamilton software with an upper limit of 10 µL per sample. Before the spectrophotometric measurement, the plate is shaken for 10 s in the plate reader to guarantee a good suspension of the cells. The samples are prepared in duplicates, measured at 600 nm, automatically corrected against the blank, and multiplied by the correction factor. The correction factor for the path length, which is used to convert the OD600 measured in 96-well plates to a measurement in a cuvette, was calculated in advance. 32 If fluorescent proteins are used as reporters, the fluorescence is measured directly after the OD600 measurement in the plate reader. For different fluorescence measurements, the scripts in the microwell plate reader software are adjusted to the correct excitation and emission wavelengths. The corresponding script is then executed by the Hamilton software.
Glucose and acetate measurements
After the OD600 and fluorescence measurements, the samples are further processed automatically on the Hamilton platform for the analysis of the metabolites and medium components. Glucose concentration is measured with the enzymatic Glucose Hexokinase FS kit (DiaSys Diagnostics Systems GmbH, Holzheim, Germany), and acetic acid concentration is measured with the Acetic Acid Assay kit (Megazymes, Bray, Ireland). Both measurements function via the enzymatic conversion of the analyte, by which NADH is oxidized 47 or NADPH is produced, 48 and both can be measured photometrically at 340 nm. For each measurement, 10 µL of sample is needed, and both are measured in duplicates. Two 96-well MWPs are prepared with preadded master mixes of the test kids, the samples and standards are added, and subsequently the plate is measured after the stated incubation times. The standards used for the determination of the analyte concentration were put in random order to avoid systematic errors and were analyzed for each sample plate repeatedly. The analysis is executed fully automatically, and after each run, the single-use plastic tips of the robot are replaced. The data are automatically processed, and the measured absorption is subtracted by the blank and converted to the analyte concentration by regression of the standard samples.
Offline Analysis
Direct samples from the MBRs as well as the surplus of the filtrated sample volume can be used for offline analyses (e.g., for metabolite and protein analyses). Over the course of a cultivation, a lot of samples are generated. If all MBRs are used, nearly 100 samples are generated after two sampling rounds. Therefore, the offline analysis also needs to be performed in an HT manner. The cultivation samples are automatically pipetted into tubes by the Tecan LHS, and the filtrated samples are collected in 96-well plates. Both are manually removed and stored in the fridge or directly frozen for subsequent analyses.
HT metabolite quantification
For the analysis of the produced metabolites, the Cedex Bio HT analyzer (Roche Diagnostics International Ltd, Rotkreuz, Switzerland) is used. Tests are based on photometric and potentiometric measurements in combination with enzymatic tests for offline analysis of samples in HT manner. For our purposes, glucose, acetate, formate, ethanol, lactate, ammonia, phosphate, and magnesium were analyzed. For each measurement, 2 to 20 µL are needed based on the test used, but the minimal liquid volume required for sample handling by the Cedex pipettes is about 100 µL. The filtrated supernatant samples were diluted if needed and processed according to the user manual.
HT protein analysis
For the analysis of produced recombinant proteins during the cultivation, the LabChip GXII Touch HT (PerkinElmer Inc., Baesweiler, Germany) is used. The measurement is based on the microfluidic and electrophoretic separation in combination with detection via laser-based fluorescence of proteins in the offline cultivation samples. The analysis of one sample takes about 42 s, and 2 to 4 µL per measurement is required. The device is applied for protein quantification in the culture supernatant or after cell lysis. The Protein Pico Assay Reagent Kit was used, which enables detection of protein concentrations as low as 10 pg/µL. The filtrated supernatant samples were used, and the preparation was performed according to the user manual.
Results
Data Handling and Communication
To ensure modularity, the central database is used as a data master for all tasks. Thereby, all devices and programs are able to perform the tasks independently, in parallel and modular fashion via direct communication with the database. One tool to achieve this is a .NET library that is used as a communication interface to the database and can be applied for nearly all Windows-based applications, such as VenusFour (Hamilton), Python (Python Software Foundation), or LabView applications. A mirror-image version of this library is implemented in MATLAB to ensure functionality on Linux-based systems. Complex feeding profiles based on process simulation and optimal experimental designs can be entered into the database for each individual bioreactor.
For manual operation during the experiments, the database can be accessed via developed software. It can be used to write set points and parameters manually to the database. Moreover, the software offers a flexible real-time visualization of the generated data for process control. The offline data are entered via a MATLAB script that properly handles a significant amount of data generated by the LabChip and Cedex Bio HT analyzer. By this, all the data gained in one experimental run are saved together in a centralized manner, which is easily accessible by both the model-based operation algorithms and the operators.
Through the database, different software tools and laboratory devices can communicate and interact, enabling end-to-end data and device integration. Online data such as temperature, stirring speed, pH, and DOT values are stored in the database using a LabView application, which also enables manual control or direct reading of process parameters, such as stirring speed or aeration rate. Set points for culture handling, such as feeding and pH control, are saved as set points in the database and read by different LabView applications. These applications are converted to executable files (exe), which can be run from the Tecan Freedom EVO software directly ( Fig. 3 ). Each set point in the database is connected to a time stamp, and the most recent ones are written into General Writing Language (gwl) lists.
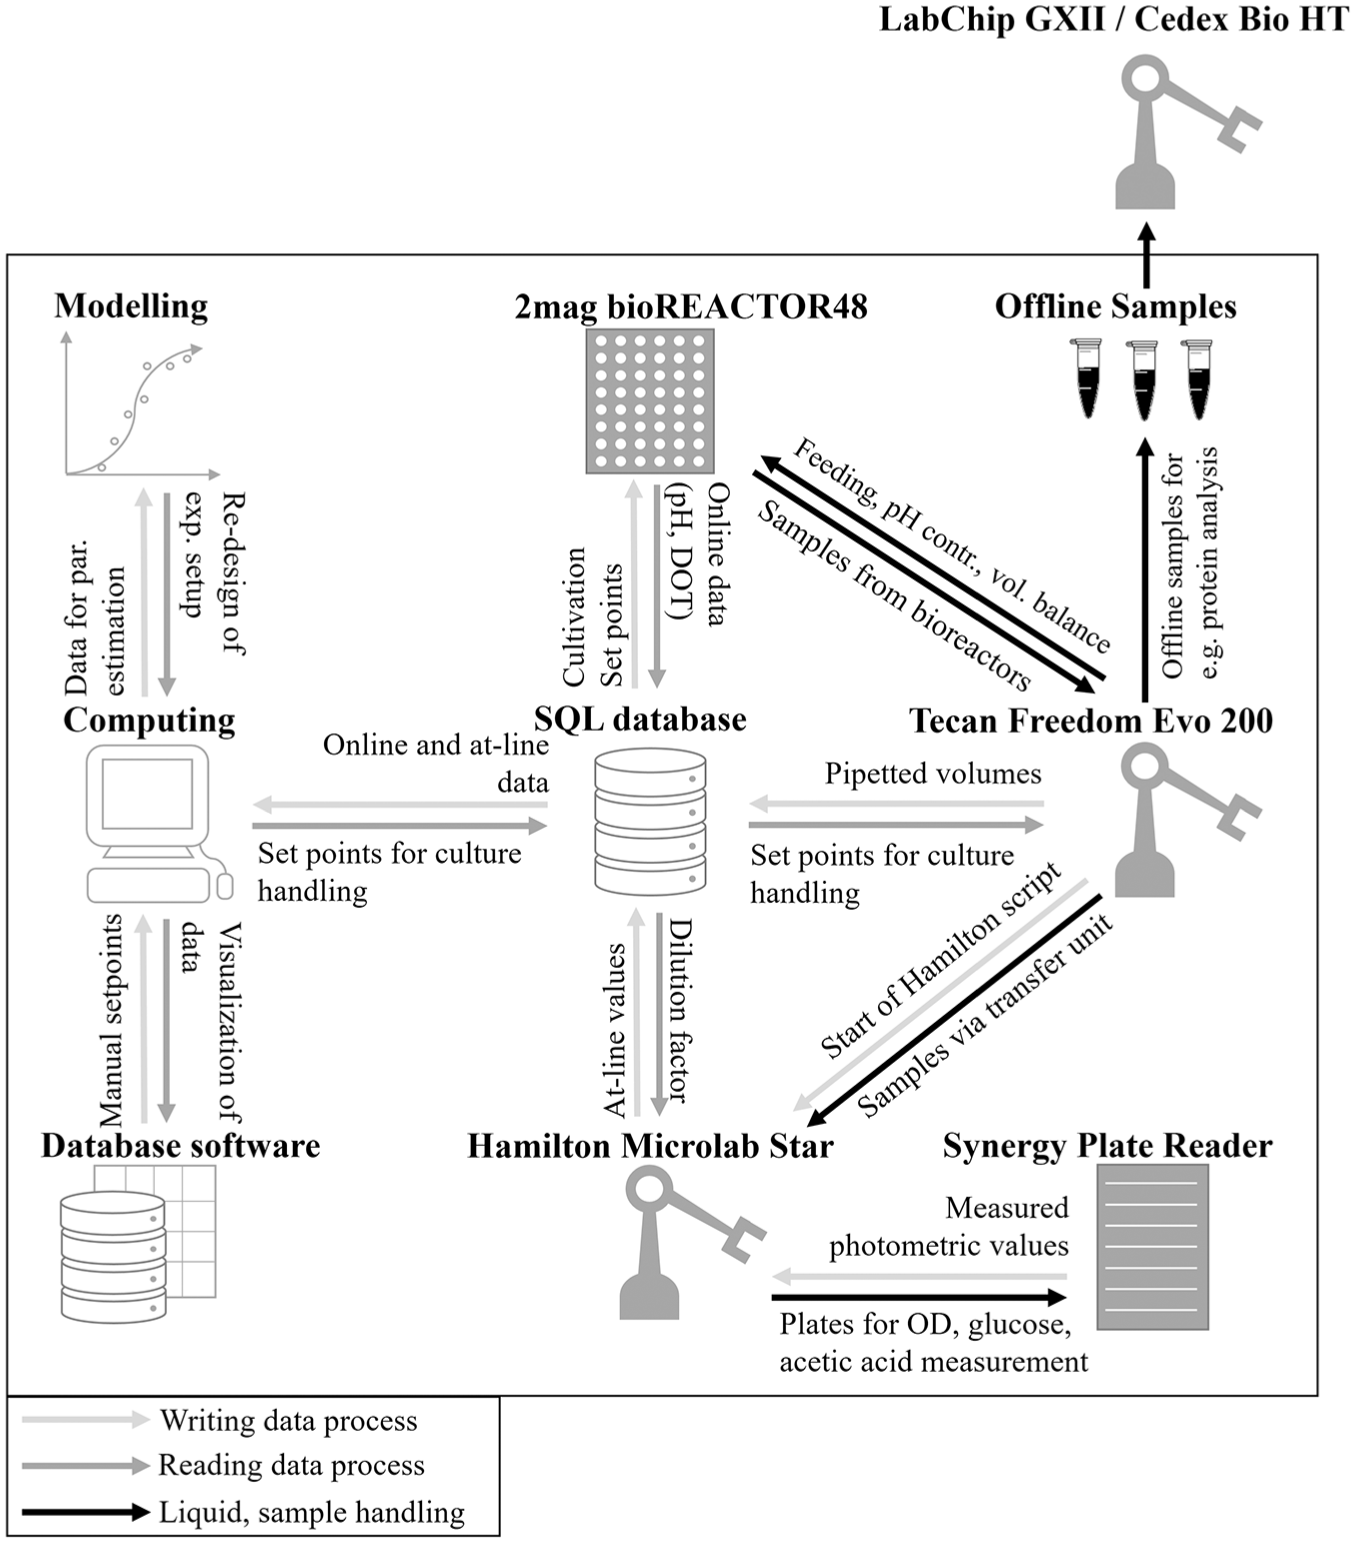
Representation of the schematic data exchange via the centralized database with end-to-end data communication over the whole robotic platform. On the one hand, the database is used for saving the data generated during the experiment as pH, dissolved oxygen tension, and stirring speed. On the other hand, it is used as an interface between the manual or computational control of the liquid handlers and the 2mag bioREACTOR 48 system. For the data transfer, different software parts need to interact as the database software, LabView applications, Python scripts, model-based MATLAB scripts, and the corresponding liquid handler software.
The server-client–based communication between the two liquid handlers is ensured by a Standardization in Lab Automation (SiLA 2) driver. This further developed tool serves as a general and modular interface for the communication between the two LHSs. The Tecan robot sends a SiLA Client command via the network to the SiLA Server on the Hamilton site, which triggers the start of the Hamilton script for at-line analysis. The script on the Hamilton robot is started directly after samples are taken, so that the time frame between sampling and analysis is as short as possible. The at-line data are extracted from the Gen 5 BioTek software of the plate reader, read by the Hamilton software, and saved in the database.
Scheduling of Automated Experimental Procedure
Scheduling of the automated liquid-handling steps is a crucial part during the development of such a platform, because many actions need to be performed within a limited amount of time. It is necessary to evaluate which steps in which intervals should be performed for a steady culture handling. A script was developed that meets the requirements for overall culture handling without longer breaks for sampling or at-line analysis ( Fig. 4A ). For the addition of substrate, an interval of 5 min was chosen, which ensures a semicontinuous feeding over the cultivation. After the start of the script in the Tecan Freedom Evo software, prior to the handling of the sterile liquids, the fixed steel needles are sterilized. For sterilization, the steel needles are treated twice with 70% ethanol. During the process, ethanol is aspirated, and the needles are placed inside the ethanol trays. Through this, the needles are sterilized from the inside as well as from the outside for 20 s. After each ethanol-handling step, the residual liquid is blown out by an air-dispense step. To avoid any carryover of the ethanol to the cultures, the needles are subsequently washed with sterile deionized water.
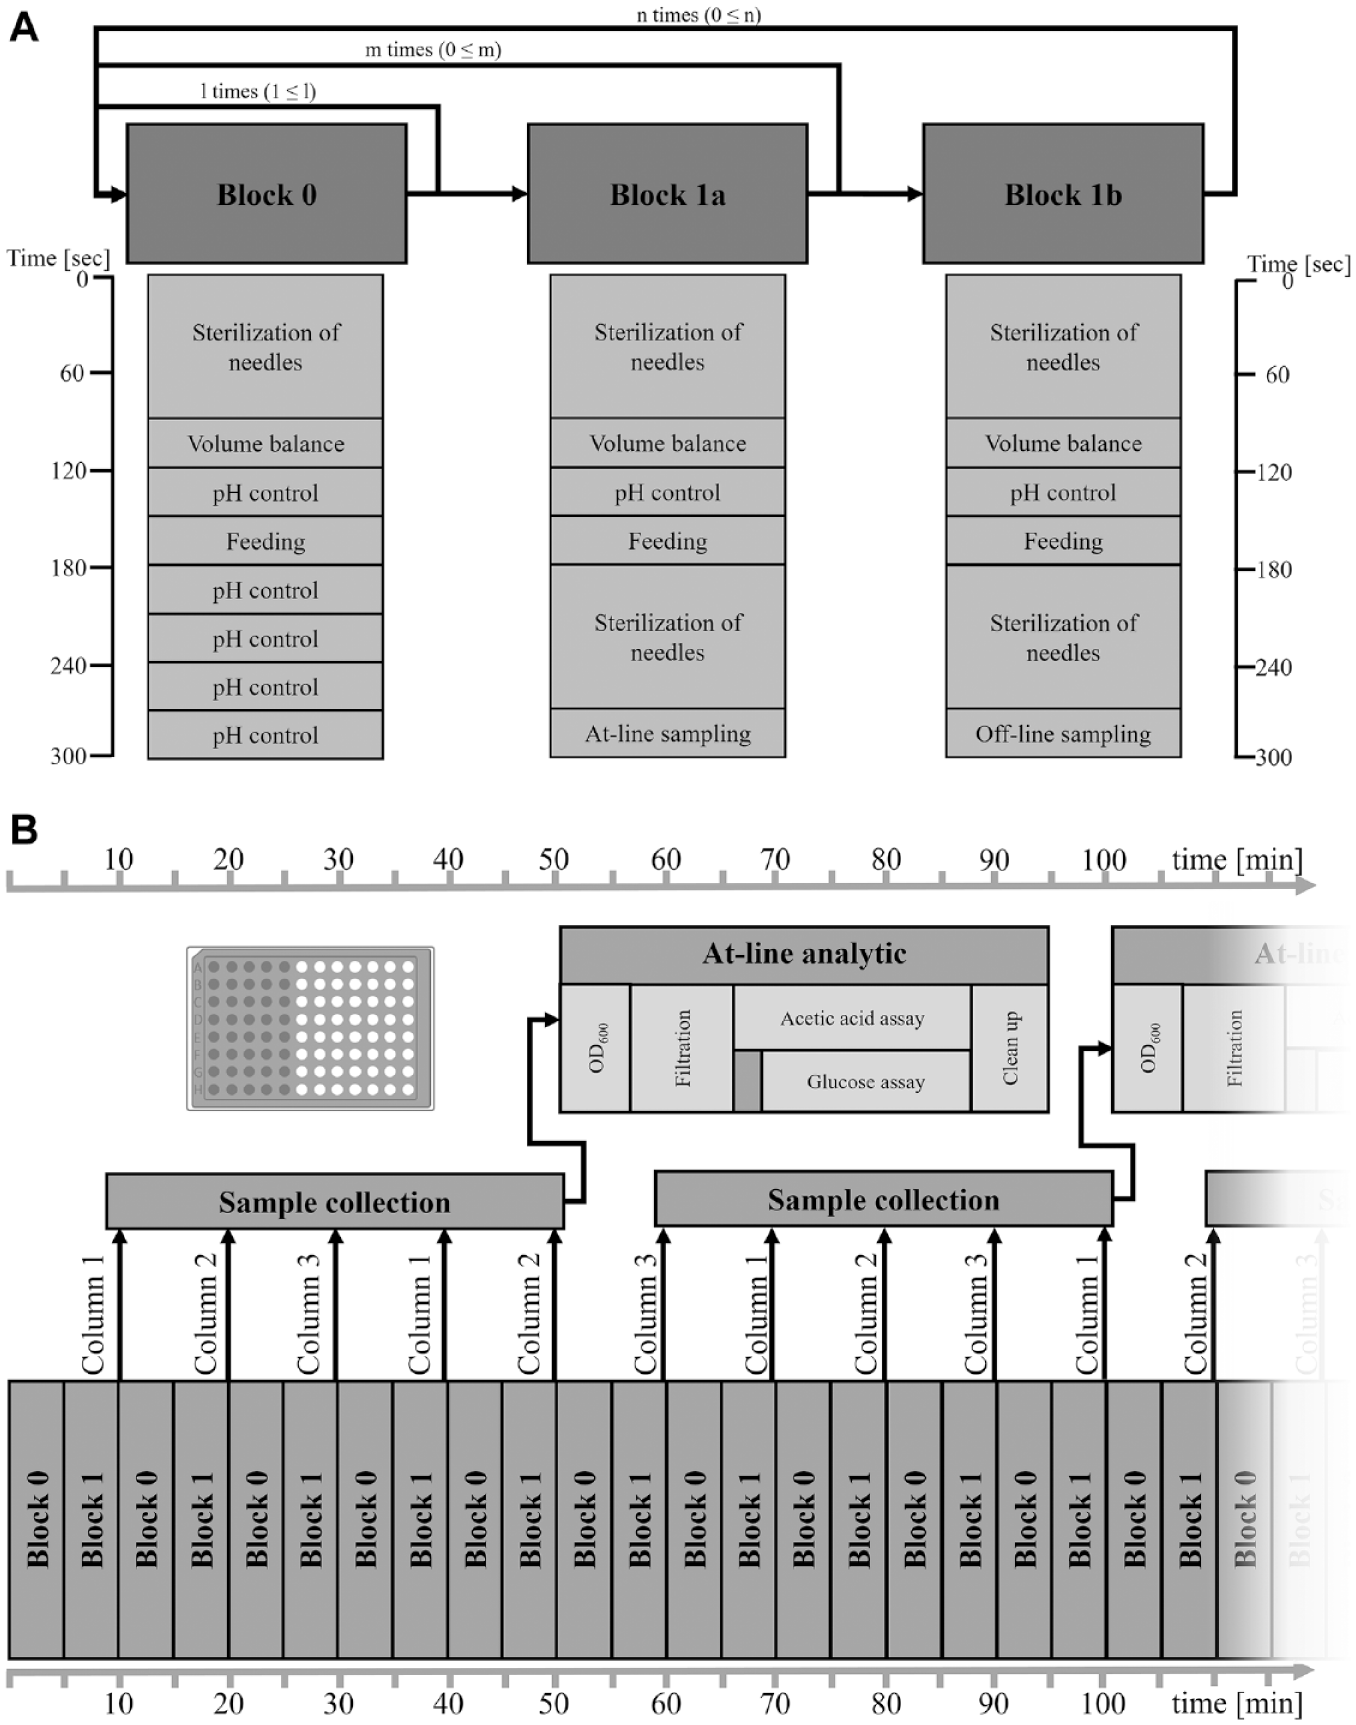
Schematic procedure of the culture handling in combination with sample handling. (
In block 0, all necessary steps for culture handling are integrated as feeding, pH control, and volume balance. Block 0 is designed so that the execution takes 5 min and can be repeated any number of times before block 1, which contains the sampling, is triggered ( Fig. 4A ). The duration of the specific liquid-handling steps can differ depending on the number of bioreactors, which are controlled. Thus, each subroutine is ended by a timer to ensure that the time frame is kept constant regardless of the experimental handling. Each time a block is started and before every sampling, the needles are sterilized. After the handling of each liquid, as base or glucose, the needles are washed with sterile deionized water. In this way, any carryover between the liquids is avoided. Theoretically, sampling could be repeated in an interval of 5 min, choosing between the at-line (block 1a) and offline (block 1b) sampling routine. The limiting parameter is the analysis protocol on the second LHS, which takes 45 min for OD, fluorescence, glucose, and acetate to be analyzed. As an example workflow, block 0 and block 1 can be repeated regularly in 10-min intervals, and five columns are collected before the sample plate is transferred for analysis ( Fig. 4B ). In each sampling procedure, one column (i.e., eight reactors) of the MBR system is sampled. With respect to the analysis time of the at-line measurements, this cycle is performed five times (block 0 and 1 = 50 min). The next sampling cycle starts with the remaining column of the MBR system and proceeds again from the first column. Because of this modular interplay of subroutines both in process control (blocks 0 and 1) and in at-line analysis, the experimental procedures can be quickly adapted based on the analytical results. The separation of process control and at-line analysis clears a lot of the robotic capacity on the Tecan liquid handler for a steady culture handling while maintaining the opportunity to reduce, expand, or convert the at-line analyticals.
Experimental Results
As a proof of concept, an HT fed-batch cultivation of E. coli BW25113 expressing recombinant mini-proinsulin under the isopropyl β-D-1-thiogalactopyranoside (IPTG) inducible tac-promoter is shown. The cultivation was performed with 24 MBRs and pulse-based feeding with different intervals, as a scale-down approach. The data of only six of the MBRs are depicted, to maintain a good visualization of the data ( Fig. 5A ).
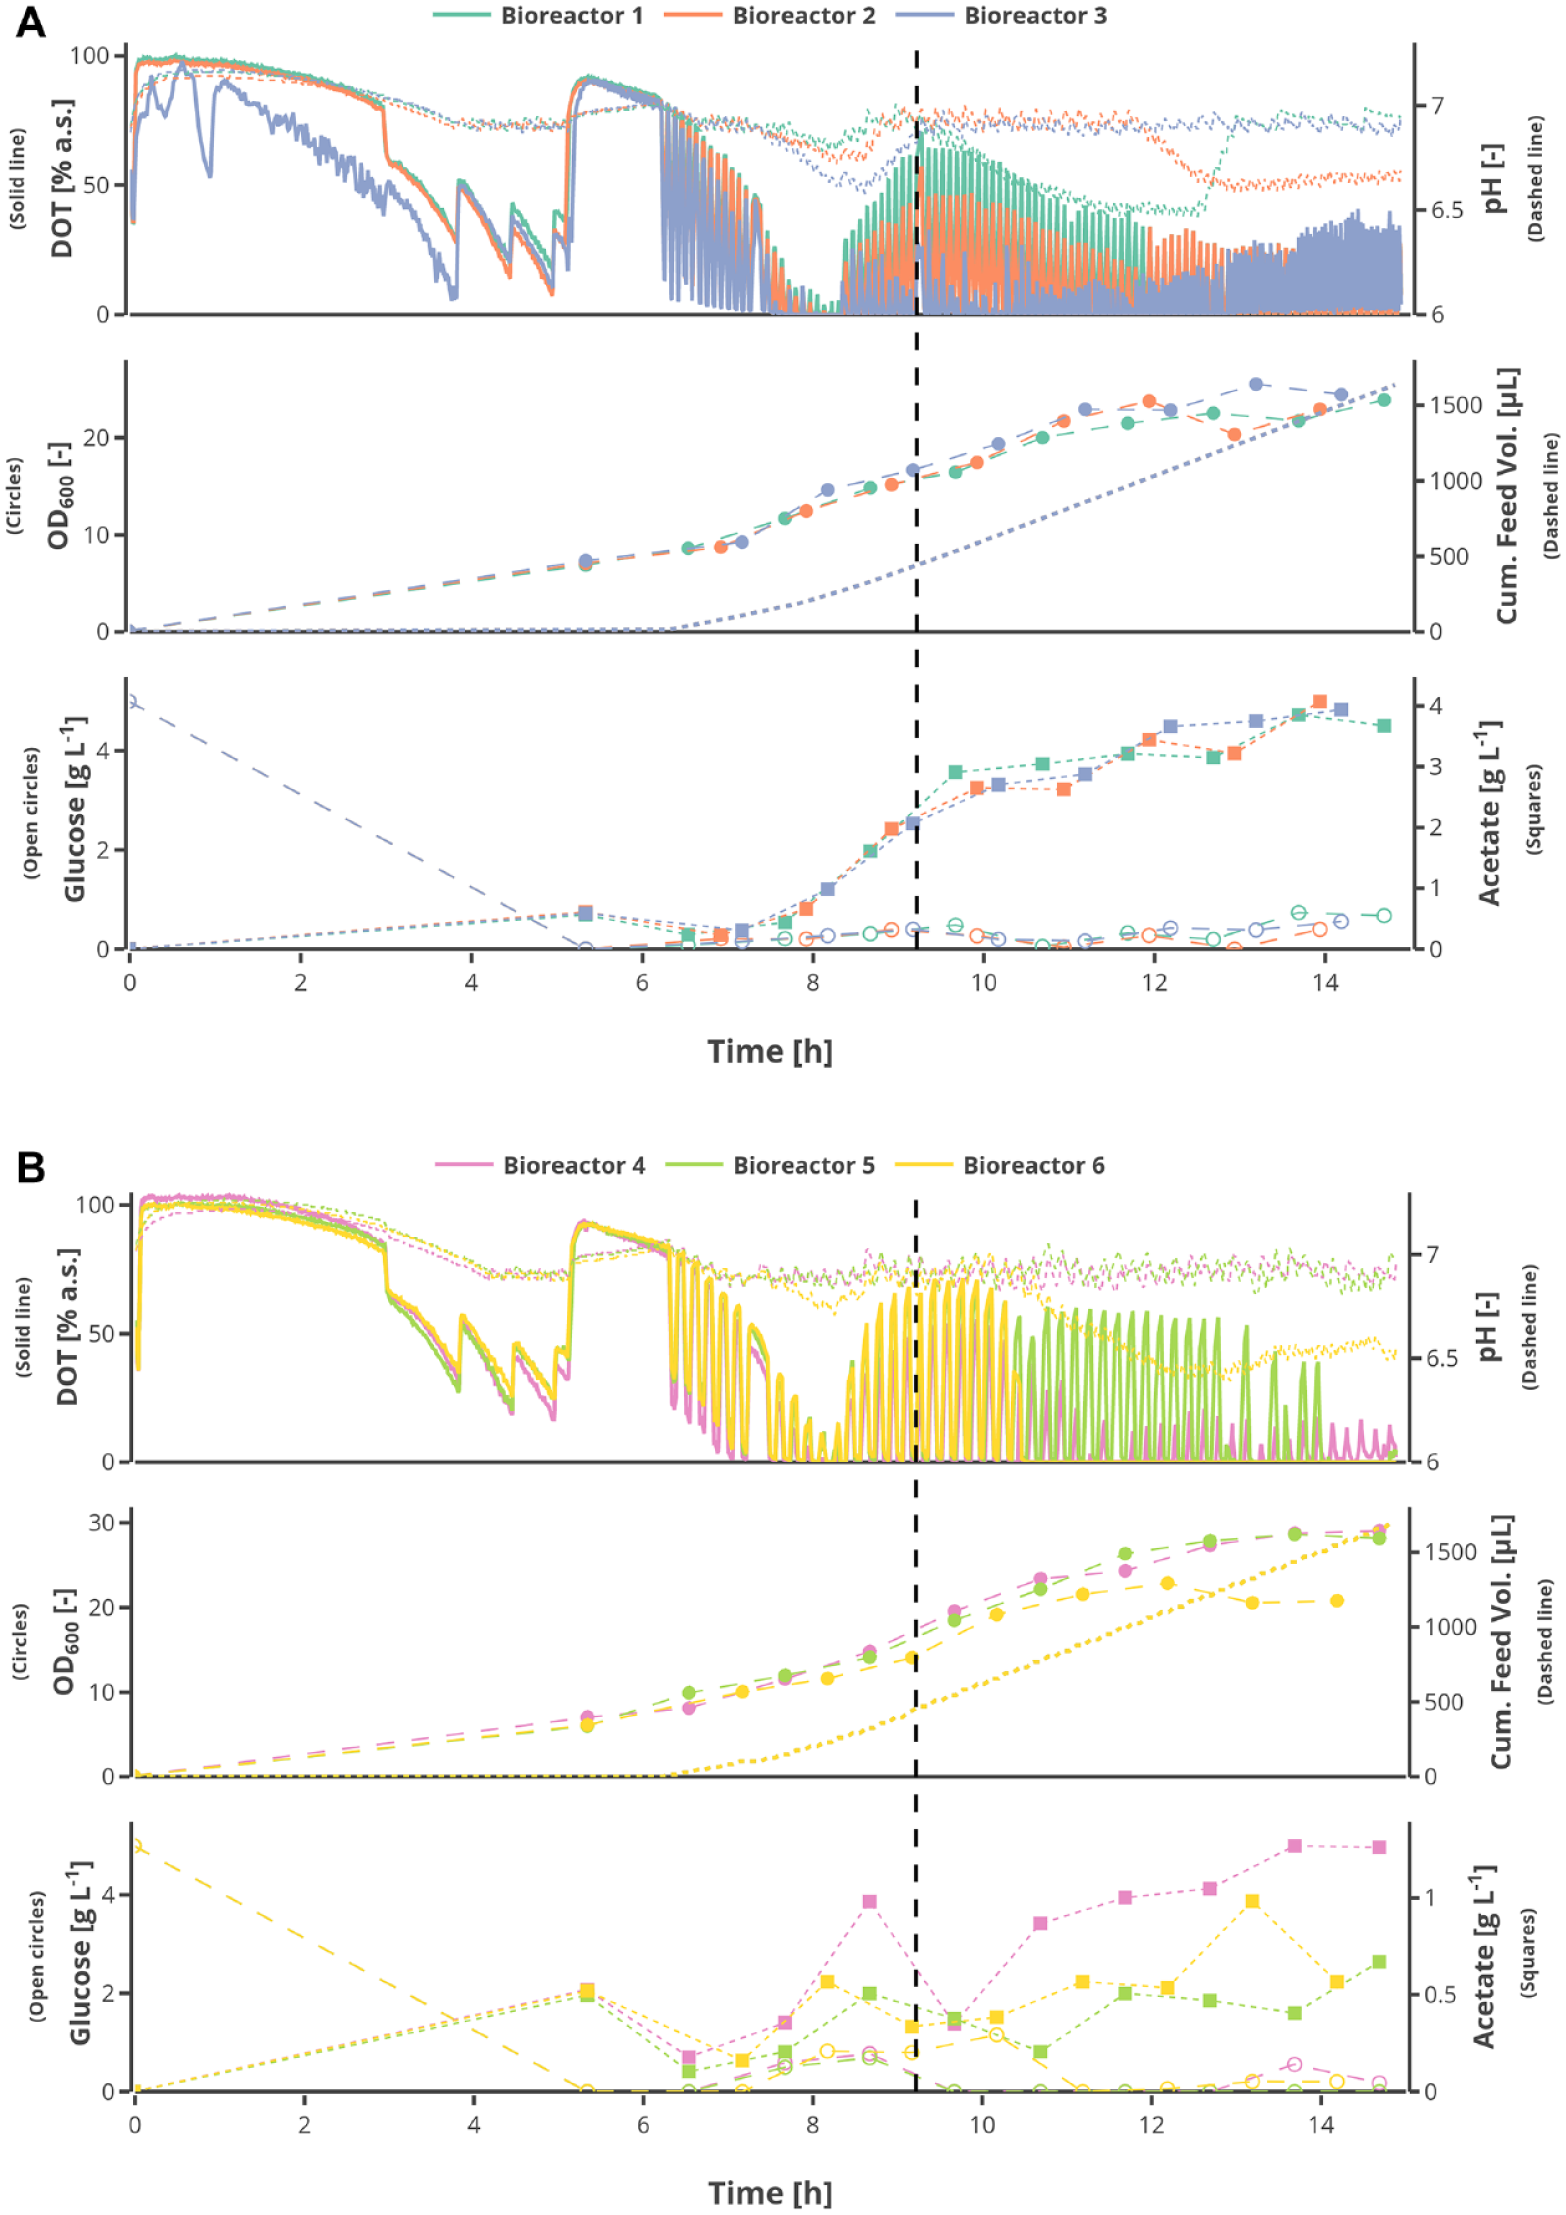
Measured online, at-line, and offline values of the E. coli BW25113 cultivation with a batch phase, an exponential fed-batch phase, and a production phase with constant feed are shown for six of the used 24 mini bioreactors. The feed additions are performed in a pulse-based form with different interval lengths in between. The vertical dashed black line indicates the induction with 0.5 mM (Bioreactor 4–6) and 1 mM isopropyl β-D-1-thiogalactopyranoside (Bioreactor 1–3). The online measured values are dissolved oxygen tension and pH, the at-line measurements are OD600, and glucose and acetic acid concentrations were measured offline. The analysis was performed with the Cedex Bio HT analyzer. The bioreactors with 5 min (
The batch phase was inoculated to an OD600 of 0.1 with an initial glucose concentration of 5 g L−1 in mineral salt media, prepared as previously shown. 18 The peaks in the DOT profiles during the batch phase were caused by rises in the stirring speed, until 2400 rpm, in response to low DOT concentrations. The pH was controlled at a set point of 7 with a tolerance of 0.1, so that as soon as the measured pH dropped below 6.9 for one of the bioreactors, the pH controller automatically interacted. Over the course of the cultivation, the pH dropped for some cultivations below 6.9, because the pH controller could not compensate for the produced acetate. Therefore, the amount of base per addition was increased from 10 µL to 50 µL at 12 h.
The batch phase lasted around 5 h, and an OD600 of 6.74 ± 0.5 was reached for the six shown bioreactors. This shows a good batch-to-batch reproducibility for the parallel cultivations. After the exhaustion of the substrate, which resulted in a steep DOT increase, the pH increased gradually to 7.2 with a steady decline in DOT. This indicates the consumption of the acetate, which was produced as a result of substrate overflow in the batch phase. At 6 h and 13 min, the pulse-based exponential fed-batch phase was started, in which a glucose pulse was added by the Tecan LHS every 5 min for MBR 1–3 and every 10 min for MBR 4–6. The size of the glucose pulses was derived from a time-based integration of a continuous exponential feed that was calculated based on the physiological state of the culture at the end of the batch phase (OD600 and residual glucose). The glucose pulses caused a cycling of the DOT and pH, because of the changes in the metabolism of the cells in response to the availability or limitation of glucose. The drop in the DOT increased with the amount of substrate added per addition and the growing biomass; therefore, the stirrer speed was increased to 2600 rpm at 8 h and 18 min to avoid anoxic conditions. During the exponential growth phase, a µ of 0.925 ± 0.05 (Bioreactor 1–3) and 0.75 ± 0.1 (Bioreactor 4–6) was reached. Despite the different pulse intervals, the cumulative amount of substrate added to the bioreactors was the same over the course of the cultivation. After 9 h and 13 min, the feed was switched to constant feed by maintaining the last value of the exponential phase for every subsequent substrate addition.
Moreover, the cells were induced with an IPTG concentration of 0.5 mM (Bioreactor 4–6) and 1 mM (Bioreactor 1–3), which is indicated by the vertical, black dotted line ( Fig. 5A , B ). The glucose and acetate measurements were performed after the cultivation with the Cedex Bio HT analyzer, because no readjustment of the experiment was performed. The cultivations with the 5 min pulses were run under substrate limitation, as can be seen by the glucose measurements; nevertheless, acetate accumulated until a plateau of 3 g L−1 was reached. Within the cultivations with the 10 min pulses, the glucose varied up to 1.16 g L−1 but went back to limitation toward the end of the cultivation. The acetate concentration increased from 0 to 1.26 g L−1 toward the end of the concentration. This is about three times lower compared with the 5 min pulses and can be explained by the longer time for glucose and acetate consumption between the pulses.
Exemplarily, the electropherogram of the HT protein analysis with the LabChip GXII Touch HT from one MBR 6 h after induction is shown ( Fig. 6A ), whereby the protein of interest is indicated by an orange arrow. The area under each peak is integrated and compared with the peak area of protein standards, by which the quantity of each protein can be determined. For each measurement, a virtual gel sample is created, which allows for visual comparison between different samples induced with different IPTG concentrations ( Fig. 6B ). It can be seen that the proteins are separated, and the protein of interest can be detected clearly in all samples. By this analysis, the dynamics of the product formation could be followed over the cultivation time, as exemplarily shown for two MBRs ( Fig. 6C ). Apart from the analysis, the production of the recombinant protein can be seen in the microscopic pictures taken alongside the cultivation ( Fig. 7 ).
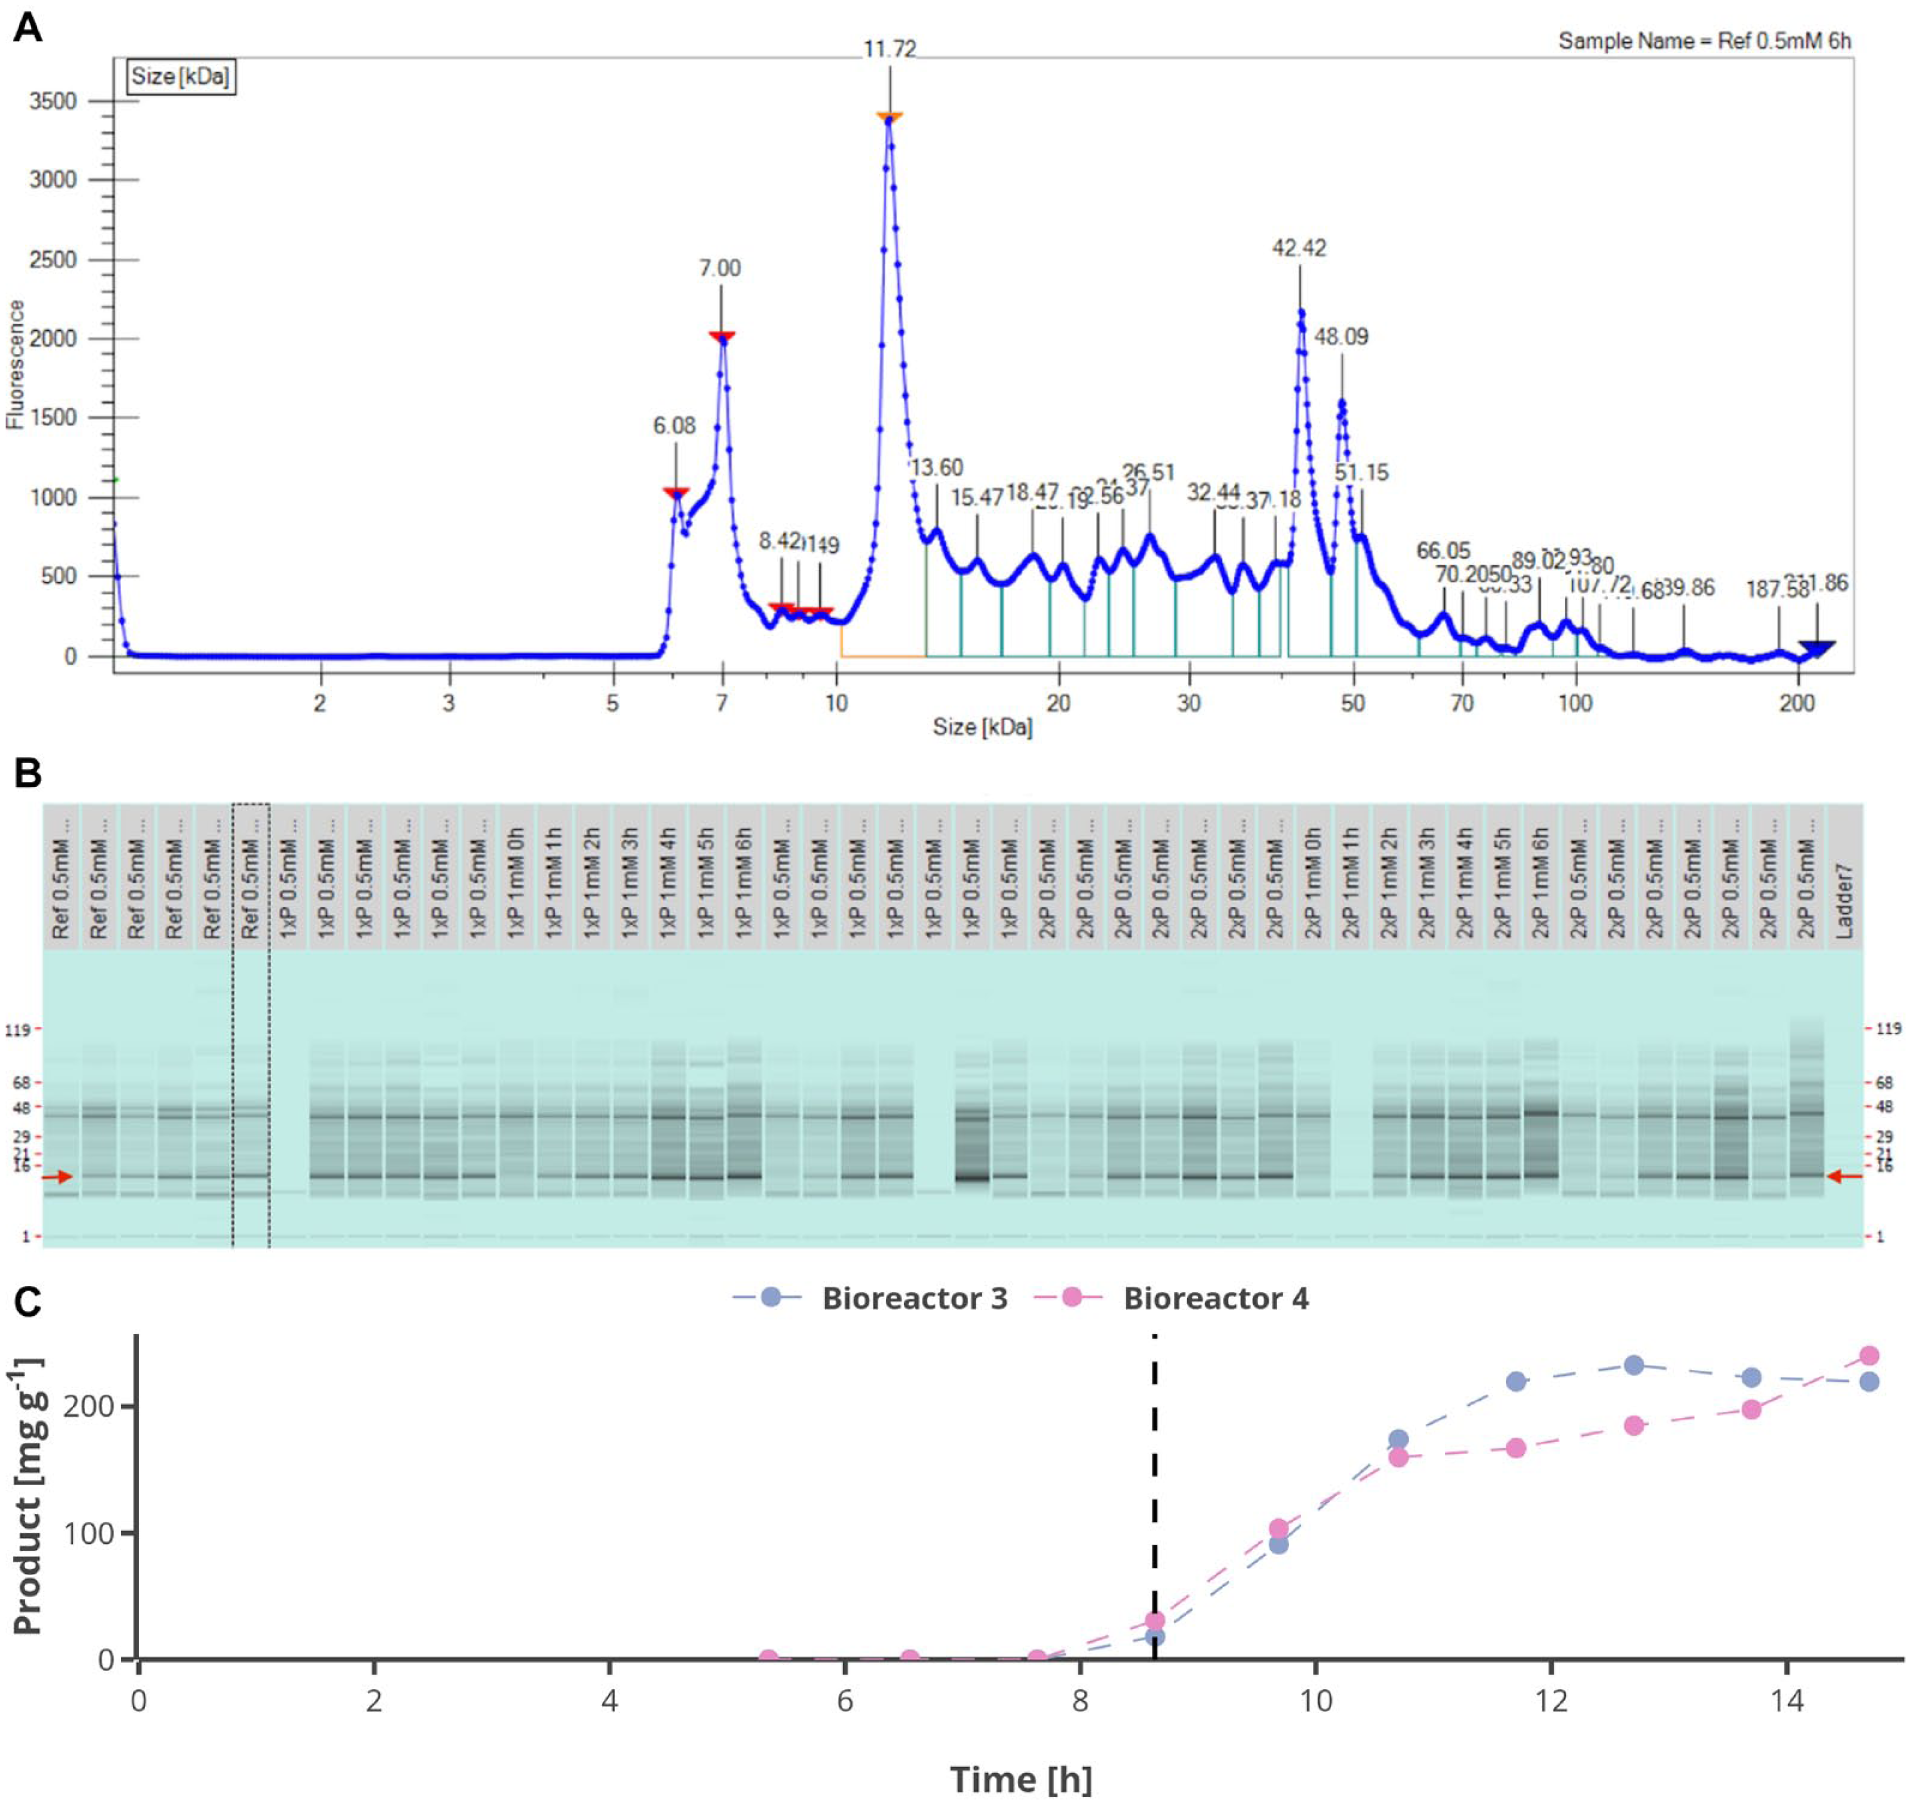
Results of high-throughput (HT) protein analysis using the technique of capillary gel electrophoresis. (
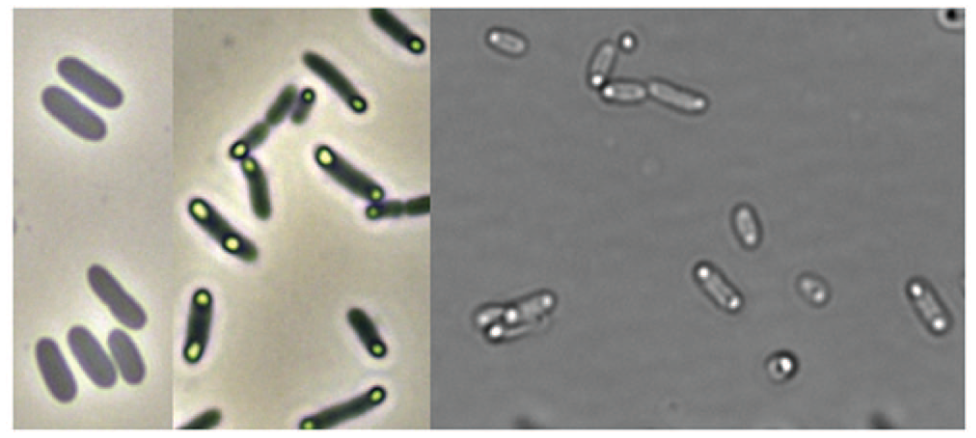
Depicted are microscopic pictures of the E. coli BW25113 fed-batch cultivation before induction (left) and 3 h after induction (middle and right). The produced recombinant protein after induction can be seen by the inclusion body formation at each site of the microorganism.
Discussion
To our knowledge, this is the first MBR platform that enables fully automated process handling and at-line sample analysis in combination with online model-based control options. The parallel cultivations are performed in milliliter scale under well-controlled conditions, generating high-density data. The experimental cultivations are designed taking into consideration the process conditions at large scale. The fast at-line analysis of the samples allows for a good monitoring of the process, adaptive input design strategies, and progressive characterization of strain phenotype during the experiment. Adaptation and implementation of the operating strategy is possible because of fast data processing and device communication through the central data storage. The combination of two liquid handlers with modular, well-structured scripts and bidirectional communication drastically increases the sophistication, capacities, and throughput of the robotic facility. By this, well-defined culture handling with fast at-line analysis is possible, tackling the bottleneck of sample analytics from parallel microliter-scale cultivations. 14
The modular setup of the developed robotic MBR platform promotes the extension of the at-line capabilities by a facilitated integration of new HT at-line analytical devices into the existing software framework.
The development of similar platforms requires interdisciplinary work between engineering, laboratory automation, liquid handling, software development, and mathematical modeling.
The feasibility of 48 microbial cultivations in parallel under well-defined conditions with different feeding strategies was demonstrated over a course of 48 h of cultivation. 49 The application of the platform for the cultivation of different microorganisms, such as E. coli 35 and Saccharomyces cerevisiae, 49 showed the versatility and flexibility of the developed platform. In the combination with model-based operations, complex bioprocess engineering applications, such as scale-down studies 35 and fast-strain phenotyping for optimal screening designs, were also performed. 36
The platform creates an interface between HT small-scale screenings with low-controlled conditions and the labor-intensive well-controlled laboratory-scale bioreactors with a low throughput. Through the application of industrially relevant process conditions, failures during development, due to unrepresentative experimental conditions for further scale-up, can be avoided.
The use of a central database to connect the devices in the integrated framework requires standard communication protocols, for example, Open Platform communication (OPC), which are missing in biotech laboratories. Efforts in that direction are made by the SiLA consortium with the SiLA2 interfaces allowing for multiuser access to devices on simplified, easy-to-understand commands and with unified data formats. 50 Further applications, such as laboratory information management systems and electronic laboratory notebook systems, should also be integrated into automated laboratories devices for a holistic data management.
Supplemental Material
DS_TECH860775 – Supplemental material for Integrated Robotic Mini Bioreactor Platform for Automated, Parallel Microbial Cultivation With Online Data Handling and Process Control
Supplemental material, DS_TECH860775 for Integrated Robotic Mini Bioreactor Platform for Automated, Parallel Microbial Cultivation With Online Data Handling and Process Control by Benjamin Haby, Sebastian Hans, Emmanuel Anane, Annina Sawatzki, Niels Krausch, Peter Neubauer and Mariano Nicolas Cruz Bournazou in SLAS Technology
Footnotes
Acknowledgements
We thank Terrance Wilms for inputs to the model-based scripts and Florian Glauche for fruitful discussion and technical support during the development phase. We also thank Robert Giessmann for programming support during the software setup. Moreover, we would like to thank Dr. Matthias Gimpel for the input concerning the microbiological work. Moreover, we thank the Roche Diagnostics International Ltd and PerkinElmer Inc. for support.
Abbreviations
DOT: dissolved oxygen tension
HT: high throughput
IPTG: isopropyl β-D-1-thiogalactopyranoside
LHS: liquid-handling station
MBR: mini bioreactor
MWP: microwell plate
OD600: optical density
SiLA: standardization in lab automation
Declaration of Conflicting Interests
The authors declared no potential conflicts of interest with respect to the research, authorship, and/or publication of this article.
Funding
The authors disclosed receipt of the following financial support for the research, authorship, and/or publication of this article: The project was financially supported by the German Federal Ministry of Education and Research (BMBF) within the European program EraSysApp (project No. 031L0018A [Leanprot]) and the European Union’s Horizon 2020 research and innovation program under the Marie Skłodowska-Curie actions grant agreement (project No. 643056 [Biorapid]).
Supplemental material is available online with this article.
References
Supplementary Material
Please find the following supplemental material available below.
For Open Access articles published under a Creative Commons License, all supplemental material carries the same license as the article it is associated with.
For non-Open Access articles published, all supplemental material carries a non-exclusive license, and permission requests for re-use of supplemental material or any part of supplemental material shall be sent directly to the copyright owner as specified in the copyright notice associated with the article.