
Abstract
The enormous variation possibilities of bioprocesses challenge process development to fix a commercial process with respect to costs and time. Although some cultivation systems and some devices for unit operations combine the latest technology on miniaturization, parallelization, and sensing, the degree of automation in upstream and downstream bioprocess development is still limited to single steps. We aim to face this challenge by an interdisciplinary approach to significantly shorten development times and costs. As a first step, we scaled down analytical assays to the microliter scale and created automated procedures for starting the cultivation and monitoring the optical density (OD), pH, concentrations of glucose and acetate in the culture medium, and product formation in fed-batch cultures in the 96-well format. Then, the separate measurements of pH, OD, and concentrations of acetate and glucose were combined to one method. This method enables automated process monitoring at dedicated intervals (e.g., also during the night). By this approach, we managed to increase the information content of cultivations in 96-microwell plates, thus turning them into a suitable tool for high-throughput bioprocess development. Here, we present the flowcharts as well as cultivation data of our automation approach.
Keywords
Introduction
Bioprocess development has to identify the most suitable setting of parameters for the commercial production process from a huge choice of options, such as the cellular production system, conditions of cultivation, conditions of product formation, recovery, and purification approach, among others. 1 Commonly, these settings of parameters are fixed and somehow improved by personal knowledge and by trial and error. A consistent strategy has not yet been introduced to industrial bioprocess development. 2 As a result of this, the time to market may vary in industrial biotechnology between 2 and 15 years, 3 resulting in expenses of millions of dollars. In the pharmaceutical industry, regulatory authorities emphasize that the quality of a product should be the result of scientific knowledge (quality by design, QbD) by means of process analytical technology (PAT), among others. 4
But the commonly used screening systems, such as microwell plates and shake flasks, suffer from a lack of relevant information on the latter process, whereas bench-scale cultivations consume time and money due to the lack of miniaturization and parallelization. 2 Modern cultivation systems such as the BioLector (m2p-labs GmbH, Baesweiler, Germany), bioREACTOR 48 (2mag AG, München, Germany), or Micro-24 MicroReactor (Pall Corporation, Port Washington, WI) combine the latest technology on miniaturization, parallelization, and sensing. Although these systems may be upgraded by a microfluidic control device 5 or by micropumps, 6 enabling fed-batch cultivations at the small scale, sampling, liquid addition, analytics, and data processing still need to be done manually. Betts and Baganz, 7 Bareither and Pollard, 8 and Neubauer et al. 2 recently discussed and reviewed current cultivation systems. Some automation approaches are reported, which are dedicated to a certain process 9 or to certain applications such as fluorescence reading 10 or liquid handling.11,12 In downstream processing, the state of the art is comparable. For most of the unit operations, the devices (e.g., filter plates from various manufacturers or chromatography columns [MediaScout RoboColumn; Atoll GmbH, Weingarten, Germany]) are scaled down to the 96-well format, or new magnetic microspheres (MagReSyn; ReSyn Biosciences [Pty] Ltd, Edenvale, South Africa) are developed for high-throughput separation applications. More unit operations are reviewed by Nfor et al., 13 Bhambure et al., 14 and Cramer and Holstein. 15 But automation approaches still seem to be limited to single steps such as protein purification 16 or parallel chromatography. 17 To our knowledge, a combined approach of automated cultivation, product purification, analytics, and data evaluation has not yet been demonstrated for bioprocess development. In our view, such an integrated and consistent approach would be crucial to reduce costs and times and to increase the efficiency of industrial bioprocess development.
Here, we demonstrate the first steps toward fully automated bioprocess development by setting up and applying a robotic platform for parallelized cultivation and monitoring in microwell plates.
Materials and Methods
Screening Platform
Screenings were carried out in 96-well microplates. Culture plates were incubated in an orbital shaker (FAME incubator; Hamilton Bonaduz AG, Bonaduz, Switzerland). A Synergy Mx plate reader (BioTek Instruments, Winooski, VT) as well as the orbital shaker was attached to the liquid handling system (MICROLAB STAR; Hamilton Bonaduz AG). A HEPA filter (Hamilton Bonaduz AG) ensured sterile conditions. This setup is illustrated in Figure 1 . The orbital shaker and the liquid handling system were both operated by the software Method Editor v4.2.1.6670 (Hamilton Bonaduz AG). The plate reader was operated by the software Gen5 v1.09 (BioTek Instruments).
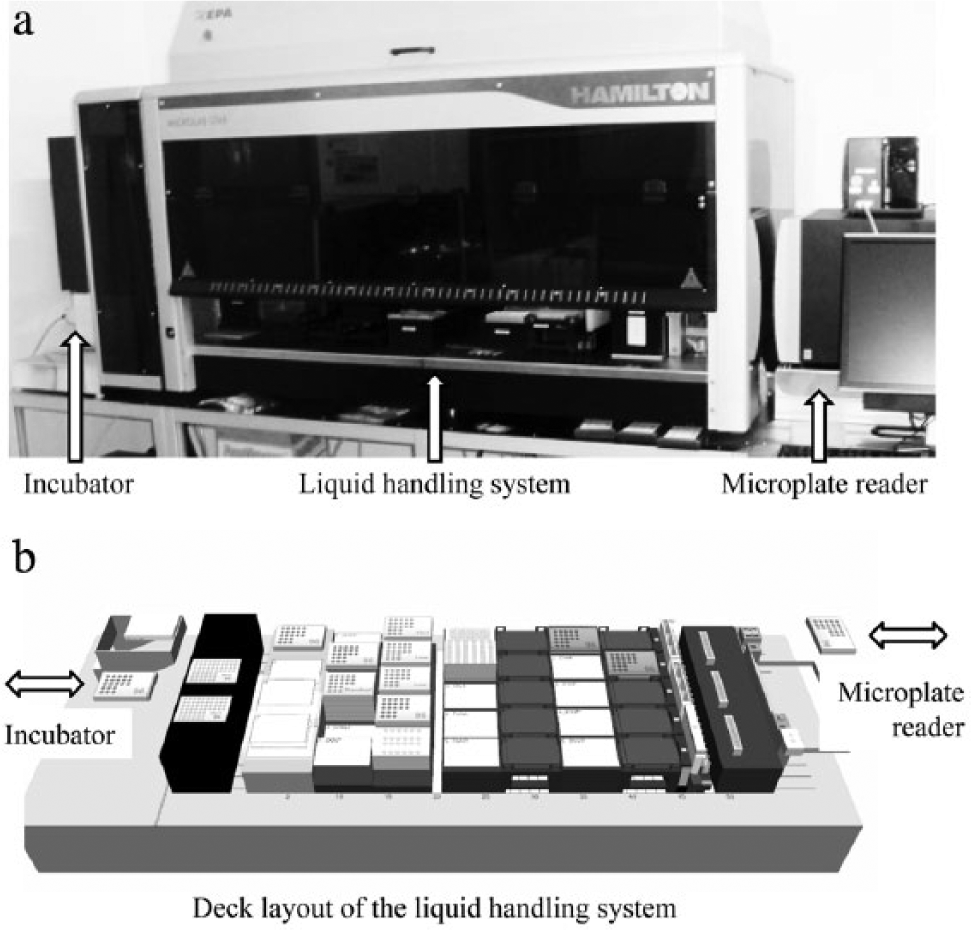
The cultivation and analytic platform at the microliter scale. The (
Strain
Escherichia coli strain K-12 RB791(lacIq) was harboring the plasmid pQE30 (QIAGEN GmbH, Hilden, Germany), which contained the gene of a Lactobacillus species alcohol dehydrogenase (ADH) 18 under the control of a T5lac promoter. 19
Conditions of Cultivation
All cultivations at the microliter scale were inoculated from a preculture. This preculture was grown in 25 mL EnPresso B fed-batch medium (BioSilta Oy, Oulu, Finland) supplemented with 100 µg mL–1 ampicillin and 1.5 U L–1 glucose-releasing biocatalyst (Reagent A). A baffled 125-mL Ultra Yield Flask (Thomson Instrument Company, Oceanside, CA) was filled with the medium that was inoculated with 100 µL from a glycerol stock. The preculture was incubated at 37 °C in an orbital shaker (250 rpm, 25 mm offset) for 5 to 6 hours until it reached an OD600 of about 5.
All 32 cultivations at the microliter scale were carried out in one round-bottom 96-well HydroPlate HP96U (PreSens Precision Sensing GmbH, Regensburg, Germany) simultaneously. Every culture was started at an OD600 of 0.15 in a total volume of 200 µL after inoculation from the preculture. The EnPresso B Defined [Prototype] medium (BioSilta Oy) was prepared according to the manufacturer’s instructions. Eight different cultivation sets were investigated in four independent replicates each. The cultivation sets result from supplementing the cultivation medium with different concentrations of Reagent A, lactose, and/or glucose. Details are summarized in Table 1 . To prevent evaporation, the plate was covered with X-Pierce foil (Excel Scientific, Victorville, CA). All cultures were incubated at 30 °C and aerated by shaking at 1000 rpm and at amplitudes of 2 mm. The expression of the recombinant ADH was induced by the previously described lactose autoinduction system. 19 At certain predetermined times, the culture plate was automatically picked up by the robot from the orbital shaker for analytical determinations. The volumes of the cultures were calculated before sampling. The average evaporation rate of 0.9 µL per hour and well was calculated after the cultivation.
Details of the Cultivation Sets.
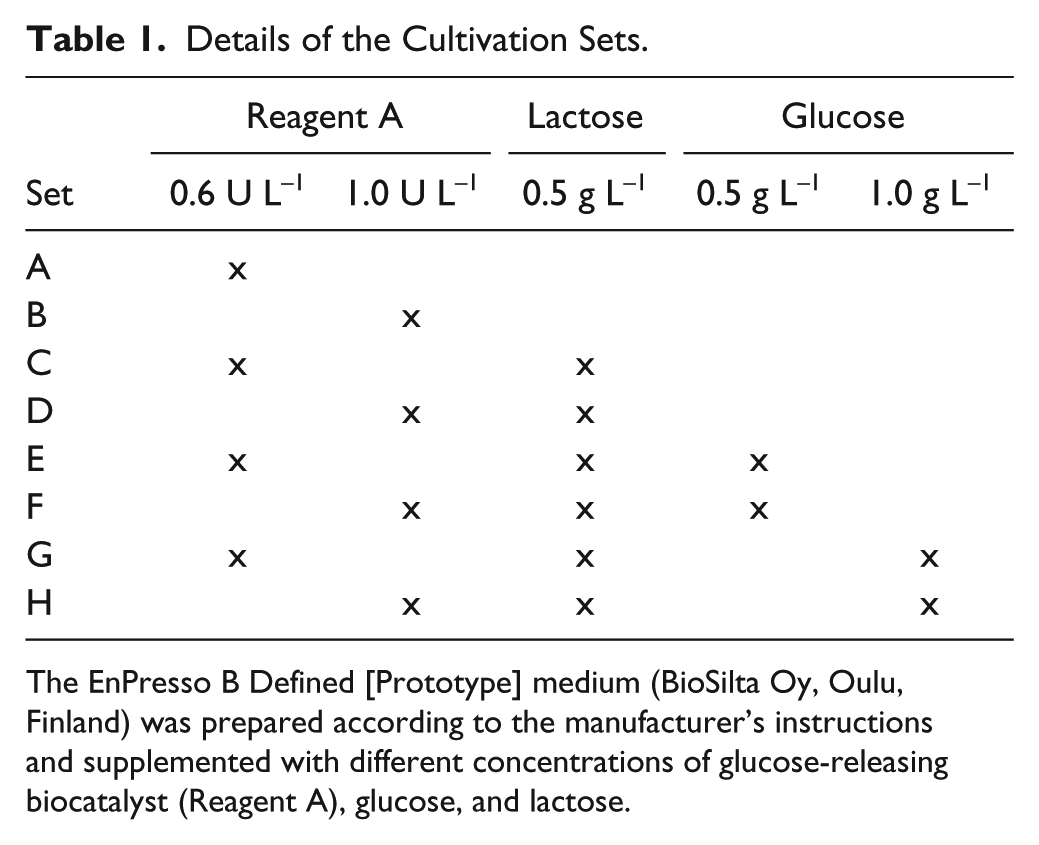
The EnPresso B Defined [Prototype] medium (BioSilta Oy, Oulu, Finland) was prepared according to the manufacturer’s instructions and supplemented with different concentrations of glucose-releasing biocatalyst (Reagent A), glucose, and lactose.
Analytics
pH
The 96-well HydroPlate HP96U (PreSens Precision Sensing GmbH, Regensburg, Germany) enables monitoring the pH. In every well, a pH-sensitive spot is situated. Excitation was conducted at 485 nm and emission was measured at 538 nm and at 620 nm (internal reference) with the Synergy Mx plate reader. The sensitivity of the detector was adjusted accordingly. A calibration was carried out with buffers at a pH between 5 and 9 ahead of the cultivation. Calibration, measurement, and calculation followed the manufacturer’s instructions.
Cellular growth
The optical density (OD, OD600) was measured in 96-well flat-bottom plates (Greiner Bio-One, Frickenhausen, Germany) in the Synergy Mx plate reader at 600 nm. The OD reading procedure was adapted to the microliter scale. Samples were diluted in 0.9% (w/v) NaCl solution and yielded a total volume of 150 µL per well (dilution factor between 5 and 30). Including a blank, all values were calculated for the respective reading in a 1-cm cuvette.
Concentration of acetate in the medium
The concentration of acetate in the broth was determined by an enzymatic assay (Enzytec Fluid Kit E5226; R-Biopharm AG, Darmstadt, Germany) following the manufacturer’s manual for applications at the microliter scale. The sample volume was changed to 7 µL. This sample was taken from the plate, which was returned from the spectrophotometer after OD measurement. Calculating the concentration of acetate in the broth was based on external calibration with acetate solutions at different concentrations.
Concentration of glucose in the medium
The concentration of glucose in the medium was quantified by an enzymatic assay (No. 125119910023; DiaSys Diagnostic Systems GmbH, Holzheim, Germany) according to the manufacturer’s manual. The assay was scaled down and adapted to applications in 96-well flat-bottom plates. Solutions R1 and R2 were mixed in a 4:1 ratio in advance. For measurement, 190 µL of that composition was mixed with 10 µL of the sample. Samples were taken from the plate, which was created for OD measurement. The absorption at 340 nm was measured after a 10-min incubation at room temperature. Glucose concentration was then calculated from external standards measured under the same conditions.
ADH activity assay
Harvesting and cell lysis took place manually and were modified from the protocol of Ukkonen et al. 19 At the end of the cultivations, 100 µL of the cell suspension was transferred to a 96-well V-bottom plate (Greiner Bio-One) and centrifuged at 3750 × g for 15 min at 4 °C. The supernatant was removed and the remaining pellets were stored at −20 °C until usage. For cell lysis, the pellets were thawed and resuspended in BugBuster solution (Merck KGaA, Darmstadt, Germany) that had been supplemented with 25 U L–1 benzonase (Life Technologies GmbH, Darmstadt, Germany) and 200 µg mL–1 lysozyme (Sigma-Aldrich Chemie GmbH, Schnelldorf, Germany). The volume of the lysis agent was calculated with respect to the OD600 of the samples to ensure equal concentrations of biomass for each investigation. The cell debris was separated from the supernatant by centrifugation (3750 × g, 15 min, 4 °C) after incubation for 15 min at room temperature and slight mixing (100 rpm).
An automated procedure was created to run the ADH activity assay. The supernatant was used to determine the enzyme activity as described by Ukkonen et al. 20 but modified for the sample volume. It was increased to 5 µL, and the buffer volume was reduced to 215 µL, to ensure pipetting accuracy of the liquid handling system. The decrease of the NADPH-specific absorption was monitored at 340 nm. The slope was determined from the linear range and was used to calculate the ADH activity in U mL–1 OD600–1.
Results and Discussion
Automation of Cultivation and Analytical Determinations
An orbital shaker and a spectrophotometer both linked to a liquid handling system serve as the platform for cultivation and analytics. The general setup and a schematic drawing of the deck layout of the liquid handling system are illustrated in Figure 1 . To start the cultivation, the medium was transferred from a container to the culture plate, and then the inoculum and the glucose-releasing enzyme were added. Finally, the culture plate was moved into the incubator. These four actions were automated and combined in one method. Four individual methods to determine the OD, pH, or concentration of acetate or glucose in the medium were created after scaling down the enzymatic determination of glucose and adapting the OD reading procedure to the microliter scale. These four methods were combined into one method (see Fig. 2 ). Measuring the pH, OD, and concentration of acetate and glucose was conducted automatically by starting the program. The user could choose upon every sampling event whether the concentrations of acetate and/or glucose should be determined. This package of four methods was put in a loop, enabling automated determination of pH, OD, and the concentration of glucose and acetate at dedicated intervals (e.g., also during the night).
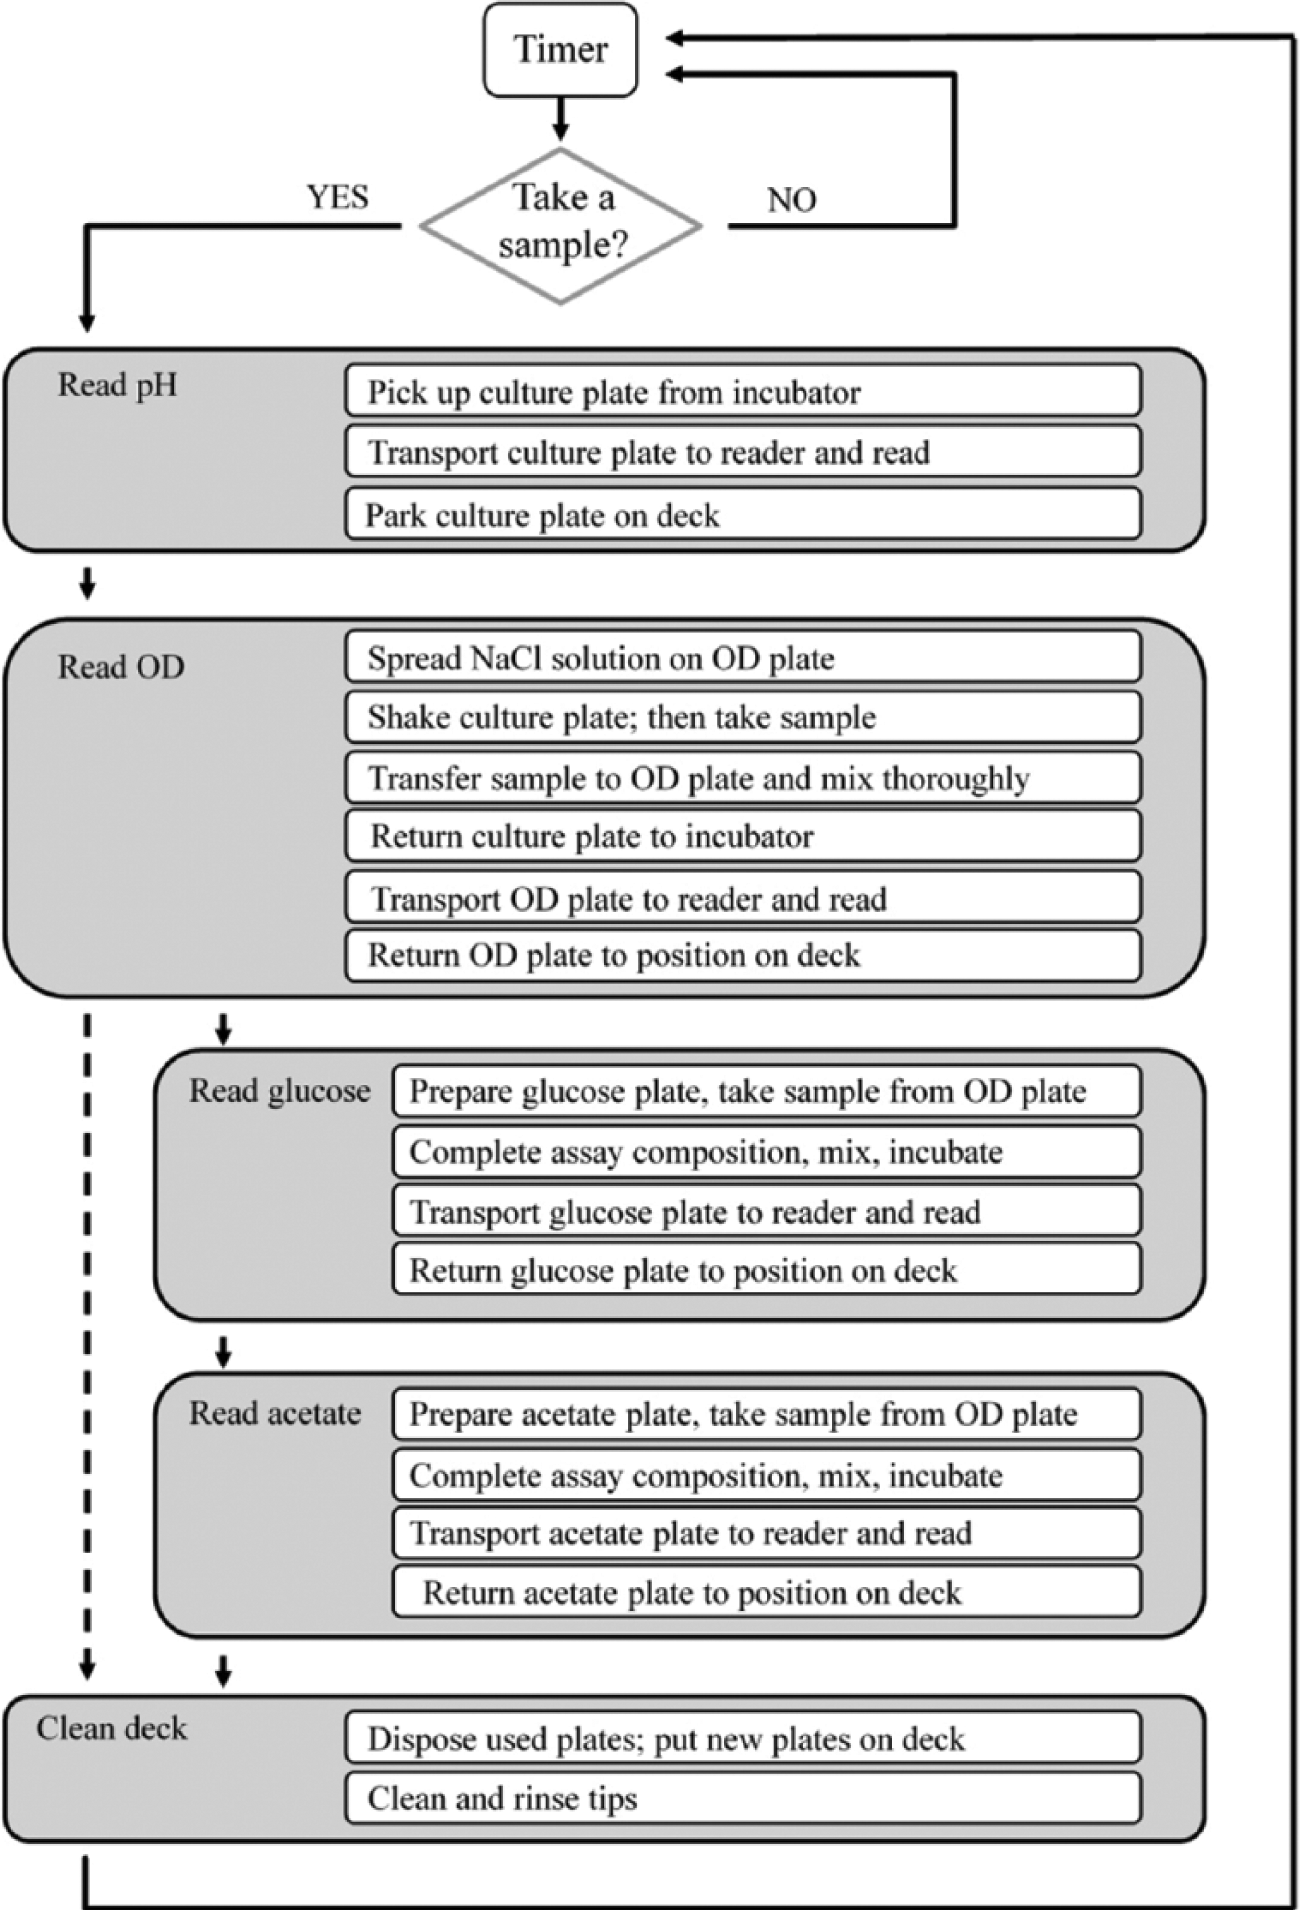
Schematic summary of the automation procedure. The determination of pH, optical density (OD), and the concentration of glucose and acetate in the culture medium was automated separately and then combined into one method. Major plate and liquid handling steps are presented for each determination. The strategy of sampling is also explained in Figure 3 . With a timer, the determination of pH, OD, and the concentration of glucose and acetate may be performed autonomously at dedicated intervals (e.g., also during the night).
Upon sampling, the culture plate was transferred from the incubator to the spectrophotometer for pH measurement (see Figs. 2 and 3 ). Fluorescence was determined and the values were stored in a Microsoft Excel file. Before sampling for OD measurement, the culture plate was placed on a shaker for mixing, and a 96-well flat-bottom plate (so-called OD plate) containing 0.9% (w/v) NaCl solution was prepared on the deck of the liquid handling system. Samples were taken from the culture plate and transferred to the OD plate. Before transporting the OD plate to the spectrophotometer, the culture plate was returned to the incubator so that the cultivation would not be interrupted too long. Here, the culture plate was returned to the incubator in less than 5 min after pickup. Then, absorbance was determined, the values were exported to a Microsoft Excel file, and the OD plate was returned to its position on the deck. These diluted samples were used to determine the concentration of glucose and acetate in the culture medium. These investigations were performed automatically after the readings for pH and OD measurement. The additions of the solutions of the enzymatic assays, the addition of the samples, the incubations, and the readings were programmed referring to each manufacturer’s manual for enzymatic determination of either glucose or acetate (see Figs. 2 and 3 ). After the final readings, the OD plate, the glucose plate, and the acetate plate were disposed; new plates were put on the deck; and the tips were cleaned and rinsed. A corresponding washing procedure was developed and verified (details not shown). The combined method was started three times during the daytime. During the night, four pH, four OD, two glucose, and two acetate measurements were conducted autonomously as the result of the looped method.
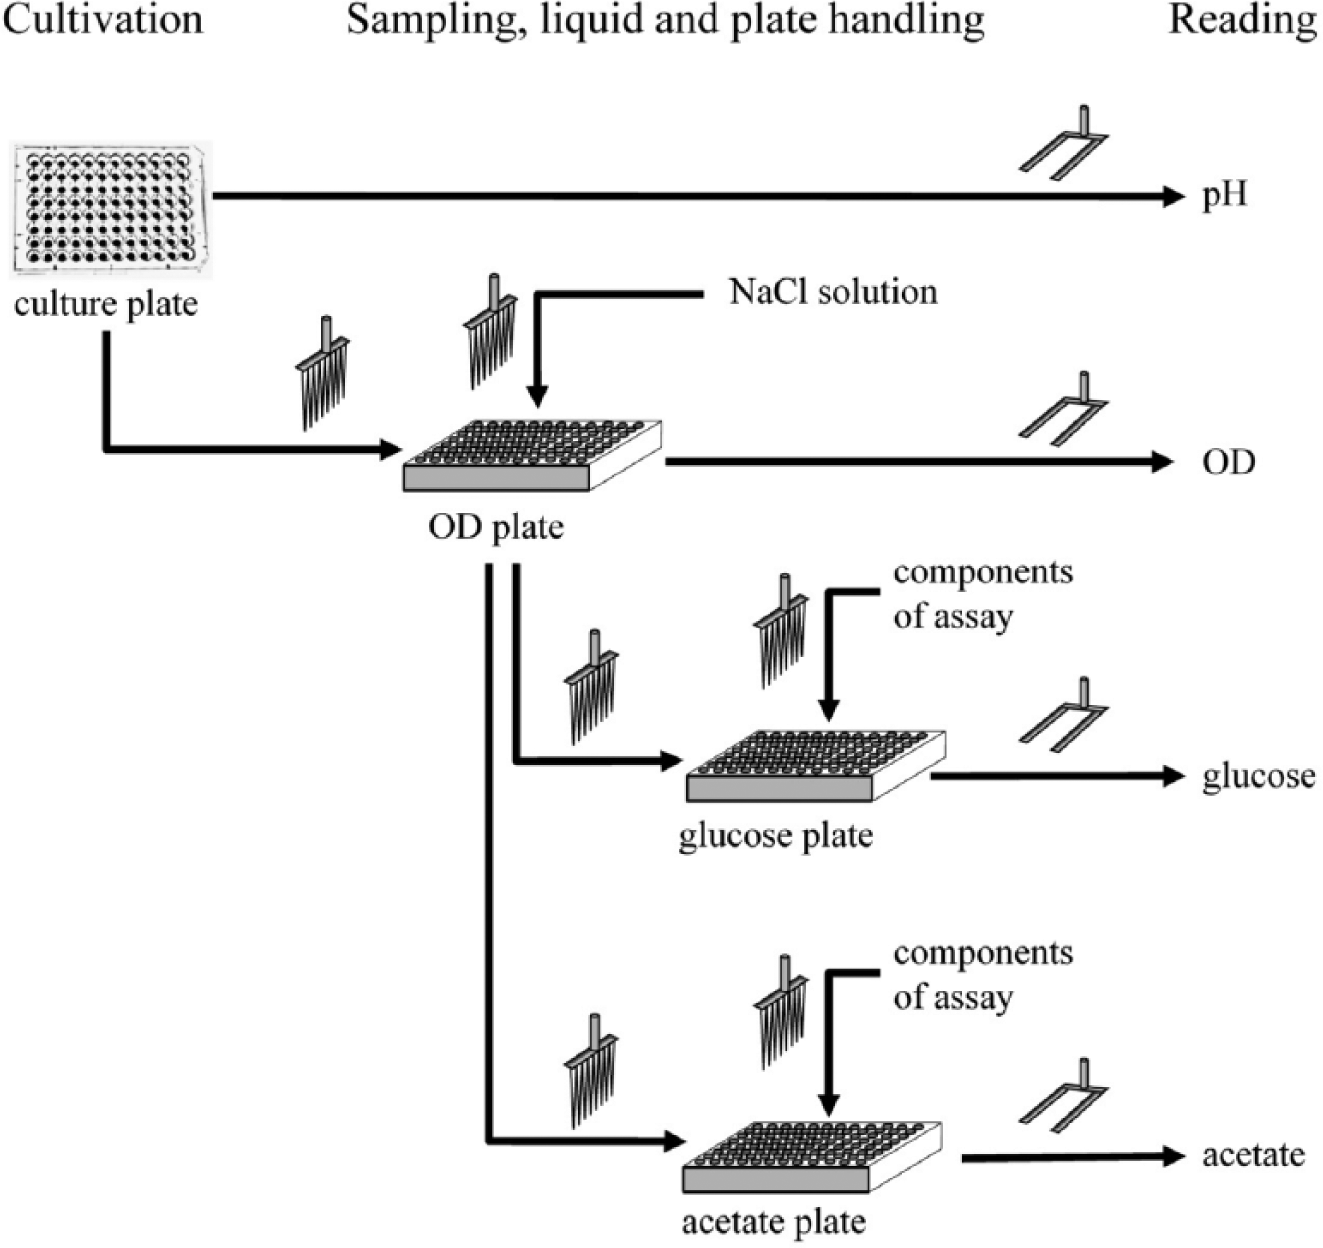
Visualization of plate and liquid handling steps for fully automated process monitoring. The pH is measured directly from the culture plate (Hydroplate HP96U; PreSens Precision Sensing GmbH, Regensburg, Germany). The optical density (OD) is read after sampling from the culture plate. After OD reading, these diluted samples are analyzed for glucose and acetate content. Each arrow summarizes various liquid and plate handling steps, which are also explained in Figure 2 .
Parallel Cultivations at the 200-µL Scale
The outcome of the above-mentioned automation and cultivation approach is exemplarily demonstrated in Figure 4a–i for the cultivation sets C, E, and G, which are explained in Table 1 . The investigations aimed to elucidate the impact of the growth rate and the time point of induction on the formation of a recombinant ADH. Lactose has been demonstrated to be a suitable substitute for isopropyl-β-D-thiogalactoside (IPTG) in order to induce the lac promoter.21,22 If the medium is supplemented with glucose, lactose will be assimilated after the depletion of glucose or at glucose-limiting conditions as a result of catabolite repression. Consequently, the time point of induction is determined by the availability of glucose at the beginning of the cultivations. The growth rate is the result of the concentration of the glucose-releasing biocatalyst (Reagent A).
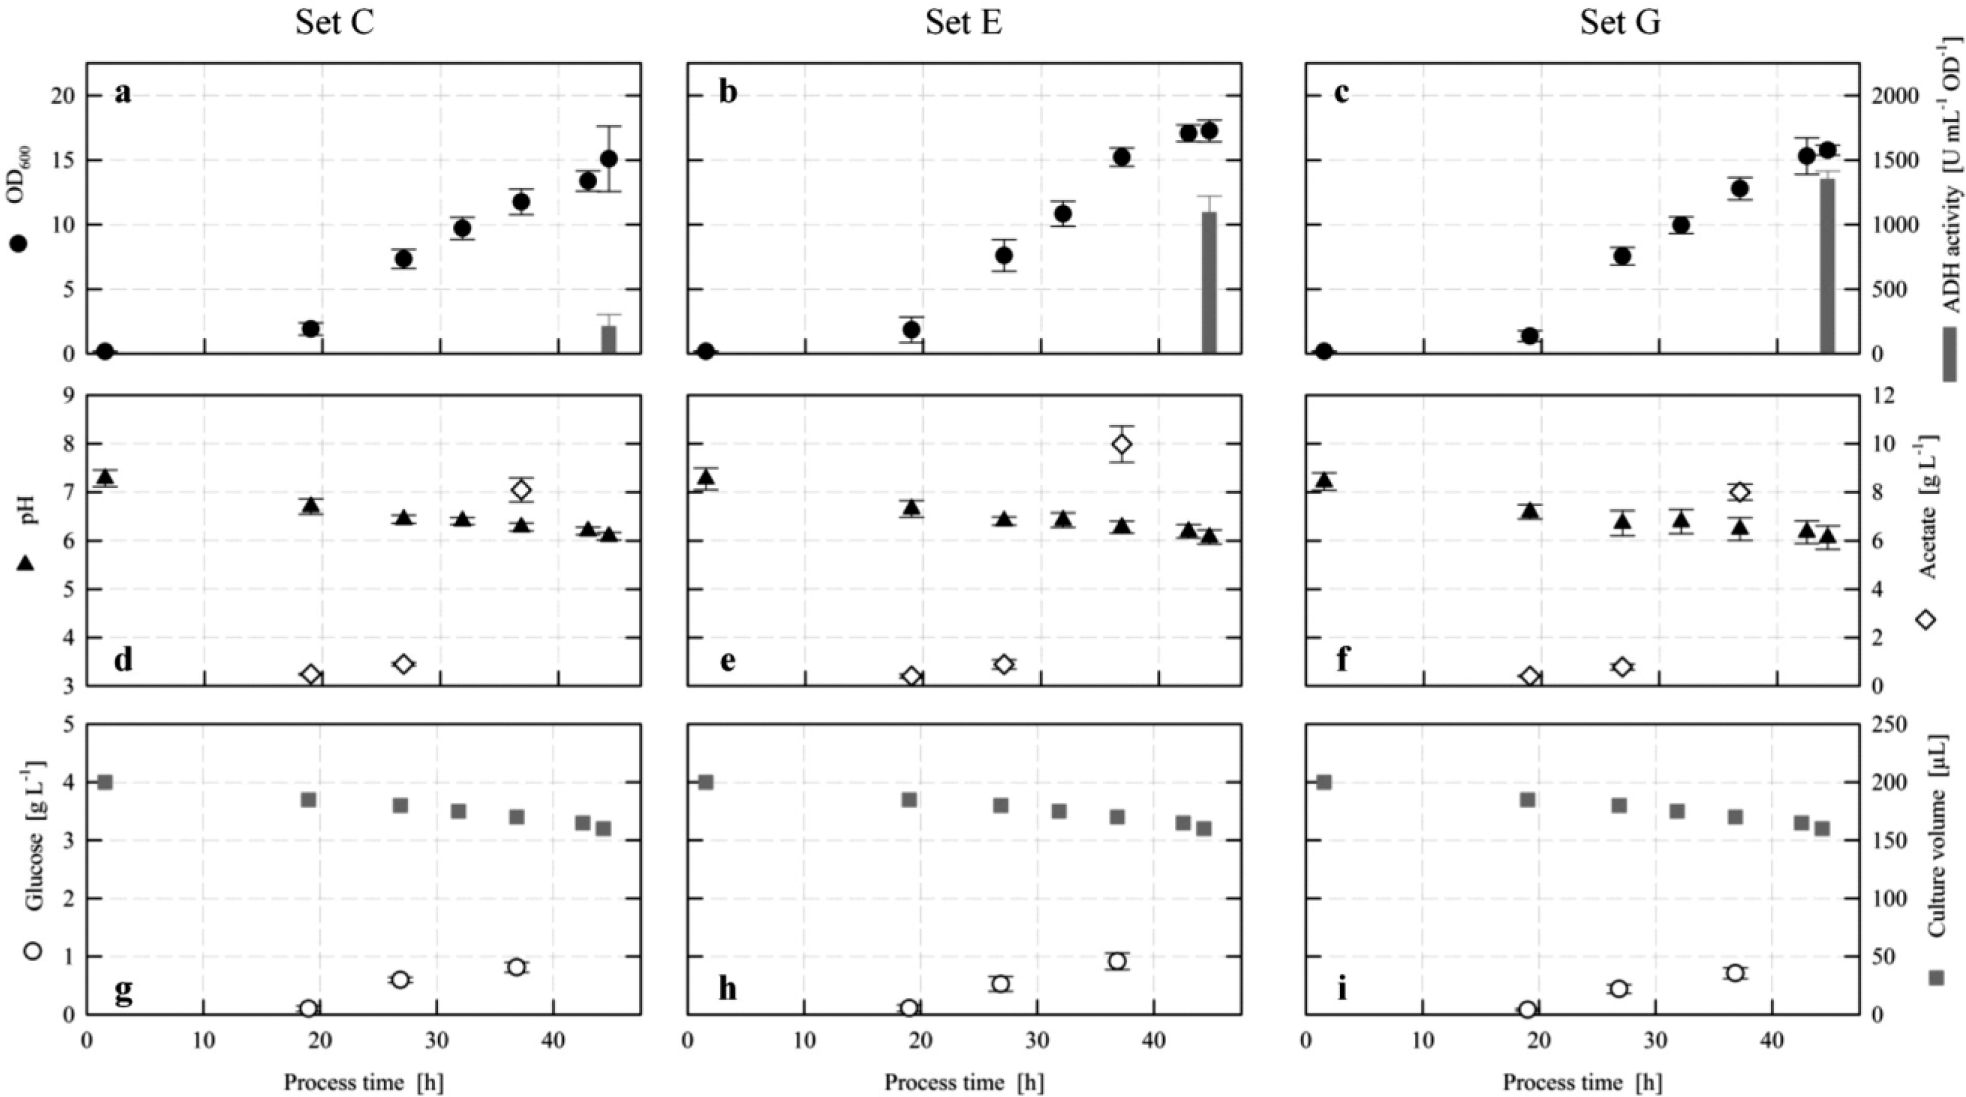
Automated fed-batch cultivations (EnPresso B Defined [Prototype], Biosilta Oy, Oulu, Finland) of a recombinant Escherichia coli RB791 strain in a 96-well HydroPlate HP96U (PreSens Precision Sensing GmbH, Regensburg, Germany) with a starting volume of 200 µL. The cultivation conditions of sets C, E, and G are explained in
Table 1
. Monitoring of (
For cultivation set C ( Fig. 4a,d,g ), the pH and OD measurements (e.g., pH 6.44 ± 0.08 and OD 7.34 ± 0.74 [mean ± standard deviation]) after a 26.9-h cultivation indicate high reproducibility of the four independently run replicates and of the respective analytics. The linear increase of OD implies a constant glucose release from the EnPresso B Defined [Prototype] fed-batch medium. Since the pH does not drop below 6 even after a 44-h cultivation, no overflow metabolism and consequently a limited availability of glucose are assumed. Each of the four independently performed enzymatic assays for the determination of glucose in the culture broth shows a high reproducibility, but the time course does not support the conclusion of carbon-limited growth conditions. This apparent contradiction can be explained by the fact that a highly diluted sample of the culture broth has been used for the measurement without considering the absorbance of the Escherichia coli cells during calculation. Thus, for future measurements, our procedure is improved by introducing a blank measurement before the incubation of the enzymatic assay. This is an easy-to-access means to enable reliable determination of glucose while tackling some challenges of miniaturization and automation (e.g., small cultivation volumes and consequently small sample volumes). As this blank measurement is already part of the manufacturer’s manual for the enzymatic determination of acetate, the absorbance of the cells has been considered, yielding high reproducibility and reliability. The relative error of the acetate measurements after a 37-h cultivation is only 6.1% (8.09 ± 0.49 g L–1). Although small sample volumes are disadvantageous as discussed above, they offer the opportunity that sampling and monitoring may be executed frequently. Here, less than 25% of the initial culture volume was used for sampling. In addition, comparable cultivation conditions in terms of aeration and evaporation were provided.
The above-mentioned attributes of the automated cultivation and monitoring approach also apply to the other investigations on the same plate. They are either displayed in
Figure 4
for the cultivation sets E and G or provided as supplemental material for sets A, B, D, F, and H (see
The cultivation sets C, E, and G have a concentration of Reagent A of 0.6 U L–1 in common. From the data presented in Figure 4a–i , it can be concluded that different amounts of initial glucose do not affect the general growth behavior and physiology of this recombinant E. coli strain. But the specific ADH activity was higher if the medium was supplemented with glucose. It is assumed that the induction by lactose uptake occurs after the initial glucose is consumed and if glucose is available at limiting conditions. This would mean that the cells under conditions of cultivation sets E and G grew longer on glucose compared with the ones under the conditions of cultivation set C. The initial glucose concentration (0.5 or 1.0 g L–1) would theoretically yield a surplus of OD between 0.75 and 1.5, respectively, which cannot be seen from our data. Since we have not monitored the time course of lactose, we cannot state the time point of induction with respect to a certain process time, and we cannot clarify whether lactose has been solely used for induction in cultivation set C or has also been co-metabolized to generate biomass. In a bioreactor, Mayer et al. 23 monitored the time courses of glucose and lactose for the same recombinant strain, which we describe here in a lactose autoinduction system supplemented with 0.5 g L–1 of glucose. Induction of the ADH occurred when the concentration of glucose decreased below 0.2 g L–1. This investigation supports the assumption that induction of the cells in cultivation sets E and G occurred later compared with cultivation set C.
Although the specific induction dynamics cannot be deducted from 96-mircowell plate cultivations, these cultures offer a good basis for medium and parameter optimization. In cases where a deeper understanding of the induction kinetics is necessary, 24-well plate systems with online monitoring of the dissolved oxygen tension and the pH are available. 24
Increasing the Content of Information by Automation
By our approach of miniaturizing and automating some analytical procedures, we succeeded in increasing the content of information. We are not convinced that one researcher could have run 32 commonly used shake flasks in parallel while sampling frequently and analyzing the samples simultaneously. With the help of our robotic platform, the higher content of information derived from investigations at the microliter scale is based on parallelizing and miniaturizing cultivation procedures, performing replicate cultivations (here four independent replicates per cultivation set), monitoring several process parameters at the same time, and frequent sampling. This setup addresses the reliability of the values, the physiological interactions, and insights into the time course of process parameters. A linear growth pattern (see Fig. 4a ) is expected in fed-batch cultivations with constant feed rate, which is difficult to demonstrate with single or end-point measurements, which are typically applied for the analysis of microwell plate cultures. Our approach even allows directly applying mathematical growth models and thus interconnecting screening and process optimization. The number of cultivations may be extended to 96 on the same plate without changing the robotic program. If standards should be measured on each glucose or acetate plate along with the sample measurements, the number of cultivations should be reduced correspondingly. As the incubator can be used for up to eight microwell plates simultaneously, even parallel cultivation of several 96-microwell plates is an option. As one cycle of pH, OD, glucose, and acetate measurement takes about 45 min, two microwell plates could be monitored with a minimum sampling interval of 2 h. Correspondingly, three microwell plates could be monitored at a minimum sampling interval of 3 h, and so on. Applying our procedure to multiple plates would mean only minor changes in the programming. With respect to the frequency of sampling, we can hardly forecast whether two or three plates in parallel would already exhaust the capacity of the positions on the deck as the amount of microwell plates for the measurements, pipette tips, and containers for the reagents increases with the number of culture plates and has to be stored on the deck. Thus, precise warehousing is an important issue to enable automated sampling and monitoring.
Our generic approach is not dedicated to a certain cultivation system or a certain analytical assay. In 2007, Knorr et al. 9 demonstrated the scale-down of an industrial riboflavin production process to the milliliter scale and established automated at-line analytics to monitor the pH, OD, and concentration of glucose in the medium. As the volume of the culture was 50 times higher compared with our study, sampling was not limited to some microliters. In this context, Doig et al. 25 termed and described a sacrificial well strategy for sampling and monitoring. Four replicates were harvested and analyzed after different durations of incubation, yielding a quasi-time course of a bioconversion. This approach was applied to automated investigations at the microliter scale by Baboo et al. 26 The authors made use of a liquid handling system to prepare the plate, inoculate, add solutions, and sample. The cultivations were carried out in 96-well deep square plates with a filling volume of 1 mL, and OD reading was conducted in 96-well microplates. The same approach was applied by Rohe et al. 12 when combining a BioLector system with a liquid handling system. The cultivations were performed in 1 mL medium in 48-well microplates, and replicates were harvested after different cultivation times to determine the cellular dry weight and the activity of the target protein. The support of the liquid handling system was limited to adding liquid to or removing liquid from the cultivation broth. Most of the analytical investigations relied on the online fluorescence and scattered light measurements of the BioLector system as described earlier. 27 This automation approach was similar to a previous one. 11 We are convinced that a process engineer can take even more advantage of a liquid handling system when enabling it to perform analytical determinations autonomously. Once the assay is established, scaled down, and automated, these kinds of platform technologies give access to various investigations and to samples derived from various cultivation systems. We have also scaled down an enzymatic assay for the determination of ethanol in the culture broth and made it ready for automation (details not shown). After automation, we can also apply our platform to investigations with yeasts (e.g., Saccharomyces cerevisiae).
In conclusion, we scaled down analytical assays to the microliter scale and created automated procedures to determine the OD, pH, and concentrations of glucose and acetate in cultivations in as little as 200 µL of volume. By this approach, we managed to increase the information content of cultivations in 96-well microplates in terms of reliability, amount of process parameters monitored, and quasi-continuous data sets. We moved the microwell plate to a more suitable tool for parallel and more efficient consistent bioprocess development by taking advantage of the opportunities of a liquid handling system. To extend the capability of our platform for bioprocess development, we are broadening our portfolio of analytics by integrating a flow cytometer. In addition, we are developing procedures for automated downstream processing and for automated data handling.
Footnotes
Acknowledgements
We appreciate technical and material support from BioSilta Ltd. (Cambridge, UK) and PreSens Precision Sensing GmbH (Regensburg, Germany) as well as technical support from Felix Pfisterer and Markus Föllmer.
Declaration of Conflicting Interests
The authors declared no potential conflicts of interest with respect to the research, authorship, and/or publication of this article.
Funding
The authors disclosed receipt of the following financial support for the research, authorship, and/or publication of this article: The authors acknowledge financial support by the German Federal Ministry of Education and Research (BMBF) within the Framework Concept “Research for Tomorrow’s Production” (project no. 02PJ1150, AUTOBIO project), which is managed by the Project Management Agency Karlsruhe (PTKA).
References
Supplementary Material
Please find the following supplemental material available below.
For Open Access articles published under a Creative Commons License, all supplemental material carries the same license as the article it is associated with.
For non-Open Access articles published, all supplemental material carries a non-exclusive license, and permission requests for re-use of supplemental material or any part of supplemental material shall be sent directly to the copyright owner as specified in the copyright notice associated with the article.