
Abstract
Accurate measurement of drug–target interactions in vivo is critical for both preclinical development and translation to clinical studies, yet many assays rely on indirect measures such as biomarkers associated with target activity. Activity-based protein profiling (ABPP) is a direct method of quantifying enzyme activity using active site-targeted small-molecule covalent probes that selectively label active but not inhibitor-bound enzymes. Probe-labeled enzymes in complex proteomes are separated by polyacrylamide gel electrophoresis and quantified by fluorescence imaging. To accelerate workflows and avoid imaging artifacts that make conventional gels challenging to quantify, we adapted protocols for a commercial LabChip GXII microfluidic instrument to permit electrophoretic separation of probe-labeled proteins in tissue lysates and plasma, and quantification of fluorescence (probe/protein labeling ratio of 1:1). Electrophoretic separation on chips occurred in 40 s per sample, and instrument software automatically identified and quantified peaks, resulting in an overall time savings of 3–5 h per 96-well sample plate. Calculated percent inhibition was not significantly different between the two formats. Chip performance was consistent between chips and sample replicates. Conventional gel imaging was more sensitive but required five times higher sample volume than microfluidic chips. Microfluidic chips produced results comparable to those of gels but with much lower sample consumption, facilitating assay miniaturization for scarce biological samples. The time savings afforded by microfluidic electrophoresis and automatic quantification has allowed us to incorporate microfluidic ABPP early in the drug discovery workflow, enabling routine assessments of tissue distribution and engagement of targets and off-targets in vivo.
Introduction
A crucial component of a translational drug discovery strategy is the ability to measure drug molecule engagement with the intended macromolecular target at the site of action in vivo; this assay provides critical information that links in vitro efficacy with pharmacological activity in preclinical models, ultimately enabling correlation with clinical endpoints. 1 In preclinical development, measuring target engagement in vivo answers essential questions about the ability of the drug to reach the target tissue in a sufficient concentration to engage the target, residence time at the target, and how target occupancy relates to efficacy readouts. 2 Despite the clear importance of target engagement assays, the lack of direct assays for some targets can force clinical programs to proceed with indirect and possibly misleading measures associated with target activity, or perhaps even without proximal biomarkers of any kind. For example, recent reviews of clinical studies found that a substantial proportion of efficacy failures in phase II (43% for Pfizer 3 and 21% for AstraZeneca 4 ) were in programs lacking target engagement assays, leaving uncertainty as to compound exposure and target validity in the disease indication. Eliminating such inefficiencies and obstacles to future progress presents a major challenge for the pharmaceutical industry.
Activity-based protein profiling (ABPP) has been proposed as a novel approach to measuring target engagement that is broadly applicable for many enzyme classes. 5 This technique relies on the use of active site-directed small-molecule probes designed to bind to a class of enzymes based on distinctive features of their catalytic mechanism. For example, the serine hydrolase class of enzymes shares a catalytic mechanism in which the enzyme’s conserved serine nucleophile attacks a substrate to form an acyl-enzyme intermediate; fluorophosphonate ABPP probes exploit this mechanism to broadly label serine hydrolases by covalent modification of the active site serine. 6 Thus, ABPP probes covalently label only catalytically active enzymes, whereas inhibitor-bound enzymes or zymogens are not labeled.
Although the method is most straightforward for the detection of irreversible inhibition, ABPP has also been adapted for the detection of target engagement by reversible inhibitors in vivo.7,8 ABPP probes have been developed for numerous enzyme classes, including cysteine proteases, kinases, tyrosine phosphatases, histone deacetylases, glycosidases, and cytochrome P450s.9–13 The schematic in Figure 1 describes the general ABPP workflow for labeling; notably, ABPP probes are well suited to ex vivo applications because they specifically label the intended class of enzymes even in complex proteomic mixtures (e.g., tissue lysates, plasma). Many probes also have the ability to label multiple proteins, allowing simultaneous detection of both targets and off-targets for the evaluation of selectivity. Labeling can be visualized by conjugation of the reactive portion of the probe with a reporter tag, such as biotin or a fluorescent dye. However, the complex labeled mixture must be electrophoretically separated and gels must be quantified to determine the fluorescence of individual protein bands. Conventional methods (sodium dodecyl sulfate–polyacrylamide gel electrophoresis [SDS-PAGE], gel imaging, ImageJ) are tedious, time-consuming, susceptible to variability between users and gels, and challenging at scale in a screening setting.
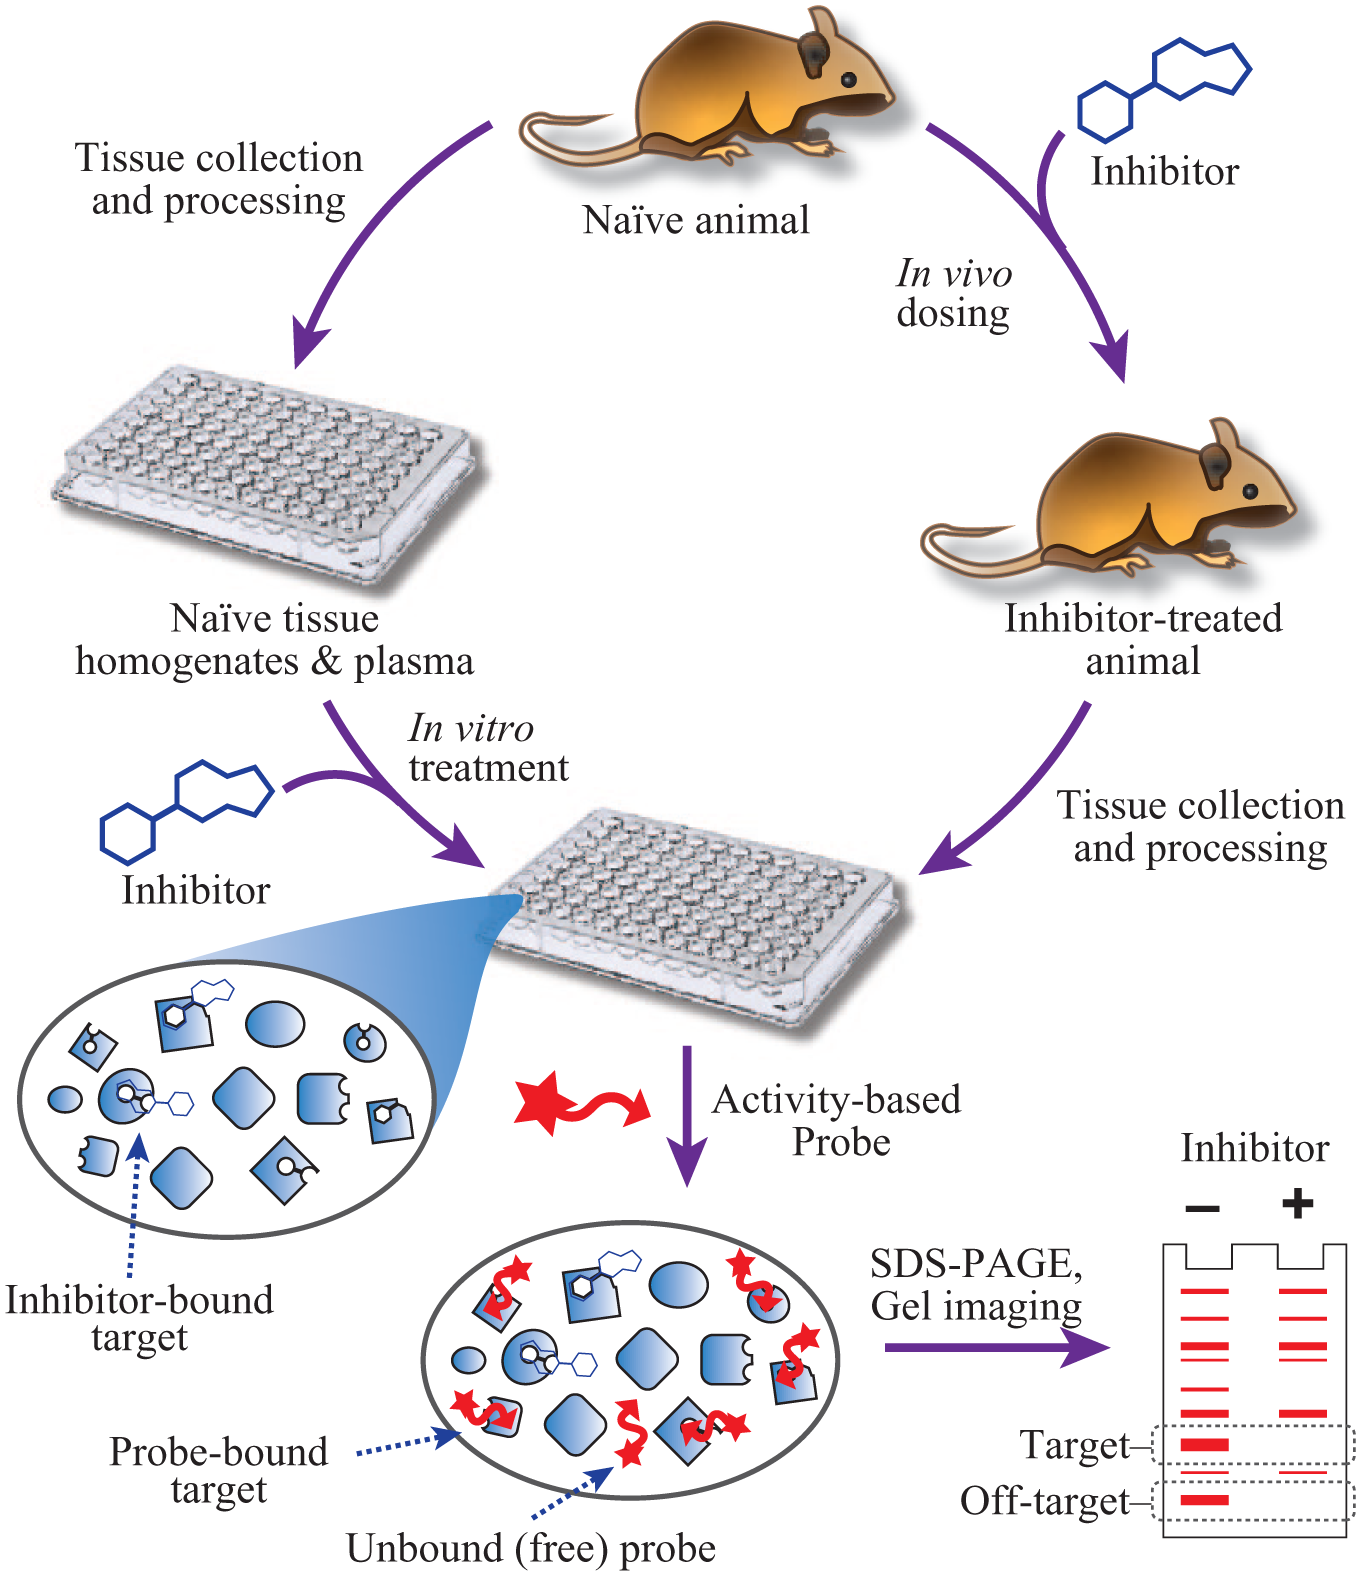
Schematic of ABPP. Tissue lysates or plasma may originate from animals dosed in vivo with inhibitors or vehicle, or from naïve animals for in vitro inhibitor treatment. For ABPP, samples are incubated with a fluorescently labeled small-molecule probe designed to target and covalently label a specific class of enzymes with related active site reactivity. Active enzymes are labeled, while inhibitor-bound enzymes are not. The complex mixture of labeled enzymes, unlabeled enzymes, and free probe is then separated electrophoretically to allow the fluorescent detection of target and off-target enzyme activity.
To address these issues, we explored microfluidic gel electrophoresis as an alternative, using a commercially available LabChip GXII instrument. This method, adapted from techniques described by Bousse and coworkers, 14 uses gel-filled microfluidic chips, in which microscale dispersion characteristics allow electrophoresis of proteins to occur in approximately 40 s, compared with several hours for conventional macroscale gels. Samples are introduced to the microchannel via a fused silica capillary bonded to the chip, allowing automated sampling from a microplate through a robotic system housed within the instrument.15,16 Electrodes applied to connected side channels create a voltage gradient for electrophoresis, followed by laser detection of fluorescence ( Fig. 2 ). Proteins are sized by comparison to a ladder sampled periodically throughout a plate, and each sample is aligned to the ladder by a marker dye acting as an internal standard injected with each plate well. Commercial kits for this system are designed to fluorescently label all proteins in a sample with a very high degree of labeling, functionally analogous to Coomassie or silver stain gels. In contrast, the enzymes targeted by ABPP constitute a small fraction of the total proteins in a sample, and each enzyme is labeled with only one probe-dye molecule, resulting in greatly diminished signal intensity.
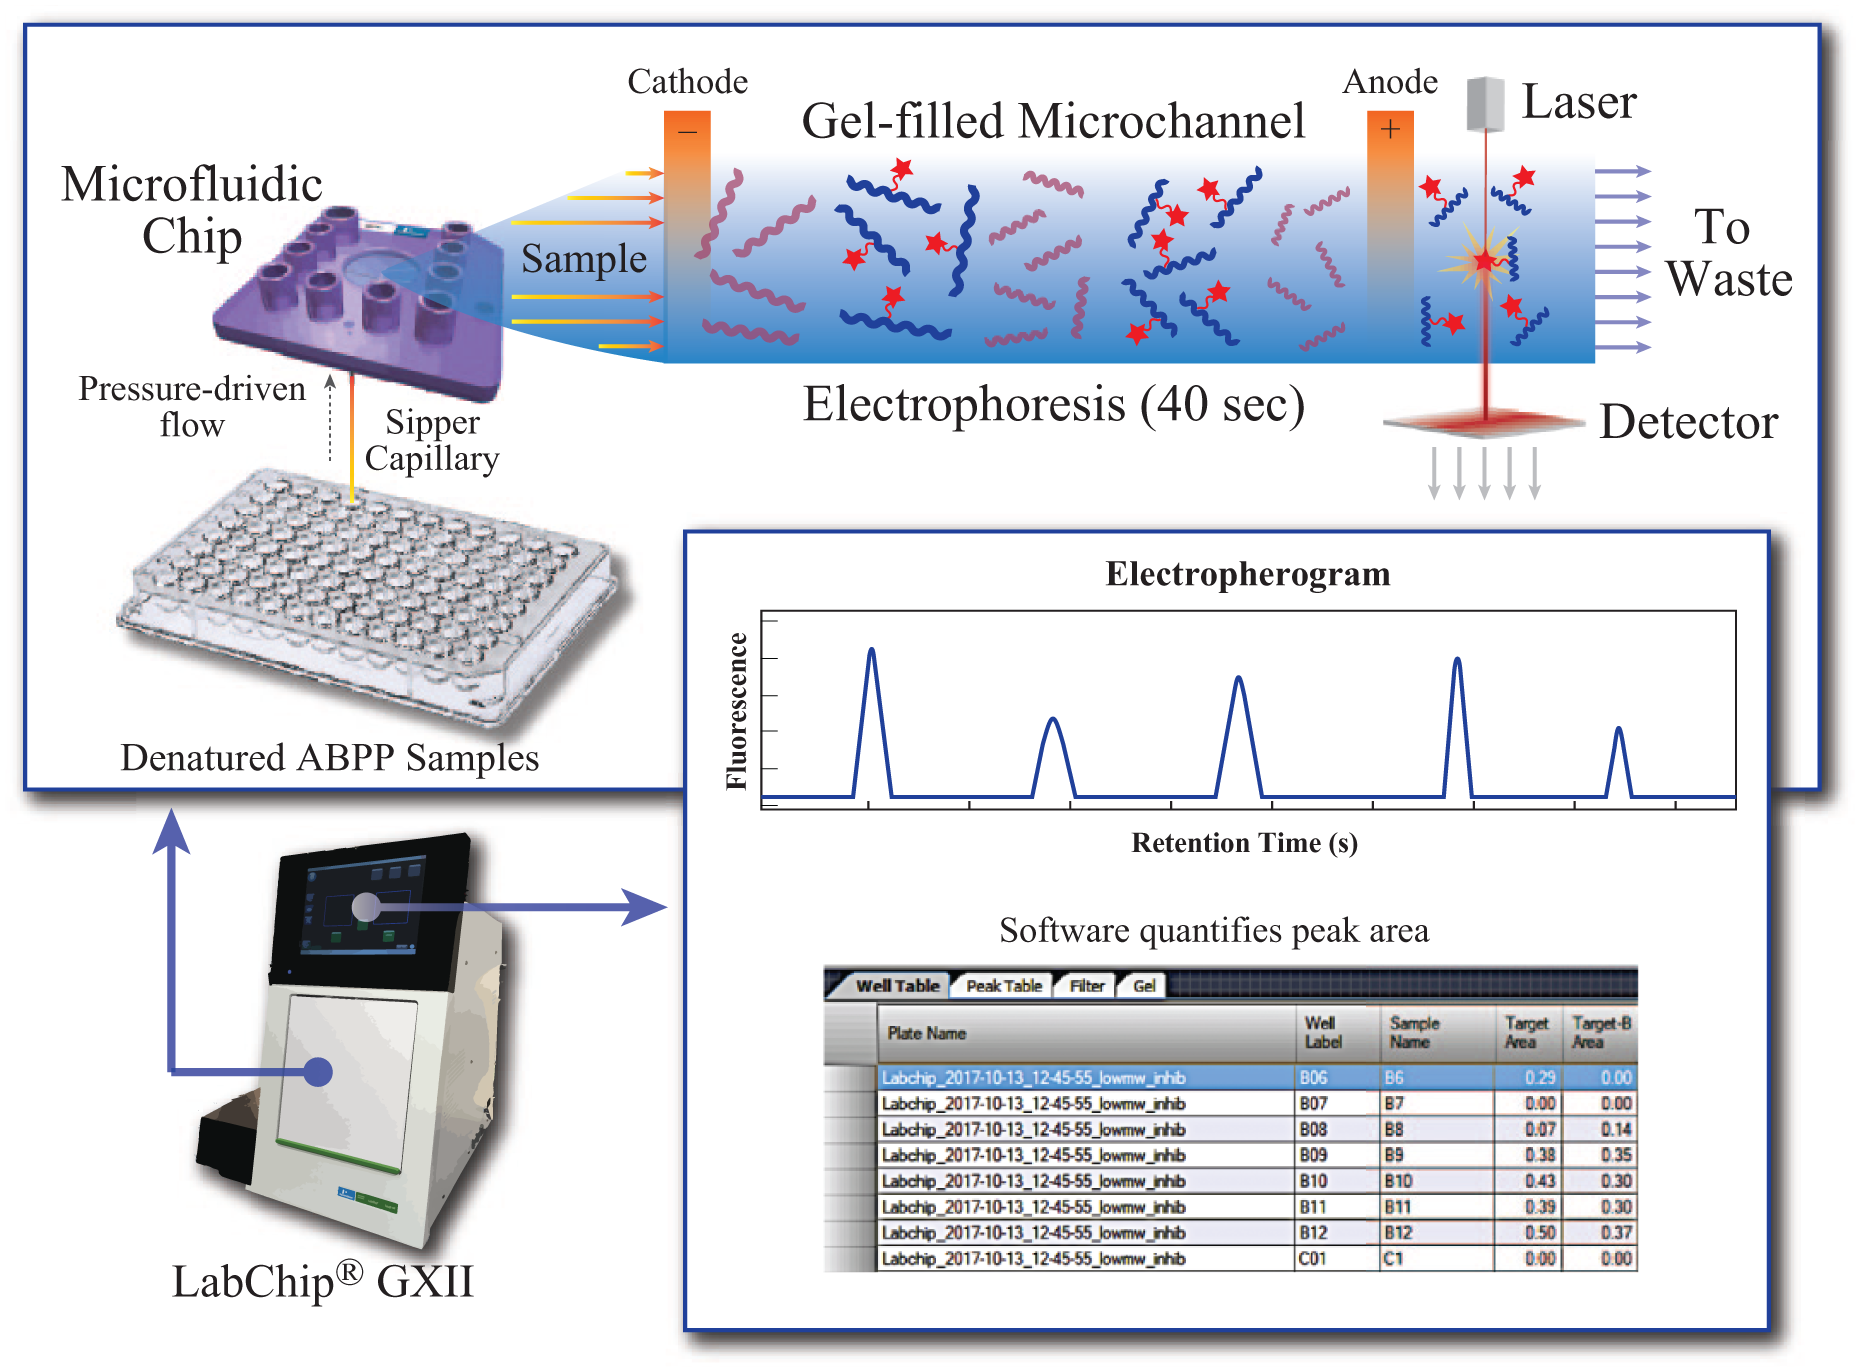
Schematic of microfluidic gel electrophoresis of ABPP samples. Denatured samples in a 96-well plate are introduced sequentially to a microfluidic chip through a sipper capillary via pressure-driven flow. On the chip, the sample plug enters a gel-filled channel, where an electric field is applied to allow electrophoretic separation by size. Laser detection of fluorescently labeled proteins occurs as separated proteins pass the detector. Data are collected as electropherograms of fluorescence as a function of time. The analysis software automatically identifies peaks and calculates peak areas assigned to each sample well, enabling relative quantification of enzyme activity in inhibitor-treated samples compared with vehicle.
Here, we adapted microfluidic chip protocols for an ABPP workflow to detect engagement of a serine hydrolase target, monoacylglycerol lipase (MGLL), in support of a drug discovery and development program that has now progressed to clinical testing.17,18 Conditions were optimized to separate proteins in crude tissue lysates and plasma derived from in vivo dosing experiments. Further, we adapted analysis algorithms in the LabChip Reviewer software to enable automated quantification of weak fluorescence from separated proteins labeled by ABPP probes, and compared the resulting calculations of target engagement with conventional gel quantification.
Materials and Methods
Materials and Tissue Collection
For in vitro assays, probes and inhibitors were prepared in DMSO (VWR, Radnor, PA). Probes HT-0119 and JW91220 were synthesized essentially as previously described, except using Cy5 as the fluorophore instead of Bodipy. Details of the synthetic procedures are described in the Supplemental Materials. All animal experiments were performed in accordance with guidelines outlined by the Guide for the Care and Use of Laboratory Animals and the Animal Welfare Act, and approved by the Explora Biolabs Institutional Animal Care and Use Committee. Animals were maintained under a 12/12 h light/dark cycle and allowed free access to food and water throughout all experiments. For in vivo dosing, inhibitors were prepared daily in either 0.5% methylcellulose (w/v), 7:2:1 PEG400/ethanol/phosphate-buffered saline (PBS) (v/v/v), 0.9% saline, or 1% Tween 80/99% saline (v/v). Mouse plasma was collected by terminal cardiac bleeds and blood was placed into BD Microtainers (Becton, Dickinson, and Company, Franklin Lakes, NJ) containing lithium heparin and placed on ice. Blood was centrifuged for 2 min at 9000g and plasma was transferred to a new tube and frozen at −80 °C. For tissue collection, animals were euthanized by isoflurane overdose and decapitation and tissues were collected and snap frozen in liquid nitrogen. Mouse kidney and brain lysates were prepared in 10 mM HEPES, pH 7, by homogenization using 5 mm stainless steel beads (Qiagen, Hilden, Germany) in the TissueLyser II (Qiagen) for 60 s at 30 Hz. Samples were transferred to new tubes and then lysed by sonication on a Branson Sonifier 250 (Branson Ultrasonics, Danbury, CT). Samples were immediately clarified by centrifuging at 4 °C for 10 min at 1000g with collection of the supernatant in a fresh tube.
ABPP Assay
Tissue collection and ABPP probe labeling methods suitable for the detection of irreversible inhibition were used. Brain or kidney lysates (5 mg/mL, from either dosed animals for in vivo assays or naïve tissue lysates preincubated with inhibitors/vehicle at 37 °C for 30 min for in vitro assays) were mixed with 3 μM JW912-Cy5 and incubated for 30 min at room temperature. Mouse plasma from dosed or naïve animals was first pretreated with a broad-spectrum carboxylesterase/butyrylcholinesterase inhibitor and a phospholipase A2 group VII inhibitor at 37 °C for 30 min to irreversibly inhibit and prevent probe labeling of proteins that would otherwise obscure the desired signal on gels and/or LabChip format. Aliquots were stored at −80 °C. Thawed plasma was diluted 1:25 in 1× Dulbecco’s PBS (~2 mg/mL final concentration), with ABPP labeling by 2 μM HT-01-Cy5 for 30 min at room temperature. For in vitro experiments, diluted plasma was incubated for 30 min at 37 °C with inhibitors or vehicle prior to labeling.
SDS-PAGE
ABPP probe labeling reactions in 25 μL samples were stopped by addition of 8 μL of 4× gel loading buffer (final concentrations 250 mM Tris, pH 6.8, 40% glycerol [v/v], 8% SDS [w/v], 1.3 M beta-mercaptoethanol (BME), 0.4% bromophenol blue [w/v]). Custom 10% acrylamide gels measuring 17 × 24 cm (width × height) were prepared in Tris-HCl buffer with 4% acrylamide stacking gel. Gels were run in Tris-glycine-SDS running buffer (National Diagnostics, Atlanta, GA) at a constant 300 V for 850 Volt-hours. Fluorescence was imaged in-gel using a Bio-Rad ChemiDoc XRS fluorescence imager (Bio-Rad Laboratories, Hercules, CA), with fluorescence shown in grayscale. Band fluorescence was quantified by densitometric analysis with ImageJ software v1.5 (NIH, Bethesda, MD). Briefly, lane profile histograms were generated and peaks were integrated for bands corresponding to enzymes of interest. 21
LabChip Assays
Assays were carried out using either the High Resolution LabChip (PerkinElmer, Waltham, MA) or the Protein Express Assay LabChip (PerkinElmer). Chips were loaded with gel and marker dye from the Protein Pico Assay Reagent Kit (PerkinElmer). Ladder from the Pico Assay kit was prelabeled with dye from the kit following the manufacturer’s instructions; aliquots were stored at −20 °C before use. To prepare samples for the low-molecular-weight (LMW) assay, 5 μL of ABPP assay samples in a 96-well PCR plate (Bio-Rad) were mixed with 12.5 μL of Protein Express Sample Buffer (PerkinElmer) prepared daily with 3.5% (v/v) BME (Fisher Scientific, Waltham, MA) and denatured at 70 °C for 10 min, followed by the addition of 20 μL of MilliQ water. For the high-molecular-weight (HMW) assay, plasma samples were not limiting so a more streamlined protocol was used with 12.5 μL of ABPP samples mixed with 17.5 μL of sample buffer/BME. No water was added after denaturation. For both assays, plates were spun at 1500g for 3 min to remove bubbles before loading on the LabChip GXII Touch HT instrument (PerkinElmer). Voltage and pressure scripts for either the LMW assay or the Pico 200 Assay (HMW) were run. Peak areas were quantified using the LabChip Reviewer software (PerkinElmer), as described in detail below.
Results
Low-Molecular-Weight Assay Development
Our initial aim was to develop a microfluidic ABPP assay to detect activity of a 33 kDa target enzyme, MGLL, a member of the serine hydrolase class of enzymes, which runs as a pair of bands at 33 and 35 kDa in brain and a single band at 33 kDa in kidney. To minimize signal overlap with comigrating labeled proteins, we prepared a tailored probe based on JW912, 20 which exhibits high specificity for MGLL over other serine hydrolases. This new probe, here named JW912-Cy5, features a cyanine-5 (Cy5) tag to allow far-red fluorescence detection by the LabChip GXII laser detection system (excitation 635 nm, emission 700 nm).
The manufacturer, PerkinElmer, provides several different chip designs and kits containing different proprietary gels, as well as instrument operating scripts preset to unspecified voltages and pressures; because none of the commercial assays were designed for ABPP analysis of tissue lysates, we tried all possible combinations of gels, chips, and running programs to choose the best combination for our application (data not shown). MGLL was best visualized using a high-resolution chip with gel from the Pico Assay kit and voltage/pressure settings from the manufacturer’s LMW program. A large initial system peak was visible in all ABPP samples, which may be attributed to free probe and/or labeling of unresolved small-molecular-weight components in a matrix-specific manner (brain samples consistently had a much broader/taller system peak than kidney). We found that preparing tissue lysates in 10 mM HEPES, pH 7, rather than 1× Dulbecco’s PBS resulted in better separation of MGLL from the system peak, as well as better resolution of the 33 and 35 kDa MGLL peaks in brain (data not shown), consistent with improved field-amplified sample stacking in the lower-conductivity buffer. 22
ABPP conditions were optimized to detect MGLL peaks on the microfluidic chip by simultaneous titration of tissue lysates and JW912-Cy5 probe concentration, as shown in Figure 3A . Although peak areas rose as tissue lysate concentration increased, we chose not to exceed 5 mg/mL in order to ensure reproducible pipetting; more concentrated samples were highly viscous and less amenable to automated liquid handling. Similarly, we chose a final concentration of 3 μM probe out of practical considerations, because it produced acceptable peak areas while still allowing us to conserve reagent.
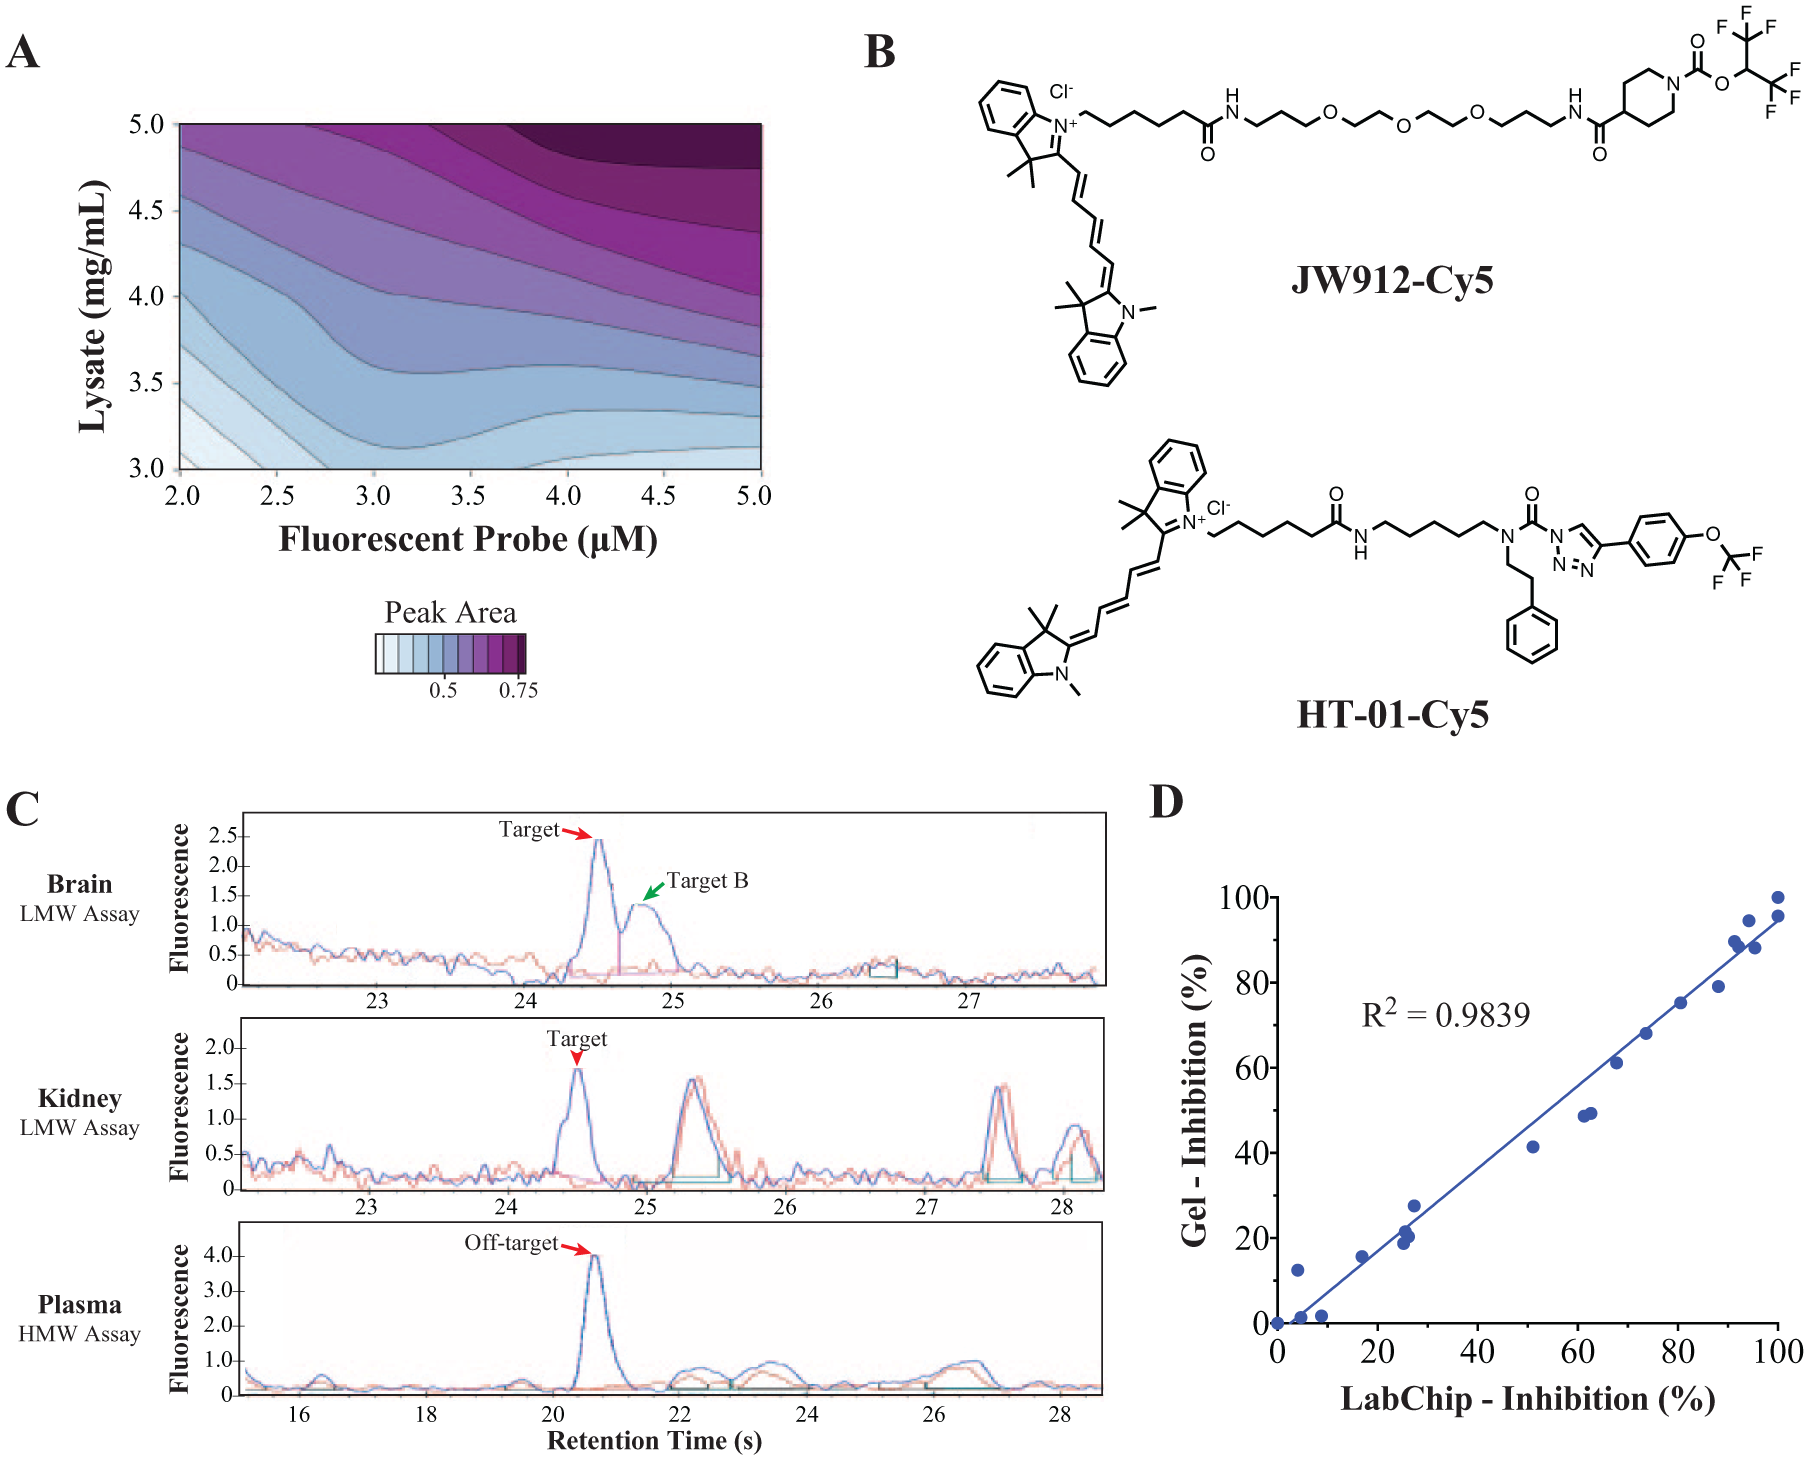
Development and in vitro validation of microfluidic ABPP assays for low- and high-molecular-weight enzymes. (
High-Molecular-Weight Assay Development
A similar approach was used to optimize conditions to detect a heavily glycosylated serine hydrolase off-target enzyme, which runs at an apparent molecular weight of 89 kDa on microfluidic chips and at about 70 kDa in conventional SDS-PAGE. For this enzyme, optimal peaks were obtained using the Protein Express chip, Pico Assay gel, and Pico Assay program settings for voltage and pressure. A robust peak was observed in mouse plasma diluted 1:25 in 1× PBS (~2 mg/mL final concentration), with ABPP labeling by 2 μM probe HT-01-Cy5, a Cy5 analog of HT-01-Bodipy that has been previously described ( Fig. 3B ). 19 Example electropherograms for both the LMW and HMW assays are shown in Figure 3C .
Data Analysis Algorithms
Default analysis settings in the LabChip Reviewer software were designed for commercial assay kits with a very high degree of labeling (multiple fluorophore molecules for each protein molecule), resulting in strong signals for protein peaks. In our application, a maximum of one probe molecule binds to the active site of each enzyme, resulting in a relatively weak fluorescent signal. In addition, we are limited by endogenous expression of our enzymes of interest in the context of native proteomes; overexpressed recombinant enzymes would produce far greater signals at much lower total protein concentrations. In initial testing using default settings, the analysis software often failed to find peaks or drew the baseline incorrectly, resulting in inaccurate peak areas. To overcome these challenges, we adjusted the peak finding and baseline modeling algorithms to enable reliable identification and quantification of our target and off-target signal peaks.
Raw data smoothing beyond the default setting was needed for robust data analysis in the HMW assay; high-frequency noise was removed by increasing the filter width to 1 s, which defines the range of data for local weighted averaging using a Savitsky–Golay convolution kernel. 23 Instead of the default spline fit, a rolling ball algorithm 24 was chosen for the baseline; this method can be visualized as a ball rolling beneath the curve, creating segments where it contacts the baseline. The baseline is then modeled with a polynomial fit connecting the segments, resulting in further smoothing of signal. For both assays, a rolling ball with a time diameter of 10 s and signal diameter of 100 RFU worked best to model the baseline. To enable peak detection, we adjusted the minimum peak height to 0.2 RFU for the HMW assay and 0.1 RFU for the LMW assay. The software determines peak start and end points using a “slope threshold”; the start of a peak is assigned when the local derivative of the curve increases above the threshold, and the end is assigned at the first point where the negative slope on the tail of the peak falls below the threshold. 25 For our samples, slope thresholds of 0.25 RFU/s in the HMW assay and 5 RFU/s in the LMW assay resulted in robust peak finding. Due to the arbitrary nature of fluorescence units, it should be noted that these settings might require adjustment on different instruments or for different assay targets.
Optimal baseline modeling and background subtraction algorithms depend on peak shapes and background noise relative to signal in the data being analyzed, and suboptimal settings can result in artificial peak flattening or introduction of other artifacts. 26 Thus, settings that appeared optimal by visual inspection were validated by comparison of quantification performance on chips to that on gel imaging (ImageJ), as described in detail below. Expected peaks were entered in the software as molecular weights with windows for detection (e.g., 89 kDa ± 20% in the HMW assay, 33.5 kDa ± 10% and 35.5 kDa ± 5% for the MGLL peaks in the LMW assay) and were automatically labeled on electropherograms as inverted triangles with text labels (e.g., “Target,” “Off-target”; Fig. 3C ). Although other off-target peaks are visible in the electropherograms, we did not confirm their identities and so did not quantify them as part of the assay validation efforts.
In Vitro Assay Validation
Microfluidic assays were validated using the in vitro ABPP method outlined in Figure 1 . Naïve samples were incubated ex vivo with inhibitors or vehicle, followed by probe labeling and denaturation. Microfluidic chips required a minimum of 5 μL of sample volume in plates, compared with 25 μL for gels, so samples were divided and run in parallel on microfluidic chips and gels, and the percent inhibition of targets or off-targets was calculated from the reduction of band fluorescence (gels) or peak area (chips) in inhibitor-treated samples relative to vehicle controls. Gel images were analyzed manually using ImageJ software, while the LabChip Reviewer software automatically found peaks and determined peak areas for microfluidic data. Representative results from the HMW assay are shown in Figure 3D , demonstrating the high correlation of percent inhibition values between the two formats (R2 = 0.984).
In Vivo Assay Validation
The microfluidic assays were next evaluated using samples obtained from in vivo treatments. As shown in Figure 1 , the in vivo ABPP process is nearly identical to that for in vitro ABPP, except that plasma and tissue lysates derive from animals dosed in vivo with either test compounds or vehicle. Samples are then labeled ex vivo with probe before electrophoresis and analysis. The results shown in Figure 4 allow qualitative comparison of resolution and sensitivity between microfluidic chips and SDS-PAGE imaging for the same set of brain and kidney samples run in both formats (LMW assay). The “virtual gel” shown is a computer-generated image created by the LabChip software to enable qualitative visualization of the data (representative electropherogram shown vertically to allow mapping of peaks with gel bands). Compared with the SDS-PAGE image, the microfluidic chip produced better separation in the 50–70 kDa range (particularly visible in the kidney samples), while the conventional gel displayed higher resolution for lower-molecular-weight proteins in the 20–40 kDa range (e.g., the two MGLL bands in brain, indicated by arrows). The gel image exposure time was for only 1 s to simulate conditions for detection on the chip; however, many bands are still clearly darker in the gel image. Moreover, with longer exposure even fainter bands could be detected with imaging; there was no analogous way to amplify signal in the microfluidic format.
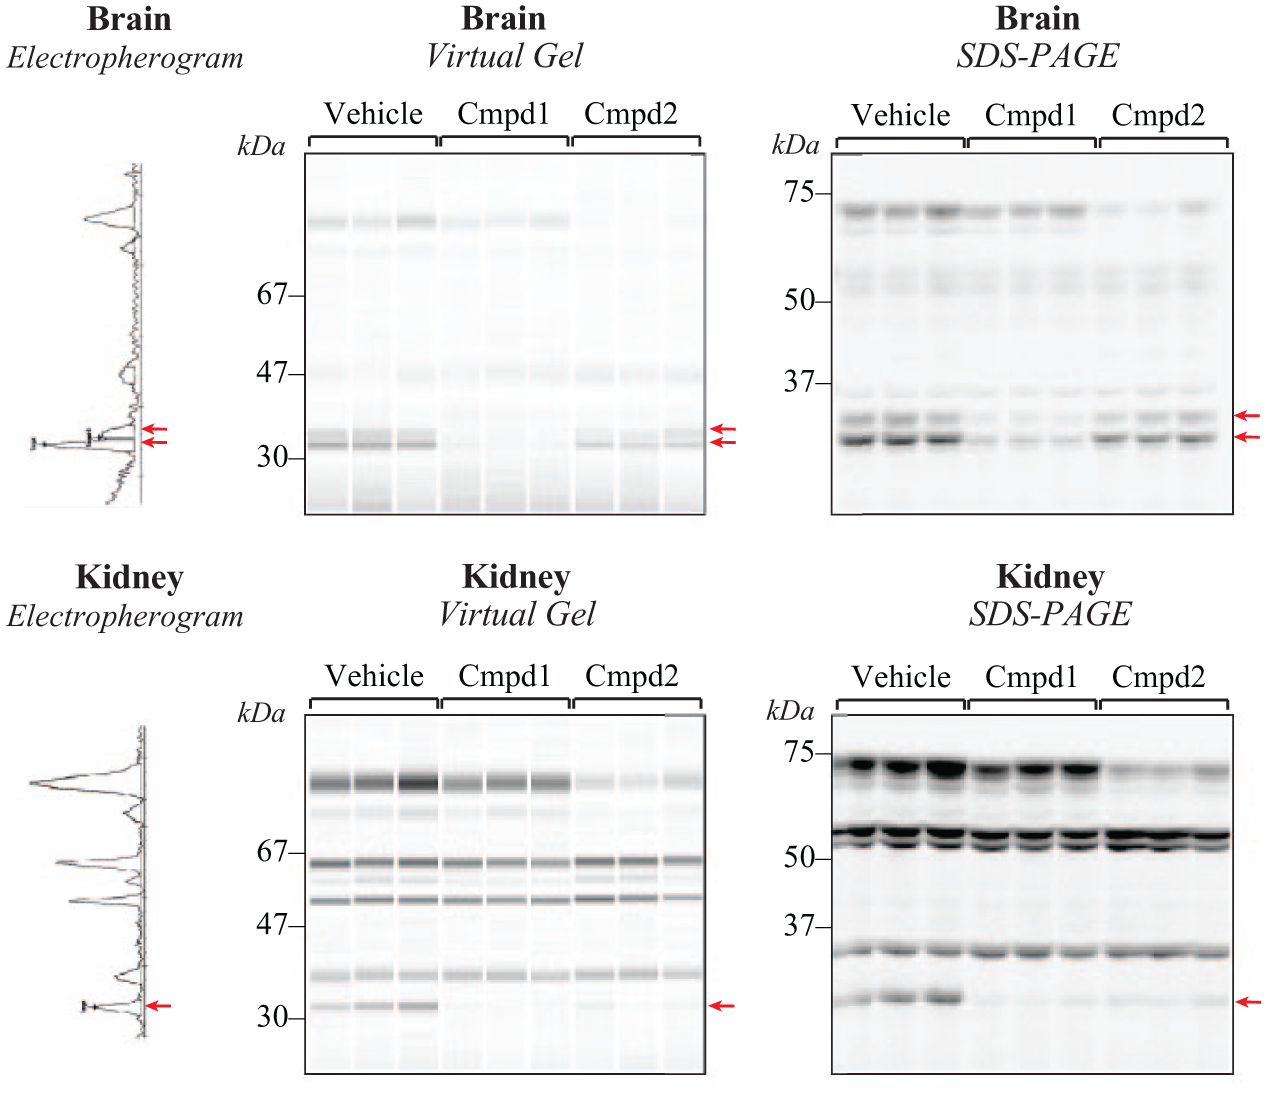
Qualitative comparison of resolution and sensitivity for in vivo ABPP samples separated in parallel on conventional gels and microfluidic chips. Brain and kidney lysates from animals dosed with inhibitors or vehicle are shown as software-generated virtual gels with an example electropherogram shown vertically to map peaks with corresponding bands on the gel. Inhibition of the 33–35 kDa target protein MGLL is visible for the two bands in brain and single band in kidney (arrows). SDS-PAGE gels were imaged for 1 s to mimic the short exposure time on chips as samples flow past the laser detector.
Despite these differences, quantification of enzyme activity was remarkably equivalent in both formats, as shown in
Figure 5
for both the LMW and HMW assays using in vivo-dosed samples. Percent activity values for each treatment group were highly correlated between microfluidic and conventional gel ABPP, and a comparable range of values was obtained for each group in both formats.
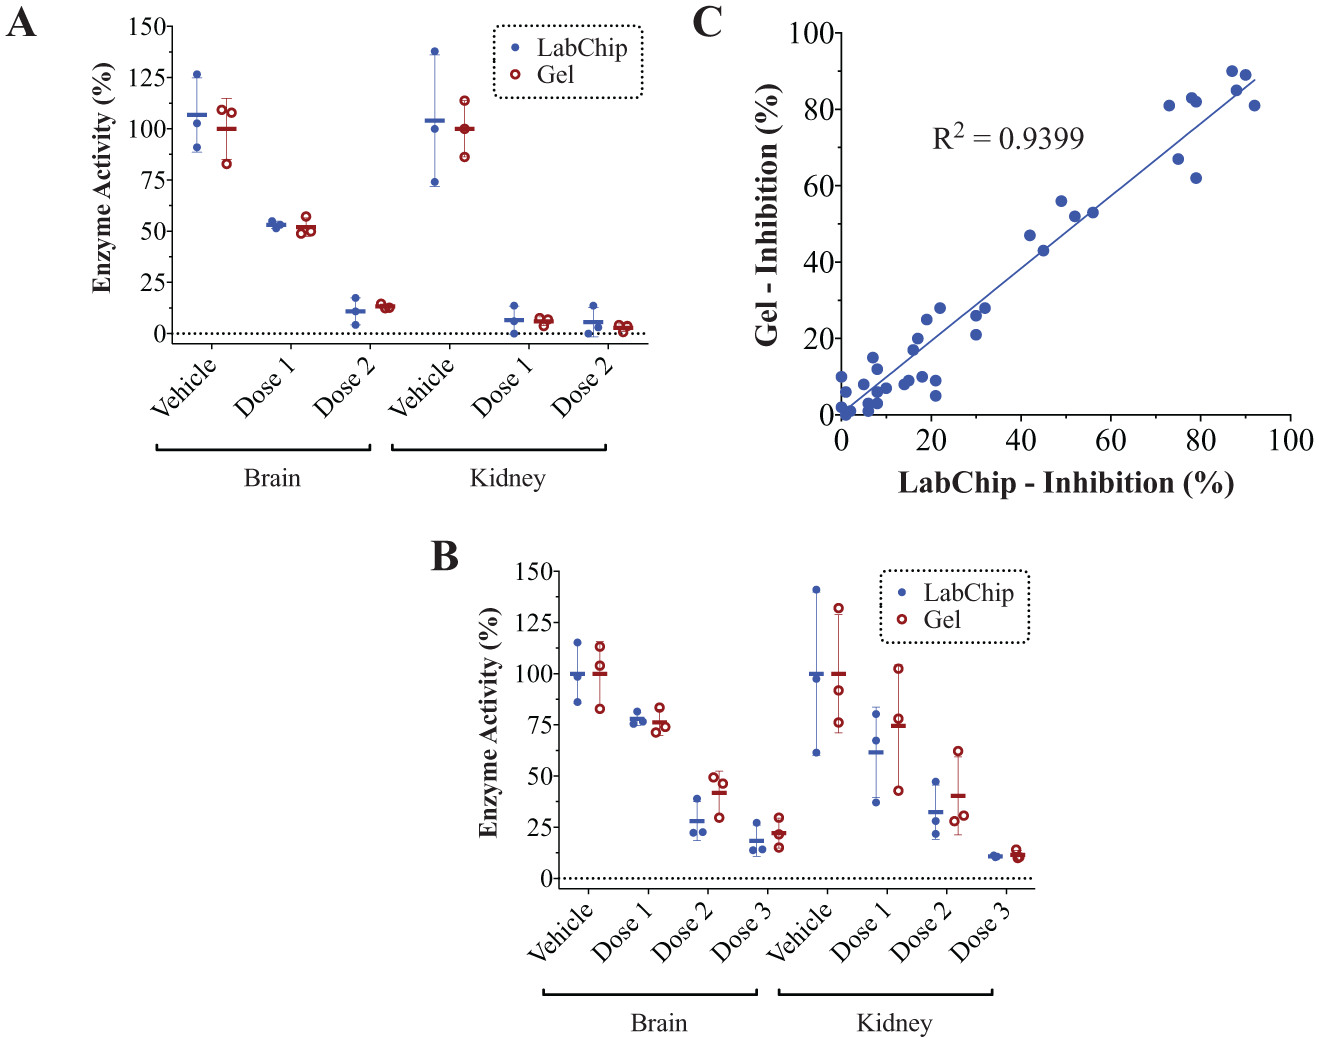
In vivo validation of microfluidic ABPP. (
Performance and Workflow
The lysates used in the LMW assay are fairly crude; other than a clarifying centrifugation step to remove large fragments, there is no further purification or filtration to remove nucleic acids, lipids, or particulates. Because the LMW assay also used relatively concentrated samples (5 mg/mL total protein), it was important to evaluate the possibility of modification of chip surfaces by macromolecules or clogging of the sipper capillary or microchannels over time. Surface modification or partial clogging would both be expected to disrupt flow over time and result in either catastrophic failure or a more subtle change in resolution and peak arrival time over repeated usage of a chip. To test for such changes, a test chip was run with typical in vivo-dosed samples of brain and kidney lysates in the LMW assay. Identical samples were placed on a single assay plate run repeatedly until the chip was near the end of the manufacturer-recommended lifetime (400 samples). As shown in Figure 6A , technical replicates of identical biological samples showed no difference in peak heights or retention times. When the first chip was replaced with a new chip, there was no change in peak appearance or overall data quality ( Fig. 6B ).
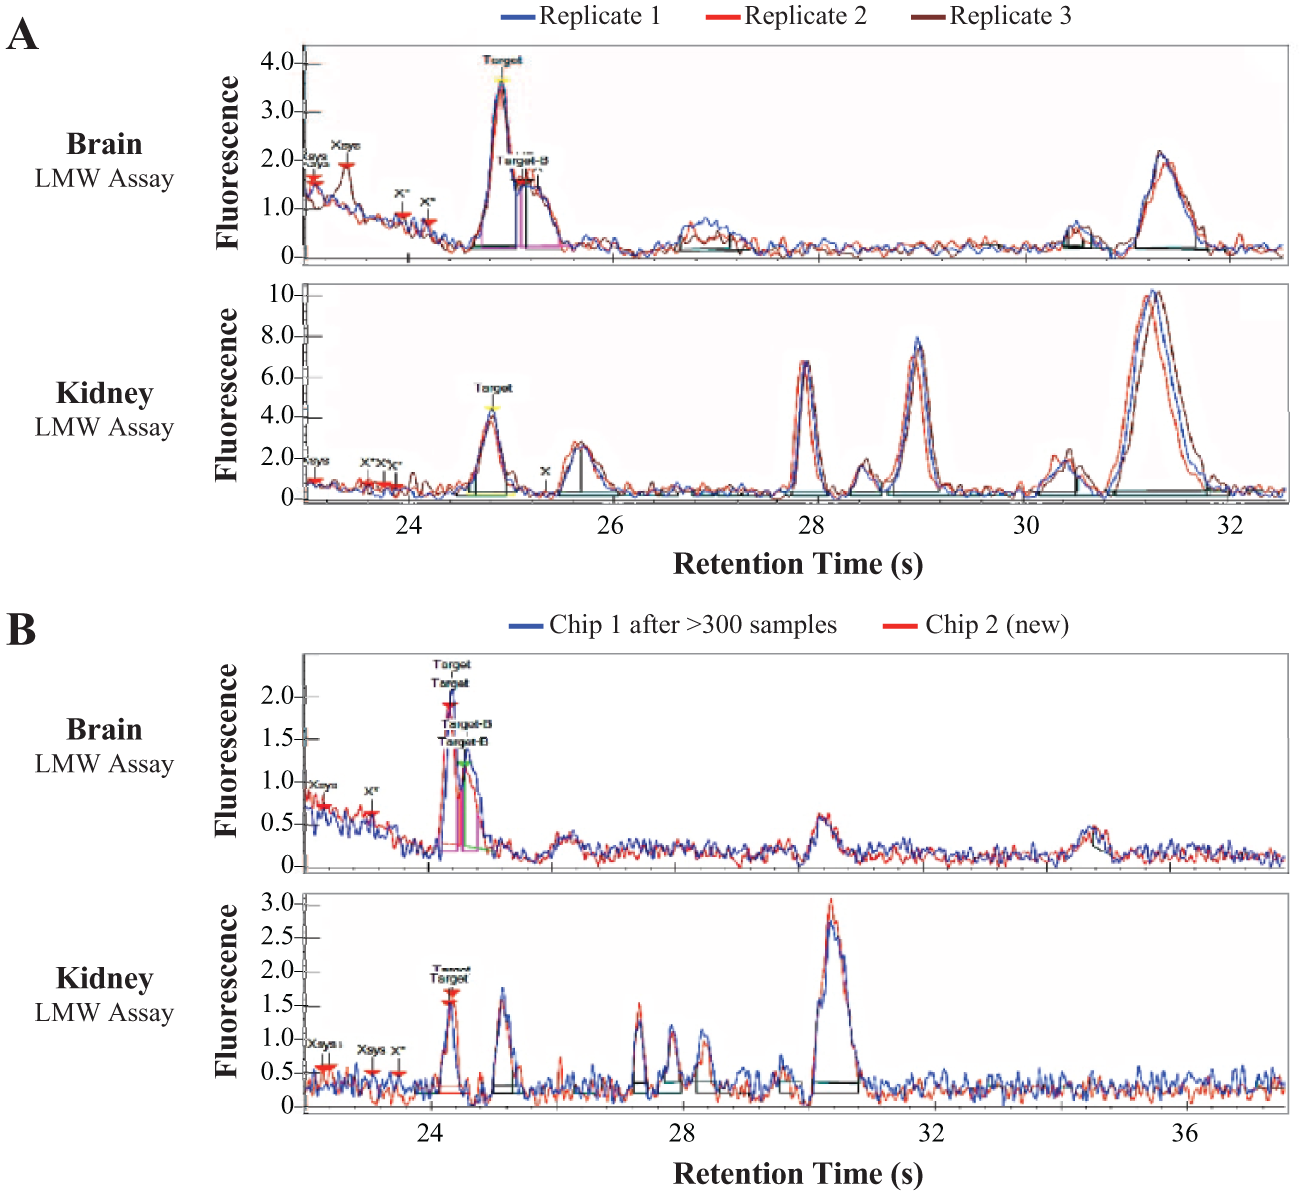
Representative performance of microfluidic chips with concentrated tissue lysates (5 mg/mL) used in the LMW assay. (
Electrophoresis of a 96-well plate of samples required about 1.5 h for microfluidic chips, compared with about 4.5 h for conventional gels, including time for gel loading, running, imaging, and cleanup. The time required for conventional gel analysis by ImageJ was highly variable, depending on both user expertise and quality of the gel image; while high-quality gel images could be analyzed in as little as 30 min, common artifacts such as gradations in background shading across a gel could cause an analysis to take 2 h or longer of manual effort. In comparison, LabChip analysis was almost completely automated: as a quality control in routine screening, users visually inspected the data and verified that all peaks and baselines had been found correctly; this process typically required no more than 10 min per plate.
Discussion
We have adapted ABPP assays in a microfluidic gel electrophoresis format for both low- and high-molecular-weight serine hydrolase enzymes in crude tissue lysates and plasma derived from in vivo experiments. We estimate that our LMW assay would be most appropriate for enzymes ranging from 20 to 60 kDa, while the HMW assay is preferred for enzymes in the 60–100 kDa range. Under optimized conditions for our enzymes of interest, there was no difference in quantified relative enzyme activity between microfluidic ABPP and conventional gel imaging. Microfluidic chips produced highly reproducible results between chips and between technical replicates of samples.
An important consideration when choosing applications for microfluidic ABPP was the degree of endogenous expression for enzymes of interest in the context of native proteomes. Conventional gel imagers can image gels for extended exposure times, enabling the detection of extremely faint fluorescent bands; thus, SDS-PAGE is preferable for applications requiring quantification of weakly expressed enzymes. Endogenous enzymes from tissue samples labeled with ABPP probes produce much weaker fluorescent peaks than the LabChip Reviewer software was initially designed to detect; fortunately, the software was designed with great flexibility to allow user modifications to sophisticated aspects of the analysis algorithms. With our customized settings, we have found that the software reliably detects even relatively small peaks (>95% inhibited enzymes) and correctly identifies these peaks by expected molecular weight. While these settings work very well for relative quantification, it should be noted that absolute quantification is not needed for gel ABPP and so has not been evaluated here.
Electrophoretic separation in the microfluidic format was generally similar to SDS-PAGE in that most proteins migrated as expected by size; however, resolution was highly context dependent. We observed lower resolution for smaller-molecular-weight (<40 kDa) proteins in microfluidic format compared with conventional gels, while microfluidic gels produced more separation for proteins in the 50–70 kDa range. Interestingly, a highly glycosylated enzyme consistently migrated at a higher apparent molecular weight in microfluidic gels compared with conventional SDS-PAGE (89 kDa vs 70 kDa), suggesting that interactions with the chip sample buffer and/or gel matrix may in some cases alter electrophoretic mobility compared with conventional gels. Thus, resolution may depend on the nature of the proteins being separated, and the identities of protein peaks on the chip need to be confirmed by experimentation with selective inhibitors in vitro.
The most striking advantage of microfluidic ABPP was the time savings compared with SDS-PAGE and ImageJ quantification. ABPP analysis of a single 96-well plate of samples requires a full day of work by conventional methods, or even longer when imaging artifacts complicate the analysis of gel images. In contrast, microfluidic ABPP can be completed in half that time, routinely saving 3–5 h of work for each plate of samples. Automatic quantification by the LabChip analysis software removes variability due to user judgments and relative expertise in ImageJ analysis. Additional workflow advantages for high-throughput laboratories include the lack of overhead in the microfluidic format, with no need to maintain a constant stock of perishable gels and large quantities of running buffers and clean glassware for SDS-PAGE. From a practical perspective, workflows involving extensive use of SDS-PAGE present a scalability problem due to the sheer amount of bench space required for each gel rig. Each of our gels can run only 24 samples and must include controls on each gel to permit relative quantification. In contrast, the LabChip GXII instrument requires about 2 × 2 feet of bench space and is highly amenable to automation since it accepts samples directly in 96- or 384-well plates. Moreover, because only 5 μL of sample is required in plates, microfluidic ABPP can be miniaturized to enable the analysis of scarce samples from in vivo testing.
Due to these advantages, we have incorporated microfluidic ABPP assays into routine in vitro screening and in vivo assessments of target engagement, tissue distribution, and selectivity against off-target enzymes. Microfluidic ABPP enables direct visualization and comparison of enzyme activity for inhibitors dosed in vivo compared with in vitro treatments, providing a translational advantage and a streamlined, scalable workflow in preclinical drug discovery and development.
Supplemental Material
Supplemental_Reardon_et_al – Supplemental material for Quantification of In Vivo Target Engagement Using Microfluidic Activity-Based Protein Profiling
Supplemental material, Supplemental_Reardon_et_al for Quantification of In Vivo Target Engagement Using Microfluidic Activity-Based Protein Profiling by Holly T. Reardon, Rachel A. Herbst, Cassandra L. Henry, Dylan M. Herbst, Nhi Ngo, Justin S. Cisar, Olivia D. Weber, Micah J. Niphakis and Gary P. O’Neill in SLAS Technology
Footnotes
Acknowledgements
We thank Irina Mineyev and Janet Buecker from PerkinElmer for helpful discussions and technical assistance with initial feasibility tests, and we are grateful to our colleagues Jacquelyn Ha, Clayton Hutton, Aundrea Coppola, Ashley Jubb, and Jordan Warburg for help with in vivo experiments.
Supplemental material is available online with this article.
Declaration of Conflicting Interests
The authors declared the following potential conflicts of interest with respect to the research, authorship, and/or publication of this article: All authors were employed by Abide Therapeutics and their research and authorship of this article was completed within the scope of this employment.
Funding
The authors received no financial support for the research, authorship, and/or publication of this article.
References
Supplementary Material
Please find the following supplemental material available below.
For Open Access articles published under a Creative Commons License, all supplemental material carries the same license as the article it is associated with.
For non-Open Access articles published, all supplemental material carries a non-exclusive license, and permission requests for re-use of supplemental material or any part of supplemental material shall be sent directly to the copyright owner as specified in the copyright notice associated with the article.