
Abstract
Multiplexing strategies, which greatly increase the number of simultaneously measured parameters in single experiments, are now being widely implemented by both the pharmaceutical industry and academic researchers. Color has long been used to identify biological signals and, when combined with molecular barcodes, has substantially enhanced the depth of multiplexed sample characterization. Moreover, the recent advent of DNA barcodes has led to an explosion of innovative cell sequencing approaches. Novel barcoding strategies also show great promise for encoding spatial information in transcriptomic studies, and for precise assessment of molecular abundance. Both color- and DNA-based barcodes can be conveniently analyzed with either a microscope or a cytometer, or via DNA sequencing. Here we review the basic principles of several technologies used to create barcodes and detail the type of samples that can be identified with such tags.
Introduction
The widespread implementation of drug screens by both the pharmaceutical industry and academia has triggered the development of barcoding strategies to significantly increase the number of molecules and samples that can be simultaneously characterized. The advent of sophisticated technological hardware for laboratory automation permits highly multiplexed approaches that greatly reduce time and cost. In this context, molecular tags can be used to specifically label—and thereby act as unique identifiers for—a variety of possible entities, including individual cells, 1 pooled samples,2,3 macromolecules, 4 spatial regions, 5 and cell lineages. 6 These molecular tags are designed to label specific cells and molecules and possess biochemical properties that facilitate their identification.
The most widespread labeling approaches use either short oligonucleotides 1 or fluorescent labels, 7 as these can yield a large number of distinct combinations. Furthermore, identification of such tags is usually performed with standard equipment where sequencing, or spectral detection, is integrated with high-throughput assays. For example, short DNA molecules where each base can take four possible values yield enormous numbers of unique permutations. Indeed a 10-base-pair (bp) DNA oligo spans 410 (more than a million) different combinations. On the other hand, simple color barcodes based on only five different fluorescence molecules (e.g., DAPI, FITC, cyanine3, cyanine5, cyanine7, or any dye with similar excitation/emission spectra) in on/off states can generate 25 (32) labels. These commonly used channels can be detected with standard filters available on most fluorescent microscopes, and their number can be further increased with more specialized hardware, as mentioned later in this review. In the case of either short oligonucleotides or fluorescent labels, the number of attributes that can be simultaneously screened increases as a power of the number of channels, thereby generating large numbers of unique barcodes for multiplexing.
For color labels, two additional encoding dimensions can be incorporated to create barcodes. The first relies on different levels of signal intensity 7 to yield higher numbers of combinations. Indeed, while five colors used in on/off states generate 32 labels, using a code consisting of three intensities (no signal, low intensity, high intensity) could in principle generate up to 35 (243) labels. The second dimension involves positioning colored molecules on a carrier structure 8 so that their order can be measured. For example, the sequence of colors along a carrier RNA molecule can be used just like DNA bases to generate a code. 9 The use of super-resolution microscopy allows precise determination of the position of each fluorescent molecule from which such sequences can be inferred. Instead of RNA carriers, hydrogels have also been used to spatially organize colored molecules, for instance, within a bead, to create color barcodes.10,11
For DNA labels, a large number of different strategies have demonstrated the great versatility of this technology. For example, various pipelines developed for single-cell transcriptomics have incorporated different barcoding methods. Currently, the most widespread single-cell sequencing technology isolates cells in liquid drops, which need to be tagged before being pooled into one sequencing reaction. 1 Barcoding individual cells is achieved via inclusion of distinct short DNA oligonucleotides into all cDNA sequences during library preparation. Such DNA labels are used to assign each read to a cell of origin during analysis. 1
Based on a similar approach, cellular samples from different origins can also be barcoded, pooled, and sequenced in a single run. Sequenced DNA molecules include both the genetic information and the barcodes that are used to match sequencing information to a sample.2,3 Considering the important cost of reagents in sequencing technologies, pooling material is crucial toward reducing cost as well as time.
Short DNA molecules are also used to barcode antibodies and proteins, that is, to combine proteomics and genomics. 4 This powerful approach permits detection of proteins and epitopes alongside transcriptomic data at the single-cell level. Furthermore, barcodes are also used to tag the position of cells within a sample prior to tissue digestion.12,13 Thus, transcriptomic data can be matched with spatial tissue organization and cell distribution. Finally, cells can also be barcoded for lineage characterization where a unique identifier is passed to each cell’s progeny, allowing one to track differentiation and migration during developmental studies. 6
In this review, we explore how barcodes have recently been exploited in a wide range of applications. We first focus on the use of cellular tags to recognize cells in next-generation sequencing (NGS) pipelines, and then detail how the same techniques are allowing the identification of proteins in a sequencing protocol. We also consider how spatial position can be encoded to be paired with a sequencing read of a sample. Finally, we examine how color is being used to barcode various types of probes, such as antibodies, proteins, or small ligands used to label cells or DNA fragments.
Barcoding for Single-Cell Transcriptomics
The use of oligonucleotides as barcodes has been key to the success of NGS techniques.1,14,15 Although details vary among sequencing platforms, short DNA identification sequences are incorporated into primers used for library preparation. Most of these, including Nextera primers, can be purchased in versions that include short barcodes. Before sequencing, during library preparation, each cDNA molecule is fragmented and extended from both ends with Illumina’s adaptor sequences. When desired, each adaptor sequence can include identifiers that generate up to 384 combinations to identify each well in a plate. After library preparation, the 384 encoded libraries are pooled for sequencing, and resulting reads can still be distinguished. 16
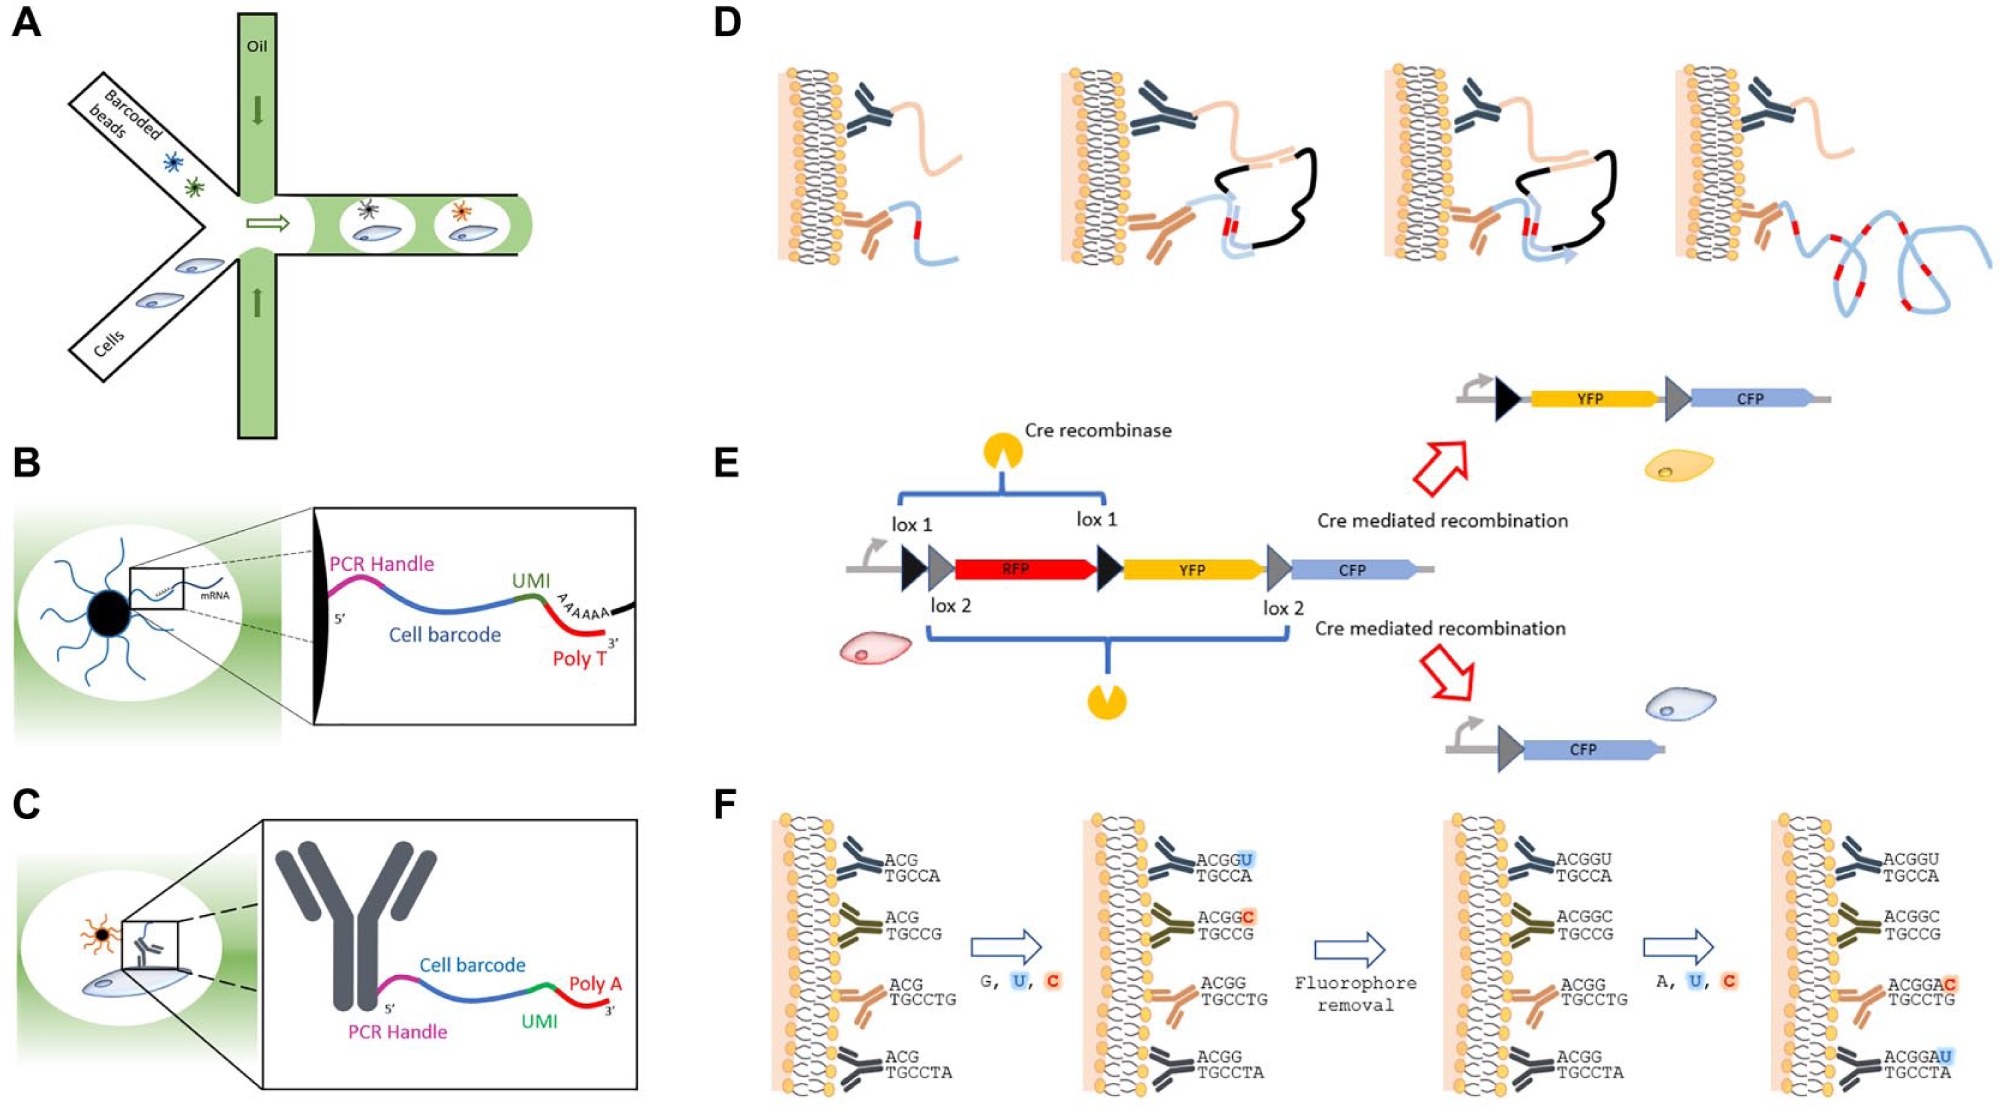
More recent single-cell RNA sequencing (sc-RNA-seq) techniques further increase throughput by exploiting microfluidics to encapsulate cells in liquid drops. 17 These drops are generated by water-in-oil emulsion, where each droplet replaces a well in a plate ( Fig. 1A ). This approach dramatically increases the number of cells that can be simultaneously processed, that is, up to several thousand. Each captured cell is assigned an identity through a randomly generated DNA sequence that is immobilized in a gel bead (or on a solid bead) inside a water droplet ( Fig. 1B ). The size and generation rate of liquid drops are tuned to maximize the number of droplets that contain only one cell and one bead. Barcode synthesis is realized by creating DNA molecules on gel beads one base at a time in a controlled fashion. 1 Beads are randomly split into four equal groups, each of which receives one of the four DNA bases. Beads are then pooled and randomly split again into four groups for the addition of the next base. This process of pooling and splitting is repeated several times, so that each bead carries multiple copies of the same sequence. The huge number of possible combinations obtained with very few bases (16,777,216 for a 12 bp barcode) guarantees a unique code for each bead with very low probability of two beads associated with the same sequence in a sample of a few thousand cells. Since the synthesis of cDNAs from captured single cells is performed inside the droplet, and all primers in a bead carry the same barcode, cDNA molecules from a single cell share a unique tag.
(
As an alternative, Ramani et al. 18 proposed the use of a similar combinatorial barcoding method on fixed nuclei, without requiring their individual capture. Cells are digested and nuclei distributed in a 96-well plate with no more than 25 nuclei per well. In each well, DNA within nuclei is tagged by proximity ligation with a first barcode. Nuclei are pooled and split in 96-well plates again, and a second tag is placed at the extremities of the DNA molecules. The grouping of these subsequently added tags creates unique combinations (9216 combinations in the case of 96-well plates) that can be used to identify individual nuclei.
Single-cell combinatorial indexing RNA sequencing (sci-RNA-seq), a similar method developed by Cao et al., 19 is also based on splitting and pooling fixed cells. Here cells are fixed, permeabilized, and distributed in multiwell plates. Each well is then incubated with a specific poly-T primer that includes a handle (i.e., a sequence common to all primers that enables PCR amplification) and a barcode, and mRNA molecules are reverse transcribed. Cells are then pooled and redistributed in multiwell plates where barcoded cDNA molecules are PCR amplified with primers specific for the handle sequence carried by the poly-T primers from the first step. All PCR primers carry their own barcode. Therefore, all cells carry a combination of two barcodes, one from the primer used in the cDNA synthesis, and one from the primer used for the PCR amplification. Here again, probabilities ensure that they almost all have a different combination of the two barcodes, which allows the reliable identification of individual cells.
Most primers used in single-cell NGS studies use barcodes not only to differentiate cells from each other but also to identify reads originating from single RNA transcripts. Indeed, in the original droplet sequencing (Drop-seq) paper, 1 barcoded primers also contained a random eight-base sequence, termed unique molecular identifier (UMI), which was different for each primer of the same bead among 65,536 possibilities. The presence of UMIs allows the filtering of noise amplification artifacts from real cellular expression levels.
The main limitation of single-cell sequencing is related to noise, as low-expression transcripts are rarely captured, which yields highly variable measured signals. The strategies for creating barcodes in this area are relatively well established, and efforts now focus primarily on improving sequencing noise, coverage, and tissue preparation. Another serious limitation originating from the use of beads to associate barcoded molecules to each cell is that in order to guarantee that single (not doublet) barcoded beads are enclosed with unique cells in droplets, it is necessary to dilute beads, resulting in the loss of large numbers of cells. 1 This is not a problem for cell types that are highly represented in the sample; however, losing the majority of cells from a rare population can become a major hurdle. Other techniques used to associate one cell or one nucleus with one barcode are more limited in their throughput, as the number of barcoded cells is then limited by the number of wells in a plaque.18,19
Barcoding Antibodies for Transcriptomics and Proteomics
The simultaneous measurement of transcription and translation has represented a technological challenge for decades. Recently, new methods introduced the idea of generating proteins tagged with DNA to convert protein abundance and localization into data that can be obtained with NGS technologies.4,20 This novel use of DNA barcodes brings high throughput to proteomic analyses. The capacity to simultaneously read the proteome and the transcriptome of a cell is of paramount importance; indeed, RNA abundance is not always correlated with protein concentration 21 due to variations in posttranscriptional processing. 22
The CITE-seq 4 technique achieves simultaneous proteomic and transcriptomic sequencing using DNA-labeled antibodies ( Fig. 1C ) to tag cell surface proteins. Immunolabeled cells are captured for sequencing, and the short DNA barcodes ligated to antibodies are detected as cDNAs originating from individual cells. The manner in which these short DNA barcodes are attached to the immunoglobulins varies between protocols. In CITE-seq, biotin and streptavidin are used, whereas in REAP-seq 23 the barcode is covalently linked to the antibody to reduce steric hindrance. Ab-seq20,24 relies on a UMI attached to barcoded antibodies, allowing measurement of the abundance of individual proteins in cells. All these approaches are being rapidly accepted and used in various studies on cell surface proteins such as immune receptors. 18 Barcoded antibodies have been used to develop a qPCR assay that allows the correlation between numbers of transfected plasmids, transcripts, and barcoded proteins to be evaluated in single cells. 25 In addition to protein detection, barcoded antibodies are also used to quantify epitopes. Lee et al. 26 performed Western blots of cell lysates and used DNA barcoded antibodies to count single molecules. As all antibodies presented an antigen-associated code, precise quantification was possible with specificity comparable to that of enzyme-linked immunosorbent assay (ELISA) plates.
Genshaft et al. 27 developed a similar technique that employed proteins coupled to DNA strands that share a short complementary sequence at their 3′ end. When two proteins bind their targets, they co-localize sufficiently to allow DNA barcode hybridization. Each probe serves as a primer for extension of the other. This proximity extension assay (PEA; Fig. 1D ), which requires the tight co-localization of both probes for extension to occur, increases target specificity since the remaining nonspecific probes do not interact in a way that allows proximity extension. Barcodes are read using the C1 platform from Fluidigm to obtain the full sequence of all tagged antibodies.
PEAs have also been used to improve signal quality in fluorescence in situ hybridization (FISH) experiments. The proximity ligation assay for RNA 28 (PLAYR) is based on two barcoded DNA probes that hybridize in situ to improve the strength and specificity of the signal. When two of these probes hybridize in contiguous regions, they capture a third barcoded probe that is then circularized. The fact that precise localized hybridization of two different probes is required to capture the barcoded circle template dramatically increases the technique’s specificity. An amplification step is then performed with the circular structure serving as primer. This rolling circle amplification (RCA) of DNA generates a product than contains several repeats of the barcode, thereby generating strong signal amplification. The probed mRNA is converted into a highly repeated barcode compatible with fluorescent and mass cytometry detection. In applying the above technique, Frei et al. used DNA barcoded antibodies and simultaneously detected all barcodes on 14 channels to show strong correlation between RNA and protein localization. 28 Technologies based on antibody recognition require prior knowledge of protein expression profiles in cell samples. Indeed, protein levels are critical to an accurate study based on protein–antibody interaction. More straightforward whole-transcriptome sequencing experiments are less sensitive to this, as they consider all available genetic information. Furthermore, the specificity and affinity of antibodies are highly variable and strongly dependent on experimental conditions, rendering these antibody-based techniques largely experimental at present.20,29
A key practical obstacle for single-cell sequencing is cost, and barcodes have been used to mitigate this by pooling several samples. Barcoded antibodies against ubiquitously expressed proteins with different DNA sequences were employed to tag individual samples. 30 Similarly, Nag et al. 31 profiled 20 single-nucleotide polymorphisms (SNPs) associated with drug resistance in 463 samples of malaria-infected patients in one sequencing round. This approach reduces the cost by a factor of 7 but loses sequencing depth as a trade-off.
An alternative to barcoding antibodies is to use aptamers, which show high specificity for their target molecule. Aptamers consist of RNA, and as such themselves constitute a barcode, that is, alleviate the need for additional barcoding as in the case of antibodies. Aptamers need only be poly-adenylated to ensure their capture in the next-gen RNA-seq workflow. 32 They are easy to generate using SELEX33 –35 and show binding efficiency and specificity at least equal to that of antibodies.36,37
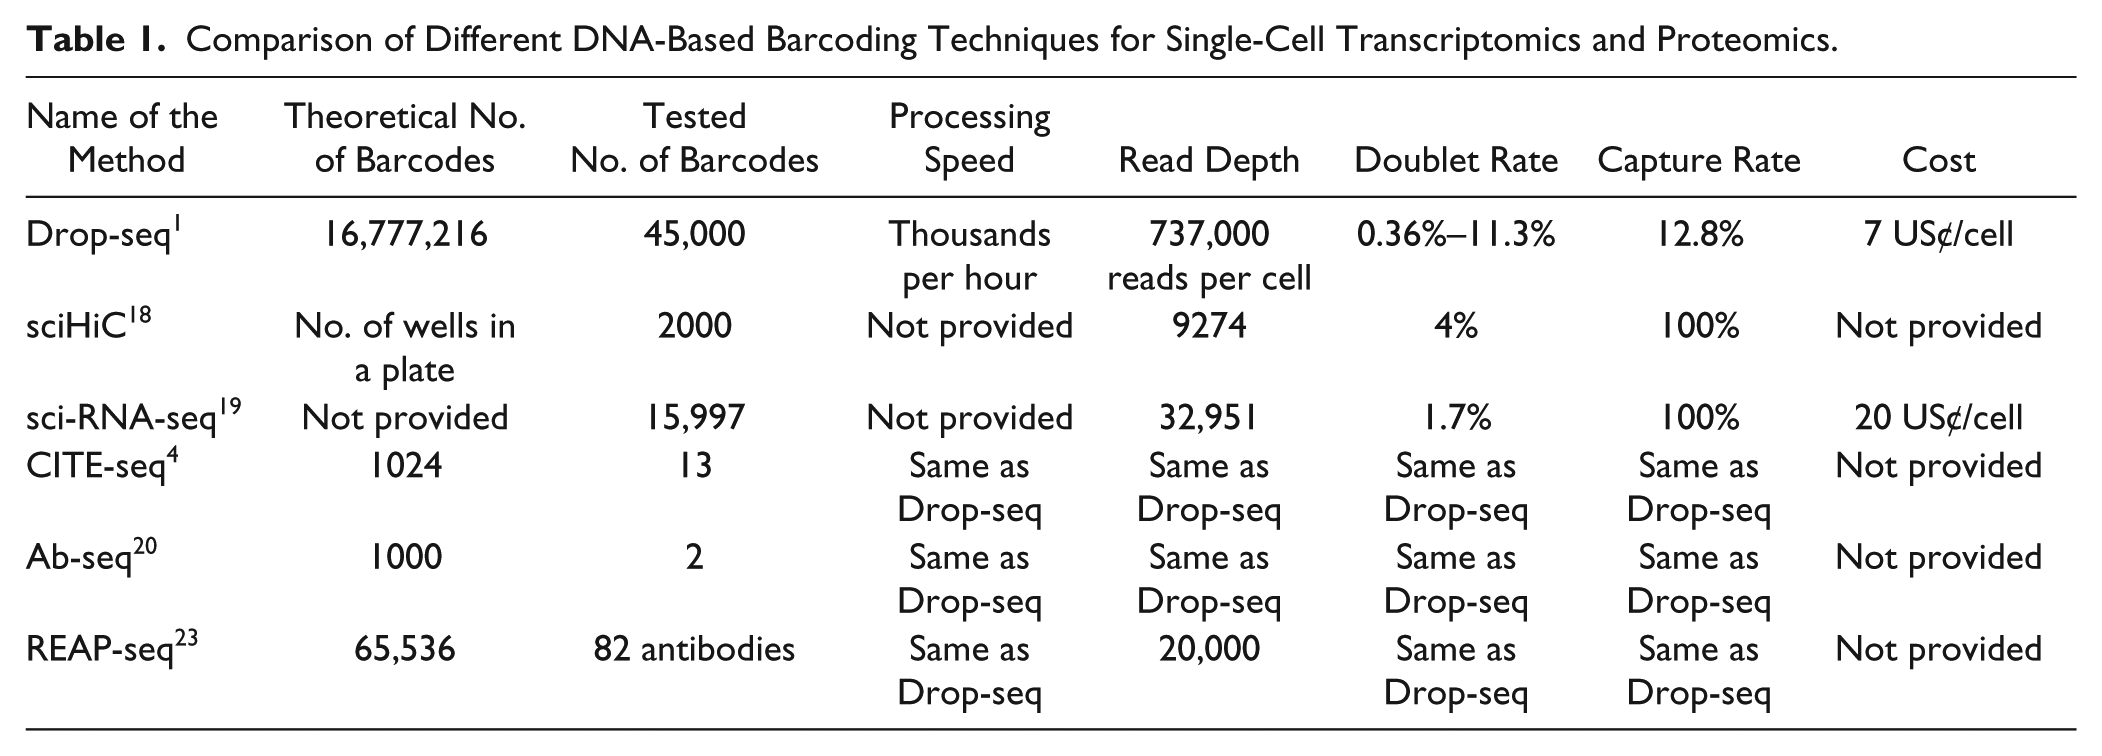
The generation of new barcoding sequences cannot be completely random and as such is not necessarily straightforward. While available techniques for generating acceptable sequences are efficient, some constraints must be respected. Among these are guanine–cytosine (GC) content, homopolymer length, and certain sequences that must be avoided because of their natural presence in a sample or their recognition by a restriction enzyme. 38 These limitations imply that most techniques based on random synthesis of a DNA barcode greatly overestimate the number of useful barcodes that can be generated when groups calculate the theoretical number as an exponential function (4number of bases). Taking into account these considerations, Lyons et al. 38 provide a framework for generating billions of acceptable DNA barcodes. Techniques for efficiently tethering a DNA strand to a protein such as an antibody are also being improved.39,40 Table 1 summarizes key characteristics of each sequencing technique described above.
Comparison of Different DNA-Based Barcoding Techniques for Single-Cell Transcriptomics and Proteomics.
Barcoding Chemical Libraries for Interaction Screening
High-throughput screening requires the identification of target-interacting molecules from large candidate libraries. This is rendered difficult by the very limited number of channels offered by fluorescence 41 and mass cytometry, 42 even when they are used simultaneously. In theory, DNA barcodes can be employed to easily generate 1010 simultaneously usable sequences, 43 each of which opens a new experimental channel in which an additional molecule can be observed. This is much more than what can be achieved on fluorescence-activated cell sorting (FACS) platforms. 44 Moreover, this high number of barcodes has been exploited to screen major histocompatibility complex multimers 43 and DNA barcoded chemical libraries, where interacting partners can then be identified by a simple PCR.45 –47
In a similar manner, Pollock et al. 48 used phages to carry their barcode. They generated a phage library with each member exposing an antibody fragment (Fab). The DNA sequence encoding the Fab is used as a barcode. They exposed 44 targets to exclusively capture those phages presenting a Fab that had affinity for the displayed targets, whereas other phages were rinsed away. As the captured phage also carried the DNA encoding the Fab, they could identify each interacting Fab by sequencing the phage.
Use of Barcodes for Lineage Studies
Barcodes can be used to identify cellular progeny within an organism during normal development, tumor development, or infectious disease propagation. 49 Indeed, including a known short DNA barcode sequence into the genome of a cell of interest ensures that it will be transmitted to progeny, allowing subsequent identification of the latter. As the number of divisions increases, mutations in the genome of the cells appear that create subgroups within the population. It is then possible to establish a genealogy tree of the final population of cells. Bacteria were tagged to study the dynamics of propagation of tuberculosis during the infection of a macaque. 50 The abundance of the subpopulation carrying any given mutation reflects the beneficial effect of said mutation for these bacteria. In yeast, barcodes were used to quantify the evolution of the relative abundance of 500,000 mutants within a single population. 51 This permitted characterization of evolutionary dynamics after the appearance of beneficial mutations. Moreover, barcode-based lineage studies in bacteria can be exploited to characterize the appearance of drug resistance. 52
Using a library of lentiviruses,6,53 a number of short DNA sequences can be integrated into cells within an embryo, with different barcodes encoding different cells. Using NGS, these short sequences can be revealed to deduce cell lineage. 53 A modified CRISPR approach based on a homing guide RNA (hgRNA) has also been used to integrate randomly mutating sequences within the genome.54,55 This method targets nuclease activity to the locus into which the guide RNA is integrated. Therefore, cells can cleave the gRNA locus, which is then repaired in an error-prone manner by nonhomologous end joining, generating a new guide RNA, and at the same time mutating the sequence used as a barcode. Cell phylogeny can then be inferred from the number and localization of mutations.54,56 Interestingly, given the mutation rate, the inclusion of only six of these self-mutating barcodes would suffice to uniquely identify all neurons from a mouse. These lineage tracking techniques were coupled with whole-cell sequencing workflows to study expression variation during zebrafish development. 57 In this experiment, CRISPR mutations were not random but rather kept under the control of a heat shock-activated Cas9. CRISPR has also been used in Perturb-seq and CROP-seq to introduce changes in selected genes or promoters and characterize their effect on the whole transcriptome. A library of barcoded guide RNAs was used to infect cells. Each guide allowed perturbation of the expression of one gene, which was identified with the barcode carried by the guide RNA.58 –60 Barcodes have also been integrated within viral genomes to track their lineage. 61 Barcoding viruses with 34 bp DNA sequences allowed quantification of viral subgroups and calculation of the reactivation frequencies of the viruses posttreatment.
Finally, color barcodes have also been used for lineage tracing based on Cre-recombinase activity in Brainbow. 62 Cre is able to excise or invert short DNA sequences that are flanked by specifically recognized regions (lox regions). Therefore, infecting cells with distinct fluorescent proteins encoded in a single locus, each flanked by incompatible sets of lox regions, allows the random induction of one of the fluorescent proteins in the cell ( Fig. 1E ). 62 Cre stochastic recombination has been used in very similar ways by various techniques such as BOINC 63 and MultiBow. 64
Barcoding Spatial Information for Next-Generation Sequencing
One critical piece of information that can be barcoded, which is otherwise lost in most NGS protocols, is the spatial origin of cells. TIVA 12 allows the individual selection of cells within a live microscopy image to be sequenced. To attain such precision, Lovatt et al. designed a TIVA tag that enters cells and requires photoactivation to hybridize on polyadenylated mRNA. This tag is biotinylated, which allows downstream extraction of the mRNAs of interest with streptavidin beads. Even though this technique does not reach the read depth of sc-RNA-seq, sequenced cells can be chosen, one at a time, and therefore cellular proximity and contact interactions can be studied. 5 Another method, termed CLaP, 13 allows pairing the information generated by single-cell sequencing protocols to individual cells in a microscopy image. It uses photobleaching to attach biotin to the membranes of cells that can be chosen based on visible criteria such as shape, migration speed and direction, cell-to-cell contact, or even a characteristic fluorescent signal present within the cell. The biotin can then be targeted with a fluorescent streptavidin. Color-tagged cells can be recognized on a Fluidigm C1 sorting chip by epifluorescence imaging, and the whole transcriptome of spatially chosen cells can be evaluated with the typical read depth of NGS techniques.
The other approach for tracking the spatial origin of an mRNA is in situ sequencing, which has the unique capacity to reveal transcript location at the subcellular level. Knowing where transcripts are translated could prove very useful toward understanding functional relationships between genes. 5 Barcodes can be used to mitigate the major drawback of this approach, that is, the limited number of genes that can be simultaneously observed. Barcoding of “padlock probes” is used to increase the number of sequences that can be simultaneously analyzed. 65 Briefly, two 20 bp DNA probe sequences separated by a 50 bp linker are hybridized with a cDNA target in situ, which, after ligation, creates a circular-shaped padlock probe. Ke et al. 66 exploited this approach for in situ target sequencing using a known barcode included in the linker region of the padlock probe. In addition to the signal amplification that rolling circle products provide, these are also well adapted to in situ sequencing since they remain bound to the target sequence. Each product can be locally interrogated using sequencing by ligation. In their work, Ke et al. 66 encoded probes with 4 bp long barcodes, generating 256 combinations. They used these to locate 31 known transcripts in a breast cancer tissue section. Genes were detected with 98.6% efficiency, with a maximum of 90 reads per cell. This maximal limit is due to the fact that sequencing by ligation is based on imaging, and therefore requires sufficient spacing for the sequenced strands to be discriminated in the image. This is a very powerful method to detect and localize RNAs of known sequence, and Larsson et al. 67 used a similar approach to locate DNA molecules.
FISH probes can also be spectrally encoded and then detected by super-resolution microscopy.7,68 Lubeck et al. 7 simultaneously identified up to 32 different barcodes using three fluorophores. In this system, the code is composed of intensity levels for each of the three color channels used to encode the probes. Super-resolution microscopy allows sufficient resolution to fluorescently encode, detect, and localize all transcripts associated with a single gene. 69
Color Barcoding of Probes
The number of possible colored probes that can be simultaneously used is restricted, since only a limited number of wavelengths can be detected without spectral crosstalk. To overcome this, several techniques are based on beads that each carry a signal in several color channels. The ratio of intensities in the different detection channels within a bead creates a barcode. Nguyen et al. 10 used ratiometric loading of gel beads with five lanthanide nanophosphors. These have the advantage of being excited by the same wavelength, do not photobleach, and have narrow emission bands. Different combinations of loading ratios provided 1101 codes. These beads can be assigned an affinity for a biological receptor by coating them with a probe to use as an alternative to fluorescent antibodies. In a similar approach, Tang et al. 70 stained nematodes with beads loaded with a BODIPY fluorophore flanked by two oxazines. The oxazines can be cleaved by simple light excitation, which shifts the fluorescence of the compound to higher wavelengths. The use of different activation times changes the signal ratios between the three emission wavelengths of the compound, as longer illumination increased the ratio of molecules that had their oxazine cleaved, therefore shifting their fluorescence toward longer wavelength. Different regions of the worm were efficiently encoded by simply varying the activation time along its anteroposterior axis. In a similar approach, Han et al. 71 developed microbeads loaded with quantum dots that allow excitation of all channels with a single wavelength. In this protocol, the code comprises 10 intensity levels in six color channels. The gel beads (approximately 1.2 µm diameter) can be loaded with different numbers of quantum dots and conjugated with DNA capture probes.
Alternatively, DNA has been used as carrier of fluorescent dyes for relative intensity barcoding. 9 Here, the fluorescent molecules are carried by a DNA dendrimer that constitutes a code-carrying microstructure of reduced size, thereby improving usability. Two-color encoding of DNA probes has also been used to increase the number of targets simultaneously detected by FISH. 72
Another key approach to color coding involves spatially organizing fluorescent molecules on a carrier. This carrier can be a gel bead, within which a barcode can be drawn by photobleaching. 73 Also, a DNA strand can be used as a carrier on which a sequence of color-tagged RNA hybridizes, creating a colored sequence. This technique, termed nCounter, was used to count mRNA molecules of more than 500 genes and shows high sensitivity without amplification. 74 Each DNA strand is made of a capture sequence specific for the target mRNA, and for a backbone on which colored RNA will hybridize. Using an electric field, all DNA backbones can be aligned in the same direction. Imaging then reveals the color sequence associated with each capture backbone, as well as their number.
On a similar note, DNA origami have been employed 75 to accomplish the same barcoding without requiring application of an electric field, allowing use with live samples. In this approach, the DNA-PAINT structure is employed to spatially organize colored probes into as many as 216 barcodes. These probes are used to stain live yeast, and super-resolution microscopy allows the spatial detection of up to 823,543 codes. In addition to not requiring alignment with an electric field, these probes have the key advantage of being significantly shorter (400–800 nm) than nCounter probes (2 µm). Another approach uses structured metallic particles to create a reflected pattern that can be encoded. The advantage here is that all fluorescence channels are left available for more classical stainings. 76
In addition to these approaches using ratios and positions to create codes, Hu et al. 77 set out to improve the library of available molecules for spectral encoding. They developed a library of polyynes to establish 20 simultaneously detectable light frequencies. These polyynes can be used to tag any protein and detect three states using Raman spectroscopy: absent, low concentration, and high concentration. With this, a theoretical maximal number of barcodes of 59,048 was attained, the highest number for any optical technique to date.
Fixed tissue samples have been stained with up to 66 different antibodies barcoded with DNA and revealed with fluorescence microscopy in a technique termed CO-detection by inDEXing (CODEX). 78 Each antibody type is associated with a specific DNA oligo that has a common sequence for a complementary primer, a distinct length, and a very particular design. Antibodies are identified in pairs during the extension of the complementary strands of their respective DNA barcode using standard fluorescence microscopy. A mix of fluorescently labeled U (green) and C (red) bases is added to the sample to only reveal the two antibodies with sequences having A or G as a first base after the primer during the first imaging cycle. After each image, fluorophores are cleaved, the excess of DNA bases is removed, and either A or G is added to the polymerizing strand to select the next unique pair of oligos that will fluoresce in each imaging cycle ( Fig. 1G ). Using this approach, Goltsev et al. 78 managed to perform 36 imaging cycles with good signal-to-noise ratio to detect 31 proteins.
Finally, the use of antibodies tagged with distinct elemental isotopes (mostly metals) offers a comparable number of tags, as available panels consist of close to 40 markers. 79 In this approach, cells are vaporized by a plasma into a cloud of elemental heavy ions, originating from tagged antibodies. Time-of-flight measurements allow the identification of each element present in the volatized material and their proportion. Mass cytometry can be used either in a configuration where single cells are directed to the plasma one by one, as in a FACS experiment, or with paraffin-embedded tissue sections, thereby also preserving spatial information.80,81 Each different element bound to an antibody thus behaves as a barcode, and the total number of possible codes is limited by the availability of pure isotopes that can be attached to these proteins. A technology that allows a combination of several isotopes on one antibody to create multiple codes has not been developed to date.
Conclusion
In this review, we have described many uses for barcodes to identify a variety of objects, from molecules to cells, or even samples. Barcoding offers solutions to many practical problems, including reducing research-associated costs. Moreover, the ability to multiplex allows correlations to be established between biological phenomena in a single run, that is, obviating the need for separate experiments. From a more academic point of view, although further extensive research is required, barcoding harbors great promise for encoding spatial information and for providing revolutionary methods of precise molecular quantification.
Two main tools are being investigated to barcode information: the use of synthetic DNA sequences and fluorescence. Although the former requires sequencing, and therefore sample destruction, DNA tags provide higher numbers of possible combinations, and hence more channels that can be simultaneously studied.
Several avenues remain to be explored more deeply. First, even though historically linked with barcode generation, fluorescence suffers from limitations in detection sensitivity. To address this, dyes with sharper excitation/emission need to be synthesized. Also, using colored microstructures to create color sequences that mimic DNA sequences greatly increases the number of barcodes that can be generated with the colors that can already be discriminated with the present technology. A complementary option is to use relative intensities of different dyes carried by these same microstructures. To further empower these two approaches, barcoded microstructures need to be miniaturized to permit their use in biological samples. Additionally, many groups are focused on creating new techniques to place barcodes on the target cell or structure, such as split and pool encoding, DNA ligation, and antibody or microstructure conjugation, each with its own advantages. More work on these approaches should generate new opportunities.
Finally, despite what may be popularly believed, single-cell sequencing techniques only provide means to explore the transcriptome of thousands of single cells, and indeed determining the sequence of a specific single cell chosen in its environment remains a challenge. A minor number of approaches are currently tackling this limitation and, once perfected, hold great promise for addressing long-standing biological questions where one cell is responsible for great changes, such as in organism development, tumor progression, or immunity.
Footnotes
Declaration of Conflicting Interests
The authors declared no potential conflicts of interest with respect to the research, authorship, and/or publication of this article.
Funding
The authors disclosed receipt of the following financial support for the research, authorship, and/or publication of this article: This work was supported by grants from the Natural Science and Engineering Research Council of Canada and Genome Canada/Genome Quebec to SC. SC holds a salary awards from the Fonds de Recherche du Québec–Santé.