
Abstract
We describe a custom Internet of Things (IoT) device used for tracking barcoded containers end to end in a high-throughput analysis and purification laboratory. Our IoT device fills an important gap that previously prevented us from fully tracking barcoded sample containers through manual steps in a multistep workflow, such as when samples are “parked” for temporary storage, or when using instrumentation not otherwise equipped with barcode scanners, a common occurrence found with specific centrifugal evaporation instruments. The custom device reads container barcodes and sends a small amount of data to our back-end data systems. Once data have been received and processed, users are alerted to any system responses via aural and visual feedback. Components of the IoT system include a low-cost headless IoT computer, a barcode reader, and a multicolor LED strip. We believe that the model for our device will facilitate simple and rapid deployment of IoT to the broader laboratory community. All source code and device configurations will be released into the public domain and made freely available.
Introduction
Tracking samples in the laboratory continues to be a daunting but necessary task. The first patent for the barcode filed in 1952 eventually led to the Universal Product Code (UPC) barcode, which has been in common use for decades. 1 Barcode technology quickly led to the invention of other methods of identification, including radiofrequency identification (RFID), optical character recognition (OCR), and magnetic stripes, among numerous others. According to a recent report reviewing trends in ID technologies in hospitals, barcodes continue to be the primary tracking identifier due to their low cost and proven reliability. 2 More than a decade ago, two-dimensional (2D) barcodes began entering the drug discovery space. 3 The small footprint and built-in accuracy of the open standard Data Matrix format 4 made the barcode amendable to small tubes. Eventually, this led to hardware that could simultaneously scan several tubes in a rack within a few seconds.5,6
The pharmaceutical drug discovery process necessitates employing ID sample tracking technologies such as 2D barcodes to ensure sample integrity, track samples as they progress through lengthy workflows, and reduce drug candidate lead times. In our own sample purification laboratory, numerous samples are submitted from the medicinal chemists on a daily basis throughout the day. Our laboratory has employed a lean process model where the purification staff may work staggered hours, including nights or weekends, in an effort to reduce purification times. 7 Our lean approach led us to pursue a “single-piece” workflow, where each sample can be processed individually from start to finish, combining the fractions generated during the purification step and drying the sample immediately. We investigated multiple drying alternatives and selected the Biotage V10 centrifugal evaporator, 8 which dries single samples in minutes versus the hours often required by batch drying. Our typical high-performance liquid chromatography (HPLC) fraction volumes, ranging from 1 to 20 mL, required a suitable container that matched vendor specifications. We chose a 30 mL screw neck EPA vial, which fits natively on the V10 without an adapter, and attached a 2D ceramic Data Matrix barcode on the bottom of the scintillation vial for sample tracking. We have been using this 2D-barcoded vial continuously for nearly 10 years.
Although the Biotage V10 meets the scientific and processing needs for sample evaporation, it is not natively equipped with a barcode scanner suitable for sample tracking. Additionally, the instrument firmware does not track sample metrics, such as the number of samples processed over time. Traditionally, in order to fill these needs, it would be necessary to purchase several stand-alone networked computers, attach barcode readers, and deploy in-house software. This would be costly and require precious laboratory space.
In an effort to meet our technical requirements and reduce cost and lab space, we developed an Internet of Things (IoT) device that provides a low-cost, simple, and robust system for reading and logging sample barcodes prior to placing the sample containers into the instrument’s sample queue.
In what follows, we describe the custom IoT device used for tracking these barcoded containers in our laboratory. Source code written in both the Python and Java programming languages is available for download. 9
Materials and Methods
System Components ( Fig. 1 )
Raspberry Pi 3 10
The Raspberry Pi (RPi) 3 Model B is a small, low-cost, single-board ARM quad processor computer bundled with on-board Wi-Fi, Bluetooth, Ethernet, and USB ports; HDMI; and audio-out. A micro SD card is used to store the operating system and applications.
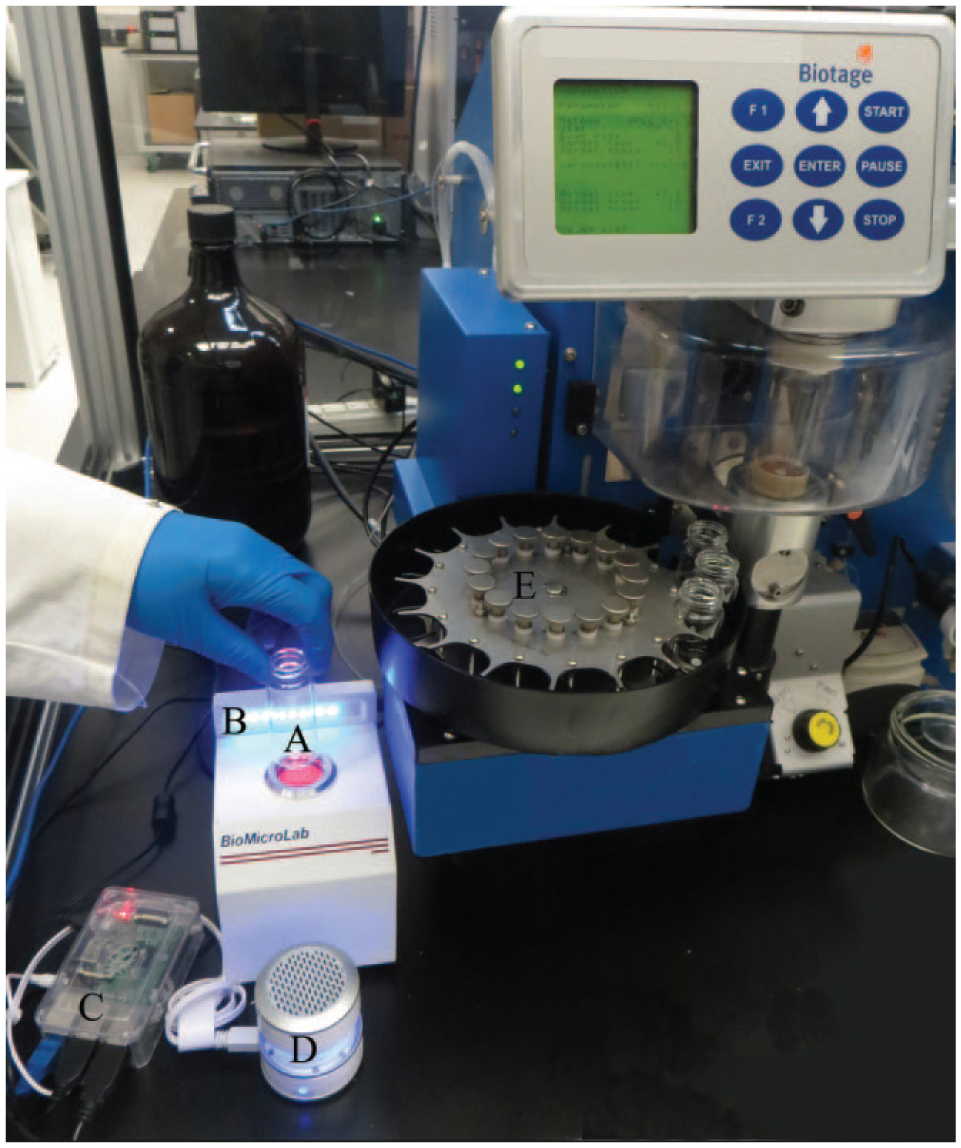
Custom IoT device. The Biotage V10 shown is not part of our system but is provided to give the reader a visual concept of the device in its laboratory setting. (
BioMicroLab SampleScan 2D Plus 11
The third-party BioMicroLab SampleScan 2D Plus 11 barcode scanner incorporates a Cognex Dataman 100M camera 12 and was selected because it was designed with a top-facing scanning port, which, according to the vendor, facilitates scanning 2D and linear barcodes found on laboratory tubes, vials, and plates. The diameter of the port conveniently matches the diameter of our 30 mL EPA-style vials. This allows the user to place the container directly on the scanning port without having to experiment with different distances and viewing angles. The camera has been precisely positioned by BioMicroLab, providing a fast, convenient, and accurate one-handed operation.
The camera may be preconfigured with the vendor’s setup utility. Several options are available, including choosing between USB keyboard wedge or serial port communications, and between trigger scan mode or continuous scan mode; setting the time interval before accepting the next scan; and preventing consecutive scans of the same barcode.
The entire process of scanning a vial, uploading data to our internal database, and receiving confirmation is completed in only a few seconds.
BlinkStick LED Strip 13
IoT devices are designed to communicate over a network. The RPi may be attached to a monitor via its HDMI port but is costly and requires precious lab space. We chose to implement simple visual and audio feedback similar to LEDs and alarms used on dashboards to alert the user of scanner status. Additionally, we wanted a plug-and-play device that offered simple application programming interfaces in several programming languages but that would be amenable to various automation projects.
The BlinkStick LED strip is a smart LED controller with integrated USB firmware. The strip includes eight individually controlled bright LEDs and an optional strip enclosure.
iHome iM59 Rechargeable Mini Speaker 14
Our criteria for purchasing speakers was that they be low cost and small, but powerful enough to be heard over typical laboratory noises, including vacuum pumps, instruments, and people. Currently available miniature speakers provide adequate amplification for home use but not in our noisy laboratory. We were able to address this problem by increasing the volume of our sound files.
TWD TradeWinds 30 mL EPA-Style Vial with Data Matrix 2D Barcodes 15
TradeWinds Inc. (Pleasant Prairie, WI) was chosen to be the supplier for our laser-etched ceramic Data Matrix 2D barcodes. The barcode located on the bottom of our vials makes it convenient to employ “bottom-read” single-tube and tube rack-style scanners.
Biotage V10 Centrifugal Evaporator
This evaporator allows rapid solvent evaporation from our 30 mL vials, which primarily contain purified samples from our preparative liquid chromatography. We have several of these instruments situated throughout our laboratory, each equipped with its own vial carousel. Vial barcodes are scanned by a laboratory scientist before being placed in the evaporator’s sample queue.
Software Installation Instructions
Raspbian Jessie Operating System
We suggest purchasing your first RPi 3 as part of a starter kit, which includes the RPi board, enclosure, power supply, and micro SD card with New Out of the Box Software (NOOBS) installed. NOOBS makes it easier for beginners to get up and running quickly. Plug in the micro SD card, connect the power supply, and select Raspbian as the operating system using the default settings. Alternatively, you may purchase your own micro SD card and follow the installation instructions found on the RPi Foundation’s website. 16
Dependency Modules
We selected the Python 3 programming language 17 to control our IoT device, although we also provide source code for an equivalent controller written in Java. 18 Python must be extended with modules that provide additional functionality not included as part of the default language distribution, such as an ability to communicate with USB devices. Additional modules utilized are as follows.
Our program posts scanned barcode data to a back-end web service. The web service encapsulates Structured Query Language (SQL) commands, simplifying consumer programming efforts. The posted data include no proprietary information—only the barcode, timestamp, and instrument ID—eliminating the need for encryption and reducing security risks. In the source code, we provide a simple web server implementing a service that inserts data into a local SQLite database.
Finally, if desired, it is necessary to install a suitable module for accessing a relational database. You may want to substitute your own solution.
To install these modules, open a terminal window and execute the following commands. Note that elevated privileges (superuser) are required to perform the installations. This is accomplished by preceding each command with sudo (
Please note that Raspbian Jessie is Linux based and therefore case sensitive. The commands given below must be typed exactly as shown. The commands for installing the dependency packages are as follows: sudo pip3 install blinkstick<enter> sudo pip3 install pygame<enter> sudo pip3 install pyserial<enter> sudo pip3 install pyusb<enter> sudo pip3 install requests<enter>
Sample Project Code
You may download the ControllerPython .zip file from our GitHub repository (https://github.com/russomf/IoT_controller) using the Raspbian Chromium web browser. Unzip the zip archive to the desktop using the Archiver application found under Raspberry Pi-Accessories-Archiver. You may also clone the repository using an appropriate git client. 24 The repository includes source code for both the Python 3 and Java versions of the controller.
Running the Application
Connecting the Hardware
Connect the USB cable for BioMicroLab scanner (or other serial port scanner) into one of the RPi USB ports.
Connect the USB cable supplied with the BlinkStick between another USB port on the RPi and the BlinkStick.
Connect an Ethernet cable between an available active Ethernet port and the Ethernet port of the RPi. Alternatively, Wi-Fi may be used. 25
Connect a USB keyboard and mouse to the remaining two ports on the RPi.
Plug an HDMI cable from your HDMI-enabled monitor to the RPi. Alternatively, you may install RealVNC, 26 which allows remote access from any computer on your network while freeing up the USB ports taken by the keyboard and mouse.
Lastly, plug in the RPi power adapter to the RPi and an available AC electrical outlet.
About 10 s after it is turned on the BioMicroLab scanner will start to blink continuously, indicating that the scanner is in continuous mode and ready to receive scans. You can purchase the scanner preconfigured from the manufacturer or follow their documentation for toggling between USB keyboard wedge mode and serial port mode. If you are properly connected to the Internet, the Ethernet LEDs will blink.
Running the Software
There are three important configuration steps required before testing your system: customizing the configuration file, starting the local web service, and launching the application.
The configuration Python script named systemParameters.py is part of the provided source code repository. It contains user-defined system parameters ( Fig. 2 ) such as the serial port settings, email server and target addresses, and path of the log files. It may be modified using one of the many editors included with the RPi Raspbian Lite GUI or by opening a terminal session and using the built-in “nano” editor, as follows.
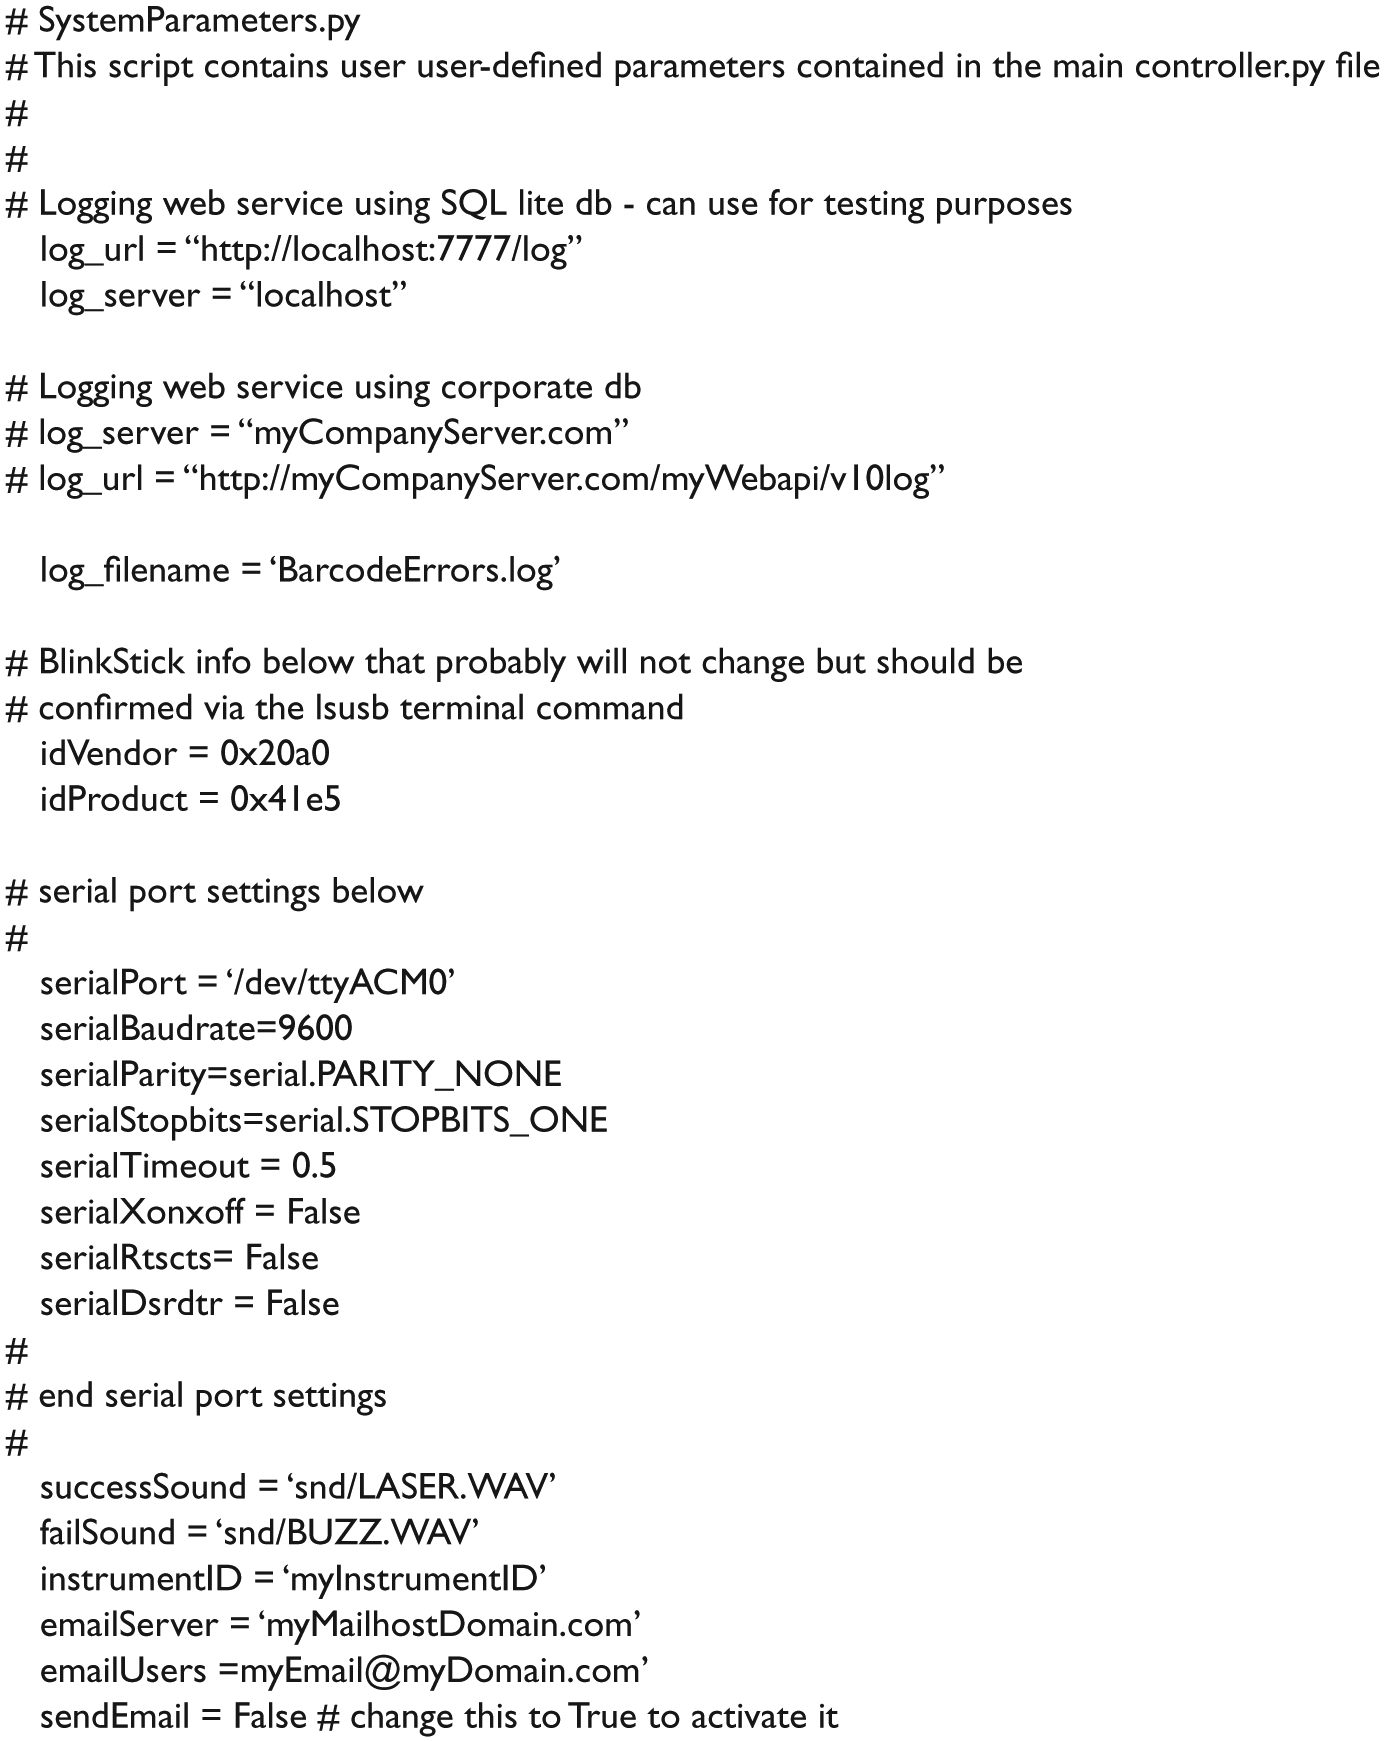
System configuration parameters.
At the terminal prompt, enter cd /home/pi/Desktop/ControllerPython<enter>
This navigates to the path of our Python scripts. Next, enter sudo nano systemParameters.py<enter>
to begin editing the script.
The emailServer and emailUsers must be set. The system parameters include two examples of mail systems with and without authentication. The sendEmail parameter must be changed from false to true to activate email notifications. Modify other items as necessary and press Ctrl-X Y and enter to save changes.
The second step starts the example web service with an SQLite database, which allows you to test the application. The web service is started by opening another terminal window and entering the following: sudo python3 dbserver.py<enter>
The server will start and wait for commands to be received from the controller.
The third step starts the controller itself. Open a new terminal window and enter the following: sudo python3 controller.py<enter>
If there are no errors at this point, the message “Controller started” will appear in the terminal window. The system is now ready to scan barcodes, provided that the BioMicroLab scanner is in the continuous operation mode with its LED blinking (about three times per second). A successful read will cause the BlinkStick to turn from blue to green and back to blue, and a ping sound will be played ( Table 1 ). To become familiar with the system and its error recovery procedures, it is recommended that you individually unplug the cables and observe the responses displayed on the terminal window and their corresponding audio and visual feedback. Reattaching the cables and rescanning will validate the error recovery routines. Details of the error recovery features are discussed later.
Custom IoT Device Audio Visual Alert States.
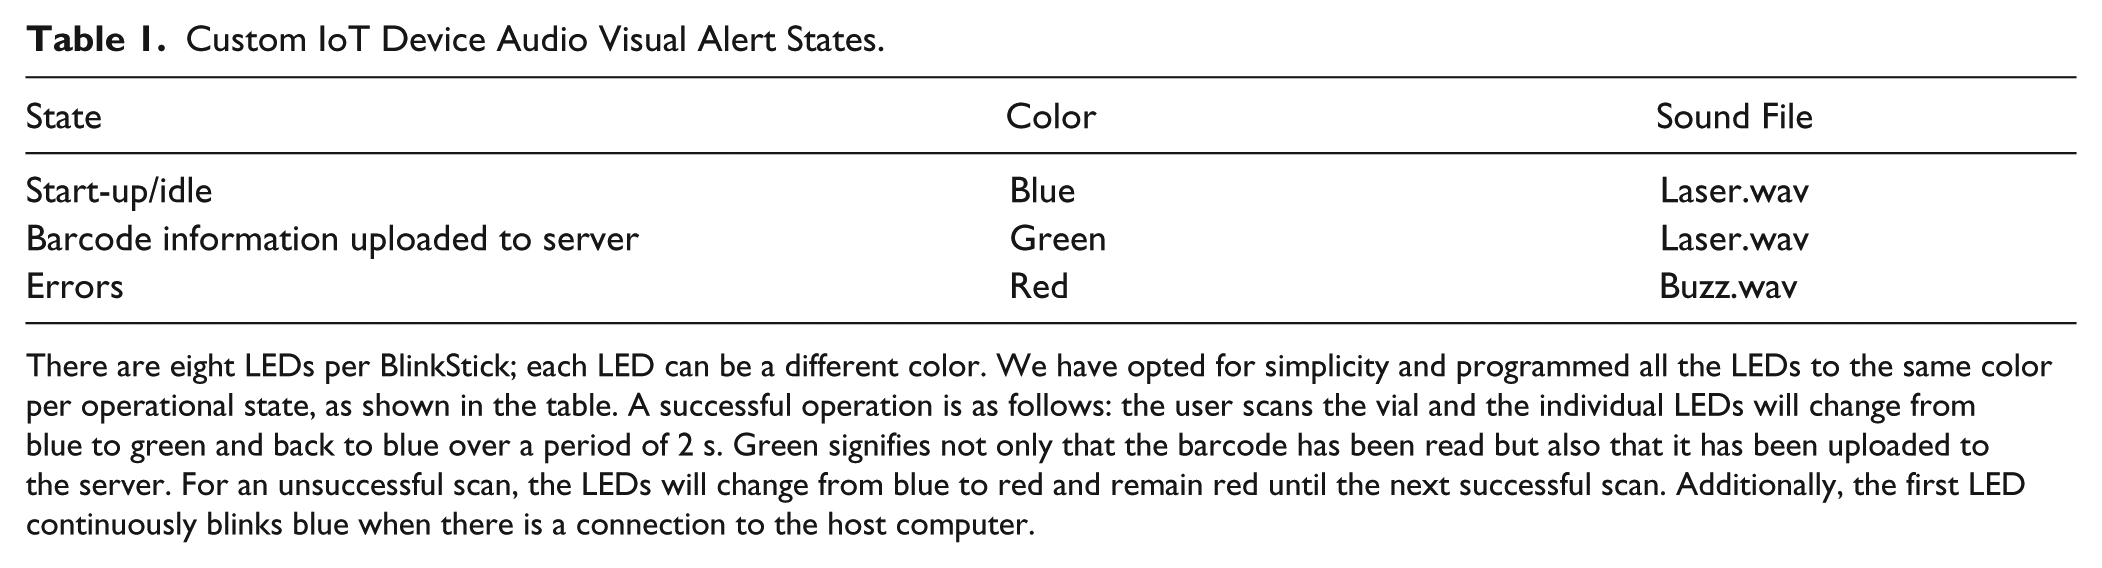
There are eight LEDs per BlinkStick; each LED can be a different color. We have opted for simplicity and programmed all the LEDs to the same color per operational state, as shown in the table. A successful operation is as follows: the user scans the vial and the individual LEDs will change from blue to green and back to blue over a period of 2 s. Green signifies not only that the barcode has been read but also that it has been uploaded to the server. For an unsuccessful scan, the LEDs will change from blue to red and remain red until the next successful scan. Additionally, the first LED continuously blinks blue when there is a connection to the host computer.
The final step is to verify that the local database has been updated, which can be performed by opening a terminal window and typing the following: sqlite3 log.sqlite<enter>
This will launch the sqlite3 database application. A sqlite prompt will appear waiting for a command. Sqlite3 uses the SQL commonly employed by most relational databases. Enter the following at the command prompt: select * from Event;<enter>
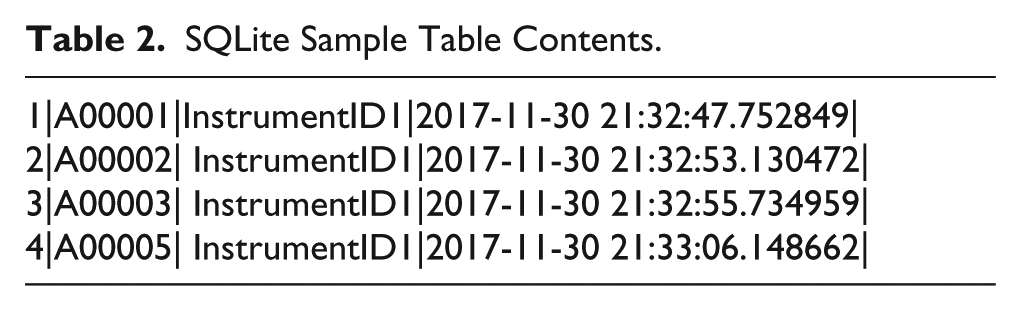
A list will appear showing the entire table contents ( Table 2 ).
SQLite Sample Table Contents.
Multiple Scanners/BlinkSticks
It is possible to connect multiple BlinkSticks and/or scanners to one RPi.
Modifications to the controller.py Python script are necessary to address a different serial port and/or BlinkStick. Each BlinkStick has a unique serial number and can be addressed by the serial number as explained on the vendor’s website. 16
If only one BioMicroLab scanner is plugged into the RPi, the default serial port name is dev/ttyACM0. The second scanner would be dev/ttyACM1. If using a scanner from another vendor that employs a 9-pin-to-USB converter cable, the first device’s serial port name is dev/ttyUSB0.
The terminal command to determine the serial port name of all the connected devices is as follows: ls /dev/tty*<enter>
Enter this command without the cable attached and record the response. Attach the cable and record the new entry. This will be the serial port name that you will place in the systemParameters.py file.
Placing the Application in Production Mode
It is important to test the system when connected to your local database on the RPi to verify that the system works as expected. Placing the system into production on your network requires a few configuration changes.
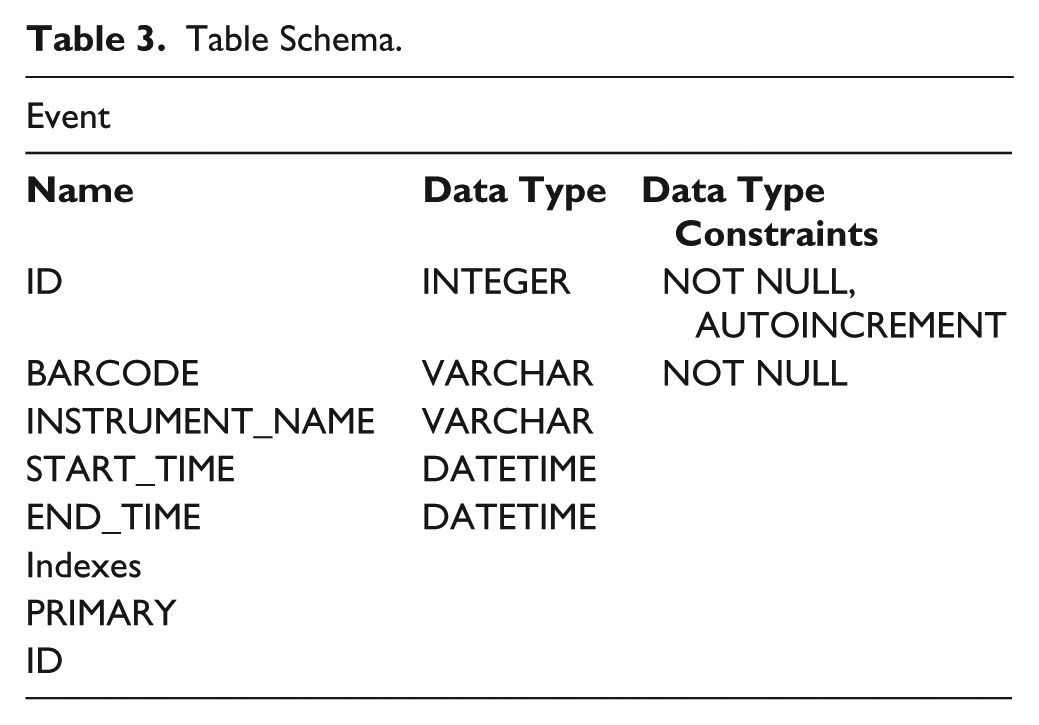
First, the systemParameters.py file must be modified with the appropriate mail server and application server domains. The web service must be created and the database table must be added to your relational database schema. Table 3 lists the table definitions that must be present in your database.
Table Schema.
Second, in the event of a power failure, you do not want to have to access the RPi via an LCD display or a Virtual Network Computing (VNC) application. It is preferable to have the application launch upon start-up. There are numerous ways to accomplish this task. We have found the following procedure recommended by the RPi organization to be straightforward. Open a terminal window and enter sudo nano /etc/rc.local<enter>
Add the following lines to the file, leaving the line “exit 0”: cd /home/pi/Desktop/ControllerPython sudo python3 controller.py &
As explained on the website,
27
if running an application that implements an infinite loop (such as ours), an ampersand must be included at the end of the command; otherwise, the script will not end and the RPi will not boot. The ampersand allows the command to run in a separate process in the background, conveniently allowing access to the RPi for other tasks, such as checking local logs while the process is running. The process can be stopped at any time by issuing the following commands at a terminal window: ps a <enter>
A list of processes will be displayed in the terminal window similar to Figure 3 . Take note of the process identifiers (PIDs) for all Python processes.
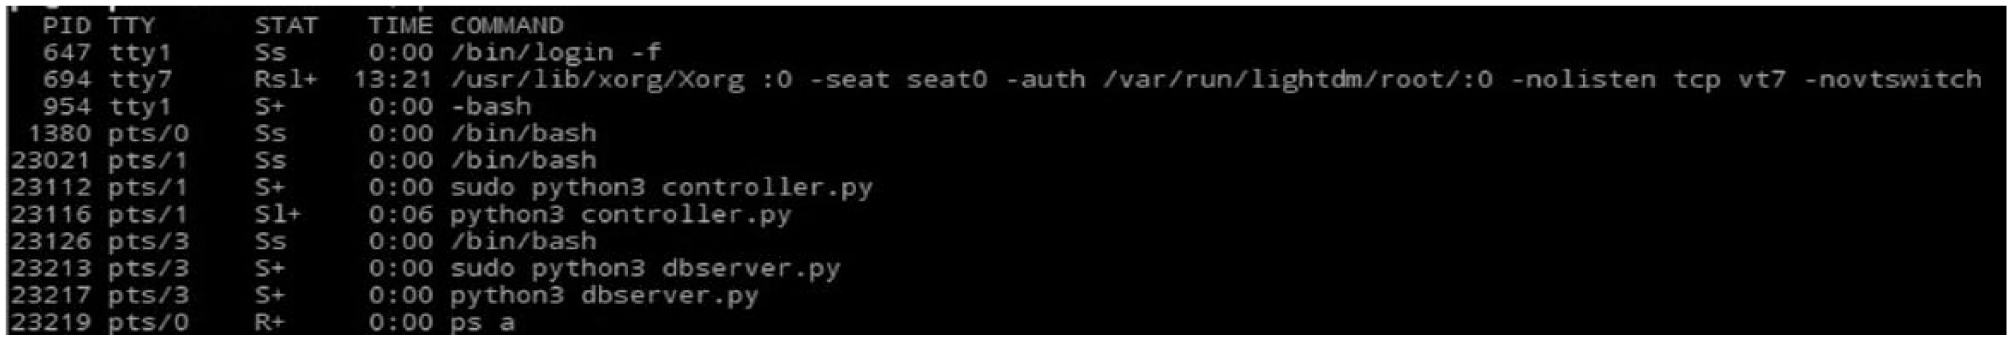
PID listings.
In our case, we have two Python processes running: one for the dbserver.py and one for our main controller.py application. We desire to stop both processes, which is accomplished by issuing the following commands: sudo kill 23116<enter> sudo kill 23213<enter>
This will kill the controller.py and dbserver.py processes, respectively. Make sure to substitute the appropriate PIDs assigned by your own system.
Results and Discussion
Python as the Programming Language
We chose Python as the programming language because of its widespread popularity on the RPi, and more broadly because it was the second most popular language of 2017. 28 Additionally, Python contains extensive learning resource materials and is an excellent programming language for beginners and expert developers alike. If you prefer to use Java as your programming language, for interested parties we 9 also have included in our GitHub repository a complete version of our IoT controller written in Java.
Alerting the User without an LED Monitor
Running an IoT device without an LCD display (also known as “running headless”) presents some challenges because detailed error messages cannot be displayed to the user. We must ensure that users have sufficient visual and audio feedback when barcode data fail to be captured by the web service in order that problems are observed and resolved quickly. If possible, the user should be able to fix problems independently without the need to rely on technical support personnel. Conditions that may cause an error include a broken scanner, disconnected USB or Ethernet cables, or a network communications failure, such as the web service being down.
We desired to provide user feedback without the use of an LCD monitor because it was an unnecessary expense and occupied valuable space in a laboratory filled with critical analytical instruments. Nevertheless, some form of simple feedback is necessary (pass/fail) to ensure proper operation. Furthermore, this feedback must be clearly seen or heard in a busy and noisy lab running several instruments simultaneously, each with their own competing alarm systems. We chose the BlinkStick as our primary visual feedback device because it is clearly visible, having very bright LEDs; it is low cost; and several software drivers on numerous operating systems and programming languages are available. For our audile device, we chose a small footprint speaker that plays sound files after an operation indicating success or failure. These files have been modified to elevate sound volume to make them more easily heard. 29
Programming Overview
The main Python script (controller.py) contains several functions. Specific functions are written for the initial start-up, controlling the BlinkStick, acquiring data, sending the data to the web service, and sending email.
The main function ( Fig. 4 ) implements an infinite loop that waits for data to be received from the serial port. The readBarcode function reads a barcode and invokes a second function that uploads barcode data to the web service. If any error occurs during this process, Python exceptions are raised and program control returns to the readBarcode function. Additionally, we have created several user-defined exceptions that provide simple, concise, and meaningful messages to the user.
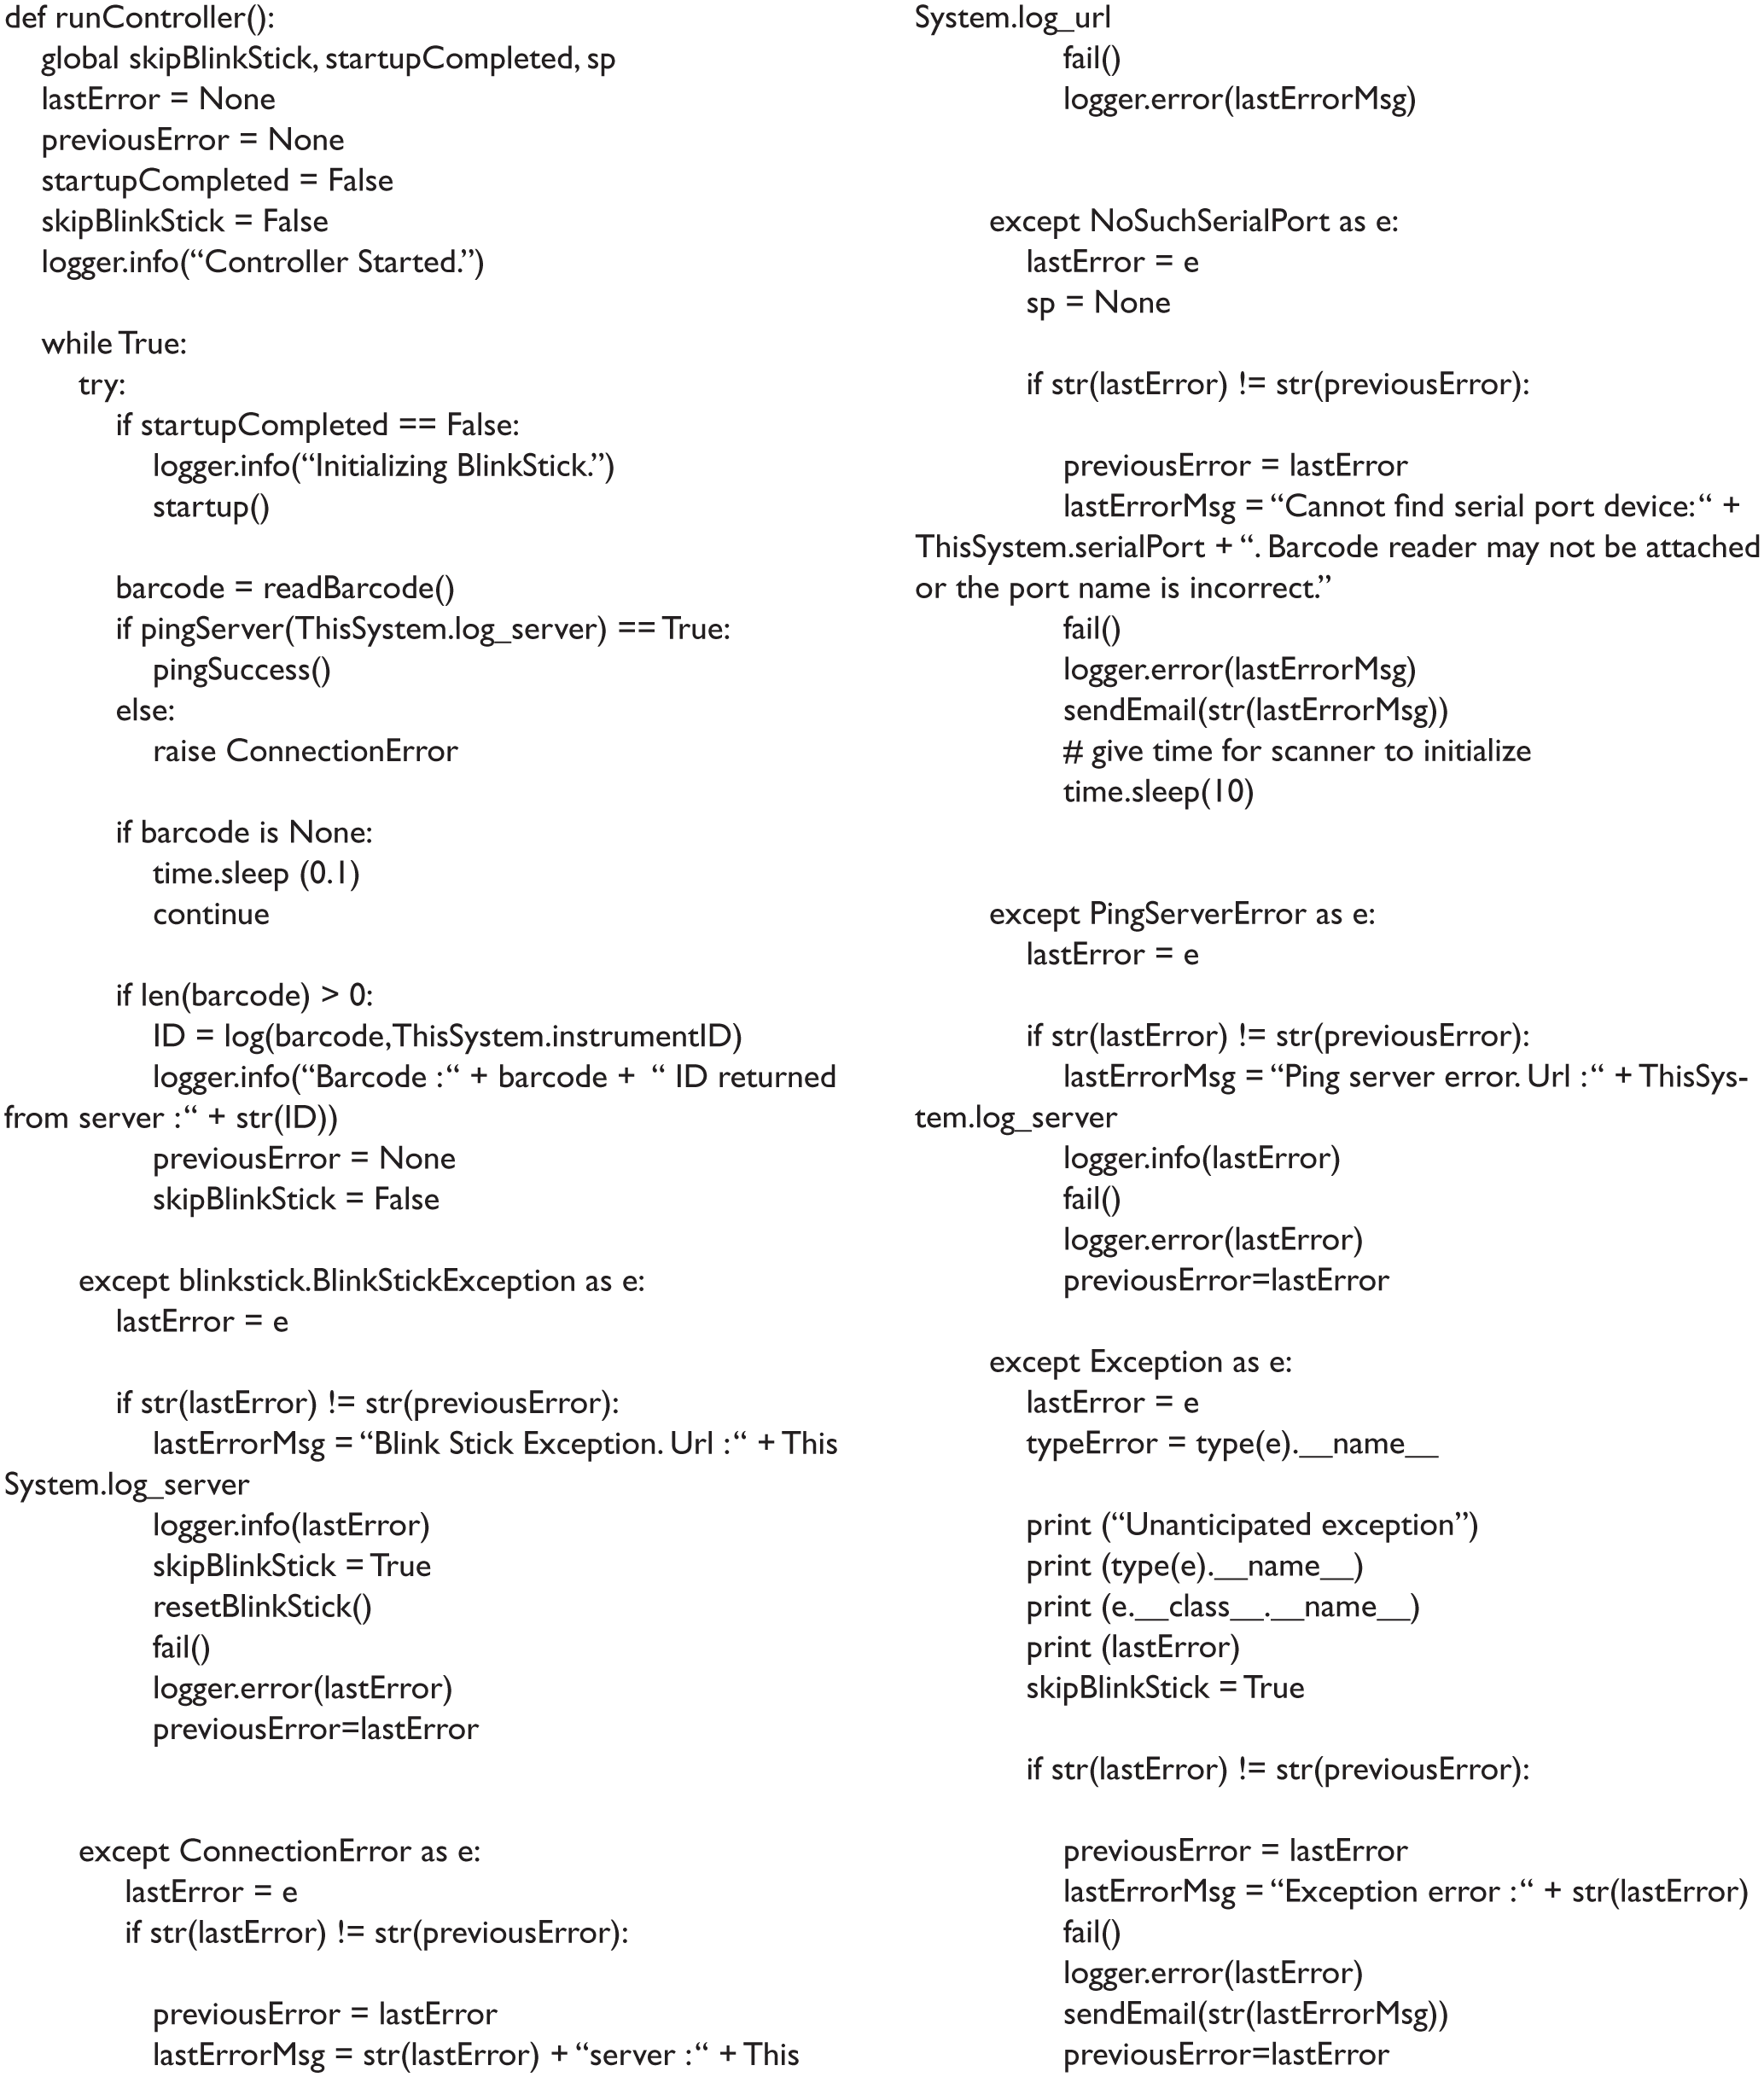
RunController function.
We identified common exception cases using negative path testing, which ensures that program flow is in accordance with requirements and that the program is able to handle gracefully any unwanted input or user behavior. 30 During program development, we systematically triggered all possible errors and observed the resulting exceptions. All other exceptions not predetermined by negative path testing raise built-in exceptions that are trapped with a top-level catchall exception handler.
Error handling routines alert the user through a BlinkStick color change and corresponding sound, all errors are logged to a text file, and optionally email messages are sent. The script waits for output from the scanner, and upon an error it alerts the user before recovering automatically once the problem has been resolved. For example, if the scanner cable was accidently unplugged, the user would be appropriately alerted to allow loose cables to be quickly checked and reconnected. In this case, the cable would be reattached, the user would wait until the scanner has been reinitialized (about 10 s), and a blinking LED from the camera would confirm continuous operation mode/system readiness. At this point, the user is free to resume scanning the vials. This automatic system recovery also works with an accidentally unplugged network or BlinkStick USB cable. We have experienced occasional USB port connection failures. In this case, the BlinkStick will reinitialize the USB port when encountering the communication error. We automatically run a dev.reset upon a BlinkStick error to reset the port without rebooting the RPi.
IoT Definition
The Institute of Electrical and Electronics Engineers (IEEE) defines the IoT as a network of items each embedded with sensors that are connected to the Internet. They have created a working document that states that IoT’s definition remains “fuzzy.” 31 Some define an IoT device as one that can “communicate with the network independently of human action.” 32 An example in the home would be the Nest Thermostat, 33 which sends data to your smartphone or tablet and can be viewed on the Internet. We adapt the former definition, where our barcode scanner/RPi is the IoT device and user action is required to scan barcodes.
Data Visualization and Analysis
Our purification workflow is shown in Figure 5 . For several years, we have employed sample tracking capabilities in our receipt/analysis, purification, and analysis steps. By adding barcode scanning capabilities to the evaporation step of our workflow, we now are able to track vials from beginning to end, throughout the entire process. This provides powerful metrics and lets us know exactly where each vial is in the lab at any moment. This is helpful, for example, when a scientist misroutes a vial or if our Biotage V10 inadvertently drops a vial and it rolls under the laboratory bench. Prior to the introduction of the scanning devices, searching for these out-of-workflow vials would consume critical scientist time, resulting in loss of value-added work. Now that the scanners are in place, we can focus our attention on more valuable activities.
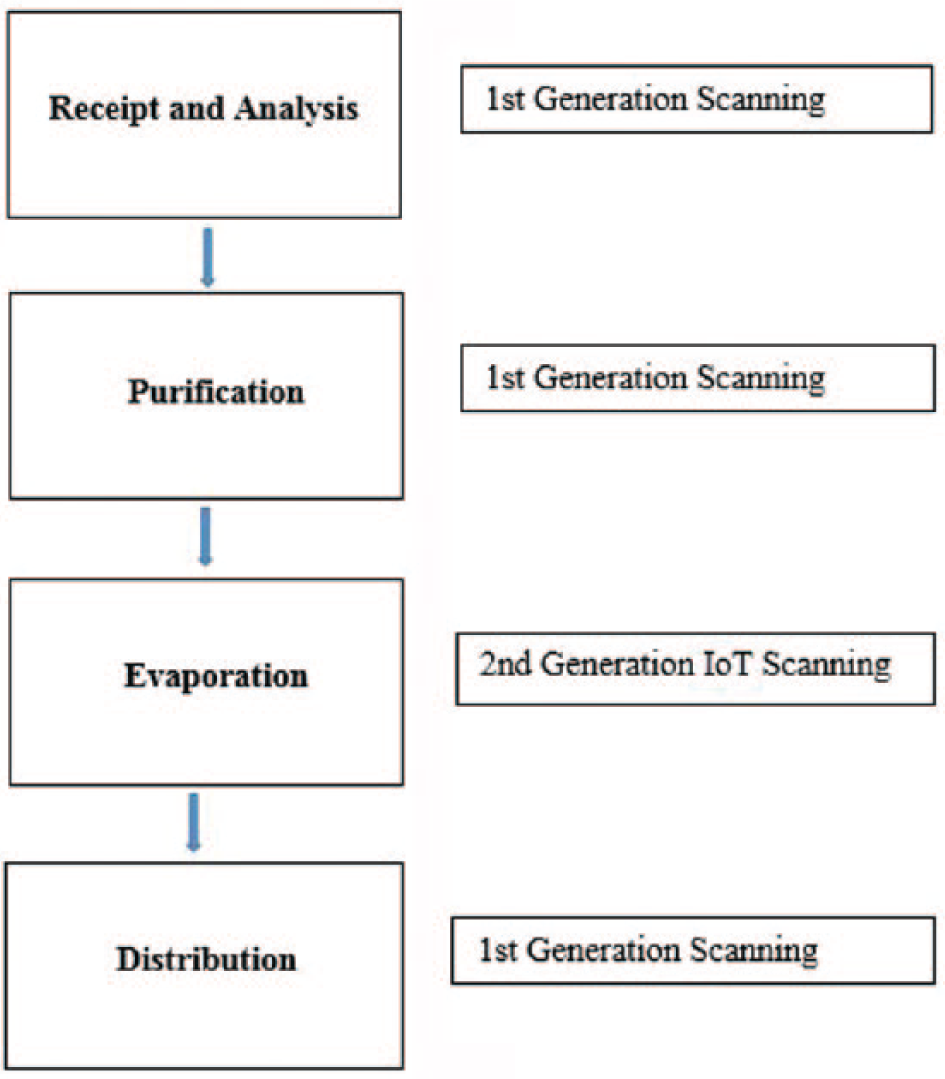
Sample purification workflow.
Interpretation of the data recorded by the barcode scanners was facilitated through either (1) direct SQL database queries to determine specific information concerning sample attributes or (2) the use of Spotfire Data Visualization and Analysis 34 to create visualizations representative of instrument activity. These representations allow the lab manager to evaluate inferred parameters such as instrument uptime, peak instrument utilization times, and in some cases, lab layout optimization. Figure 6 shows a graph of scans over time of 12 instruments that were connected to these scanners. Each thin purple line represents a recorded barcode scan, with closely spaced scans building up the thickness of each vertical line. Each row represents a unique instrument enabled with a scanning device. Moving from left to right follows the scans acquired over the time period shown below the graph. As an example of interpreting this graph, we can focus on V10_07 and observe that the instrument recorded no scans from mid-March through the end of that month. In this case, the gap represents downtime of the instrument while it was waiting for repair.
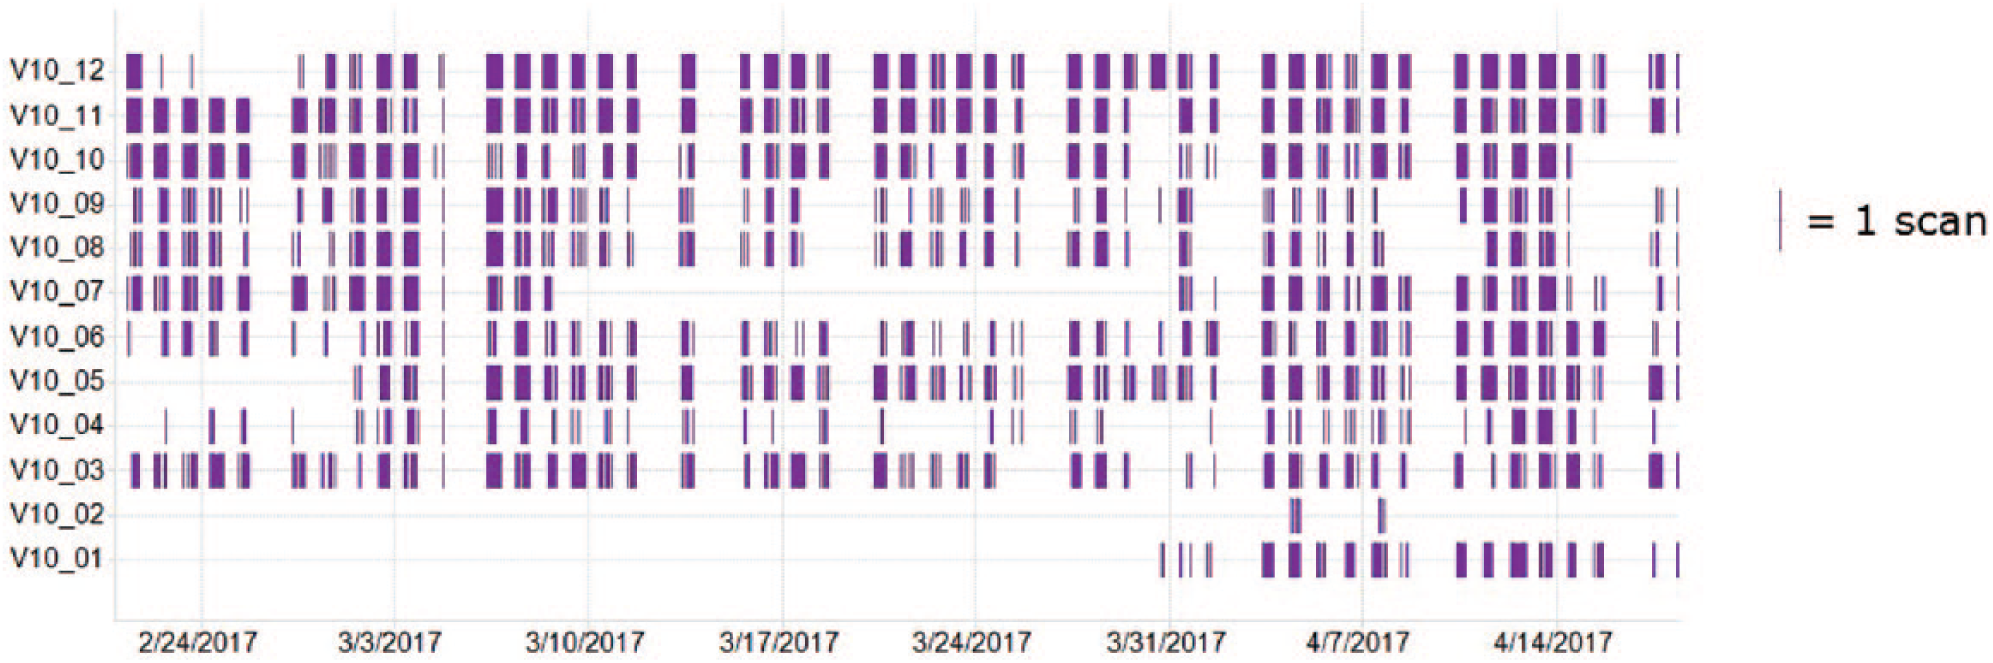
Visualization of recorded barcode scans.
While the need for instrument repair is communicated effectively in our lab and observing it on the usage visualizations is most helpful in a retrospective analysis, different causes of low utilization also may be detected by the same graphs. For instance, deeper analysis of the visualization could allow for identification of which instruments were preferred by lab scientists. The bottom two rows on the graph represent a pair of instruments that were co-located in the lab. Observing that neither of these two instruments had recorded a scan in a significant amount of time and that both were operational led to an investigation of why they were not being utilized. Evaluation of the circumstances led to the conclusion that they were not properly located in the lab to facilitate efficient incorporation into a high-throughput workflow as they were not easily accessed. More conveniently located instruments were utilized instead. Reorganization of these two instruments at the end of March led to an immediate increase in their usage and decreased overdependence on the other instruments in the fleet.
Assessing utilization of the entire fleet of V10 instruments and the total number of samples evaporated is accomplished by a time-dependent bar chart ( Fig. 7 ). The red bars represent the total count of barcode scans during a day, and the blue bars represent a count of unique barcodes that are scanned during the same period. Because more than one fraction tube may be combined into a single barcoded scintillation vial, counting unique barcodes allows for an approximate determination of the number of preparative purifications performed during that day. An ongoing count of evaporative cycles will be useful in determining the longevity of the V10 instruments themselves, which is useful in the life cycle management of lab equipment. Another critical outcome of analyzing usage is the determination of the right size of the fleet. This has had an important impact on investment and lab space utilization.
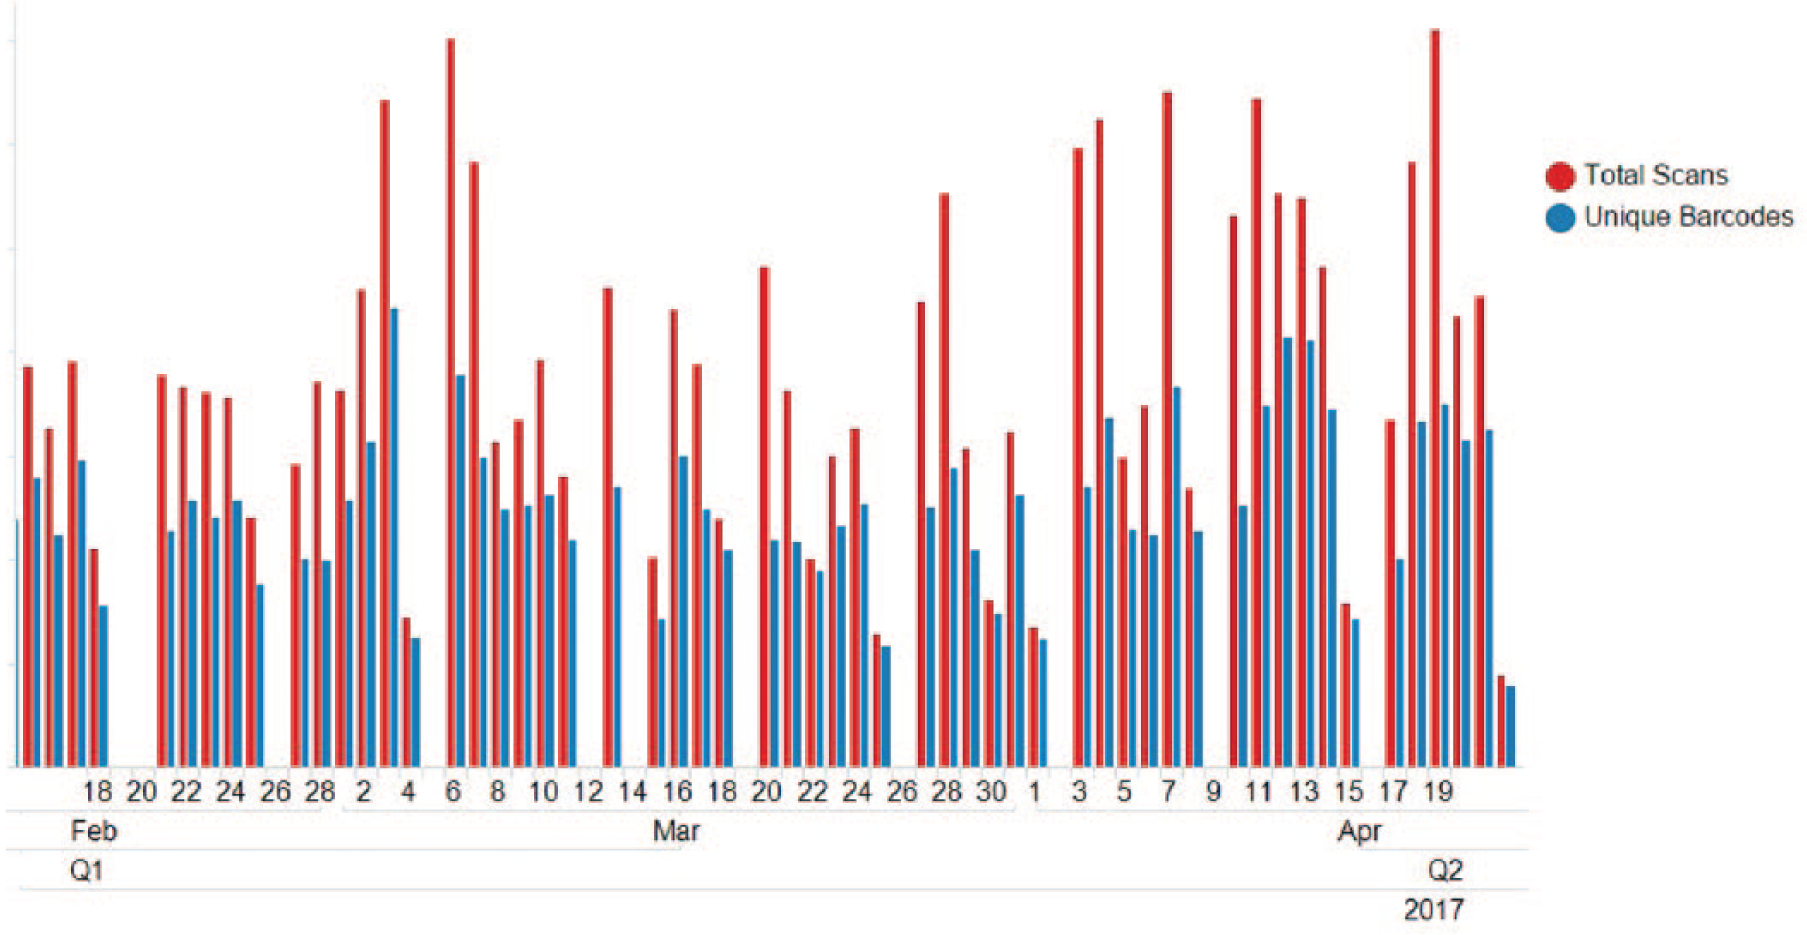
Total fleet barcode scans.
IoT Cost and Space Savings
There are many personal computers in our laboratory connected to various instruments (i.e., analytical and preparative HPLC instruments, nuclear magnetic resonance instruments, balances, etc.) requiring specialized vendor software and third-party applications for analyzing the data. Additionally, these instruments utilize laboratory bench space, which is often at a premium. The IoT project did not require specialized vendor software and the associated hardware and software overhead. A RPi 3 computer can be purchased for about US$50 and is about the size of three stacked smartphones. Consequently, the cost and laboratory space savings of implementing a headless IoT device compared with our “Tiny” 35 personal computers with 24-inch displays are 5- and 150-fold, respectively.
A low-cost custom IoT device has been built to communicate with a commercially available barcode scanner for tracking barcoded containers end to end. The system requires no graphical display, using off-the-shelf audio and visual hardware to indicate success or failure. The software used to drive the device includes Python modules provided by the open-source community. The system’s method of acquiring, storing, and displaying data works well on an IoT technology platform. We have used the interactive data visualization and mining tools to determine instrument usage and downtime, which provides information for determining optimal instrument location, service needs, and when to buy new and/or additional instruments. Future work may include direct instrument integration to determine cycle times, routing a sample to another instrument based on specific evaporation workflows, and additional projects for instrument monitoring.
Our source code and other information may be downloaded from GitHub. 9
Footnotes
Acknowledgements
The authors would like to thank Joe Nolfo for designing and fabricating the mounting bracket that was used to attach the BlinkStick to the BioMicroLab SampleScan 2D Plus.
Declaration of Conflicting Interests
The authors declared no potential conflicts of interest with respect to the research, authorship, and/or publication of this article.
Funding
The authors received no financial support for the research, authorship, and/or publication of this article.